Pay vs Performance Disclosure
|
12 Months Ended |
|
Dec. 31, 2025
USD ($)
|
Dec. 31, 2024
USD ($)
|
Dec. 31, 2023
USD ($)
|
Dec. 31, 2022
USD ($)
|
Dec. 31, 2021
USD ($)
|
| Pay vs Performance Disclosure |
|
|
|
|
|
| Pay vs Performance Disclosure, Table |
| | | | | | | | | | | | | | | | | | | | | | | | | | | | | | | | | | | | | | | | | | | | | | | | | | | | | | | | | | | | | | | | | Summary
Compensation Table
Total | | Compensation
Actually Paid | | | | | | Value of Initial Fixed $100
Investment Based On: | | | | | Fiscal Year(1) | | Prior PEO(2) ($) | | Current PEO(2) ($) | | Prior PEO ($) | | Current PEO ($) | | Average Summary Compensation Table Total for non-PEO NEOs(2) ($) | | Average
Compensation
Actually Paid
to non-PEO
NEOs
($) | | Total Shareholder Return(3) ($) | | Peer Group Total Shareholder Return(3) ($) | | Net Income
($ in
thousands) | | Revenue Growth (4) | | 2025 | | — | | | 1,210,795 | | | — | | | 7,482,274 | | | 4,086,766 | | | 2,400,276 | | | 113.22 | | | 253.38 | | | 259,262 | | | 15 | % | | 2024 | | 508,353 | | | 28,200,994 | | | (58,777,872) | | | 23,259,000 | | | 11,960,045 | | | 9,625,761 | | | 80.16 | | | 204.26 | | | 84,492 | | | 13 | % | | 2023 | | 1,044,885 | | | — | | | 29,952,755 | | | — | | | 11,964,892 | | | 12,112,489 | | | 86.33 | | | 149.52 | | | 19,409 | | | 20 | % | | 2022 | | 797,179 | | | — | | | (200,132,194) | | | — | | | 4,430,909 | | | (13,942,162) | | | 59.93 | | | 94.73 | | | (27,804) | | | 34 | % | | 2021 | | 82,536,062 | | | — | | | 293,335,312 | | | — | | | 7,774,582 | | | 13,883,786 | | | 189.01 | | | 131.92 | | | (19,503) | | | 35 | % |
|
|
|
|
|
| Company Selected Measure Name |
revenue growth
|
|
|
|
|
| Named Executive Officers, Footnote |
The PEO and non-PEO NEOs included in the above compensation table reflect the following: | | | | | | | | | | | | | | | | | | | | | | Year | | Prior PEO | | Current PEO | | Non-PEO NEOs | 2025 | | — | | Padmanabhan Srinivasan | | W. Matthew Steinfort, Lawrence D'Angelo, Bratin Saha | 2024 | | Yancey Spruill | | Padmanabhan Srinivasan | | W. Matthew Steinfort, Bratin Saha, Lawrence D'Angelo, Muhammad Aaqib Gadit | | 2023 | | Yancey Spruill | | — | | W. Matthew Steinfort, William Sorenson, Muhammad Aaqib Gadit, Gabriel Monroy, Megan Wood | | 2022 | | Yancey Spruill | | — | | William Sorenson, Carly Brantz, Jeffrey Guy, Gabriel Monroy | 2021 | | Yancey Spruill | | — | | Gabriel Monroy, Alan Shapiro |
|
|
|
|
|
| Peer Group Issuers, Footnote |
Peer Group TSR reflects the Company’s peer group (S&P Information Technology Index) used in the stock performance graph contained in our Annual Report. The values assume $100 was invested in each of our common stock and our peer group index at their respective closing prices on March 24, 2021 (the date our common stock commenced trading on the NYSE), including the reinvestment of dividends.
|
|
|
|
|
| Adjustment To PEO Compensation, Footnote |
In determining the compensation actually paid (“CAP”) to our PEO and our non-PEO NEOs, we deducted or added back the following amounts from or to the total amounts of compensation reported in the table above for the 2025 fiscal year. Grant date fair value represents the grant date fair value of equity-based awards granted in each year. Fair value adjustments reflect adjustments to the value of equity awards as calculated in accordance with the rules prescribed under Item 402(v) of Regulation S-K and in accordance with ASC Topic 718, which included the categories of adjustments as set forth below. The valuation assumptions used to calculate fair values did not materially differ from those disclosed at the time of grant. For additional information regarding the determination of fair value, see "Note 2. Summary of Significant Accounting Policies–Stock-Based Compensation" of the audited consolidated financial statements included in our Annual Report. | | | | | | | | | | | 2025 ($) | | PEO | | Current PEO | - Grant Date Fair Value of Option Awards and Stock Awards Granted in Fiscal Year | | — | + Fair Value at Fiscal Year-End of Outstanding and Unvested Option Awards and Stock Awards Granted in Fiscal Year | | — | +/- Change in Fair Value of Outstanding and Unvested Option Awards and Stock Awards Granted in Prior Fiscal Years | | 5,148,724 | + Fair Value at Vesting of Option Awards and Stock Awards Granted in Fiscal Year That Vested During Fiscal Year | | — | +/- Change in Fair Value as of Vesting Date of Option Awards and Stock Awards Granted in Prior Fiscal Years For Which Applicable Vesting Conditions Were Satisfied During Fiscal Year | | 1,122,755 | - Fair Value as of Prior Fiscal Year-End of Option Awards and Stock Awards Granted in Prior Fiscal Years That Failed to Meet Applicable Vesting Conditions During Fiscal Year | | — | Total Added (or Deducted) | | 6,271,479 |
| | | | | | | | | | Non-PEO NEOs | | 2025 ($) (Average) | - Grant Date Fair Value of Option Awards and Stock Awards Granted in Fiscal Year | | (3,299,392) | | + Fair Value at Fiscal Year-End of Outstanding and Unvested Option Awards and Stock Awards Granted in Fiscal Year | | 2,556,431 | | +/- Change in Fair Value of Outstanding and Unvested Option Awards and Stock Awards Granted in Prior Fiscal Years | | 1,461,673 | | + Fair Value at Vesting of Option Awards and Stock Awards Granted in Fiscal Year That Vested During Fiscal Year | | 191,969 | | +/- Change in Fair Value as of Vesting Date of Option Awards and Stock Awards Granted in Prior Fiscal Years For Which Applicable Vesting Conditions Were Satisfied During Fiscal Year | | 38,700 | | - Fair Value as of Prior Fiscal Year-End of Option Awards and Stock Awards Granted in Prior Fiscal Years That Failed to Meet Applicable Vesting Conditions During Fiscal Year | | (2,635,871) | | Total Added (or Deducted) | | (1,686,490) | |
|
|
|
|
|
| Non-PEO NEO Average Total Compensation Amount |
$ 4,086,766
|
$ 11,960,045
|
$ 11,964,892
|
$ 4,430,909
|
$ 7,774,582
|
| Non-PEO NEO Average Compensation Actually Paid Amount |
$ 2,400,276
|
9,625,761
|
12,112,489
|
(13,942,162)
|
13,883,786
|
| Adjustment to Non-PEO NEO Compensation Footnote |
In determining the compensation actually paid (“CAP”) to our PEO and our non-PEO NEOs, we deducted or added back the following amounts from or to the total amounts of compensation reported in the table above for the 2025 fiscal year. Grant date fair value represents the grant date fair value of equity-based awards granted in each year. Fair value adjustments reflect adjustments to the value of equity awards as calculated in accordance with the rules prescribed under Item 402(v) of Regulation S-K and in accordance with ASC Topic 718, which included the categories of adjustments as set forth below. The valuation assumptions used to calculate fair values did not materially differ from those disclosed at the time of grant. For additional information regarding the determination of fair value, see "Note 2. Summary of Significant Accounting Policies–Stock-Based Compensation" of the audited consolidated financial statements included in our Annual Report. | | | | | | | | | | | 2025 ($) | | PEO | | Current PEO | - Grant Date Fair Value of Option Awards and Stock Awards Granted in Fiscal Year | | — | + Fair Value at Fiscal Year-End of Outstanding and Unvested Option Awards and Stock Awards Granted in Fiscal Year | | — | +/- Change in Fair Value of Outstanding and Unvested Option Awards and Stock Awards Granted in Prior Fiscal Years | | 5,148,724 | + Fair Value at Vesting of Option Awards and Stock Awards Granted in Fiscal Year That Vested During Fiscal Year | | — | +/- Change in Fair Value as of Vesting Date of Option Awards and Stock Awards Granted in Prior Fiscal Years For Which Applicable Vesting Conditions Were Satisfied During Fiscal Year | | 1,122,755 | - Fair Value as of Prior Fiscal Year-End of Option Awards and Stock Awards Granted in Prior Fiscal Years That Failed to Meet Applicable Vesting Conditions During Fiscal Year | | — | Total Added (or Deducted) | | 6,271,479 |
| | | | | | | | | | Non-PEO NEOs | | 2025 ($) (Average) | - Grant Date Fair Value of Option Awards and Stock Awards Granted in Fiscal Year | | (3,299,392) | | + Fair Value at Fiscal Year-End of Outstanding and Unvested Option Awards and Stock Awards Granted in Fiscal Year | | 2,556,431 | | +/- Change in Fair Value of Outstanding and Unvested Option Awards and Stock Awards Granted in Prior Fiscal Years | | 1,461,673 | | + Fair Value at Vesting of Option Awards and Stock Awards Granted in Fiscal Year That Vested During Fiscal Year | | 191,969 | | +/- Change in Fair Value as of Vesting Date of Option Awards and Stock Awards Granted in Prior Fiscal Years For Which Applicable Vesting Conditions Were Satisfied During Fiscal Year | | 38,700 | | - Fair Value as of Prior Fiscal Year-End of Option Awards and Stock Awards Granted in Prior Fiscal Years That Failed to Meet Applicable Vesting Conditions During Fiscal Year | | (2,635,871) | | Total Added (or Deducted) | | (1,686,490) | |
|
|
|
|
|
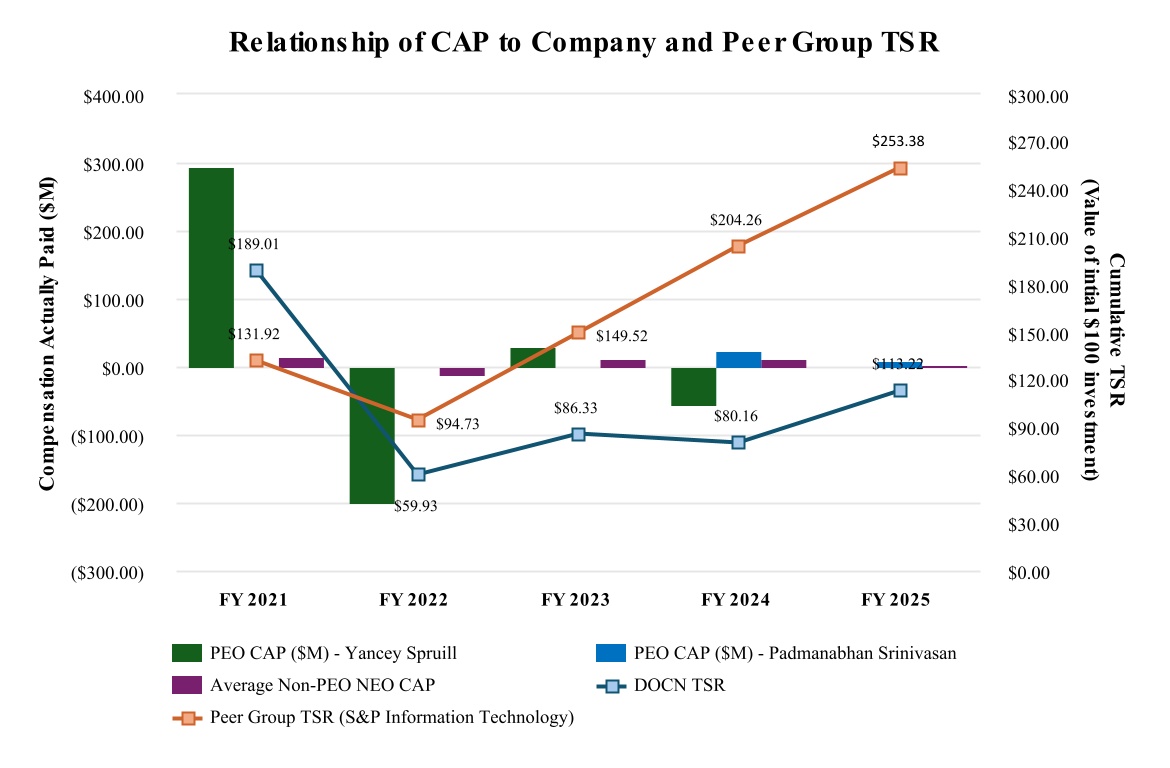
| Compensation Actually Paid vs. Total Shareholder Return |
|
|
|
|
|
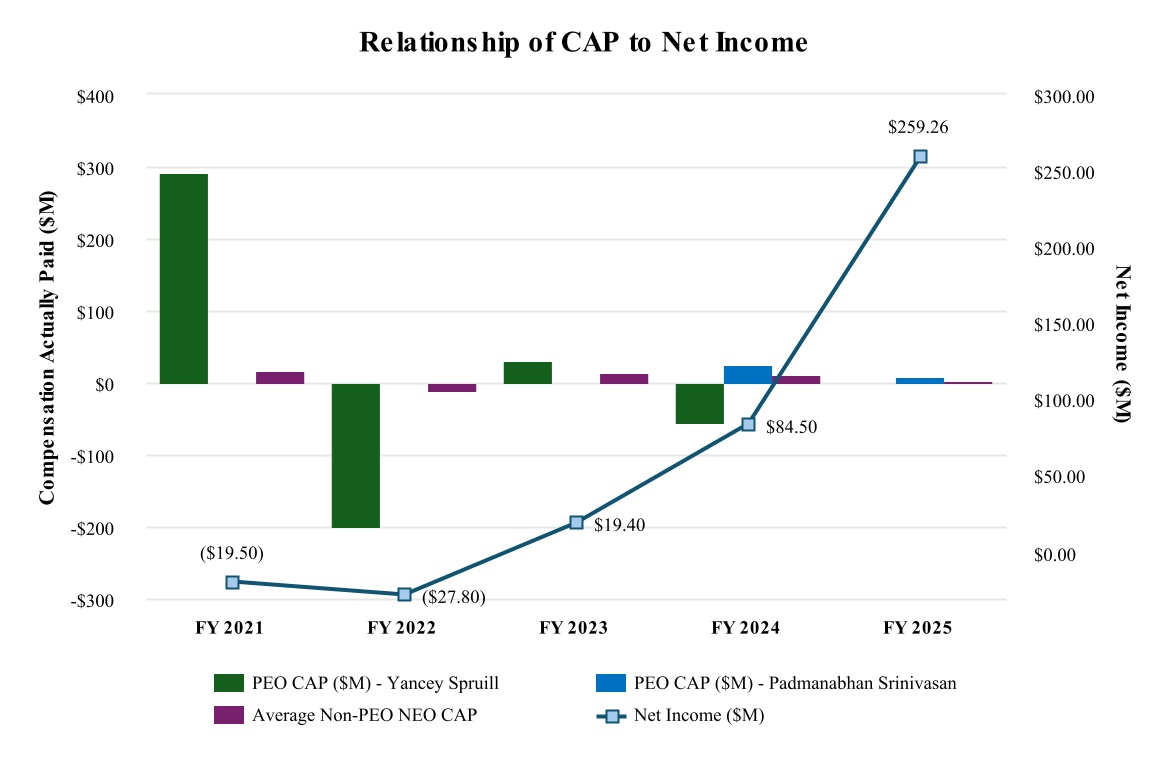
| Compensation Actually Paid vs. Net Income |
|
|
|
|
|
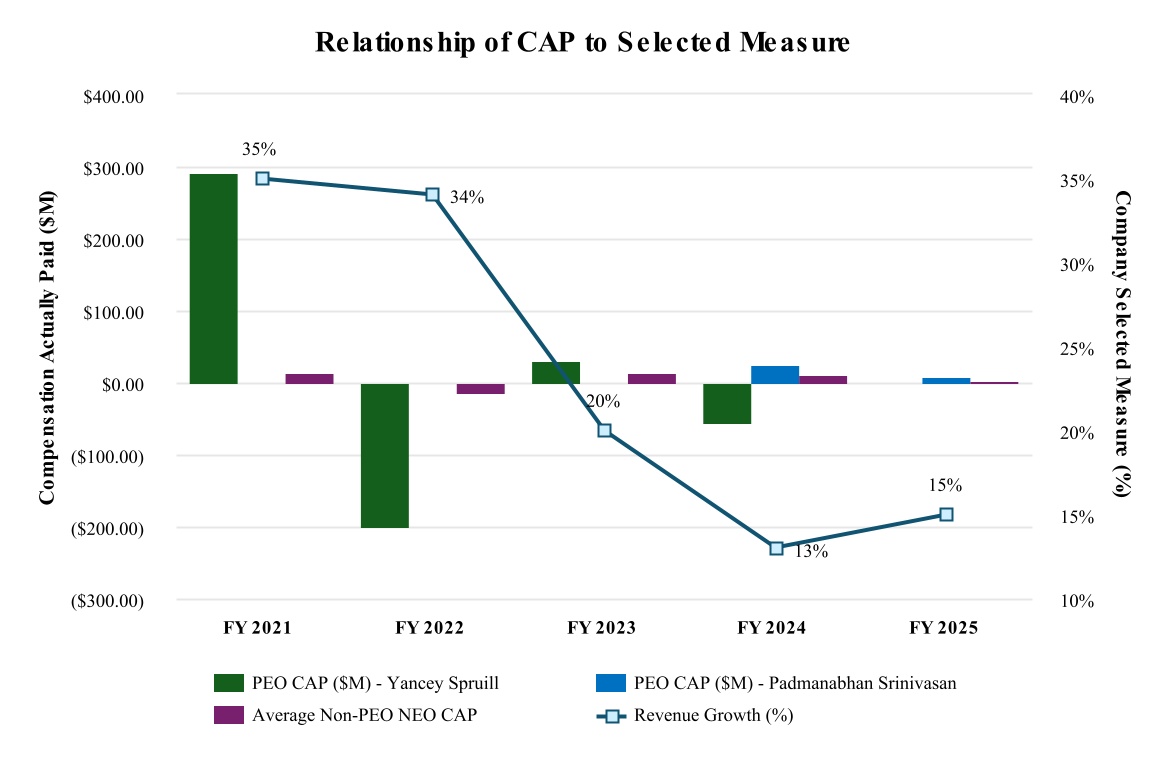
| Compensation Actually Paid vs. Company Selected Measure |
|
|
|
|
|
| Total Shareholder Return Vs Peer Group |
|
|
|
|
|
| Tabular List, Table |
| | | | Performance Measure | Revenue growth | | Adjusted free cash flow margin | Annual run-rate revenue |
|
|
|
|
|
| Total Shareholder Return Amount |
$ 113.22
|
80.16
|
86.33
|
59.93
|
189.01
|
| Peer Group Total Shareholder Return Amount |
253.38
|
204.26
|
149.52
|
94.73
|
131.92
|
| Net Income (Loss) |
$ 259,262,000
|
$ 84,492,000
|
$ 19,409,000
|
$ (27,804,000)
|
$ (19,503,000)
|
| Company Selected Measure Amount |
0.15
|
0.13
|
0.20
|
0.34
|
0.35
|
| Additional 402(v) Disclosure |
Represents GAAP revenue for the years indicated. In 2024, we changed our Company-Selected Measure from the sum of our revenue growth and adjusted free cash flow margin to revenue growth as described above. Accordingly, the Company-Selected Measure has been updated to show revenue growth for 2023, 2022 and 2021.Amount shown reflects restated net income as reflected in our restated consolidated financial statements for the fiscal year ended December 31, 2022.
|
|
|
|
|
| Measure:: 1 |
|
|
|
|
|
| Pay vs Performance Disclosure |
|
|
|
|
|
| Name |
Revenue growth
|
|
|
|
|
| Measure:: 2 |
|
|
|
|
|
| Pay vs Performance Disclosure |
|
|
|
|
|
| Name |
Adjusted free cash flow margin
|
|
|
|
|
| Measure:: 3 |
|
|
|
|
|
| Pay vs Performance Disclosure |
|
|
|
|
|
| Name |
Annual run-rate revenue
|
|
|
|
|
| Padmanabhan Srinivasan [Member] |
|
|
|
|
|
| Pay vs Performance Disclosure |
|
|
|
|
|
| PEO Total Compensation Amount |
$ 1,210,795
|
$ 28,200,994
|
|
|
|
| PEO Actually Paid Compensation Amount |
$ 7,482,274
|
$ 23,259,000
|
|
|
|
| PEO Name |
Padmanabhan Srinivasan
|
Padmanabhan Srinivasan
|
|
|
|
| Yancey Spruill [Member] |
|
|
|
|
|
| Pay vs Performance Disclosure |
|
|
|
|
|
| PEO Total Compensation Amount |
|
$ 508,353
|
$ 1,044,885
|
$ 797,179
|
$ 82,536,062
|
| PEO Actually Paid Compensation Amount |
|
$ (58,777,872)
|
$ 29,952,755
|
$ (200,132,194)
|
$ 293,335,312
|
| PEO Name |
|
Yancey Spruill
|
Yancey Spruill
|
Yancey Spruill
|
Yancey Spruill
|
| PEO |
|
|
|
|
|
| Pay vs Performance Disclosure |
|
|
|
|
|
| Adjustment to Compensation, Amount |
$ 6,271,479
|
|
|
|
|
| PEO | Aggregate Grant Date Fair Value of Equity Award Amounts Reported in Summary Compensation Table |
|
|
|
|
|
| Pay vs Performance Disclosure |
|
|
|
|
|
| Adjustment to Compensation, Amount |
0
|
|
|
|
|
| PEO | Year-end Fair Value of Equity Awards Granted in Covered Year that are Outstanding and Unvested |
|
|
|
|
|
| Pay vs Performance Disclosure |
|
|
|
|
|
| Adjustment to Compensation, Amount |
0
|
|
|
|
|
| PEO | Year-over-Year Change in Fair Value of Equity Awards Granted in Prior Years That are Outstanding and Unvested |
|
|
|
|
|
| Pay vs Performance Disclosure |
|
|
|
|
|
| Adjustment to Compensation, Amount |
5,148,724
|
|
|
|
|
| PEO | Vesting Date Fair Value of Equity Awards Granted and Vested in Covered Year |
|
|
|
|
|
| Pay vs Performance Disclosure |
|
|
|
|
|
| Adjustment to Compensation, Amount |
0
|
|
|
|
|
| PEO | Change in Fair Value as of Vesting Date of Prior Year Equity Awards Vested in Covered Year |
|
|
|
|
|
| Pay vs Performance Disclosure |
|
|
|
|
|
| Adjustment to Compensation, Amount |
1,122,755
|
|
|
|
|
| PEO | Prior Year End Fair Value of Equity Awards Granted in Any Prior Year that Fail to Meet Applicable Vesting Conditions During Covered Year |
|
|
|
|
|
| Pay vs Performance Disclosure |
|
|
|
|
|
| Adjustment to Compensation, Amount |
0
|
|
|
|
|
| Non-PEO NEO |
|
|
|
|
|
| Pay vs Performance Disclosure |
|
|
|
|
|
| Adjustment to Compensation, Amount |
(1,686,490)
|
|
|
|
|
| Non-PEO NEO | Aggregate Grant Date Fair Value of Equity Award Amounts Reported in Summary Compensation Table |
|
|
|
|
|
| Pay vs Performance Disclosure |
|
|
|
|
|
| Adjustment to Compensation, Amount |
(3,299,392)
|
|
|
|
|
| Non-PEO NEO | Year-end Fair Value of Equity Awards Granted in Covered Year that are Outstanding and Unvested |
|
|
|
|
|
| Pay vs Performance Disclosure |
|
|
|
|
|
| Adjustment to Compensation, Amount |
2,556,431
|
|
|
|
|
| Non-PEO NEO | Year-over-Year Change in Fair Value of Equity Awards Granted in Prior Years That are Outstanding and Unvested |
|
|
|
|
|
| Pay vs Performance Disclosure |
|
|
|
|
|
| Adjustment to Compensation, Amount |
1,461,673
|
|
|
|
|
| Non-PEO NEO | Vesting Date Fair Value of Equity Awards Granted and Vested in Covered Year |
|
|
|
|
|
| Pay vs Performance Disclosure |
|
|
|
|
|
| Adjustment to Compensation, Amount |
191,969
|
|
|
|
|
| Non-PEO NEO | Change in Fair Value as of Vesting Date of Prior Year Equity Awards Vested in Covered Year |
|
|
|
|
|
| Pay vs Performance Disclosure |
|
|
|
|
|
| Adjustment to Compensation, Amount |
38,700
|
|
|
|
|
| Non-PEO NEO | Prior Year End Fair Value of Equity Awards Granted in Any Prior Year that Fail to Meet Applicable Vesting Conditions During Covered Year |
|
|
|
|
|
| Pay vs Performance Disclosure |
|
|
|
|
|
| Adjustment to Compensation, Amount |
$ (2,635,871)
|
|
|
|
|