Performance Management |
Dec. 31, 2025 |
||||||||||||||||||||||||
|---|---|---|---|---|---|---|---|---|---|---|---|---|---|---|---|---|---|---|---|---|---|---|---|---|---|
| Kennedy Capital ESG SMID Cap Fund | |||||||||||||||||||||||||
| Prospectus [Line Items] | |||||||||||||||||||||||||
| Bar Chart and Performance Table [Heading] | Performance | ||||||||||||||||||||||||
| Performance Narrative [Text Block] | The bar chart and table below provide some indication of the risks of investing in the Fund by showing changes in the Fund’s performance from year to year for Institutional Class shares and by showing how the average annual total returns of each class of the Fund compare with the average annual total returns of the Russell 3000 Index, the Fund’s primary broad-based securities market index, and the Russell 2500 Index, which the Advisor believes is a better performance benchmark for comparison to the Fund’s performance in light of the Fund’s investment strategies. Performance for classes other than those shown may vary from the performance shown to the extent the expenses for those classes differ. Updated performance information is available at the Fund’s website, www.kennedycapital.com, or by calling the Fund at 1-877-882-8825. The Fund’s past performance, before and after taxes, is not necessarily an indication of how the Fund will perform in the future. |
||||||||||||||||||||||||
| Performance Past Does Not Indicate Future [Text] | The Fund’s past performance, before and after taxes, is not necessarily an indication of how the Fund will perform in the future. | ||||||||||||||||||||||||
| Performance Information Illustrates Variability of Returns [Text] | The bar chart and table below provide some indication of the risks of investing in the Fund by showing changes in the Fund’s performance from year to year for Institutional Class shares and by showing how the average annual total returns of each class of the Fund compare with the average annual total returns of the Russell 3000 Index, the Fund’s primary broad-based securities market index, and the Russell 2500 Index, which the Advisor believes is a better performance benchmark for comparison to the Fund’s performance in light of the Fund’s investment strategies. | ||||||||||||||||||||||||
| Bar Chart [Heading] | Calendar-Year Total Return (before taxes) Institutional Class Shares For each calendar year at NAV | ||||||||||||||||||||||||
| Bar Chart [Table] |
|
||||||||||||||||||||||||
| Bar Chart Closing [Text Block] | 
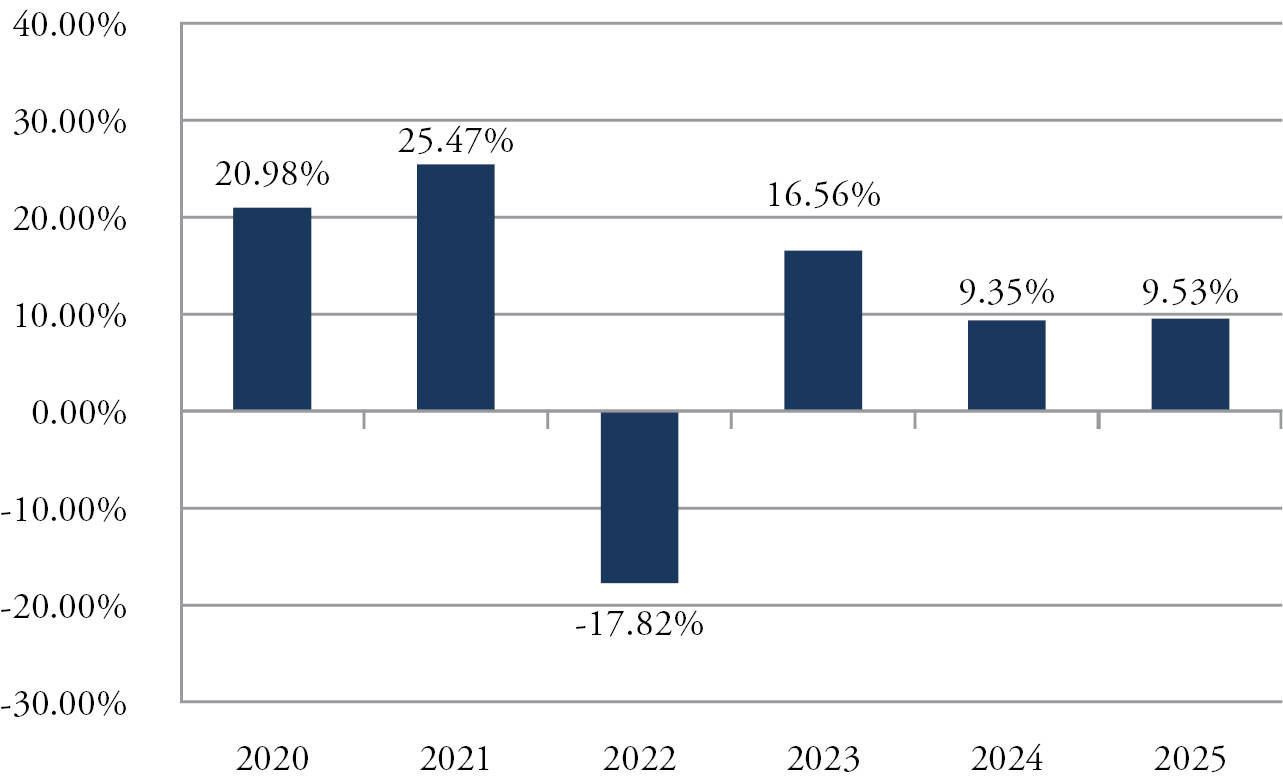
The year-to-date return as of March 31, 2026 was 1.68%.
|
||||||||||||||||||||||||
| Year to Date Return, Label [Optional Text] | year-to-date return | ||||||||||||||||||||||||
| Bar Chart, Year to Date Return | 1.68% | ||||||||||||||||||||||||
| Bar Chart, Year to Date Return, Date | Mar. 31, 2026 | ||||||||||||||||||||||||
| Highest Quarterly Return, Label [Optional Text] | Highest Calendar Quarter Return at NAV | ||||||||||||||||||||||||
| Highest Quarterly Return | 27.93% | ||||||||||||||||||||||||
| Highest Quarterly Return, Date | Dec. 31, 2020 | ||||||||||||||||||||||||
| Lowest Quarterly Return, Label [Optional Text] | Lowest Calendar Quarter Return at NAV | ||||||||||||||||||||||||
| Lowest Quarterly Return | (27.72%) | ||||||||||||||||||||||||
| Lowest Quarterly Return, Date | Mar. 31, 2020 | ||||||||||||||||||||||||
| Performance Table Heading | Average Annual Total Returns (for periods ended December 31, 2025) | ||||||||||||||||||||||||
| Performance Table Uses Highest Federal Rate | After-tax returns are calculated using the historical highest individual federal marginal income tax rates and do not reflect the impact of state and local taxes. | ||||||||||||||||||||||||
| Performance Table Not Relevant to Tax Deferred | After-tax returns shown are not relevant to investors who hold their Fund shares through tax-deferred arrangements, such as 401(k) plans or individual retirement accounts. | ||||||||||||||||||||||||
| Performance [Table] |
* After-tax returns are calculated using the historical highest individual federal marginal income tax rates and do not reflect the impact of state and local taxes. Actual after-tax returns depend on an investor’s tax situation and may differ from those shown. After-tax returns shown are not relevant to investors who hold their Fund shares through tax-deferred arrangements, such as 401(k) plans or individual retirement accounts. |
||||||||||||||||||||||||
| Index No Deduction for Fees, Expenses, or Taxes [Text] | reflects no deductions for fees, expenses or taxes | ||||||||||||||||||||||||
| Performance Availability Website Address [Text] | www.kennedycapital.com | ||||||||||||||||||||||||
| Performance Availability Phone [Text] | 1-877-882-8825 | ||||||||||||||||||||||||
| KENNEDY CAPITAL SMALL CAP GROWTH FUND | |||||||||||||||||||||||||
| Prospectus [Line Items] | |||||||||||||||||||||||||
| Bar Chart and Performance Table [Heading] | Performance | ||||||||||||||||||||||||
| Performance Narrative [Text Block] | The bar chart and table below provide some indication of the risks of investing in the Fund by showing changes in the Fund’s performance from year to year for Institutional Class shares and by showing how the average annual total returns of each class of the Fund compare with the average annual total returns of the Russell 3000 Index, the Fund’s primary broad-based securities market index, and the Russell 2000 Growth Index, which the Advisor believes is a better performance benchmark for comparison to the Fund’s performance in light of the Fund’s investment strategies. Performance for classes other than those shown may vary from the performance shown to the extent the expenses for those classes differ. Updated performance information is available at the Fund’s website, www.kennedycapital.com, or by calling the Fund at 1-877-882-8825. The Fund’s past performance, before and after taxes, is not necessarily an indication of how the Fund will perform in the future. |
||||||||||||||||||||||||
| Performance Past Does Not Indicate Future [Text] | The Fund’s past performance, before and after taxes, is not necessarily an indication of how the Fund will perform in the future. | ||||||||||||||||||||||||
| Performance Information Illustrates Variability of Returns [Text] | The bar chart and table below provide some indication of the risks of investing in the Fund by showing changes in the Fund’s performance from year to year for Institutional Class shares and by showing how the average annual total returns of each class of the Fund compare with the average annual total returns of the Russell 3000 Index, the Fund’s primary broad-based securities market index, and the Russell 2000 Growth Index, which the Advisor believes is a better performance benchmark for comparison to the Fund’s performance in light of the Fund’s investment strategies. | ||||||||||||||||||||||||
| Bar Chart [Heading] | Calendar-Year Total Return (before taxes) Institutional Class Shares For each calendar year at NAV | ||||||||||||||||||||||||
| Bar Chart [Table] |
|
||||||||||||||||||||||||
| Bar Chart Closing [Text Block] | 
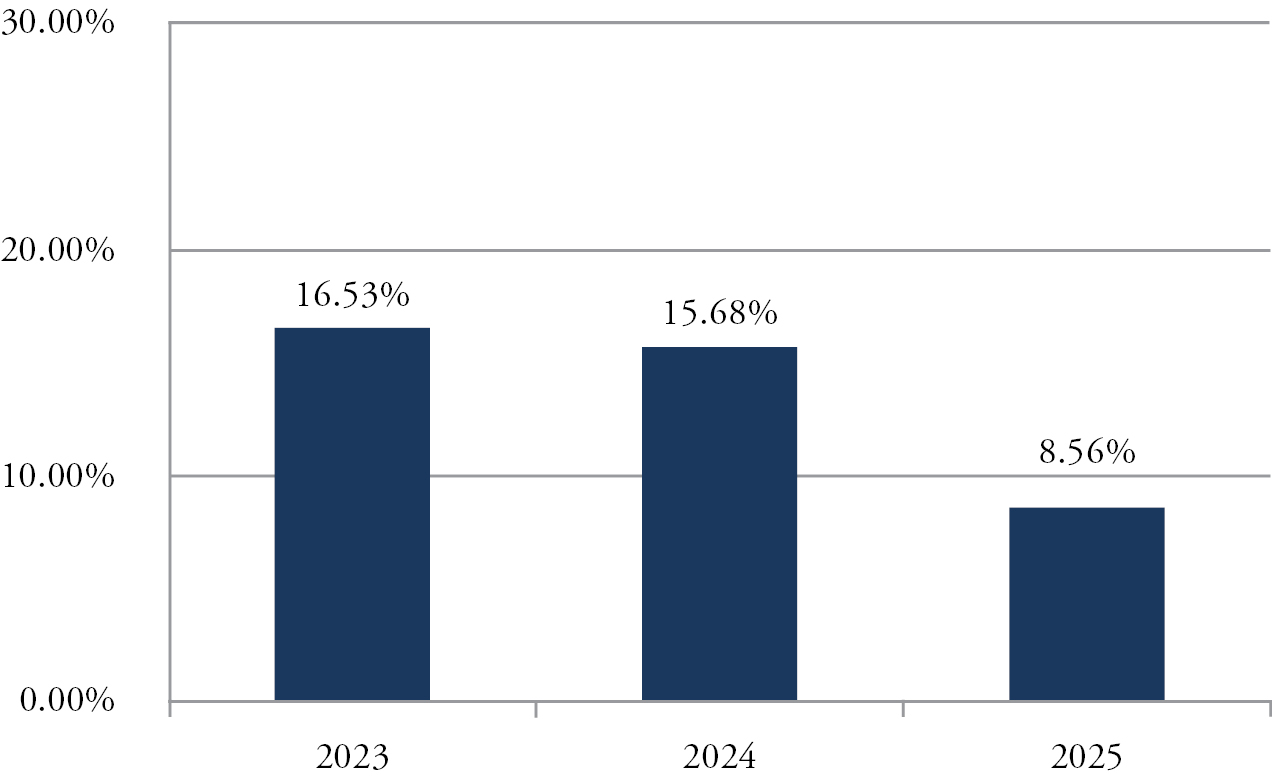
The year-to-date return as of March 31, 2026, was 1.68%.
|
||||||||||||||||||||||||
| Year to Date Return, Label [Optional Text] | year-to-date return | ||||||||||||||||||||||||
| Bar Chart, Year to Date Return | 1.68% | ||||||||||||||||||||||||
| Bar Chart, Year to Date Return, Date | Mar. 31, 2026 | ||||||||||||||||||||||||
| Highest Quarterly Return, Label [Optional Text] | Highest Calendar Quarter Return at NAV | ||||||||||||||||||||||||
| Highest Quarterly Return | 16.90% | ||||||||||||||||||||||||
| Highest Quarterly Return, Date | Dec. 31, 2023 | ||||||||||||||||||||||||
| Lowest Quarterly Return, Label [Optional Text] | Lowest Calendar Quarter Return at NAV | ||||||||||||||||||||||||
| Lowest Quarterly Return | (13.56%) | ||||||||||||||||||||||||
| Lowest Quarterly Return, Date | Mar. 31, 2025 | ||||||||||||||||||||||||
| Performance Table Heading | Average Annual Total Returns (for periods ended December 31, 2025) | ||||||||||||||||||||||||
| Performance Table Uses Highest Federal Rate | After-tax returns are calculated using the historical highest individual federal marginal income tax rates and do not reflect the impact of state and local taxes. | ||||||||||||||||||||||||
| Performance Table Not Relevant to Tax Deferred | After-tax returns shown are not relevant to investors who hold their Fund shares through tax-deferred arrangements, such as 401(k) plans or individual retirement accounts. | ||||||||||||||||||||||||
| Performance [Table] |
* After-tax returns are calculated using the historical highest individual federal marginal income tax rates and do not reflect the impact of state and local taxes. Actual after-tax returns depend on an investor’s tax situation and may differ from those shown. After-tax returns shown are not relevant to investors who hold their Fund shares through tax-deferred arrangements, such as 401(k) plans or individual retirement accounts. |
||||||||||||||||||||||||
| Index No Deduction for Fees, Expenses, or Taxes [Text] | reflects no deductions for fees, expenses or taxes | ||||||||||||||||||||||||
| Performance Availability Website Address [Text] | www.kennedycapital.com | ||||||||||||||||||||||||
| Performance Availability Phone [Text] | 1-877-882-8825 | ||||||||||||||||||||||||
| KENNEDY CAPITAL SMALL CAP VALUE FUND | |||||||||||||||||||||||||
| Prospectus [Line Items] | |||||||||||||||||||||||||
| Bar Chart and Performance Table [Heading] | Performance | ||||||||||||||||||||||||
| Performance Narrative [Text Block] | The bar chart and table below provide some indication of the risks of investing in the Fund by showing changes in the Fund’s performance from year to year for Institutional Class shares and by showing how the average annual total returns of each class of the Fund compare with the average annual total returns of the Russell 3000 Index, the Fund’s primary broad-based securities market index, and the Russell 2000 Value Index, which the Advisor believes is a better performance benchmark for comparison to the Fund’s performance in light of the Fund’s investment strategies. Performance for classes other than those shown may vary from the performance shown to the extent the expenses for those classes differ. Updated performance information is available at the Fund’s website, www.kennedycapital.com, or by calling the Fund at 1-877-882-8825. The Fund’s past performance, before and after taxes, is not necessarily an indication of how the Fund will perform in the future. |
||||||||||||||||||||||||
| Performance Past Does Not Indicate Future [Text] | The Fund’s past performance, before and after taxes, is not necessarily an indication of how the Fund will perform in the future. | ||||||||||||||||||||||||
| Performance Information Illustrates Variability of Returns [Text] | The bar chart and table below provide some indication of the risks of investing in the Fund by showing changes in the Fund’s performance from year to year for Institutional Class shares and by showing how the average annual total returns of each class of the Fund compare with the average annual total returns of the Russell 3000 Index, the Fund’s primary broad-based securities market index, and the Russell 2000 Value Index, which the Advisor believes is a better performance benchmark for comparison to the Fund’s performance in light of the Fund’s investment strategies. | ||||||||||||||||||||||||
| Bar Chart [Heading] | Calendar-Year Total Return (before taxes) Institutional Class Shares For each calendar year at NAV | ||||||||||||||||||||||||
| Bar Chart [Table] |
|
||||||||||||||||||||||||
| Bar Chart Closing [Text Block] | 
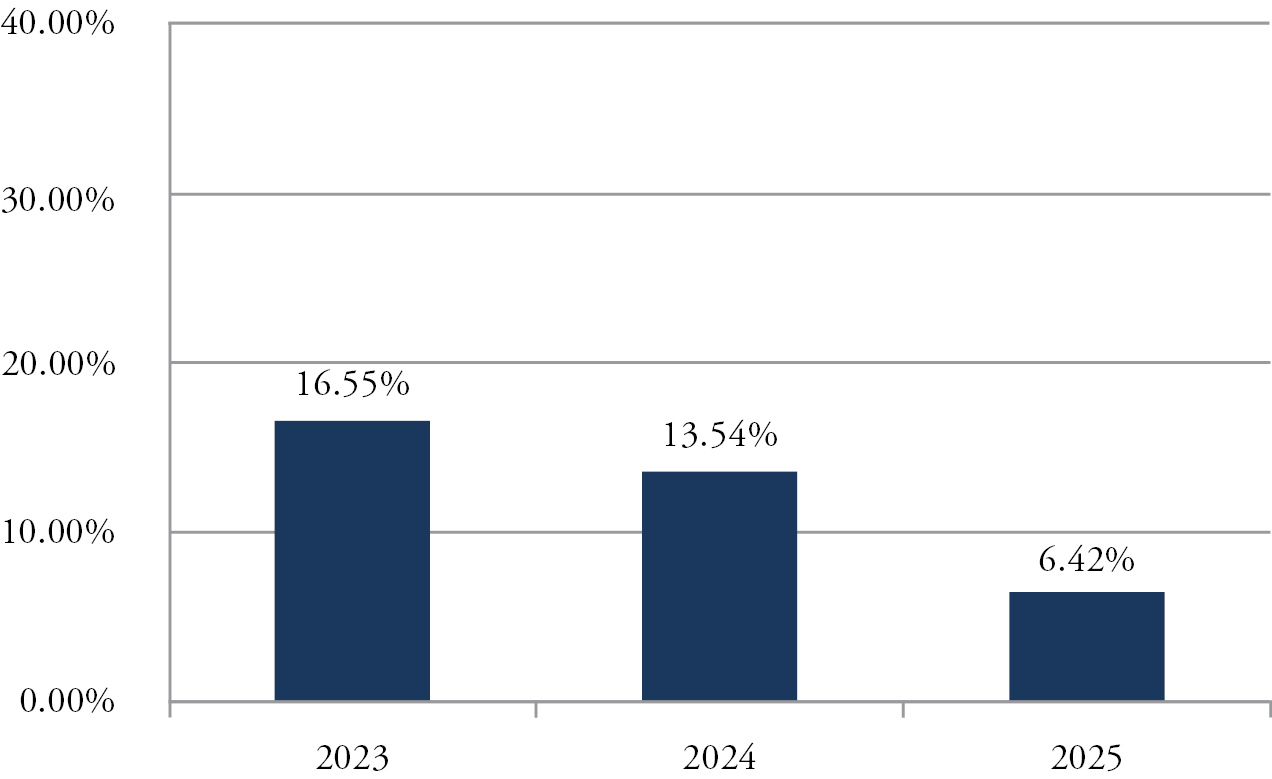
The year-to-date return as of March 31, 2026, was 6.41%.
|
||||||||||||||||||||||||
| Year to Date Return, Label [Optional Text] | year-to-date return | ||||||||||||||||||||||||
| Bar Chart, Year to Date Return | 6.41% | ||||||||||||||||||||||||
| Bar Chart, Year to Date Return, Date | Mar. 31, 2026 | ||||||||||||||||||||||||
| Highest Quarterly Return, Label [Optional Text] | Highest Calendar Quarter Return at NAV | ||||||||||||||||||||||||
| Highest Quarterly Return | 13.44% | ||||||||||||||||||||||||
| Highest Quarterly Return, Date | Dec. 31, 2023 | ||||||||||||||||||||||||
| Lowest Quarterly Return, Label [Optional Text] | Lowest Calendar Quarter Return at NAV | ||||||||||||||||||||||||
| Lowest Quarterly Return | (4.20%) | ||||||||||||||||||||||||
| Lowest Quarterly Return, Date | Mar. 31, 2025 | ||||||||||||||||||||||||
| Performance Table Heading | Average Annual Total Returns (for periods ended December 31, 2025) | ||||||||||||||||||||||||
| Performance Table Uses Highest Federal Rate | After-tax returns are calculated using the historical highest individual federal marginal income tax rates and do not reflect the impact of state and local taxes. | ||||||||||||||||||||||||
| Performance Table Not Relevant to Tax Deferred | After-tax returns shown are not relevant to investors who hold their Fund shares through tax-deferred arrangements, such as 401(k) plans or individual retirement accounts. | ||||||||||||||||||||||||
| Performance [Table] |
* After-tax returns are calculated using the historical highest individual federal marginal income tax rates and do not reflect the impact of state and local taxes. Actual after-tax returns depend on an investor’s tax situation and may differ from those shown. After-tax returns shown are not relevant to investors who hold their Fund shares through tax-deferred arrangements, such as 401(k) plans or individual retirement accounts. |
||||||||||||||||||||||||
| Index No Deduction for Fees, Expenses, or Taxes [Text] | reflects no deductions for fees, expenses or taxes | ||||||||||||||||||||||||
| Performance Availability Website Address [Text] | www.kennedycapital.com | ||||||||||||||||||||||||
| Performance Availability Phone [Text] | 1-877-882-8825 | ||||||||||||||||||||||||