Pay vs Performance Disclosure
Dec. 31, 2025
USD ($)
$ / shares
Dec. 31, 2024
USD ($)
$ / shares
Dec. 31, 2023
USD ($)
$ / shares
Dec. 31, 2022
USD ($)
$ / shares
Dec. 31, 2021
USD ($)
$ / shares
Pay Versus Performance Table
The following table shows the past five fiscal years’ total compensation for our NEOs as set forth in the Summary Compensation Table, the compensation actually paid to our principal executive officer (the “PEO”) and the other NEOs, our total shareholder return (“TSR”) and our net income.
SEC rules require certain adjustments be made to the Summary Compensation Table totals to determine the compensation actually paid as reported in the Pay Versus Performance table. Compensation actually paid does not necessarily represent compensation actually earned, realized or received by the applicable NEO, but rather is a valuation calculated under applicable SEC rules by adjusting the Summary Compensation Table totals for the applicable year as described in the footnotes to the Pay Versus Performance Table.
| Year | Summary Compensation Table Total for PEO(1) | Compensation Actually Paid to PEO(2) | Average Summary Compensation Table Total for Non-PEO NEOs(1) | Average Compensation Actually Paid to Non-PEO NEOs(3) | Value of Initial Fixed $100 Investment Based On: | Net Income | ||||||||||||||||||||
Total Shareholder Return(4) | Peer Group Total Shareholder Return(5) | Basic EPS | ||||||||||||||||||||||||
| ($) | ($) | ($) | ($) | ($ in thousands) | ($) | |||||||||||||||||||||
| 2025 | 1,000,000 | 805,482 | 741,441 | 664,154 | (4.9) | % | 12.8 | % | 60,512 | $ | 2.21 | |||||||||||||||
| 2024 | 846,000 | 701,284 | 856,467 | 894,152 | (1.5) | % | 11.5 | % | 50,853 | 1.97 | ||||||||||||||||
| 2023 | 700,000 | 599,203 | 596,469 | 575,468 | (11.1) | % | 18.5 | % | 47,329 | 1.89 | ||||||||||||||||
| 2022 | 2,700,000 | 2,096,624 | 918,750 | 785,908 | (50.2) | % | (28.2) | % | 32,311 | 1.34 | ||||||||||||||||
| 2021 | 3,500,000 | 4,633,439 | 895,000 | 960,718 | 55.5 | % | 17.7 | % | 84,142 | 3.69 | ||||||||||||||||
Year | Reported Summary Compensation Table Total for PEO($) | Less: Reported Value of Equity Awards(a)($) | Equity Award Adjustments | Compensation Actually Paid to PEO($) | |||||||||||||||||||||||||
Plus: Year End Fair Value of Equity Awards Granted in the Year that are Unvested at Year End($) | Plus: Year over Year Change in Fair Value of Equity Awards Granted in Prior Years that are Unvested at Year End($) | Plus: Fair Value of Equity Awards that were Granted and Vested in the Same Year at Vesting Date($) | Plus: Year over Year Change in Fair Value of Equity Awards Granted in Prior Years that Vested in the Year($) | Less: Year End Fair Value of Equity Awards Granted in Prior Years that Failed to Meet Vesting Conditions($) | Plus: Value of Dividends or other Earnings Paid on Stock or Option Awards not Otherwise Reflected in Fair Value or Total Compensation($) | ||||||||||||||||||||||||
| 2025 | 1,000,000 | — | — | (97,923) | — | (101,338) | — | 4,743 | 805,482 | ||||||||||||||||||||
| 2024 | 846,000 | (146,000) | 147,264 | (122,203) | — | (38,696) | — | 14,919 | 701,284 | ||||||||||||||||||||
| 2023 | 700,000 | — | — | (363,605) | — | 155,621 | — | 107,187 | 599,203 | ||||||||||||||||||||
| 2022 | 2,700,000 | (2,000,000) | 1,766,911 | (703,325) | — | (29,048) | — | 362,085 | 2,096,624 | ||||||||||||||||||||
| 2021 | 3,500,000 | (1,800,000) | 2,299,313 | — | — | 634,125 | — | — | 4,633,439 | ||||||||||||||||||||
(a) The grant date fair value of equity awards represents the total of the amounts reported in the “Stock Awards” and “Option Awards” columns in the Summary Compensation Table for the applicable year.
Year | Average of Reported Summary Compensation Table Total for non-PEO NEOs($) | Less: Reported Value of Equity Awards(a)($) | Equity Award Adjustments | Average Compensation Actually Paid to non-PEO NEOs($) | |||||||||||||||||||||||||
Plus: Year End Fair Value of Equity Awards Granted in the Year that are Unvested at Year End($) | Plus: Year over Year Change in Fair Value of Equity Awards Granted in Prior Years that are Unvested at Year End($) | Plus: Fair Value of Equity Awards that were Granted and Vested in the Same Year at Vesting Date($) | Plus: Year over Year Change in Fair Value of Equity Awards Granted in Prior Years that Vested in the Year($) | Less: Year End Fair Value of Equity Awards Granted in Prior Years that Failed to Meet Vesting Conditions($) | Plus: Value of Dividends or other Earnings Paid on Stock or Option Awards not Otherwise Reflected in Fair Value or Total Compensation($) | ||||||||||||||||||||||||
| 2025 | 741,441 | — | — | (17,875) | — | (30,869) | (36,309) | 7,766 | 664,154 | ||||||||||||||||||||
| 2024 | 856,467 | (221,200) | 224,290 | (13,916) | — | (3,306) | — | 51,817 | 894,152 | ||||||||||||||||||||
| 2023 | 596,469 | (59,440) | 51,460 | (36,507) | — | 10,152 | — | 13,333 | 575,468 | ||||||||||||||||||||
| 2022 | 918,750 | (275,000) | 210,389 | (90,316) | — | (12,042) | — | 34,127 | 785,908 | ||||||||||||||||||||
| 2021 | 895,000 | (318,750) | 304,275 | — | 11,347 | 59,449 | — | 9,397 | 960,718 | ||||||||||||||||||||
(a) The grant date fair value of equity awards represents the total of the amounts reported in the “Stock Awards” and “Option Awards” columns in the Summary Compensation Table for the applicable year.
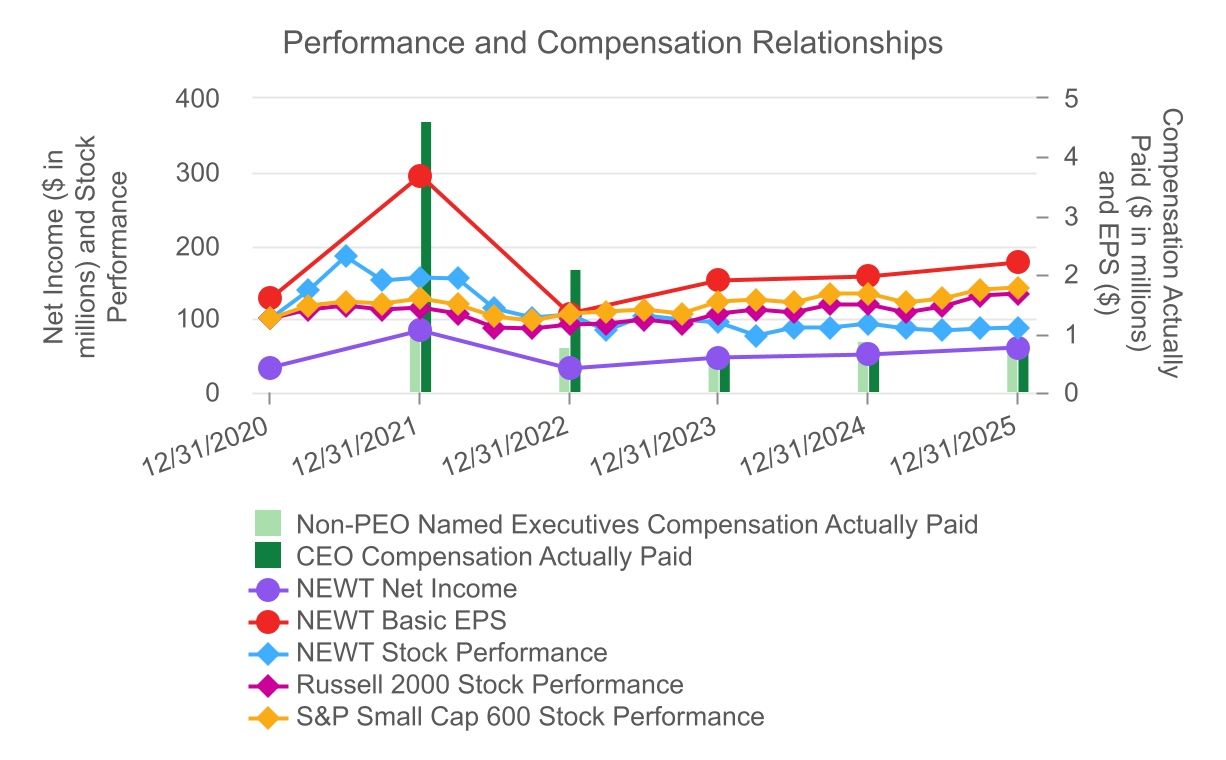
The following graph compares the return on our Common Stock with the Russell 2000 and the S&P Small Cap 600 for the period from December 31, 2020 through December 31, 2025. On June 26, 2023, following the Company's January 6, 2023 conversion to a financial holding company, the Company joined the broad-market Russell 3000 Index and the small-cap Russell 2000® Index following the conclusion of the Russell indexes annual reconstitution for 2023. The graph assumes that, on January 1, 2021, a person invested $100 in each of our Common Stock, Russell 2000 and S&P Small Cap 600. The graph measures TSR, which takes into account both changes in stock price and dividends. It assumes that dividends paid are invested in like securities.
The following graph compares the return on our Common Stock with the Russell 2000 and the S&P Small Cap 600 for the period from December 31, 2020 through December 31, 2025. On June 26, 2023, following the Company's January 6, 2023 conversion to a financial holding company, the Company joined the broad-market Russell 3000 Index and the small-cap Russell 2000® Index following the conclusion of the Russell indexes annual reconstitution for 2023. The graph assumes that, on January 1, 2021, a person invested $100 in each of our Common Stock, Russell 2000 and S&P Small Cap 600. The graph measures TSR, which takes into account both changes in stock price and dividends. It assumes that dividends paid are invested in like securities.
The following graph compares the return on our Common Stock with the Russell 2000 and the S&P Small Cap 600 for the period from December 31, 2020 through December 31, 2025. On June 26, 2023, following the Company's January 6, 2023 conversion to a financial holding company, the Company joined the broad-market Russell 3000 Index and the small-cap Russell 2000® Index following the conclusion of the Russell indexes annual reconstitution for 2023. The graph assumes that, on January 1, 2021, a person invested $100 in each of our Common Stock, Russell 2000 and S&P Small Cap 600. The graph measures TSR, which takes into account both changes in stock price and dividends. It assumes that dividends paid are invested in like securities.
The following graph compares the return on our Common Stock with the Russell 2000 and the S&P Small Cap 600 for the period from December 31, 2020 through December 31, 2025. On June 26, 2023, following the Company's January 6, 2023 conversion to a financial holding company, the Company joined the broad-market Russell 3000 Index and the small-cap Russell 2000® Index following the conclusion of the Russell indexes annual reconstitution for 2023. The graph assumes that, on January 1, 2021, a person invested $100 in each of our Common Stock, Russell 2000 and S&P Small Cap 600. The graph measures TSR, which takes into account both changes in stock price and dividends. It assumes that dividends paid are invested in like securities.
Unranked Tabular List of the Company’s Most Important Financial Performance Measures
The following is an unranked list of the most important financial performance measures used by the Company to evaluate compensation actually paid to the NEOs, for the year ended December 31, 2025, to Company performance:
- growth in profitability and earnings per share;
- growth in net assets;
- cash dividends paid to our shareholders; and
- growth in loans originated and growth in deposits at Newtek Bank.