PAY VERSUS PERFORMANCE
As required by Item 402(v) of Regulation S-K, we are providing the following information regarding the relationship between executive compensation and our financial performance for each of the last three completed calendar years. In determining the “compensation actually paid” to our NEOs, we are required to make various adjustments to amounts that have been previously reported in the Summary Compensation Table (“SCT”) in previous years, as the SEC’s valuation methods for this section differ from those required in the SCT.
Pay Versus Performance Table
The table below summarizes compensation values both previously reported in our SCT, as well as the adjusted values required in this section for fiscal years 2025, 2024 and 2023. Note that for our NEOs, other than our PEOs, compensation is reported as an average.
| PEO | Non-PEO | |||||||||||||||||||||||||||||||
| Year | Summary | Summary | Summary | Compensation | Compensation | Compensation | Average | Average | Value of | Net | ||||||||||||||||||||||
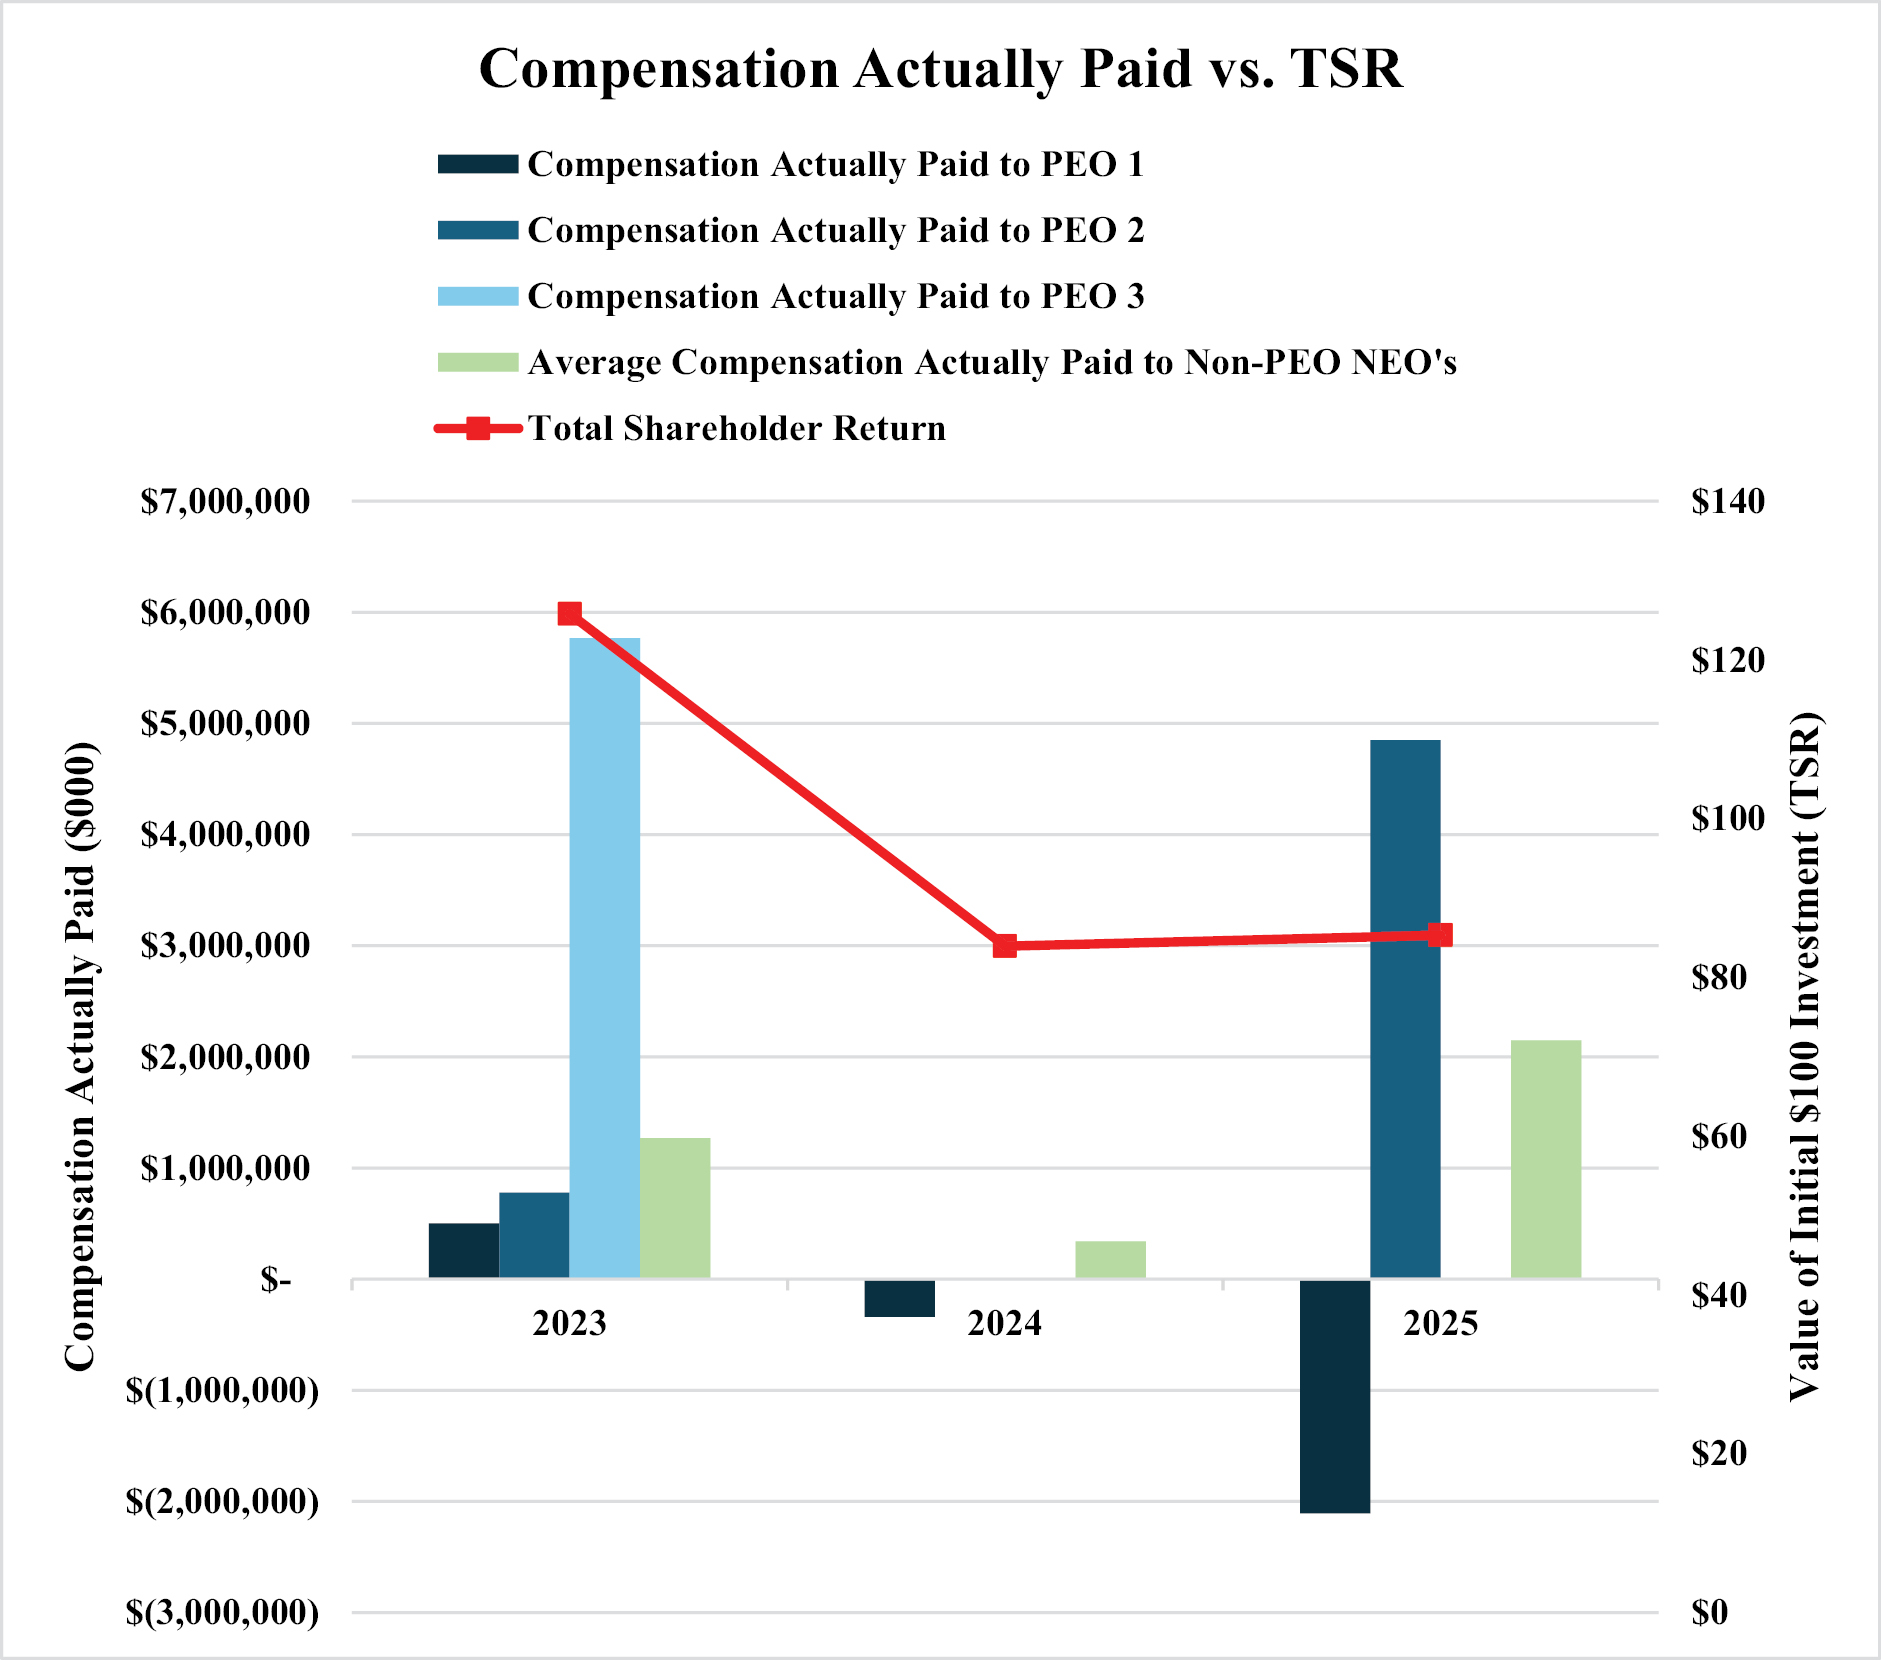
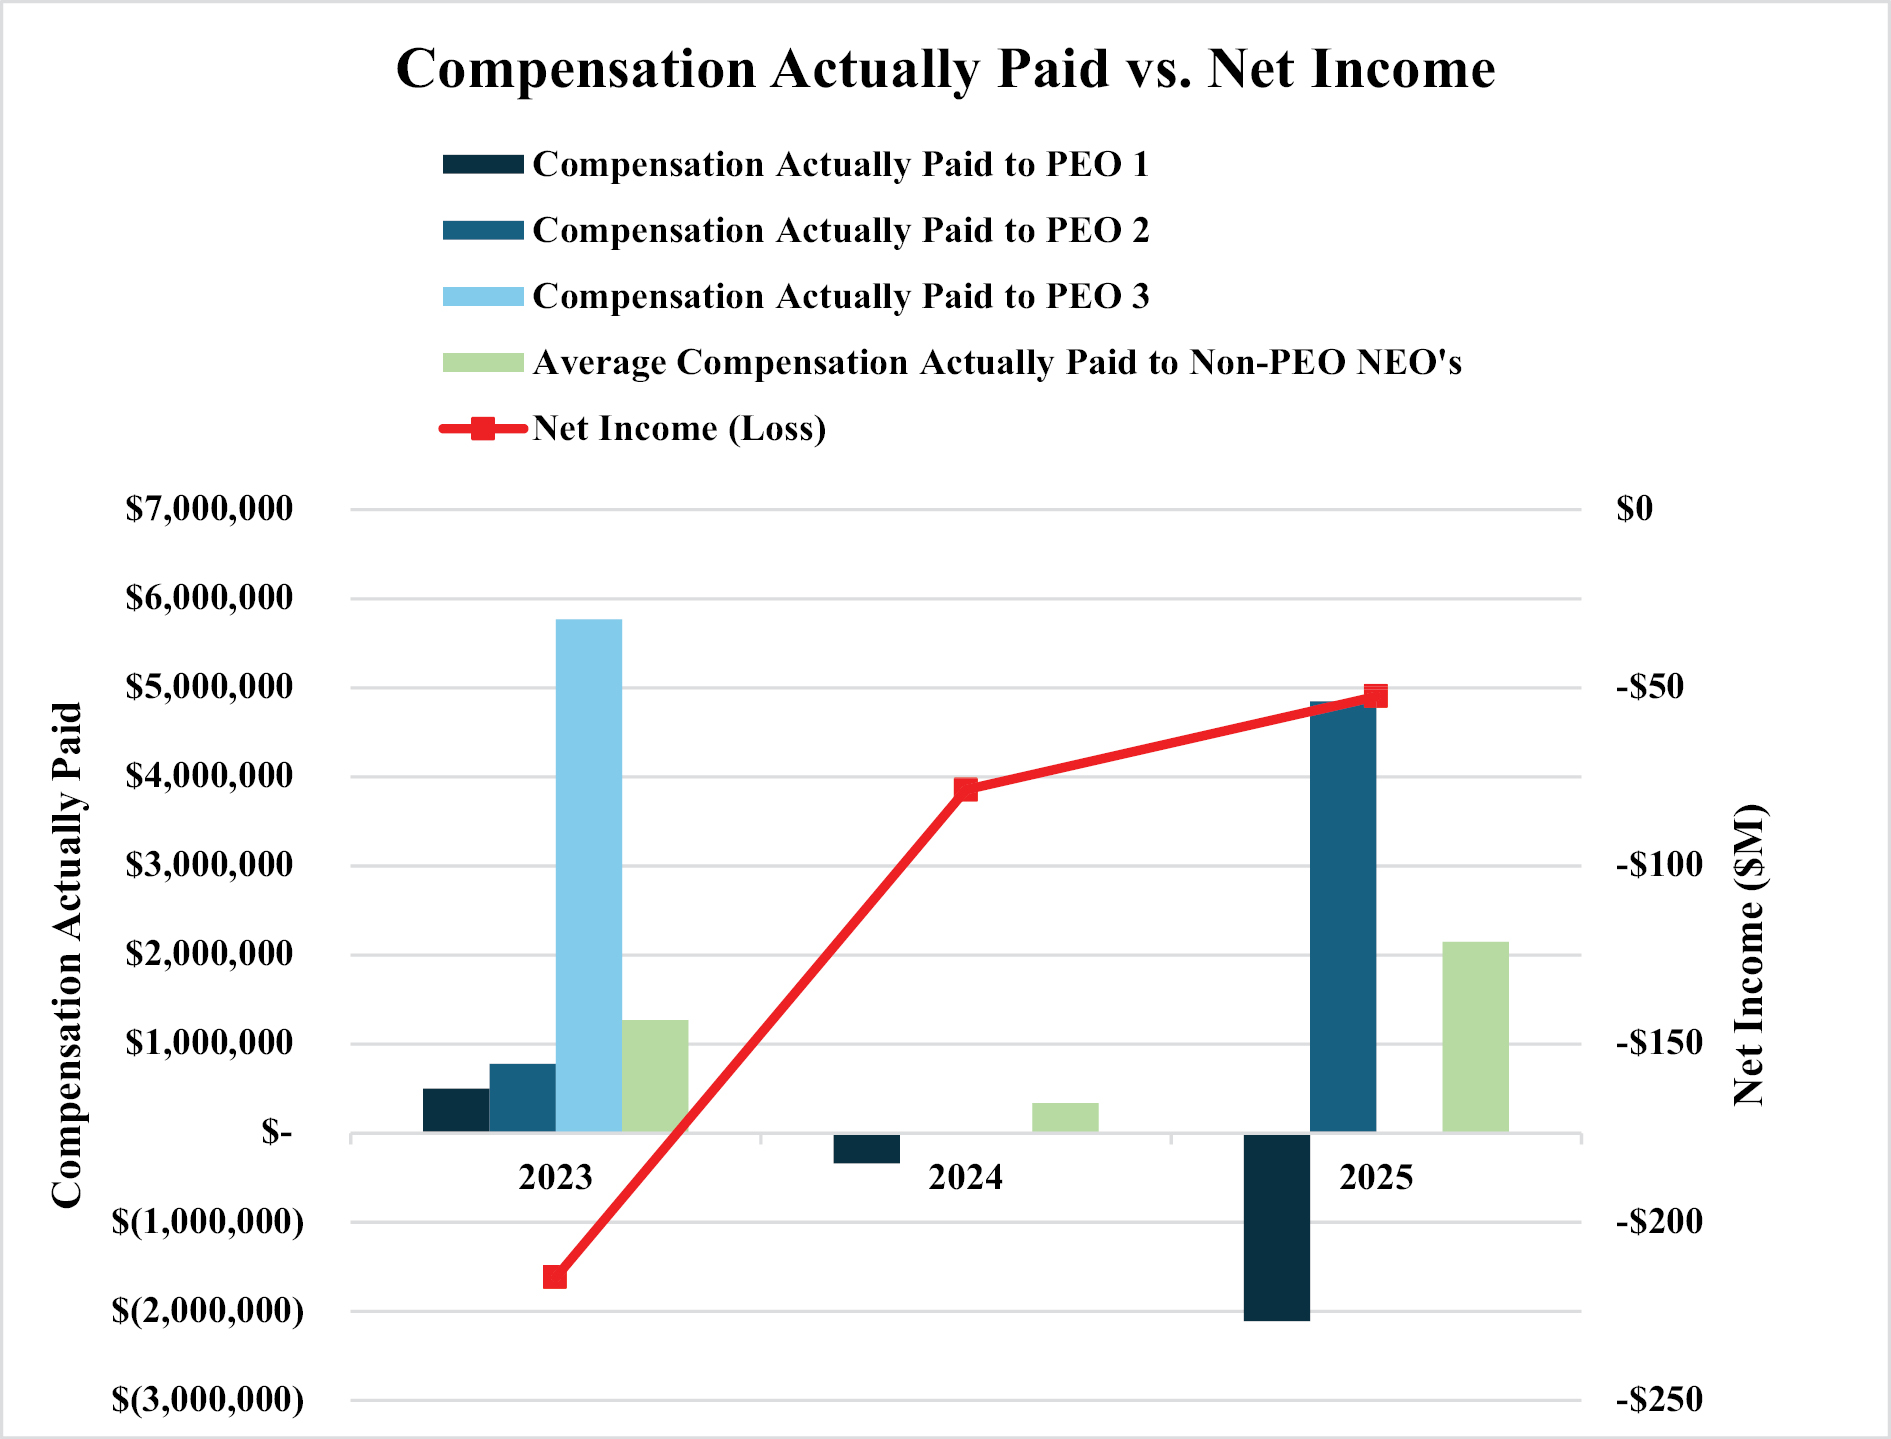
| 2025 | $ | 600,196 | $ | 3,315,036 | $ |
| $ | (2,109,804 | ) | $ | 4,877,536 | $ |
| $ | 1,175,687 | $ | 2,146,444 | $ | 85.32 | $ | (52.4 | ) | ||||||||||
| 2024 | $ | 540,411 | $ |
| $ |
| $ | (339,589 | ) | $ |
| $ |
| $ | 486,747 | $ | 337,688 | $ | 83.93 | $ | (78.6 | ) | ||||||||||
| 2023 | $ | 2,299,970 | $ | 841,480 | $ | 3,666,731 | $ | 500,267 |
| $ | 376,930 | $ | 5,766,731 | $ | 2,403,881 | $ | 1,833,851 | $ | 125.81 | $ | (215.5 | ) | ||||||||||
____________
(1) During the fiscal year 2025, the PEOs were Michael Kennedy (“PEO-1”) and Michael Quartieri (“PEO-2”). During fiscal year 2024, the PEO was Michael Kennedy (“PEO-1”). During fiscal year 2023, the PEOs were Marshall Chesrown (“PEO-1”), Mark Tkach (“PEO-2”), and Michael Kennedy (“PEO-3”). During fiscal year 2025, the non-PEO NEOs were Cameron Tkach and Melissa Bengtson. During fiscal year 2024, the non-PEO NEOs were Tiffany Kice, Brandy Treadway and Blake Lawson. During fiscal year 2023, the non-PEO NEOs were Blake Lawson, Michael Francis, and Peter Levy.
(2) The amounts reported as “Summary Compensation Table Total” for each PEO are the amounts reported for the applicable individual in the “Total” column of the Company’s Summary Compensation Table for the applicable fiscal year.
(3) “Compensation Actually Paid to PEO” is computed in accordance with Item 402(v) of Regulation S-K and reflects the applicable PEO’s Summary Compensation Table total for the applicable year, with adjustments to reflect the amounts required to be included or excluded for “compensation actually paid.” The following table sets forth the adjustments made to the Summary Compensation Table totals for each applicable PEO for each year presented to arrive at “compensation actually paid”:
| 2025 | 2024 | 2023 | ||||||||||||||||||||||
| PEO-1 | PEO-2 | PEO-1 | PEO-1 | PEO-2 | PEO-3 | |||||||||||||||||||
| SCT Total for PEOs | $ | 600,196 |
| $ | 3,315,036 |
| $ | 540,411 |
| $ | 2,299,970 |
| $ | 841,480 |
| $ | 3,666,731 |
| ||||||
| Reported Value of Equity Awards |
|
| $ | (2,117,000 | ) | $ |
|
| $ | (1,637,999 | ) | $ | (464,550 | ) | $ | (3,590,000 | ) | |||||||
| Adjustments |
|
|
|
|
|
|
|
|
|
|
|
| ||||||||||||
| Year End Fair Value of Awards Granted in Current Year that Remain Unvested at Year End |
|
| $ | 3,679,500 |
| $ |
|
| $ |
|
| $ |
|
| $ | 5,690,000 |
| |||||||
| Vesting Date Fair Value of Awards Granted in Current Year that Vested during Current Year |
|
|
|
| $ |
| $ | 96,409 |
| $ | 400,675 |
| $ |
|
| |||||||||
| Change in Fair Value of Awards Granted in Prior Years |
|
|
|
| $ | (880,000 | ) | $ |
|
| $ |
|
| $ |
|
| ||||||||
| Change in Fair Value of Awards Granted in Prior Years that Vested in Current Year |
|
|
|
| $ |
| $ | 9,085 |
| $ |
|
| $ |
|
| |||||||||
| Prior Year End Fair Value of Awards that were Forfeited in Current Year |
|
|
|
| $ |
| $ | (267,198 | ) | $ |
|
| $ |
|
| |||||||||
| Total Equity Adjustments |
|
|
|
|
|
| $ | (880,000 | ) | $ | (161,704 | ) | $ | 400,675 |
| $ | 5,690,000 |
| ||||||
| Compensation Actually Paid to PEO | $ | (2,109,804 | ) | $ | 4,877,536 |
| $ | (339,589 | ) | $ | 500,267 |
| $ | 777,605 |
| $ | 5,766,731 |
| ||||||
Assumptions used in the fair valuation of equity awards for the adjustments described above to calculate compensation actually paid to the PEOs were not materially different from those used in the Company’s grant date fair value calculations for such awards.
(4) The dollar amounts reported represent the average of the amounts reported for the Non-PEO NEOs for the applicable fiscal year in the “Total” column of the Company’s Summary Compensation Table.
(5) “Average Compensation Actually Paid to Non-PEO NEOs” is computed in accordance with Item 402(v) of Regulation S-K and represents the average “compensation actually paid” to the individuals who were Non-PEO NEOs for the applicable year (computed using the same methodology applied to the PEOs, on an average basis). The following table sets forth the adjustments made, on an average basis, to the average Summary Compensation Table total for each year presented to arrive at “average compensation actually paid” to our Non-PEO NEOs:
| 2025 | 2024 | 2023 | ||||||||||
| Average SCT Total for Non-PEO NEOs | $ | 1,175,687 |
| $ | 486,747 |
| $ | 1,391,832 |
| |||
| Reported Value of Equity Awards | $ | (338,501 | ) | $ | (216,075 | ) | $ | (540,976 | ) | |||
| Adjustments |
|
|
|
|
|
| ||||||
| Year End Fair Value of Awards Granted in Current Year that Remain Unvested at Year End | $ | 1,325,360 |
| $ | 167,504 |
| $ | 99,132 |
| |||
| Vesting Date Fair Value of Awards Granted in Current Year that Vested during Current Year | $ |
| $ |
| $ | 621,912 |
| |||||
| Change in Fair Value of Awards Granted in Prior Years | $ | (8,421 | ) | $ |
| $ | 2,909 |
| ||||
| Change in Fair Value of Awards Granted in Prior Years that Vested in Current Year | $ | (7,682 | ) | $ | 17,175 |
| $ | 40,542 |
| |||
| Prior Year End Fair Value of Awards that were Forfeited in Current Year | $ |
|
| $ | (151,087 | ) | $ | (137,138 | ) | |||
| Average Compensation Actually Paid to Non-PEO NEOs | $ | 2,146,444 |
| $ | 337,688 |
| $ | 1,268,757 |
| |||
Assumptions used in the fair valuation of equity awards for the adjustments described above to calculate average compensation actually paid to the Non-PEO NEOs were not materially different from those used in the Company’s grant date fair value calculations for such awards.
(6) The amounts reported represent the measurement period value of an investment of $100 in our Class B common stock, measured from the closing price on December 30, 2022 (the last trading day of fiscal year 2022), through the closing prices on December 29, 2023, December 31, 2024 and December 31, 2025 (each, the last trading day of the applicable fiscal year), in each case, based on the closing price per share on such date.
(7) The amounts reported represent net income (loss) for the applicable fiscal year calculated in accordance with U.S. GAAP. The year ended December 31, 2023 includes a $60.1 million impairment of goodwill and franchise rights. The year ended December 31, 2024 includes a $39.3 million impairment of franchise rights. The year ended December 31, 2025 includes a $34.8 million impairment of goodwill and franchise rights.
| 2025 | 2024 | 2023 | ||||||||||||||||||||||
| PEO-1 | PEO-2 | PEO-1 | PEO-1 | PEO-2 | PEO-3 | |||||||||||||||||||
| SCT Total for PEOs | $ | 600,196 |
| $ | 3,315,036 |
| $ | 540,411 |
| $ | 2,299,970 |
| $ | 841,480 |
| $ | 3,666,731 |
| ||||||
| Reported Value of Equity Awards |
|
| $ | (2,117,000 | ) | $ |
|
| $ | (1,637,999 | ) | $ | (464,550 | ) | $ | (3,590,000 | ) | |||||||
| Adjustments |
|
|
|
|
|
|
|
|
|
|
|
| ||||||||||||
| Year End Fair Value of Awards Granted in Current Year that Remain Unvested at Year End |
|
| $ | 3,679,500 |
| $ |
|
| $ |
|
| $ |
|
| $ | 5,690,000 |
| |||||||
| Vesting Date Fair Value of Awards Granted in Current Year that Vested during Current Year |
|
|
|
| $ |
| $ | 96,409 |
| $ | 400,675 |
| $ |
|
| |||||||||
| Change in Fair Value of Awards Granted in Prior Years |
|
|
|
| $ | (880,000 | ) | $ |
|
| $ |
|
| $ |
|
| ||||||||
| Change in Fair Value of Awards Granted in Prior Years that Vested in Current Year |
|
|
|
| $ |
| $ | 9,085 |
| $ |
|
| $ |
|
| |||||||||
| Prior Year End Fair Value of Awards that were Forfeited in Current Year |
|
|
|
| $ |
| $ | (267,198 | ) | $ |
|
| $ |
|
| |||||||||
| Total Equity Adjustments |
|
|
|
|
|
| $ | (880,000 | ) | $ | (161,704 | ) | $ | 400,675 |
| $ | 5,690,000 |
| ||||||
| Compensation Actually Paid to PEO | $ | (2,109,804 | ) | $ | 4,877,536 |
| $ | (339,589 | ) | $ | 500,267 |
| $ | 777,605 |
| $ | 5,766,731 |
| ||||||
| 2025 | 2024 | 2023 | ||||||||||
| Average SCT Total for Non-PEO NEOs | $ | 1,175,687 |
| $ | 486,747 |
| $ | 1,391,832 |
| |||
| Reported Value of Equity Awards | $ | (338,501 | ) | $ | (216,075 | ) | $ | (540,976 | ) | |||
| Adjustments |
|
|
|
|
|
| ||||||
| Year End Fair Value of Awards Granted in Current Year that Remain Unvested at Year End | $ | 1,325,360 |
| $ | 167,504 |
| $ | 99,132 |
| |||
| Vesting Date Fair Value of Awards Granted in Current Year that Vested during Current Year | $ |
| $ |
| $ | 621,912 |
| |||||
| Change in Fair Value of Awards Granted in Prior Years | $ | (8,421 | ) | $ |
| $ | 2,909 |
| ||||
| Change in Fair Value of Awards Granted in Prior Years that Vested in Current Year | $ | (7,682 | ) | $ | 17,175 |
| $ | 40,542 |
| |||
| Prior Year End Fair Value of Awards that were Forfeited in Current Year | $ |
|
| $ | (151,087 | ) | $ | (137,138 | ) | |||
| Average Compensation Actually Paid to Non-PEO NEOs | $ | 2,146,444 |
| $ | 337,688 |
| $ | 1,268,757 |
| |||
| [1] | The dollar amounts reported represent the average of the amounts reported for the Non-PEO NEOs for the applicable fiscal year in the “Total” column of the Company’s Summary Compensation Table. | ||||||||||||||||||||||||||||||||||||||||||||||||||||||||||||||||||||||||||||||||||||||||||||||||||||||||||||||||||||||||||||||||||||||||||||||||||||||||||||||||||||||||||||||||||||||||||||||||||||||||||||||||||||||||||||||||||||||||||||||||||||||||||||||||||||||||||||||||||||||||||||||||||||||||||||
| [2] | “Average Compensation Actually Paid to Non-PEO NEOs” is computed in accordance with Item 402(v) of Regulation S-K and represents the average “compensation actually paid” to the individuals who were Non-PEO NEOs for the applicable year (computed using the same methodology applied to the PEOs, on an average basis). The following table sets forth the adjustments made, on an average basis, to the average Summary Compensation Table total for each year presented to arrive at “average compensation actually paid” to our Non-PEO NEOs:
Assumptions used in the fair valuation of equity awards for the adjustments described above to calculate average compensation actually paid to the Non-PEO NEOs were not materially different from those used in the Company’s grant date fair value calculations for such awards. |
||||||||||||||||||||||||||||||||||||||||||||||||||||||||||||||||||||||||||||||||||||||||||||||||||||||||||||||||||||||||||||||||||||||||||||||||||||||||||||||||||||||||||||||||||||||||||||||||||||||||||||||||||||||||||||||||||||||||||||||||||||||||||||||||||||||||||||||||||||||||||||||||||||||||||||
| [3] | The amounts reported represent the measurement period value of an investment of $100 in our Class B common stock, measured from the closing price on December 30, 2022 (the last trading day of fiscal year 2022), through the closing prices on December 29, 2023, December 31, 2024 and December 31, 2025 (each, the last trading day of the applicable fiscal year), in each case, based on the closing price per share on such date. | ||||||||||||||||||||||||||||||||||||||||||||||||||||||||||||||||||||||||||||||||||||||||||||||||||||||||||||||||||||||||||||||||||||||||||||||||||||||||||||||||||||||||||||||||||||||||||||||||||||||||||||||||||||||||||||||||||||||||||||||||||||||||||||||||||||||||||||||||||||||||||||||||||||||||||||
| [4] | The amounts reported represent net income (loss) for the applicable fiscal year calculated in accordance with U.S. GAAP. The year ended December 31, 2023 includes a $60.1 million impairment of goodwill and franchise rights. The year ended December 31, 2024 includes a $39.3 million impairment of franchise rights. The year ended December 31, 2025 includes a $34.8 million impairment of goodwill and franchise rights. | ||||||||||||||||||||||||||||||||||||||||||||||||||||||||||||||||||||||||||||||||||||||||||||||||||||||||||||||||||||||||||||||||||||||||||||||||||||||||||||||||||||||||||||||||||||||||||||||||||||||||||||||||||||||||||||||||||||||||||||||||||||||||||||||||||||||||||||||||||||||||||||||||||||||||||||
| [5] | During the fiscal year 2025, the PEOs were Michael Kennedy (“PEO-1”) and Michael Quartieri (“PEO-2”). During fiscal year 2024, the PEO was Michael Kennedy (“PEO-1”). During fiscal year 2023, the PEOs were Marshall Chesrown (“PEO-1”), Mark Tkach (“PEO-2”), and Michael Kennedy (“PEO-3”). During fiscal year 2025, the non-PEO NEOs were Cameron Tkach and Melissa Bengtson. During fiscal year 2024, the non-PEO NEOs were Tiffany Kice, Brandy Treadway and Blake Lawson. During fiscal year 2023, the non-PEO NEOs were Blake Lawson, Michael Francis, and Peter Levy. | ||||||||||||||||||||||||||||||||||||||||||||||||||||||||||||||||||||||||||||||||||||||||||||||||||||||||||||||||||||||||||||||||||||||||||||||||||||||||||||||||||||||||||||||||||||||||||||||||||||||||||||||||||||||||||||||||||||||||||||||||||||||||||||||||||||||||||||||||||||||||||||||||||||||||||||
| [6] | The amounts reported as “Summary Compensation Table Total” for each PEO are the amounts reported for the applicable individual in the “Total” column of the Company’s Summary Compensation Table for the applicable fiscal year. | ||||||||||||||||||||||||||||||||||||||||||||||||||||||||||||||||||||||||||||||||||||||||||||||||||||||||||||||||||||||||||||||||||||||||||||||||||||||||||||||||||||||||||||||||||||||||||||||||||||||||||||||||||||||||||||||||||||||||||||||||||||||||||||||||||||||||||||||||||||||||||||||||||||||||||||
| [7] | “Compensation Actually Paid to PEO” is computed in accordance with Item 402(v) of Regulation S-K and reflects the applicable PEO’s Summary Compensation Table total for the applicable year, with adjustments to reflect the amounts required to be included or excluded for “compensation actually paid.” The following table sets forth the adjustments made to the Summary Compensation Table totals for each applicable PEO for each year presented to arrive at “compensation actually paid”:
Assumptions used in the fair valuation of equity awards for the adjustments described above to calculate compensation actually paid to the PEOs were not materially different from those used in the Company’s grant date fair value calculations for such awards. |
||||||||||||||||||||||||||||||||||||||||||||||||||||||||||||||||||||||||||||||||||||||||||||||||||||||||||||||||||||||||||||||||||||||||||||||||||||||||||||||||||||||||||||||||||||||||||||||||||||||||||||||||||||||||||||||||||||||||||||||||||||||||||||||||||||||||||||||||||||||||||||||||||||||||||||