Pay vs Performance Disclosure - USD ($)
|
12 Months Ended |
Dec. 31, 2025 |
Dec. 31, 2024 |
Dec. 31, 2023 |
Dec. 31, 2022 |
Dec. 31, 2021 |
| Pay vs Performance Disclosure |
|
|
|
|
|
| Pay vs Performance Disclosure, Table |
| | | | | | | | | | | | | | | | | | | | | | | | | | | | | | | | Value of Initial Fixed $100 Investment Based On(6): | | | Fiscal Year | Summary Compensation Table Total for PEO ($)(1) | Compensation Actually Paid to PEO ($)(2)(3) | Average Summary Compensation Table Total for non-PEO NEOs ($)(4) | Average Compensation Actually Paid to non-PEO NEOs ($)(2)(5) | Total Shareholder Return ($) | Peer Group Total Shareholder Return ($) | Net Income (Loss) ($)(7) | Revenue ($)(8) | | | | | 2025 | 2,851,838 | | 1,412,726 | | 1,907,112 | | 939,375 | | 18.71 | 58.61 | (32,994,000) | | 448,952,000 | | | 2024 | 5,665,078 | | 3,811,260 | | 3,160,414 | | 238,032 | | 34.72 | 52.81 | (12,854,000) | | 474,001,000 | | | 2023 | 464,876 | | (14,017,110) | | 4,511,560 | | 2,677,586 | | 66.67 | 51.23 | 49,098,000 | | 645,722,000 | | | 2022 | 1,096,155 | | (7,361,047) | | 2,228,483 | | 1,368,571 | | 78.75 | 36.70 | 61,494,000 | | 904,649,000 | | | 2021 | 35,189,890 | | 34,355,976 | | 6,874,618 | | 11,091,444 | | 119.62 | 86.01 | 3,600,000 | | 741,141,000 | |
|
|
|
|
|
| Company Selected Measure Name |
revenue
|
|
|
|
|
| Named Executive Officers, Footnote |
Ian Siegel has been our Chief Executive Officer since June 2010. The individuals comprising the Non-PEO NEOs for each year are listed below: | | | | | | | | | | | | | | | | 2021 | 2022 | 2023 | 2024 | 2025 | | Qasim Saifee | Amy Garefis | Qasim Saifee | Amy Garefis | Amy Garefis | | David Travers | Qasim Saifee | Boris Shimanovsky | Qasim Saifee | Boris Shimanovsky | | David Travers | David Travers | Boris Shimanovsky | David Travers | | Timothy Yarbrough | Timothy Yarbrough | David Travers | Timothy Yarbrough | | | | Timothy Yarbrough | |
|
|
|
|
|
| Peer Group Issuers, Footnote |
The Peer Group TSR set forth in this table utilizes the Standard & Poor’s Internet Select Industry Index, which we also utilize in the stock performance graph required by Item 201(e) of Regulation S-K included in the 2025 Form 10-K. The comparison assumes $100 was invested for the period starting May 26, 2021 (the date our Class A common stock commenced trading on the NYSE), through the end of the listed year in the Company and in the Standard & Poor’s Internet Select Industry Index. Historical stock performance is not necessarily indicative of future stock performance.
|
|
|
|
|
| PEO Total Compensation Amount |
$ 2,851,838
|
$ 5,665,078
|
$ 464,876
|
$ 1,096,155
|
$ 35,189,890
|
| PEO Actually Paid Compensation Amount |
$ 1,412,726
|
3,811,260
|
(14,017,110)
|
(7,361,047)
|
34,355,976
|
| Adjustment To PEO Compensation, Footnote |
The fair value or change in fair value, as applicable, of equity awards in the “Compensation Actually Paid” columns has been estimated pursuant to the guidance in FASB ASC Topic 718 by reference to: (1) for RSU awards with time-based service conditions, the Company’s closing price on applicable year-end dates or, in the case of vesting dates, the closing price on the vesting date; (2) for stock options, a Black Scholes value as of the applicable year-end or vesting date(s), determined based on the same methodology as used to determine grant date fair value but using the closing stock price on the applicable revaluation date as the current market price and with an expected life set equal to the remaining life of the award, and in all cases based on volatility and risk free rates determined as of the revaluation date based on the expected life period and based on an expected dividend rate of 0%; and (3) for the CEO Grant (as defined below), Monte Carlo simulation models. For additional information on the assumptions used to estimate the fair value of the awards, see Note 2 “Basis of Presentation, Principles of Consolidation, and Summary of Significant Accounting Policies—Stock-Based Compensation” and Note 16 “Stock-Based Compensation” in the Notes to Consolidated Financial Statements in the 2025 Form 10-K.Compensation Actually Paid to our PEO, Mr. Siegel, reflects the following adjustments from Total compensation reported in the Summary Compensation Table for the years set forth in the table below: | | | | | | | | | | | | | | | | | | Prior FYE | 12/31/2020 | 12/31/2021 | 12/31/2022 | 12/31/2023 | 12/31/2024 | Current FYE | 12/31/2021 | 12/31/2022 | 12/31/2023 | 12/31/2024 | 12/31/2025 | Fiscal Year | 2021 | 2022 | 2023 | 2024 | 2025 | Summary Compensation Table Total | $ | 35,189,890 | | $ | 1,096,155 | | $ | 464,876 | | $ | 5,665,078 | | $ | 2,851,838 | | - Grant Date Fair Value of Option Awards and Stock Awards Granted in Fiscal Year | $ | (24,425,697) | | $ | — | | $ | — | | $ | (5,131,120) | | $ | (2,289,840) | | | + Fair Value at Fiscal Year-End of Outstanding and Unvested Option Awards and Stock Awards Granted in Fiscal Year | $ | 22,791,698 | | $ | — | | $ | — | | $ | 2,246,920 | | $ | 1,196,021 | | + Change in Fair Value of Outstanding and Unvested Option Awards and Stock Awards Granted in Prior Fiscal Years | $ | — | | $ | (8,309,712) | | $ | — | | $ | — | | $ | (691,033) | | + Fair Value at Vesting of Option Awards and Stock Awards Granted in Fiscal Year That Vested During Fiscal Year | $ | 800,085 | | $ | (147,490) | | $ | — | | $ | 1,030,382 | | $ | 544,109 | | + Change in Fair Value as of Vesting Date of Option Awards and Stock Awards Granted in Prior Fiscal Years For Which Applicable Vesting Conditions Were Satisfied During Fiscal Year | $ | — | | $ | — | | $ | — | | $ | — | | $ | (198,369) | | - Fair Value as of Prior Fiscal Year-End of Option Awards and Stock Awards Granted in Prior Fiscal Years That Failed to Meet Applicable Vesting Conditions During Fiscal Year(a) | $ | — | | $ | — | | $ | (14,481,986) | | $ | — | | $ | — | | Compensation Actually Paid | $ | 34,355,976 | | $ | (7,361,047) | | $ | (14,017,110) | | $ | 3,811,260 | | $ | 1,412,726 | |
(a) In consultation with Semler Brossy, the Compensation Committee designed a performance-based RSU award (the “CEO Grant”) for Mr. Siegel, whom it considered critical to retain in light of his demonstrated outstanding and exceptional capabilities as Chief Executive Officer since our Company’s inception in 2010. Accordingly, in April 2021 and prior to the Company’s direct listing, we granted Mr. Siegel the CEO Grant, which provided Mr. Siegel the opportunity to earn a maximum of 1,398,000 RSUs upon the satisfaction of certain rigorous price target goals and service conditions. The Compensation Committee considered that, because the vesting of the CEO Grant was tied to achieving aggressive stock price milestones compared to our then-current stock price, which were established prior to our direct listing and without reference to any public trading activity, the CEO Grant was no longer fulfilling its objective of incentivizing our Chief Executive Officer to create sustainable long-term value for our stockholders. Accordingly, in December 2023, we entered into a cancellation agreement with Mr. Siegel, which provided for the cancellation of the CEO Grant. As of the date of the cancellation agreement, none of the performance milestones had been met. Accordingly, Mr. Siegel had not yet earned any of the shares of our common stock pursuant to the CEO Grant. Mr. Siegel did not receive an equity grant in 2023 under the 2021 Plan in light of the then outstanding CEO Grant. The change in fair value of prior fiscal year-end stock awards granted in prior fiscal years that failed to meet applicable vesting conditions during 2023 reflects the cancellation of the CEO Grant in December 2023.
|
|
|
|
|
| Non-PEO NEO Average Total Compensation Amount |
$ 1,907,112
|
3,160,414
|
4,511,560
|
2,228,483
|
6,874,618
|
| Non-PEO NEO Average Compensation Actually Paid Amount |
$ 939,375
|
238,032
|
2,677,586
|
1,368,571
|
11,091,444
|
| Adjustment to Non-PEO NEO Compensation Footnote |
Compensation Actually Paid to Non-PEO NEOs reflects the following adjustments from Total compensation reported in the Summary Compensation Table for the years set forth in the table below: | | | | | | | | | | | | | | | | | | | Prior FYE | 12/31/2020 | 12/31/2021 | 12/31/2022 | 12/31/2023 | 12/31/2024 | | Current FYE | 12/31/2021 | 12/31/2022 | 12/31/2023 | 12/31/2024 | 12/31/2025 | | Fiscal Year | 2021 | 2022 | 2023 | 2024 | 2025 | | Average Summary Compensation Table Total | $ | 6,874,618 | | $ | 2,228,483 | | $ | 4,511,560 | | $ | 3,160,414 | | $ | 1,907,112 | | | - Grant Date Fair Value of Option Awards and Stock Awards Granted in Fiscal Year | $ | (6,326,448) | | $ | (1,542,000) | | $ | (4,087,125) | | $ | (2,778,473) | | $ | (1,341,130) | | | + Fair Value at Fiscal Year-End of Outstanding and Unvested Option Awards and Stock Awards Granted in Fiscal Year | $ | 4,657,545 | | $ | 846,656 | | $ | 1,893,687 | | $ | 825,731 | | $ | 700,497 | | | + Change in Fair Value of Outstanding and Unvested Option Awards and Stock Awards Granted in Prior Fiscal Years | $ | 1,444,580 | | $ | (255,866) | | $ | (215,145) | | $ | (509,856) | | $ | (445,376) | | | + Fair Value at Vesting of Option Awards and Stock Awards Granted in Fiscal Year That Vested During Fiscal Year | $ | 1,363,281 | | $ | 418,922 | | $ | 694,600 | | $ | 432,768 | | $ | 318,674 | | | + Change in Fair Value as of Vesting Date of Option Awards and Stock Awards Granted in Prior Fiscal Years For Which Applicable Vesting Conditions Were Satisfied During Fiscal Year | $ | 3,077,868 | | $ | (327,624) | | $ | (119,991) | | $ | (299,364) | | $ | (200,402) | | | - Fair Value as of Prior Fiscal Year-End of Option Awards and Stock Awards Granted in Prior Fiscal Years That Failed to Meet Applicable Vesting Conditions During Fiscal Year | $ | — | | $ | — | | $ | — | | $ | (593,188) | | $ | — | | | Average Compensation Actually Paid | $ | 11,091,444 | | $ | 1,368,571 | | $ | 2,677,586 | | $ | 238,032 | | $ | 939,375 | |
The amounts reported above include grants under our 2021 AEIP for each officer that elected to receive his or her award in the form of RSUs instead of cash. Pursuant to the terms of the 2021 AEIP, other than our Chief Executive Officer, whose award must be issued as RSUs, each of our Named Executive Officers was eligible to receive a bonus in the form of cash or in the form of RSUs, at the individual’s sole election. The 2021 AEIP awards were recognized as fully vested as of December 31, 2021 in accordance with ASC 718 but were granted in February 2022 and the underlying shares were issued in March 2022. For purposes of calculating the Average Compensation Actually Paid, the unvested awards were considered granted and unvested as of December 31, 2021 and the vesting of the 2021 AEIP was recognized as of March 15, 2022. During the year ended December 31, 2021, one Non-PEO NEO received the right to early exercise their options prior to the vesting date as stipulated in their options agreement. For purposes of calculating the Average Compensation Actually Paid, we recognized the vesting of the early exercised options at the date on which they legally vested in accordance with the terms of the agreement. The change in fair value of prior fiscal year-end stock awards granted in prior fiscal years that failed to meet applicable vesting conditions during 2024 reflects forfeitures related to Mr. Saifee’s resignation from his position as our Chief Operating Officer effective April 30, 2024. Upon his resignation, all unvested RSUs held by Mr. Saifee were forfeited.
|
|
|
|
|
| Equity Valuation Assumption Difference, Footnote |
The fair value or change in fair value, as applicable, of equity awards in the “Compensation Actually Paid” columns has been estimated pursuant to the guidance in FASB ASC Topic 718 by reference to: (1) for RSU awards with time-based service conditions, the Company’s closing price on applicable year-end dates or, in the case of vesting dates, the closing price on the vesting date; (2) for stock options, a Black Scholes value as of the applicable year-end or vesting date(s), determined based on the same methodology as used to determine grant date fair value but using the closing stock price on the applicable revaluation date as the current market price and with an expected life set equal to the remaining life of the award, and in all cases based on volatility and risk free rates determined as of the revaluation date based on the expected life period and based on an expected dividend rate of 0%; and (3) for the CEO Grant (as defined below), Monte Carlo simulation models. For additional information on the assumptions used to estimate the fair value of the awards, see Note 2 “Basis of Presentation, Principles of Consolidation, and Summary of Significant Accounting Policies—Stock-Based Compensation” and Note 16 “Stock-Based Compensation” in the Notes to Consolidated Financial Statements in the 2025 Form 10-K.
|
|
|
|
|
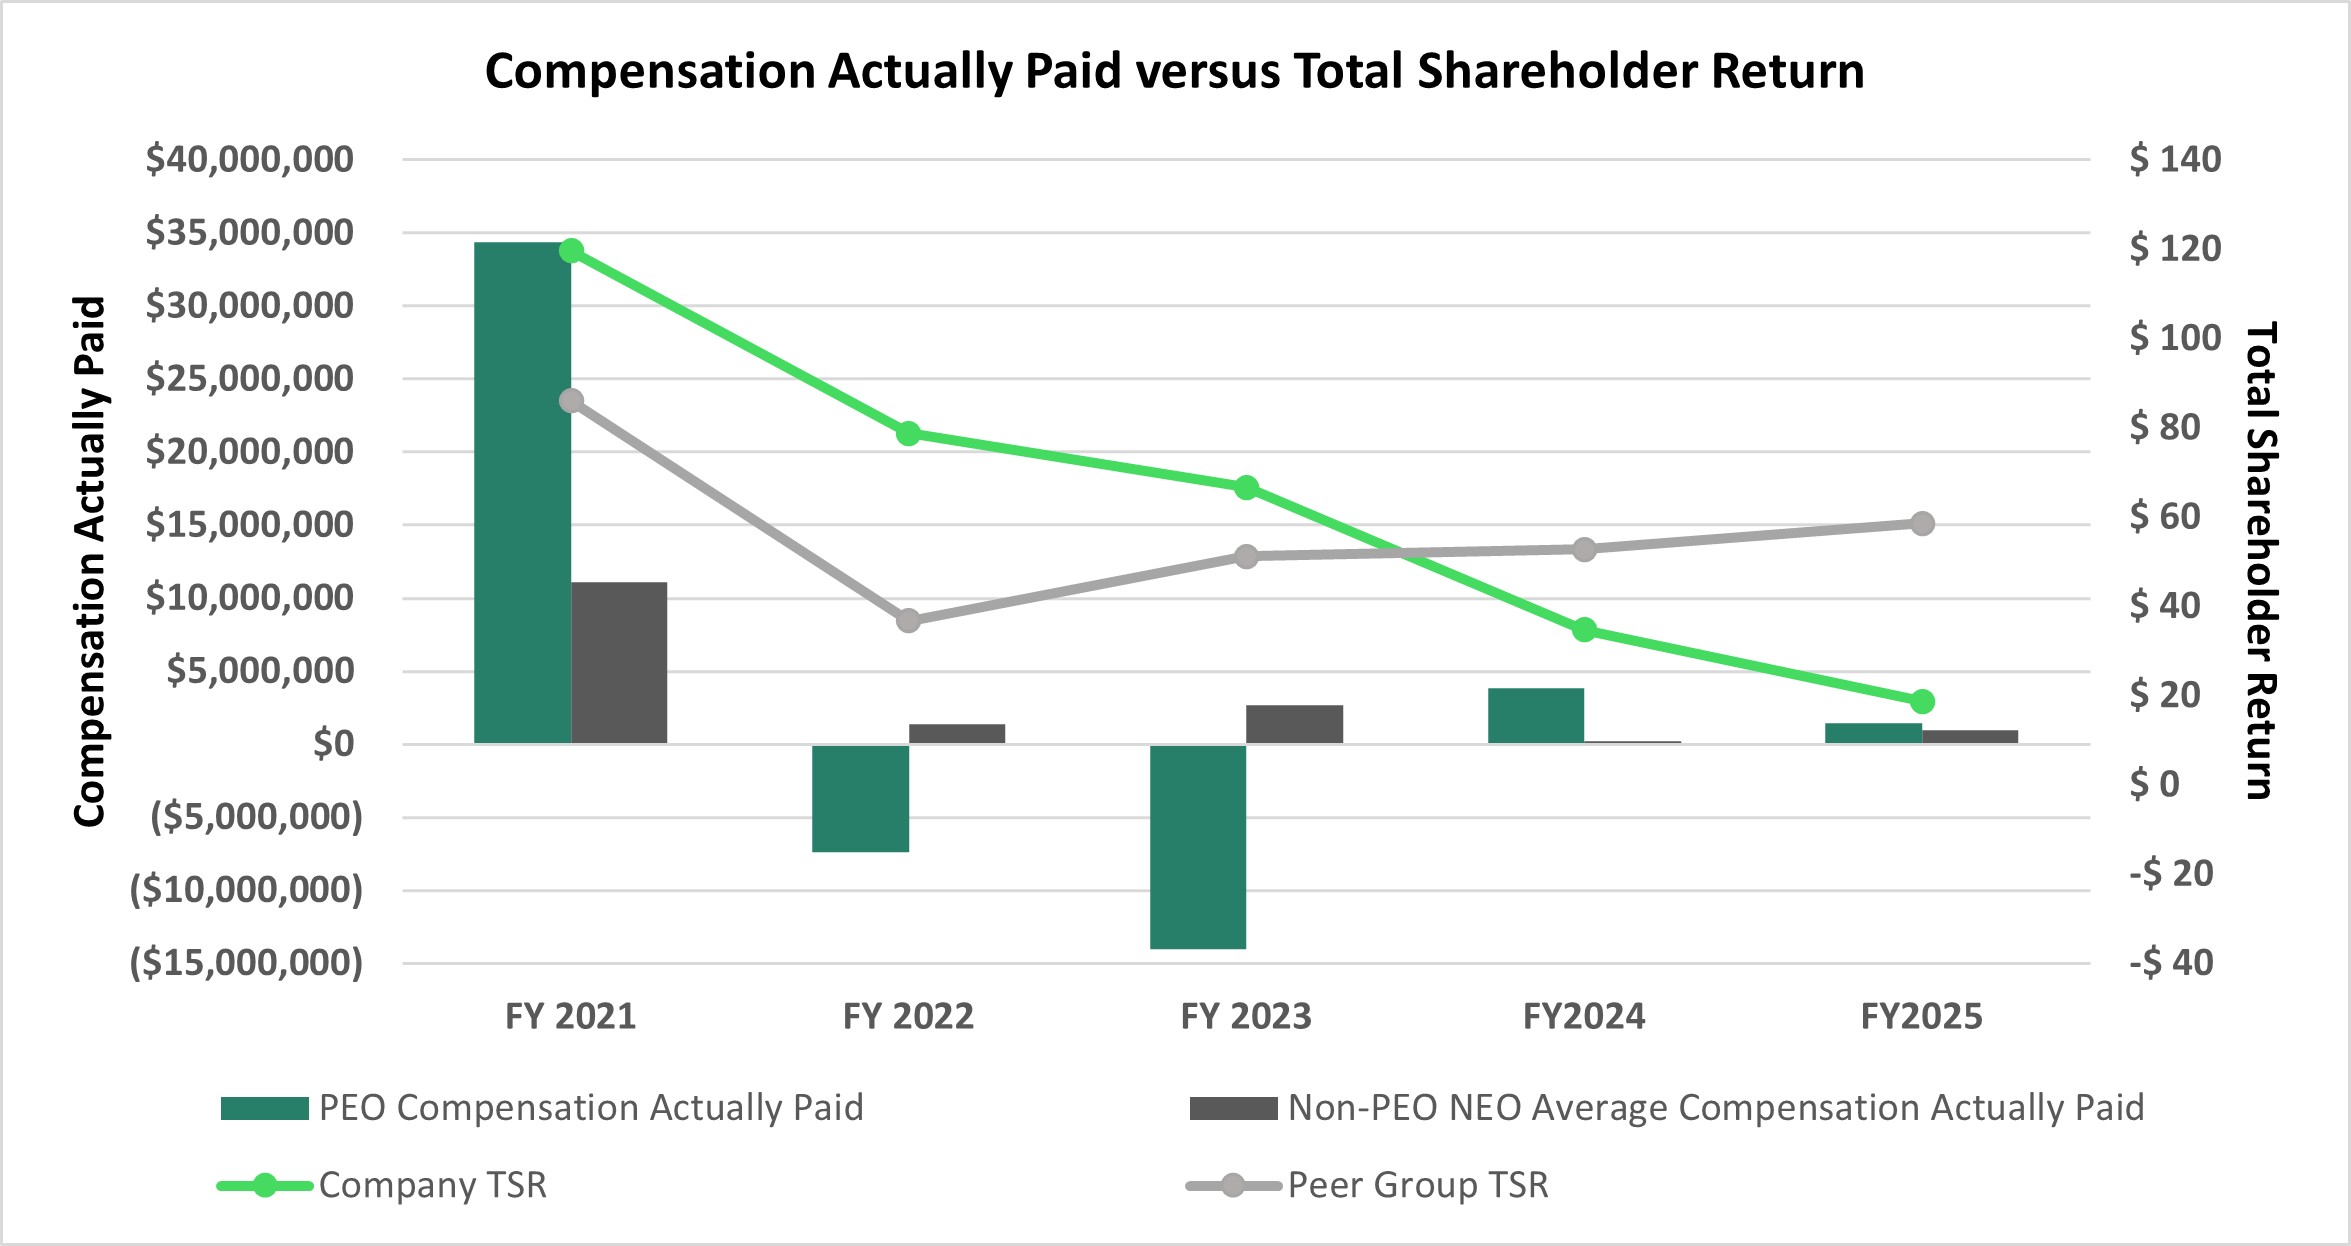
| Compensation Actually Paid vs. Total Shareholder Return |
Compensation Actually Paid versus Total Shareholder Return (“TSR”) TSR in the above chart, in the case of both the Company and our Peer Companies as noted in footnote (6) of the above Pay Versus Performance Table, reflects the cumulative return of $100 as if invested on May 26, 2021 (the date our Class A common stock commenced trading on the NYSE), including reinvestment of any dividends.
|
|
|
|
|
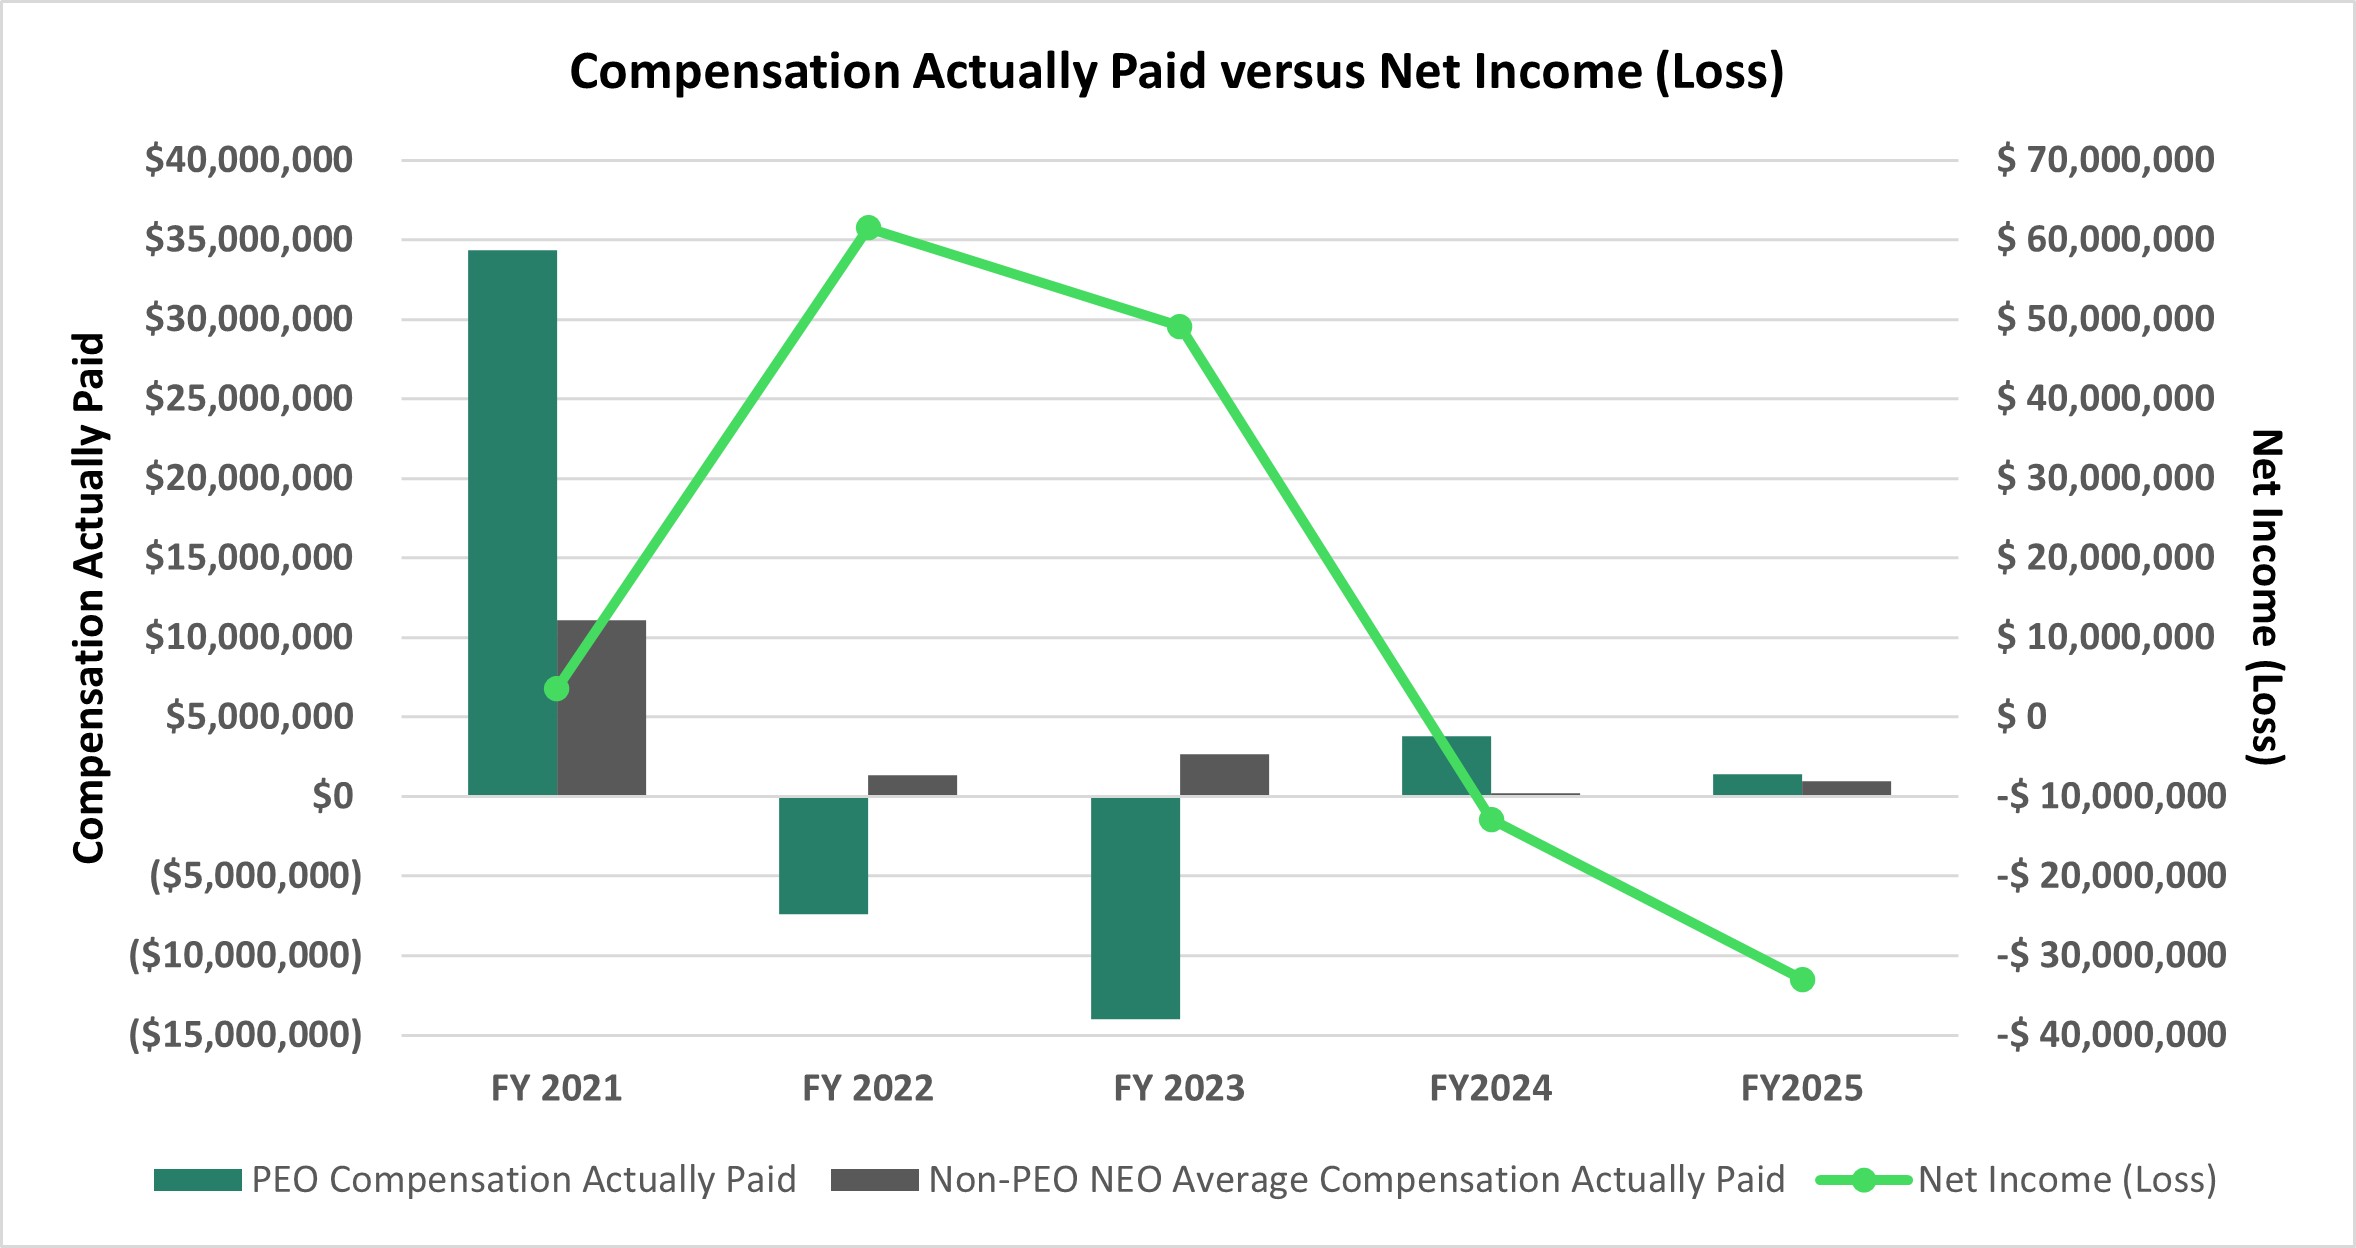
| Compensation Actually Paid vs. Net Income |
Compensation Actually Paid versus Net Income (Loss)
|
|
|
|
|
| Compensation Actually Paid vs. Company Selected Measure |
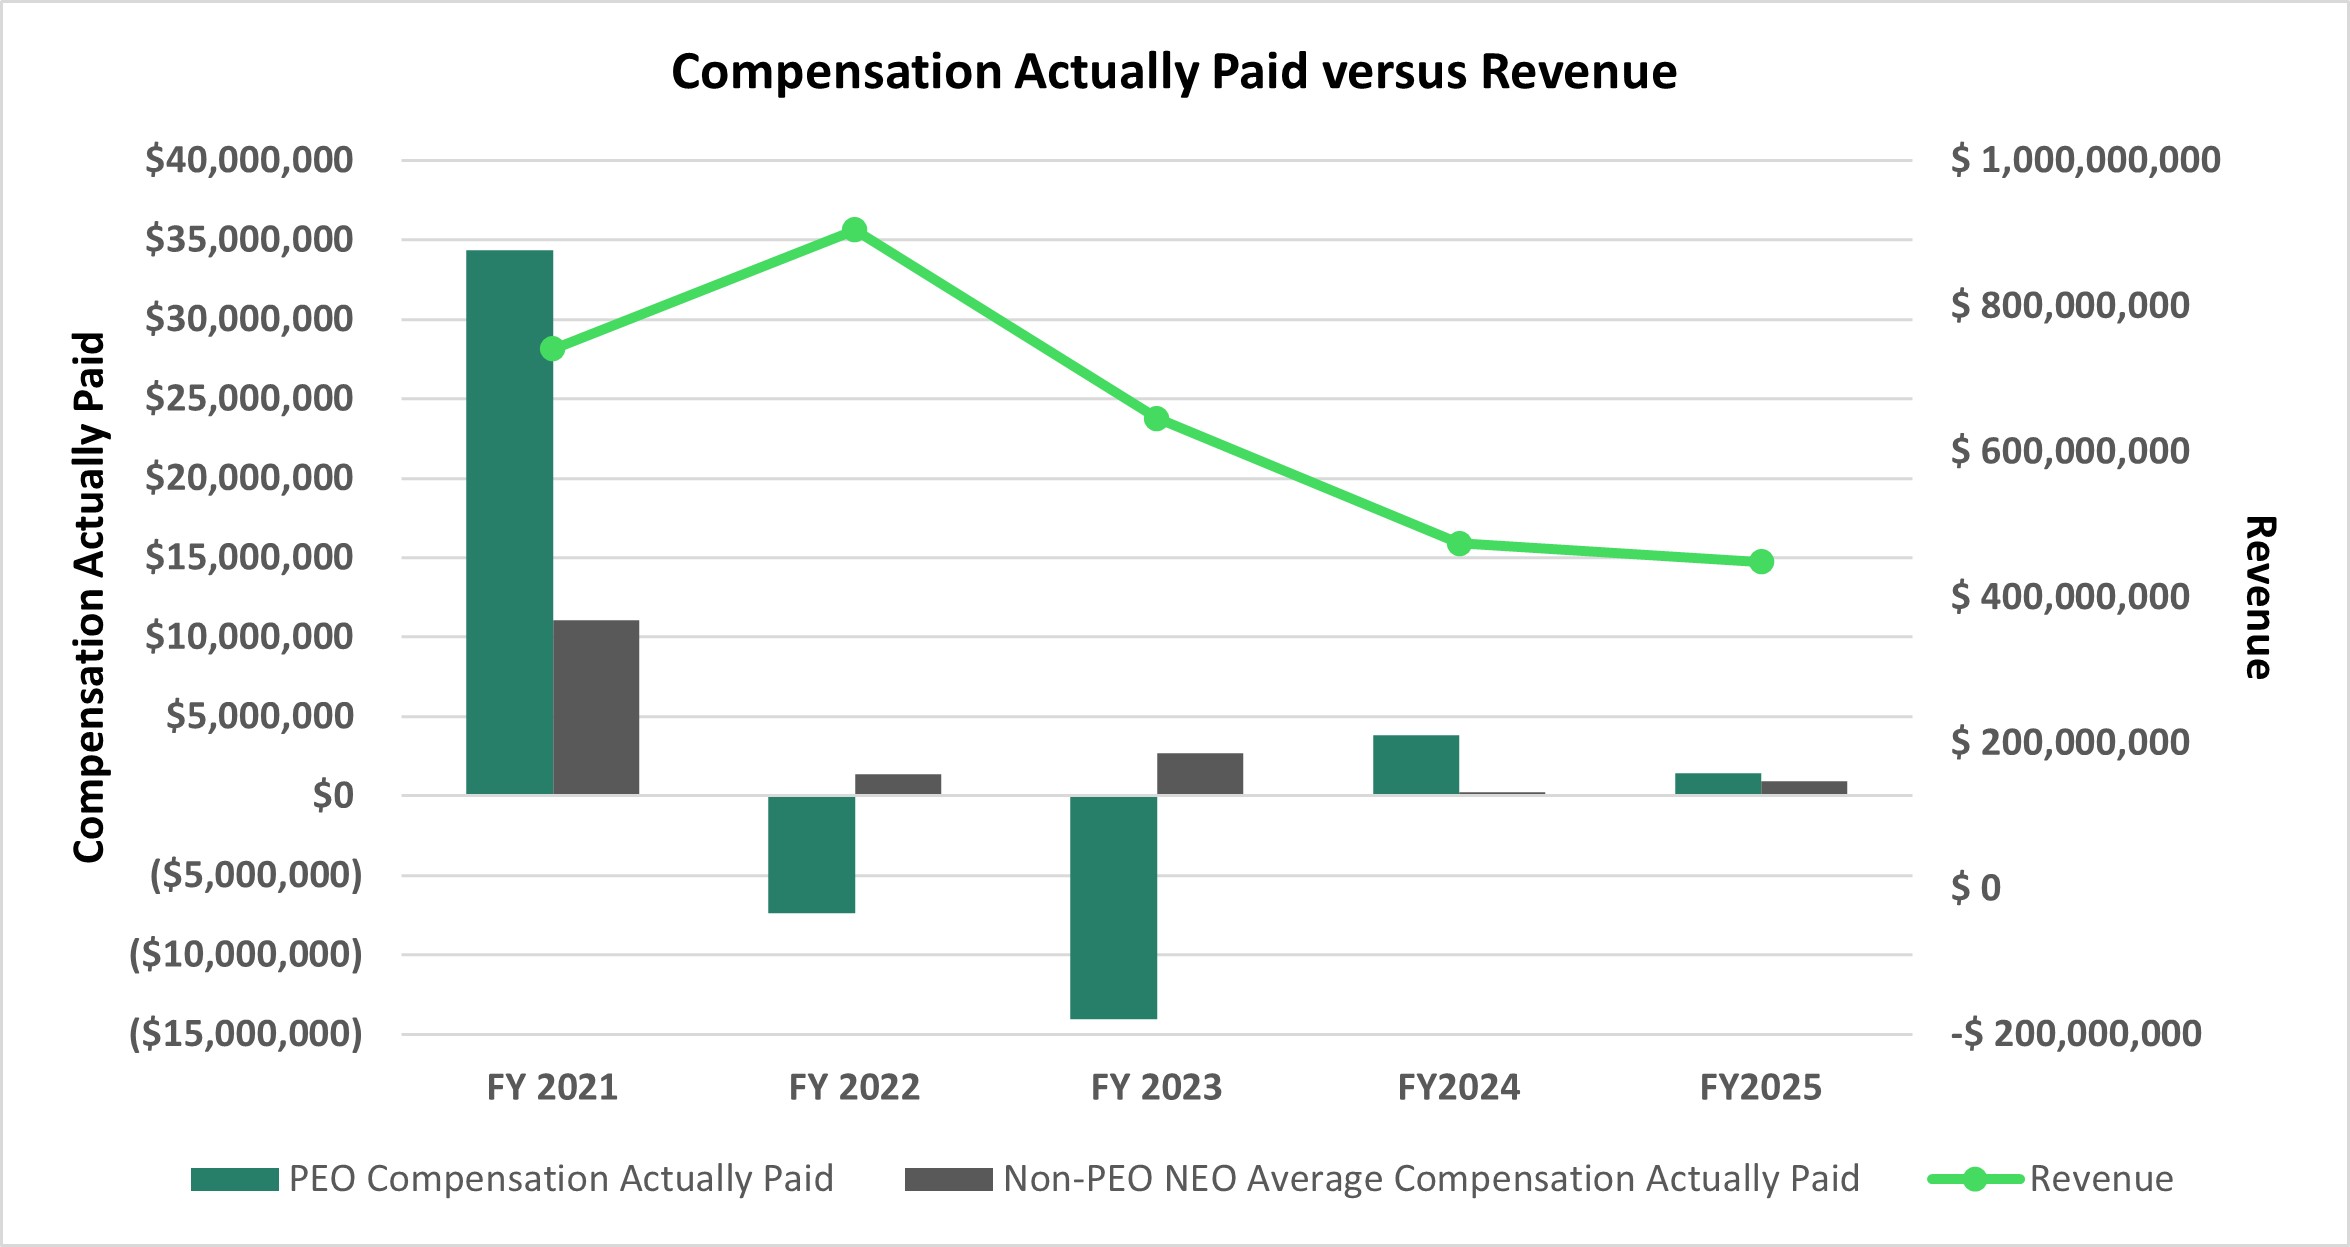
Compensation Actually Paid versus Revenue
|
|
|
|
|
| Tabular List, Table |
Revenue represents the only financial measure that the Company used to link Compensation Actually Paid to our PEO and non-PEO NEOs for 2025 to Company performance.
|
|
|
|
|
| Total Shareholder Return Amount |
$ 18.71
|
34.72
|
66.67
|
78.75
|
119.62
|
| Peer Group Total Shareholder Return Amount |
58.61
|
52.81
|
51.23
|
36.70
|
86.01
|
| Net Income (Loss) |
$ (32,994,000)
|
$ (12,854,000)
|
$ 49,098,000
|
$ 61,494,000
|
$ 3,600,000
|
| Company Selected Measure Amount |
448,952,000
|
474,001,000
|
645,722,000
|
904,649,000
|
741,141,000
|
| PEO Name |
Ian Siegel
|
|
|
|
|
| Additional 402(v) Disclosure |
The dollar amounts reported represent the amount of net income (loss) reflected in our audited financial statements for the applicable fiscal year.We determined revenue to be the most important financial performance measure (that is not otherwise required to be disclosed in the table) used to link Company performance to Compensation Actually Paid to our PEO and Non-PEO NEOs in 2022, 2023, 2024 and 2025. The dollar amounts reported represent the amount of revenue reflected in our audited financial statements for the applicable fiscal year. This performance measure may not have been the most important financial performance measure for 2021 and we may determine a different financial performance measure to be the most important financial performance measure in future years.
|
|
|
|
|
| Measure:: 1 |
|
|
|
|
|
| Pay vs Performance Disclosure |
|
|
|
|
|
| Name |
Revenue
|
|
|
|
|
| PEO | Aggregate Grant Date Fair Value of Equity Award Amounts Reported in Summary Compensation Table |
|
|
|
|
|
| Pay vs Performance Disclosure |
|
|
|
|
|
| Adjustment to Compensation, Amount |
$ (2,289,840)
|
$ (5,131,120)
|
$ 0
|
$ 0
|
$ (24,425,697)
|
| PEO | Year-end Fair Value of Equity Awards Granted in Covered Year that are Outstanding and Unvested |
|
|
|
|
|
| Pay vs Performance Disclosure |
|
|
|
|
|
| Adjustment to Compensation, Amount |
1,196,021
|
2,246,920
|
0
|
0
|
22,791,698
|
| PEO | Year-over-Year Change in Fair Value of Equity Awards Granted in Prior Years That are Outstanding and Unvested |
|
|
|
|
|
| Pay vs Performance Disclosure |
|
|
|
|
|
| Adjustment to Compensation, Amount |
(691,033)
|
0
|
0
|
(8,309,712)
|
0
|
| PEO | Vesting Date Fair Value of Equity Awards Granted and Vested in Covered Year |
|
|
|
|
|
| Pay vs Performance Disclosure |
|
|
|
|
|
| Adjustment to Compensation, Amount |
544,109
|
1,030,382
|
0
|
(147,490)
|
800,085
|
| PEO | Change in Fair Value as of Vesting Date of Prior Year Equity Awards Vested in Covered Year |
|
|
|
|
|
| Pay vs Performance Disclosure |
|
|
|
|
|
| Adjustment to Compensation, Amount |
(198,369)
|
0
|
0
|
0
|
0
|
| PEO | Prior Year End Fair Value of Equity Awards Granted in Any Prior Year that Fail to Meet Applicable Vesting Conditions During Covered Year |
|
|
|
|
|
| Pay vs Performance Disclosure |
|
|
|
|
|
| Adjustment to Compensation, Amount |
0
|
0
|
(14,481,986)
|
0
|
0
|
| Non-PEO NEO | Aggregate Grant Date Fair Value of Equity Award Amounts Reported in Summary Compensation Table |
|
|
|
|
|
| Pay vs Performance Disclosure |
|
|
|
|
|
| Adjustment to Compensation, Amount |
(1,341,130)
|
(2,778,473)
|
(4,087,125)
|
(1,542,000)
|
(6,326,448)
|
| Non-PEO NEO | Year-end Fair Value of Equity Awards Granted in Covered Year that are Outstanding and Unvested |
|
|
|
|
|
| Pay vs Performance Disclosure |
|
|
|
|
|
| Adjustment to Compensation, Amount |
700,497
|
825,731
|
1,893,687
|
846,656
|
4,657,545
|
| Non-PEO NEO | Year-over-Year Change in Fair Value of Equity Awards Granted in Prior Years That are Outstanding and Unvested |
|
|
|
|
|
| Pay vs Performance Disclosure |
|
|
|
|
|
| Adjustment to Compensation, Amount |
(445,376)
|
(509,856)
|
(215,145)
|
(255,866)
|
1,444,580
|
| Non-PEO NEO | Vesting Date Fair Value of Equity Awards Granted and Vested in Covered Year |
|
|
|
|
|
| Pay vs Performance Disclosure |
|
|
|
|
|
| Adjustment to Compensation, Amount |
318,674
|
432,768
|
694,600
|
418,922
|
1,363,281
|
| Non-PEO NEO | Change in Fair Value as of Vesting Date of Prior Year Equity Awards Vested in Covered Year |
|
|
|
|
|
| Pay vs Performance Disclosure |
|
|
|
|
|
| Adjustment to Compensation, Amount |
(200,402)
|
(299,364)
|
(119,991)
|
(327,624)
|
3,077,868
|
| Non-PEO NEO | Prior Year End Fair Value of Equity Awards Granted in Any Prior Year that Fail to Meet Applicable Vesting Conditions During Covered Year |
|
|
|
|
|
| Pay vs Performance Disclosure |
|
|
|
|
|
| Adjustment to Compensation, Amount |
$ 0
|
$ (593,188)
|
$ 0
|
$ 0
|
$ 0
|