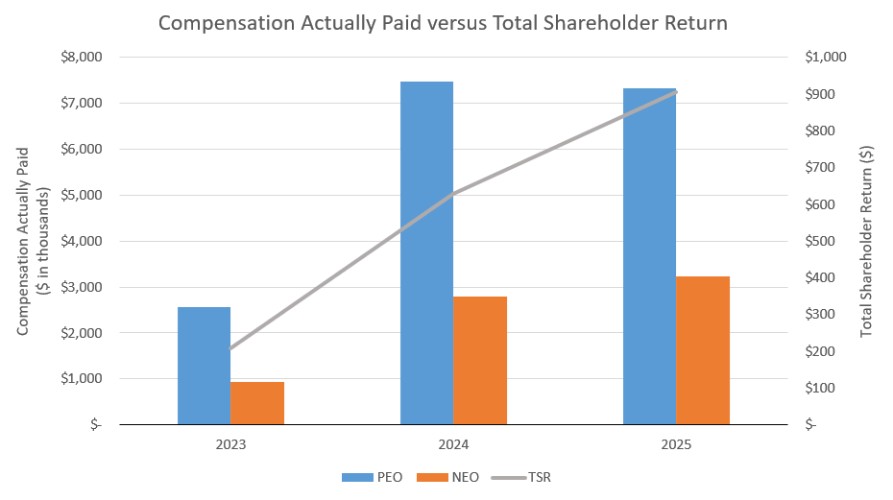
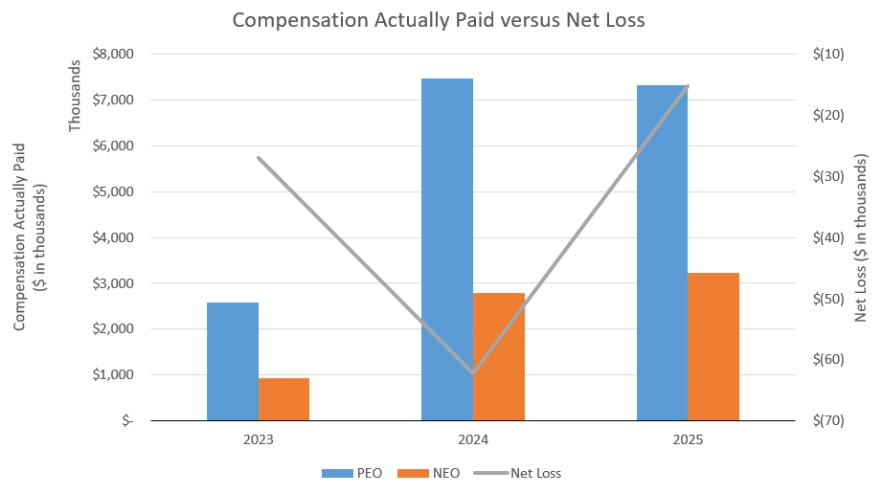
| | | Average Summary | | Average | | Value of Initial Fixed | | ||||
Summary | Compensation | Compensation Table | Compensation | $100 investment Based | ||||||||
Compensation Table | Actually Paid | Total for Non-PEO | Actually Paid | on Total Shareholder | Net Loss | |||||||
Year | Total for PEO ($) | to PEO ($) (1) | NEOs ($) | to Non-PEO NEOs ($) (1) | Return ("TSR") ($) (2) | ($ in millions) | ||||||
2025 |
| 7,031,566 |
| 7,325,075 |
| 3,184,632 |
| 3,238,187 |
| 905.88 |
| (15.3) |
2024 |
| 3,073,170 |
| 7,473,091 |
| 1,592,174 |
| 2,786,445 |
| 629.41 |
| (62.3) |
2023 | 1,321,351 | 2,573,371 | 638,510 | 928,436 | 207.06 | (27.0) |
| (1) | Amounts represent compensation actually paid (“CAP”) to our CEO, Richard Miller, M.D., who was our Principal Executive Officer or “PEO” for each of the two years shown, and the average CAP to our remaining NEOs or “Non-PEO NEOs” for the relevant fiscal year, as determined under SEC rules, which includes Leiv Lea and William B. Jones, Ph.D. |
Amounts represent the Summary Compensation Table Total Compensation for the applicable fiscal year adjusted as follows:
Fiscal Year ("FY") | 2025 | ||
Average non- | |||
PEO | PEO NEOs | ||
Deduction for ASC 718 Fair Value as of Grant Date Reported under the Option Awards Columns in the Summary Compensation Table | (6,989,000) |
| (2,795,600) |
Increase based on ASC 718 Fair Value of Awards Granted during the FY that Remain Unvested as of FY End (“FYE”) | 5,907,717 |
| 2,363,087 |
Increase based on ASC 718 Fair Value of Awards Granted during the FY that Vested during the FY as of Vesting Date | — | — | |
Increase/deduction based on ASC 718 Fair Value of Outstanding Unvested Prior FY Awards as of FYE Compared to Valuation as of Prior FYE | 1,473,617 | 543,004 | |
Increase/deduction based on ASC 718 Fair Value of Prior FY Awards that Vested during the FY as of Vesting Date Compared to Valuation as of Prior FYE | (98,825) | (56,936) | |
Total Adjustments | 293,509 | 53,555 | |
| (2) | TSR is calculated by dividing the sum of the cumulative amount of dividends for the measurement period, assuming dividend reinvestment, and the difference between our company’s share price at the end and the beginning of the measurement period by our company’s share price at the beginning of the measurement period. The Company’s share price at the beginning of the measurement period is the closing share price of $0.85 on December 30, 2022, the last trading day of fiscal year 2022, and the Company’s share price at end of the measurement period is the closing share price of $7.70 on December 31, 2025, the last trading day of fiscal year 2025. No dividends were paid on our common stock in 2023, 2024 or 2025. |
| (1) | Amounts represent compensation actually paid (“CAP”) to our CEO, Richard Miller, M.D., who was our Principal Executive Officer or “PEO” for each of the two years shown, and the average CAP to our remaining NEOs or “Non-PEO NEOs” for the relevant fiscal year, as determined under SEC rules, which includes Leiv Lea and William B. Jones, Ph.D. |
Amounts represent the Summary Compensation Table Total Compensation for the applicable fiscal year adjusted as follows:
Fiscal Year ("FY") | 2025 | ||
Average non- | |||
PEO | PEO NEOs | ||
Deduction for ASC 718 Fair Value as of Grant Date Reported under the Option Awards Columns in the Summary Compensation Table | (6,989,000) |
| (2,795,600) |
Increase based on ASC 718 Fair Value of Awards Granted during the FY that Remain Unvested as of FY End (“FYE”) | 5,907,717 |
| 2,363,087 |
Increase based on ASC 718 Fair Value of Awards Granted during the FY that Vested during the FY as of Vesting Date | — | — | |
Increase/deduction based on ASC 718 Fair Value of Outstanding Unvested Prior FY Awards as of FYE Compared to Valuation as of Prior FYE | 1,473,617 | 543,004 | |
Increase/deduction based on ASC 718 Fair Value of Prior FY Awards that Vested during the FY as of Vesting Date Compared to Valuation as of Prior FYE | (98,825) | (56,936) | |
Total Adjustments | 293,509 | 53,555 | |