Pay vs Performance Disclosure - USD ($)
Dec. 31, 2025
Dec. 31, 2024
Dec. 31, 2023
Dec. 31, 2022
Dec. 31, 2021
PAY VERSUS PERFORMANCE
As required by Item 402(v) of Regulation
S-K,
we are providing the following information about the relationship between compensation actually paid (as defined in Item 402(v)) and performance. Year (a) |
Summary Compensation Table Total for First Principal Executive Officer (PEO) (1),(2) (b) |
Compensation Actually Paid to First PEO (2),(3) (c) |
Average Summary Compensation Table Total for Non-PEO Named Executive Officers (NEOs) (1),(4) (f) |
Average Compensation Actually Paid to Non-PEO Named Executive Officers (4),(5) (g) |
Value of Initial Fixed $100 Investment Based On: |
Net Income (millions) (7) (j) |
Adjusted EBITDA (millions) (8) (k) | |||||||||||||||||||||||||||||||||
Total Shareholder Return (h) |
Peer Group Total Shareholder Return (6) (i) | |||||||||||||||||||||||||||||||||||||||
2025 |
$ |
14,240,154 |
$ |
2,579,609 |
$ |
5,009,560 |
$ |
1,017,423 |
$ |
25 |
$ |
99 |
$ |
(579.4 |
) |
$ |
151.2 |
|||||||||||||||||||||||
2024 |
$ |
11,136,185 |
$ |
(9,303,498 |
) |
$ |
4,068,719 |
$ |
(1,879,686 |
) |
$ |
70 |
$ |
81 |
$ |
(93.5 |
) |
$ |
160.5 |
|||||||||||||||||||||
2023 |
$ |
8,931,288 |
$ |
20,107,978 |
$ |
3,194,539 |
$ |
4,423,729 |
$ |
206 |
$ |
82 |
$ |
(142.3 |
) |
$ |
194.7 |
|||||||||||||||||||||||
2022 |
$ |
7,725,414 |
$ |
11,798,548 |
$ |
2,510,071 |
$ |
2,954,548 |
$ |
175 |
$ |
77 |
$ |
(19.2 |
) |
$ |
106.3 |
|||||||||||||||||||||||
2021 |
$ |
6,526,285 |
$ |
21,855,154 |
$ |
1,642,000 |
$ |
3,128,760 |
$ |
173 |
$ |
96 |
$ |
(37.6 |
) |
$ |
66.0 |
|||||||||||||||||||||||
(1) |
The PEO for 2025 was Seth Blackley, and the non-PEO NEOs for 2025 were John Johnson, Daniel McCarthy, Emily Rafferty and Jonathan Weinberg. The PEO for 2024 was Seth Blackley, and the non-PEO NEOs for 2024 were John Johnson, Daniel McCarthy, Emily Rafferty, and Jonathan Weinberg. The PEO for 2023 was Seth Blackley, and the non-PEO NEOs for 2023 were John Johnson, Daniel McCarthy, Emily Rafferty, Steve Tutewohl, and Jonathan Weinberg. The PEO for 2022 was Seth Blackley, and the non-PEO NEOs for 2022 were John Johnson, Daniel McCarthy, Steve Tutewohl, and Jonathan Weinberg. The PEO for 2021 was Seth Blackley, and the non-PEO NEOs for 2021 were John Johnson, Steve Tutewohl, Jonathan Weinberg, and Aammaad Shams. |
(2) |
The dollar amounts reported in column (b) are the amounts of total compensation reported for Seth Blackley for each corresponding year in the “Total” column of the Summary Compensation Table. Refer to “Summary Compensation Table.” |
(3) |
The dollar amounts reported in column (c) represent the amount of “compensation actually paid” to Seth Blackley, as computed in accordance with Item 402(v) of Regulation S-K. The dollar amounts do not reflect the actual amount of compensation earned by or paid to Seth Blackley during the applicable year. In accordance with the requirements of Item 402(v) of Regulation S-K, the following adjustments were made to Blackley’s total compensation for each year to determine the compensation actually paid: |
Year |
Reported Summary Compensation Table Total for First PEO |
Deduct Reported Value of Equity Awards |
Add Equity Award Adjustments (a) |
Compensation Actually Paid to First PEO (a) | ||||||||||||||||
2025 |
$ |
14,240,154 |
($ |
12,699,086) |
$ |
1,038,541 |
$ |
2,579,609 |
||||||||||||
Pay Versus Performance
(a) |
Since the Company does not provide any qualified or non-qualified defined benefit pension plans or other post-employment defined benefit plans to our executive officers, no adjustments relating to defined benefit and pension plans (as applicable) were made to total compensation for each year to determine compensation actually paid. The equity award adjustments for each applicable year include the addition (or subtraction, as applicable) of the following: (i) the year-end fair value of any equity awards granted in the applicable year that are outstanding and unvested as of the end of the year; (ii) the amount of change as of the end of the applicable year (from the end of the prior fiscal year) in fair value of any awards granted in prior years that are outstanding and unvested as of the end of the applicable year; (iii) for awards that are granted and vest in the same applicable year, the fair value as of the vesting date; (iv) for awards granted in prior years that vest in the applicable year, the amount equal to the change as of the vesting date (from the end of the prior fiscal year) in fair value; (v) for awards granted in prior years that are determined to fail to meet the applicable vesting conditions during the applicable year, a deduction for the amount equal to the fair value at the end of the prior fiscal year; and (vi) the dollar value of any dividends or other earnings paid on stock or option awards in the applicable year prior to the vesting date that are not otherwise reflected in the fair value of such award or included in any other component of total compensation for the applicable year. The valuation assumptions used to calculate fair values did not materially differ from those disclosed at the time of grant. The amounts deducted or added in calculating the equity award adjustments are as follows: |
| |
|
Total Equity Award Adjustments for First PEO | ||||||||||||||||||||||||||||
Year |
Deduct Grant Date Fair Value of Equity Awards Disclosed in the Summary Compensation Table |
Add Year End Fair Value of Equity Awards Granted During the Covered Year |
Add Change in Fair Value of Outstanding and Unvested Equity Awards |
Value of Awards Granted in Prior Years Vesting During the Covered Year |
Subtract Fair Value of Awards Granted in Prior Years that Fail to Meet Applicable Vesting Conditions During the Covered Year |
Total Equity Award Adjustments for First PEO | ||||||||||||||||||||||||
2025 |
($ |
12,699,086 |
) |
$ |
3,546,027 |
($ |
781,203 |
) |
($ |
642,131 |
) |
($ |
1,084,151 |
) |
$ |
1,038,541 |
||||||||||||||
(4) |
The dollar amounts reported in column (f) represent the average of the amounts reported for the non-PEO NEOs as a group in the “Total” column of the Summary Compensation Table in each applicable year. |
(5) |
The dollar amounts reported in column (g) represent the average amount of “compensation actually paid” to the non-PEO NEOs as a group, as computed in accordance with Item 402(v) of Regulation S-K. The dollar amounts do not reflect the actual average amount of compensation earned by or paid to the non-PEO NEOs as a group during the applicable year. In accordance with the requirements of Item 402(v) of Regulation S-K, the following adjustments were made to average total compensation for the non-PEO NEOs as a group for each year to determine the compensation actually paid, using the same methodology described above in Note 3: |
Year |
Average Reported Summary Compensation Table Total for Non-PEO NEOs |
Deduct Average Reported Value of Equity Awards |
Add Average Equity Award Adjustments (a) |
Average Compensation Actually Paid to Non-PEO NEOs (a) | ||||||||||||||||
2025 |
$ |
5,009,560 |
($ |
4,210,690) |
$ |
218,553 |
$ |
1,017,423 |
||||||||||||
Pay Versus Performance
(a) |
The following adjustments were made to the average reported value of equity awards disclosed in the summary compensation table for our non-PEO NEOs to determine compensation actually paid, using the same methodology described above in Note 3(a): |
Year |
Deduct Grant Date Fair Value of Equity Awards Disclosed in the Summary Compensation Table |
Add Year End Fair Value of Equity Awards Granted During the Covered Year |
Add Change in Fair Value of Outstanding and Unvested Equity Awards |
Add Change in Fair Value of Outstanding and Unvested Equity Awards |
Subtract Fair Value of Awards Granted in Prior Years that Fail to Meet Applicable Vesting Conditions During the Covered Year |
Average Total Equity Award Adjustments for Non-PEO NEOs | ||||||||||||||||||||||||
2025 |
($ |
4,210,690 |
) |
$ |
1,211,993 |
($ |
385,113 |
) |
($ |
322,658 |
) |
($ |
285,668 |
) |
$ |
218,553 |
||||||||||||||
(6) |
Reflects the Nasdaq Healthcare Index, as disclosed by Evolent for the purposes of Item 201(e) of Regulation S-K. |
(7) |
The dollar amounts reported represent the amount of net income reflected in the Company’s audited financial statements for the applicable year. |
(8) |
The Company believes Adjusted EBITDA is the financial performance measure most closely linked to the calculation of compensation actually paid. Adjusted EBITDA is a non-GAAP measure. Refer to Appendix A of this proxy for a reconciliation to net loss attributable to common shareholders of the Company. |
(1) |
The PEO for 2025 was Seth Blackley, and the non-PEO NEOs for 2025 were John Johnson, Daniel McCarthy, Emily Rafferty and Jonathan Weinberg. The PEO for 2024 was Seth Blackley, and the non-PEO NEOs for 2024 were John Johnson, Daniel McCarthy, Emily Rafferty, and Jonathan Weinberg. The PEO for 2023 was Seth Blackley, and the non-PEO NEOs for 2023 were John Johnson, Daniel McCarthy, Emily Rafferty, Steve Tutewohl, and Jonathan Weinberg. The PEO for 2022 was Seth Blackley, and the non-PEO NEOs for 2022 were John Johnson, Daniel McCarthy, Steve Tutewohl, and Jonathan Weinberg. The PEO for 2021 was Seth Blackley, and the non-PEO NEOs for 2021 were John Johnson, Steve Tutewohl, Jonathan Weinberg, and Aammaad Shams. |
S-K.
(3) |
The dollar amounts reported in column (c) represent the amount of “compensation actually paid” to Seth Blackley, as computed in accordance with Item 402(v) of Regulation S-K. The dollar amounts do not reflect the actual amount of compensation earned by or paid to Seth Blackley during the applicable year. In accordance with the requirements of Item 402(v) of Regulation S-K, the following adjustments were made to Blackley’s total compensation for each year to determine the compensation actually paid: |
Year |
Reported Summary Compensation Table Total for First PEO |
Deduct Reported Value of Equity Awards |
Add Equity Award Adjustments (a) |
Compensation Actually Paid to First PEO (a) | ||||||||||||||||
2025 |
$ |
14,240,154 |
($ |
12,699,086) |
$ |
1,038,541 |
$ |
2,579,609 |
||||||||||||
Pay Versus Performance
(a) |
Since the Company does not provide any qualified or non-qualified defined benefit pension plans or other post-employment defined benefit plans to our executive officers, no adjustments relating to defined benefit and pension plans (as applicable) were made to total compensation for each year to determine compensation actually paid. The equity award adjustments for each applicable year include the addition (or subtraction, as applicable) of the following: (i) the year-end fair value of any equity awards granted in the applicable year that are outstanding and unvested as of the end of the year; (ii) the amount of change as of the end of the applicable year (from the end of the prior fiscal year) in fair value of any awards granted in prior years that are outstanding and unvested as of the end of the applicable year; (iii) for awards that are granted and vest in the same applicable year, the fair value as of the vesting date; (iv) for awards granted in prior years that vest in the applicable year, the amount equal to the change as of the vesting date (from the end of the prior fiscal year) in fair value; (v) for awards granted in prior years that are determined to fail to meet the applicable vesting conditions during the applicable year, a deduction for the amount equal to the fair value at the end of the prior fiscal year; and (vi) the dollar value of any dividends or other earnings paid on stock or option awards in the applicable year prior to the vesting date that are not otherwise reflected in the fair value of such award or included in any other component of total compensation for the applicable year. The valuation assumptions used to calculate fair values did not materially differ from those disclosed at the time of grant. The amounts deducted or added in calculating the equity award adjustments are as follows: |
| |
|
Total Equity Award Adjustments for First PEO | ||||||||||||||||||||||||||||
Year |
Deduct Grant Date Fair Value of Equity Awards Disclosed in the Summary Compensation Table |
Add Year End Fair Value of Equity Awards Granted During the Covered Year |
Add Change in Fair Value of Outstanding and Unvested Equity Awards |
Value of Awards Granted in Prior Years Vesting During the Covered Year |
Subtract Fair Value of Awards Granted in Prior Years that Fail to Meet Applicable Vesting Conditions During the Covered Year |
Total Equity Award Adjustments for First PEO | ||||||||||||||||||||||||
2025 |
($ |
12,699,086 |
) |
$ |
3,546,027 |
($ |
781,203 |
) |
($ |
642,131 |
) |
($ |
1,084,151 |
) |
$ |
1,038,541 |
||||||||||||||
(5) |
The dollar amounts reported in column (g) represent the average amount of “compensation actually paid” to the non-PEO NEOs as a group, as computed in accordance with Item 402(v) of Regulation S-K. The dollar amounts do not reflect the actual average amount of compensation earned by or paid to the non-PEO NEOs as a group during the applicable year. In accordance with the requirements of Item 402(v) of Regulation S-K, the following adjustments were made to average total compensation for the non-PEO NEOs as a group for each year to determine the compensation actually paid, using the same methodology described above in Note 3: |
Year |
Average Reported Summary Compensation Table Total for Non-PEO NEOs |
Deduct Average Reported Value of Equity Awards |
Add Average Equity Award Adjustments (a) |
Average Compensation Actually Paid to Non-PEO NEOs (a) | ||||||||||||||||
2025 |
$ |
5,009,560 |
($ |
4,210,690) |
$ |
218,553 |
$ |
1,017,423 |
||||||||||||
Pay Versus Performance
(a) |
The following adjustments were made to the average reported value of equity awards disclosed in the summary compensation table for our non-PEO NEOs to determine compensation actually paid, using the same methodology described above in Note 3(a): |
Year |
Deduct Grant Date Fair Value of Equity Awards Disclosed in the Summary Compensation Table |
Add Year End Fair Value of Equity Awards Granted During the Covered Year |
Add Change in Fair Value of Outstanding and Unvested Equity Awards |
Add Change in Fair Value of Outstanding and Unvested Equity Awards |
Subtract Fair Value of Awards Granted in Prior Years that Fail to Meet Applicable Vesting Conditions During the Covered Year |
Average Total Equity Award Adjustments for Non-PEO NEOs | ||||||||||||||||||||||||
2025 |
($ |
4,210,690 |
) |
$ |
1,211,993 |
($ |
385,113 |
) |
($ |
322,658 |
) |
($ |
285,668 |
) |
$ |
218,553 |
||||||||||||||
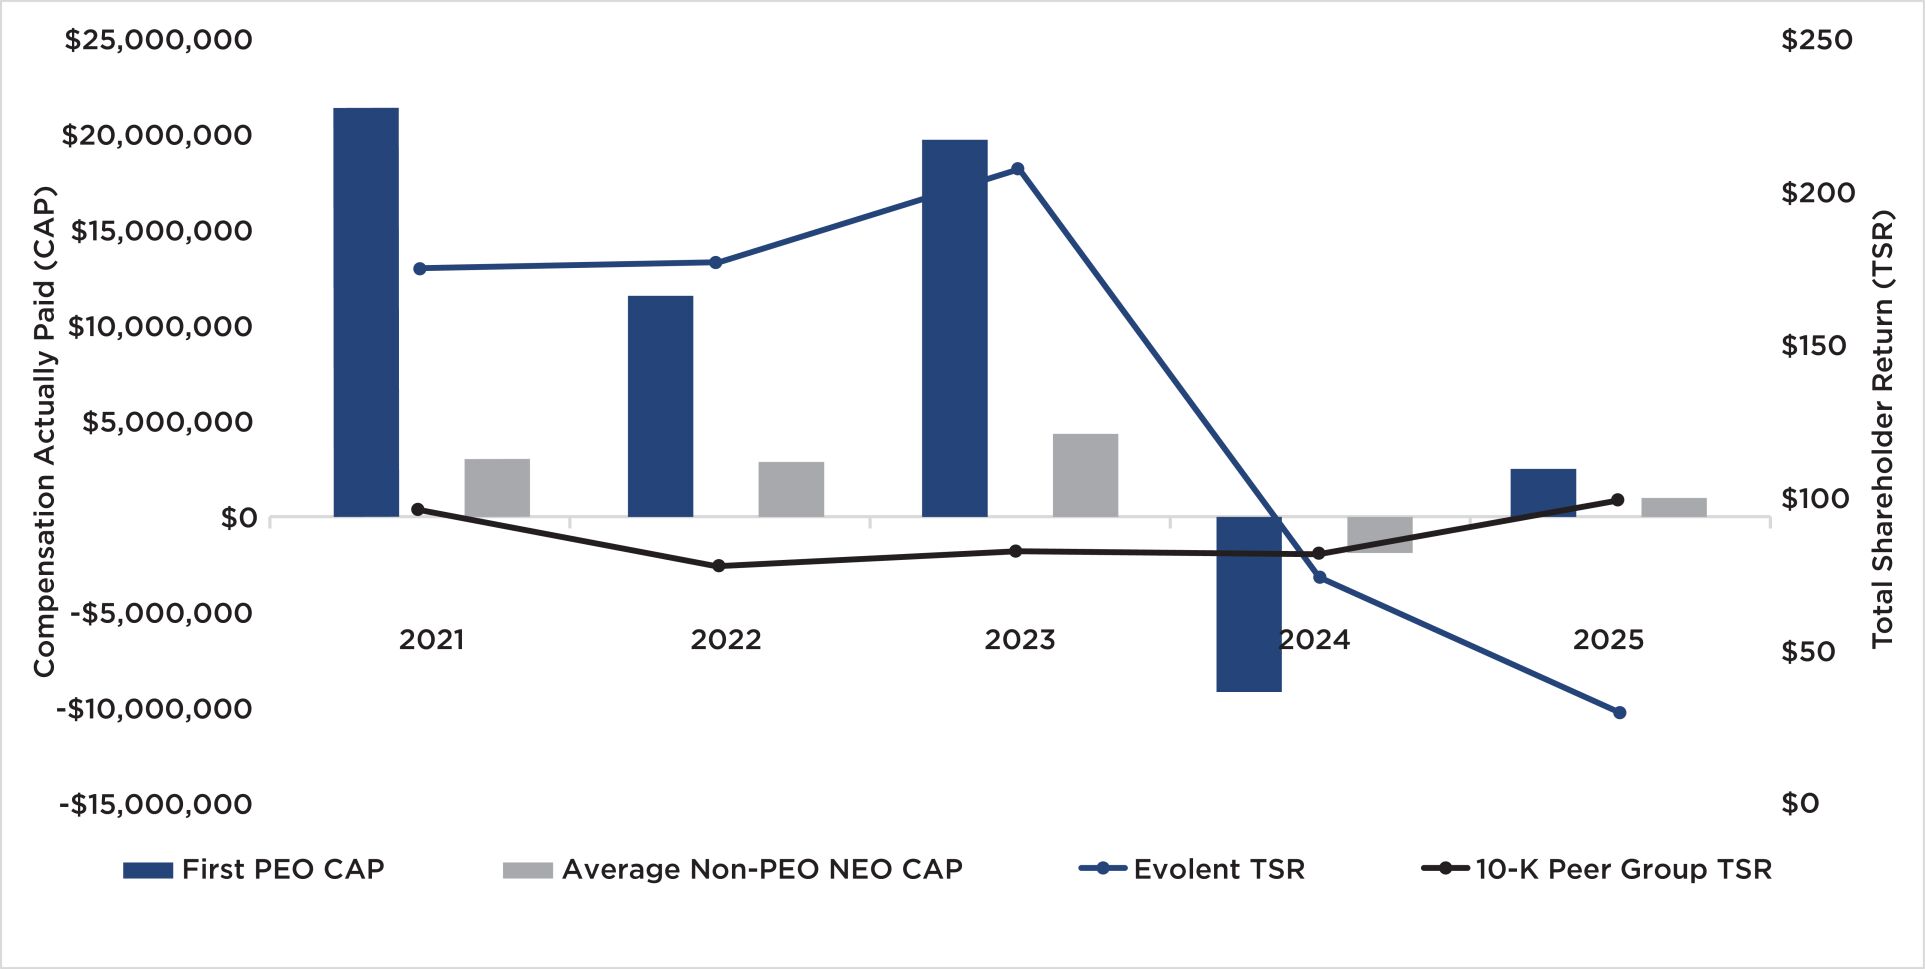
Analysis of the Information Presented in the Pay versus Performance Table: CAP vs. TSR
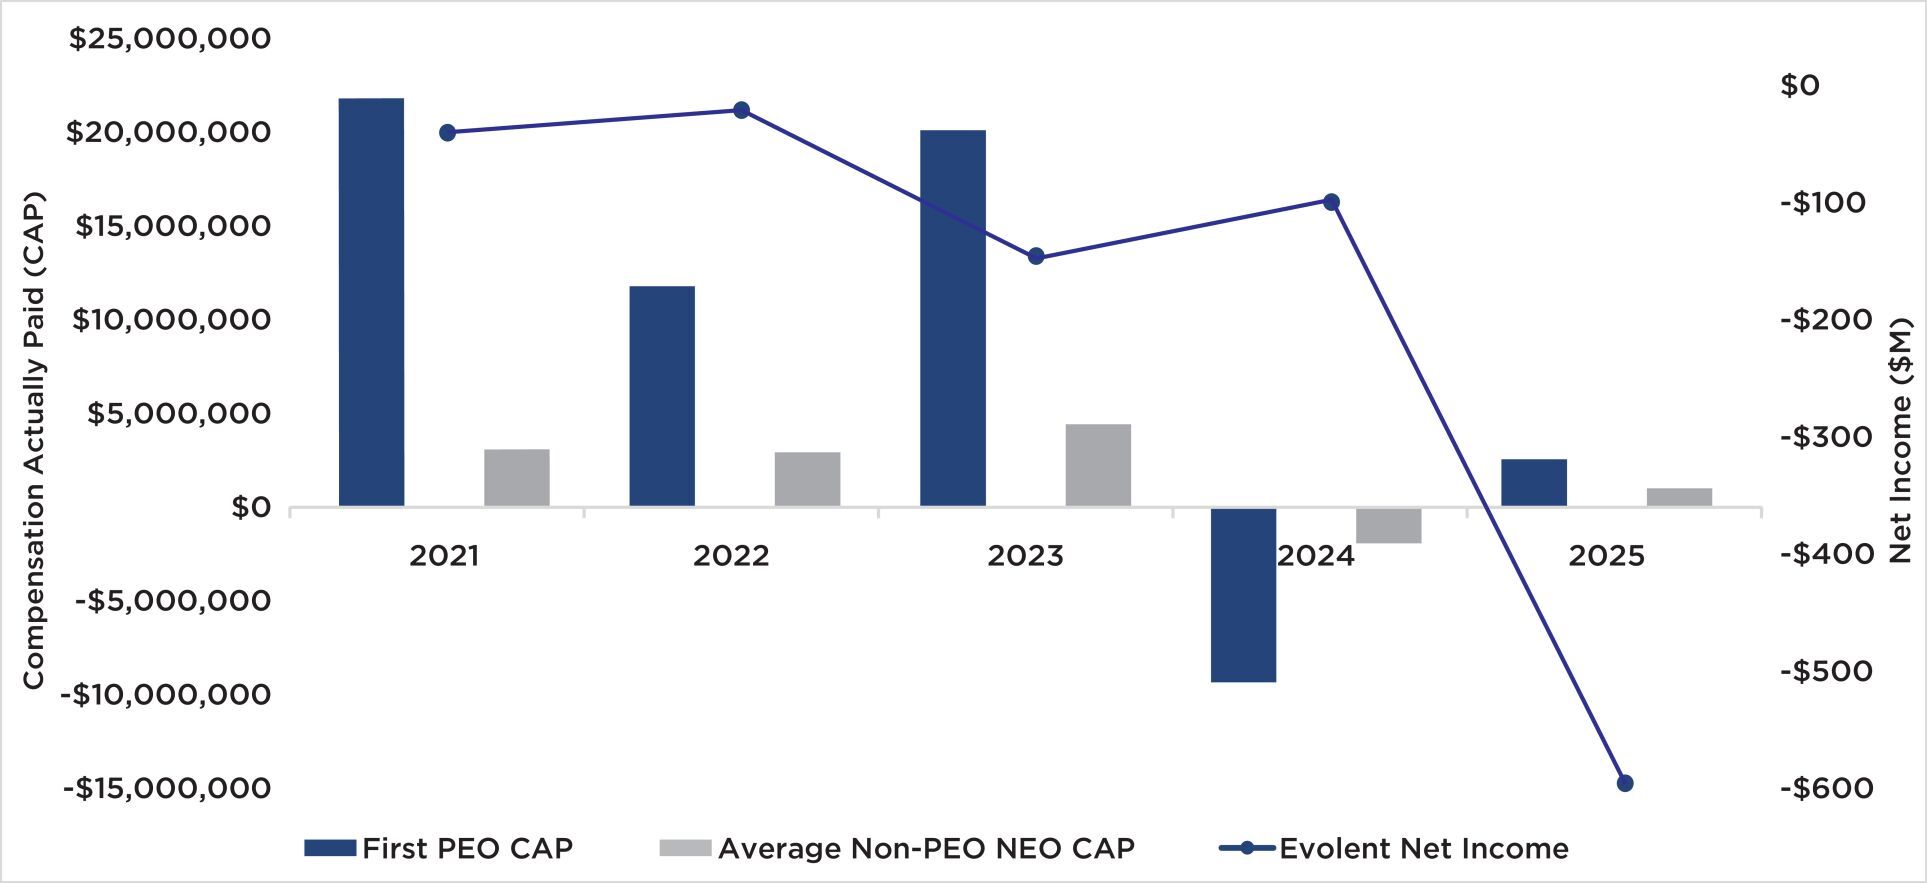
Analysis of the Information Presented in the Pay versus Performance Table: CAP vs. Net Income
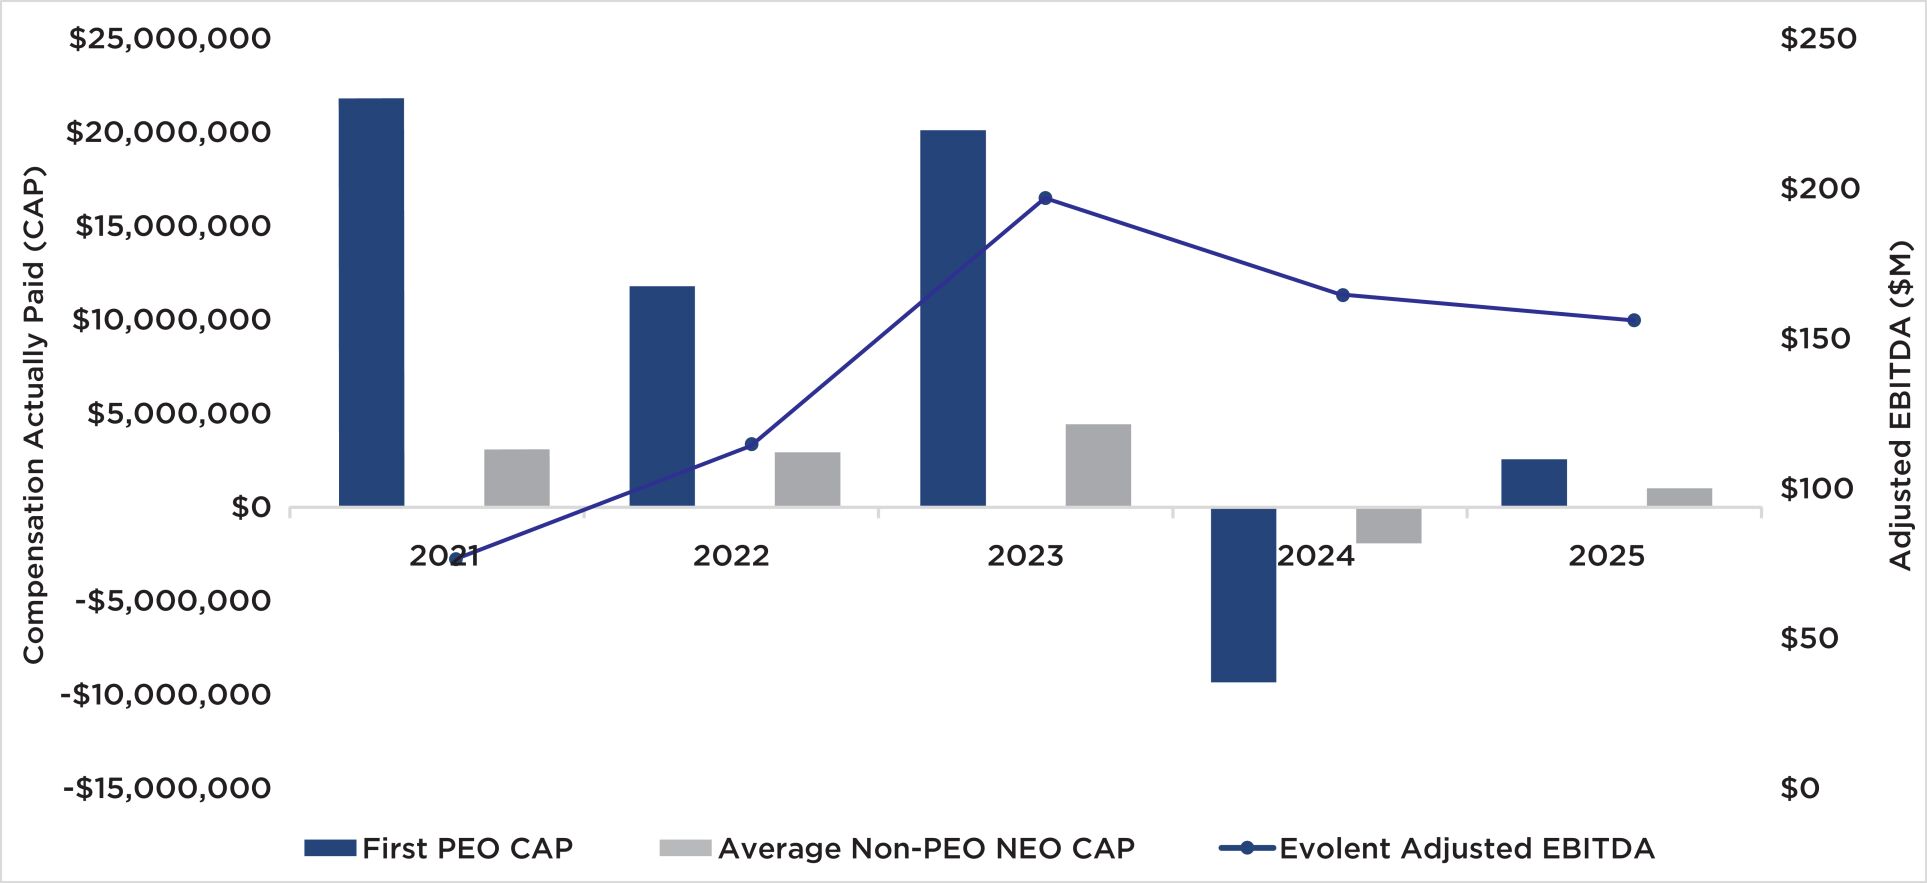
Analysis of the Information Presented in the Pay versus Performance Table: CAP vs. Adjusted EBITDA
Analysis of the Information Presented in the Pay versus Performance Table: CAP vs. TSR
Tabular List of Financial Performance Measures
The most important financial performance measures used by the Company to link executive compensation actually paid to the Company’s PEOs and
non-PEO
NEOs, for the most recently completed fiscal year, to the Company’s performance are as follows: • |
Adjusted EBITDA |
• |
Revenue Growth |
• |
Revenue Bookings Growth |
• |
Employee engagement |
• |
Total Shareholder Return |
• |
Stock Price |
non-GAAP
measure. Refer to Appendix A of this proxy for a reconciliation to net loss attributable to common shareholders of the Company.