Pay vs Performance Disclosure - USD ($)
|
12 Months Ended |
Dec. 28, 2025 |
Dec. 29, 2024 |
Dec. 31, 2023 |
| Pay vs Performance Disclosure |
|
|
|
| Pay vs Performance Disclosure, Table |
| | | | | | | | | | | | | | | | | | | | | | | | | | | | | | | | | | | Value of Initial Fixed $100 Investment Based on: | | | | | | | | | | | | | | Year | (1) Summary Compensation Table Total for PEO ($) | (2) Compensation Actually Paid to PEO ($) | (3) Average Summary Compensation Table Total for Non-PEO NEOs ($) | (4) Average Compensation Actually Paid to Non-PEO NEOs ($) | (5) CAVA Total Shareholder Return ($) | (6) Peer Group Total Shareholder Return ($) | (7) Net income ($) | (8) Company Selected Measure: Adjusted EBITDA ($) | | | | | | | | | | | | | 2025 | 3,859,478 | | (40,880,084) | | 1,770,740 | | (5,483,158) | | 134 | | 110 | | 63,743,000 | | 152,760,000 | | | | 2024 | 1,924,218 | | 80,148,421 | | 908,319 | | 27,481,496 | | 255 | | 111 | | 130,319,000 | | 126,248,000 | | | | 2023 | 17,060,929 | | 46,526,664 | | 2,781,834 | | 9,929,713 | | 96 | | 105 | | 13,280,000 | | 73,825,000 | | |
|
|
|
| Company Selected Measure Name |
Adjusted EBITDA
|
|
|
| Named Executive Officers, Footnote |
Reflects compensation amounts reported in the Summary Compensation Table for our principal executive officer (“PEO”), Brett Schulman, our CEO and President, for the respective years shown.For 2025, the following non-PEO NEOs are included in the average amounts: Tricia Tolivar, Jennifer Somers, Theodoros Xenohristos, Kelly Costanza, and Robert Bertram. The following non-PEO NEOs are included in the average amounts for 2024 and 2023: Tricia Tolivar, Jennifer Somers, Theodoros Xenohristos, and Kelly Costanza.
|
|
|
| Peer Group Issuers, Footnote |
For the relevant fiscal year, represents the cumulative TSR of the S&P 500 Restaurants Index (Peer Group TSR) through the last day of the applicable fiscal year, assuming $100 was invested on May 31, 2023 and dividends were reinvested.
|
|
|
| PEO Total Compensation Amount |
$ 3,859,478
|
$ 1,924,218
|
$ 17,060,929
|
| PEO Actually Paid Compensation Amount |
$ (40,880,084)
|
80,148,421
|
46,526,664
|
| Adjustment To PEO Compensation, Footnote |
Reflects the respective amounts set forth in column (1) of the table above, adjusted as set forth in the table below, as determined in accordance with SEC rules and computed in accordance with the methodology used for financial reporting purposes. The dollar amounts reflected in column (2) of the table above do not reflect the actual amount of compensation earned, realized, or received by the CEO during the applicable year. Decreases in stock price may result in negative dollar amounts. For information regarding the decisions made by our People, Culture, and Compensation Committee regarding the CEO’s compensation for each fiscal year, see “Compensation Discussion and Analysis” and the tables and narrative explanations reporting pay for the fiscal years covered in the table above. | | | | | | | | | | | | | | | | | | | | | | | | | | | Year | Summary Compensation Table Total for PEO ($) | Less: Summary Compensation Table Total Equity (Stock Awards + Option Awards) for PEO ($) | Plus: Fair Value as of Fiscal Year-End of Stock and Option Awards Granted in Covered Year for PEO ($) | Plus: Change in Fair Value of Outstanding Unvested Stock and Option Awards from Prior Years for PEO ($) | Plus: Change in Fair Value of Stock and Option Awards that Vested in the Covered Year for PEO ($) | Less: Fair Value at Prior Fiscal Year-End of Stock and Option and Option Awards Forfeited during the Covered Year for PEO ($) | Compensation Actually Paid to PEO ($) | | | | | | | | | | | | 2025 | 3,859,478 | | 1,999,946 | | 1,187,042 | | (36,817,175) | | (7,109,483) | | — | | (40,880,084) | | | | 2024 | 1,924,218 | | — | | — | | 69,029,501 | | 9,194,702 | | — | | 80,148,421 | | | | 2023 | 17,060,929 | | 15,088,300 | | 34,898,602 | | 9,657,763 | | (2,330) | | — | | 46,526,664 | | |
|
|
|
| Non-PEO NEO Average Total Compensation Amount |
$ 1,770,740
|
908,319
|
2,781,834
|
| Non-PEO NEO Average Compensation Actually Paid Amount |
$ (5,483,158)
|
27,481,496
|
9,929,713
|
| Adjustment to Non-PEO NEO Compensation Footnote |
Reflects the respective amounts set forth in column (3) of the table above, adjusted as set forth in the table below, as determined in accordance with SEC rules and computed in accordance with the methodology used for financial reporting purposes. The dollar amounts reflected in column (4) of the table above do not reflect the actual amount of compensation earned, realized, or received by the non-PEO NEOs during the applicable year. Decreases in stock price may result in negative dollar amounts. For information about the decisions made by our People, Culture and Compensation Committee regarding the non-PEO NEOs’ compensation for each fiscal year, see “Compensation Discussion and Analysis” and the related tables and narrative explanations reporting pay for the fiscal years covered in the table above. | | | | | | | | | | | | | | | | | | | | | | | | | | | | Year | Average Summary Compensation Table Total for Non-PEO NEOs ($) | Less: Average Summary Compensation Table Total Equity (Stock Awards + Option Awards) for Non-PEO NEOs ($) | Plus: Average Fair Value as of Fiscal Year-End of Stock and Option Awards Granted in Covered Year for Non-PEO NEOs ($) | Plus: Average Change in Fair Value of Outstanding Unvested Stock and Option Awards from Prior Years for Non-PEO NEOs ($) | Plus: Average Change in Fair Value of Stock and Option Awards that Vested in the Covered Year for Non-PEO NEOs ($) | Less: Average Fair Value at Prior Fiscal Year-End of Stock and Option and Option Awards Forfeited during the Covered Year for Non-PEO NEOs ($) | Average Compensation Actually Paid to Non-PEO NEOs ($) | | | | | | | | | | | | 2025 | 1,770,740 | | 959,952 | | 427,328 | | (3,647,051) | | (860,596) | | 2,213,627 | | (5,483,158) | | | | 2024 | 908,319 | | — | | — | | 20,921,990 | | 5,651,187 | | — | | 27,481,496 | | | | 2023 | 2,781,834 | | 1,854,424 | | 5,065,659 | | 3,245,653 | | 690,991 | | — | | 9,929,713 | | |
|
|
|
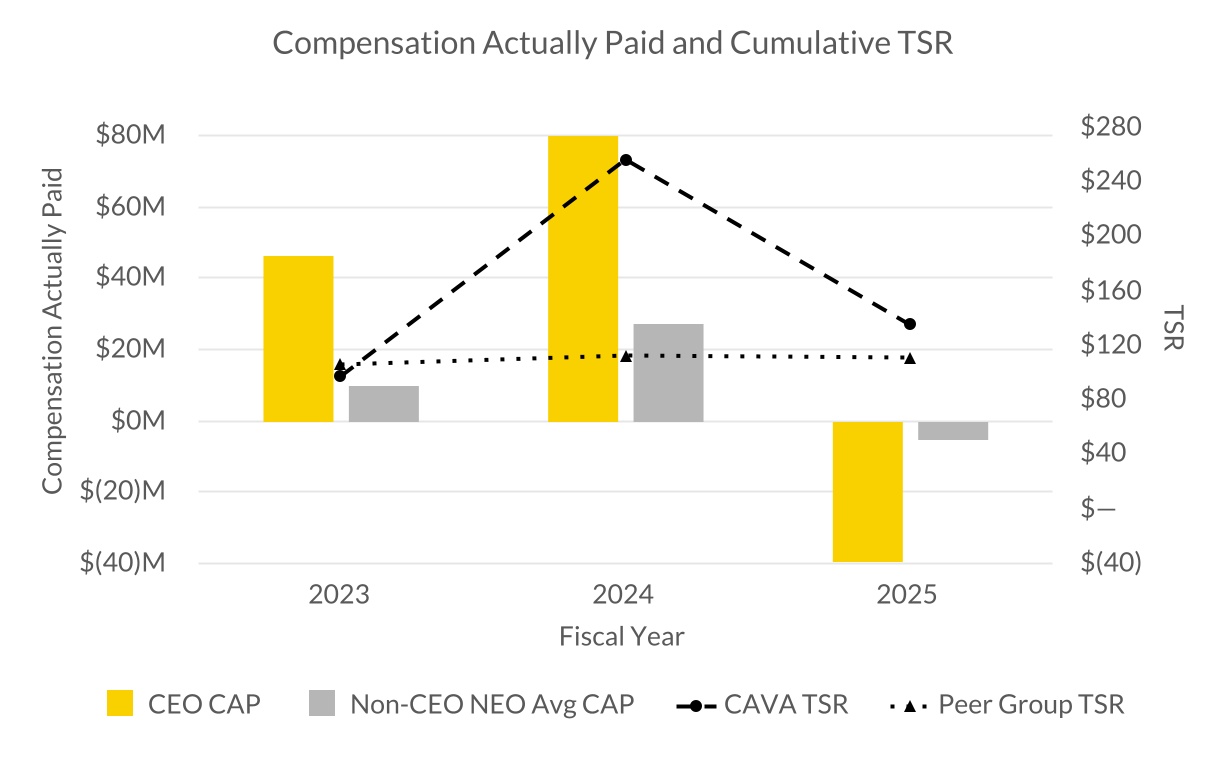
| Compensation Actually Paid vs. Total Shareholder Return |
|
|
|
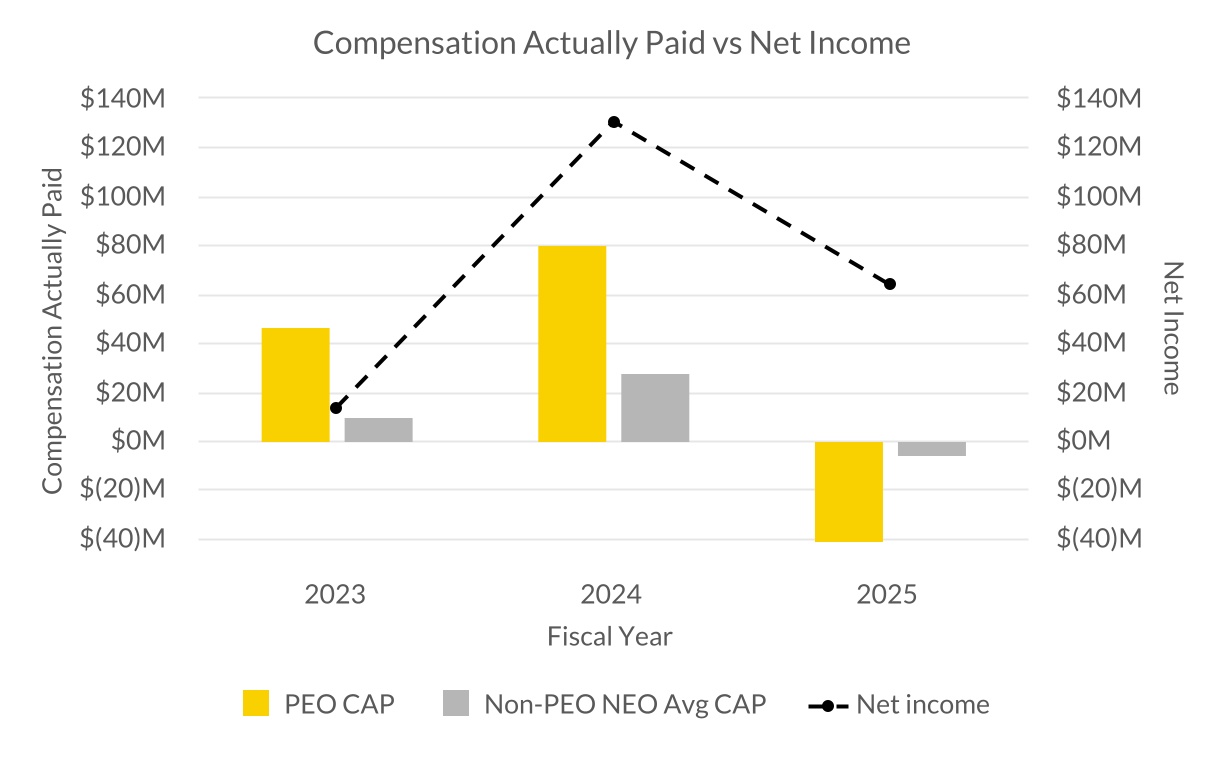
| Compensation Actually Paid vs. Net Income |
Excluding the $80.1 million net benefit from the release of the valuation allowance against deferred tax assets, net income for 2024 would have been $50.2 million. The relationship between CEO CAP, and non-CEO CAP, to net income would still have been positive between 2023 and 2024.
|
|
|
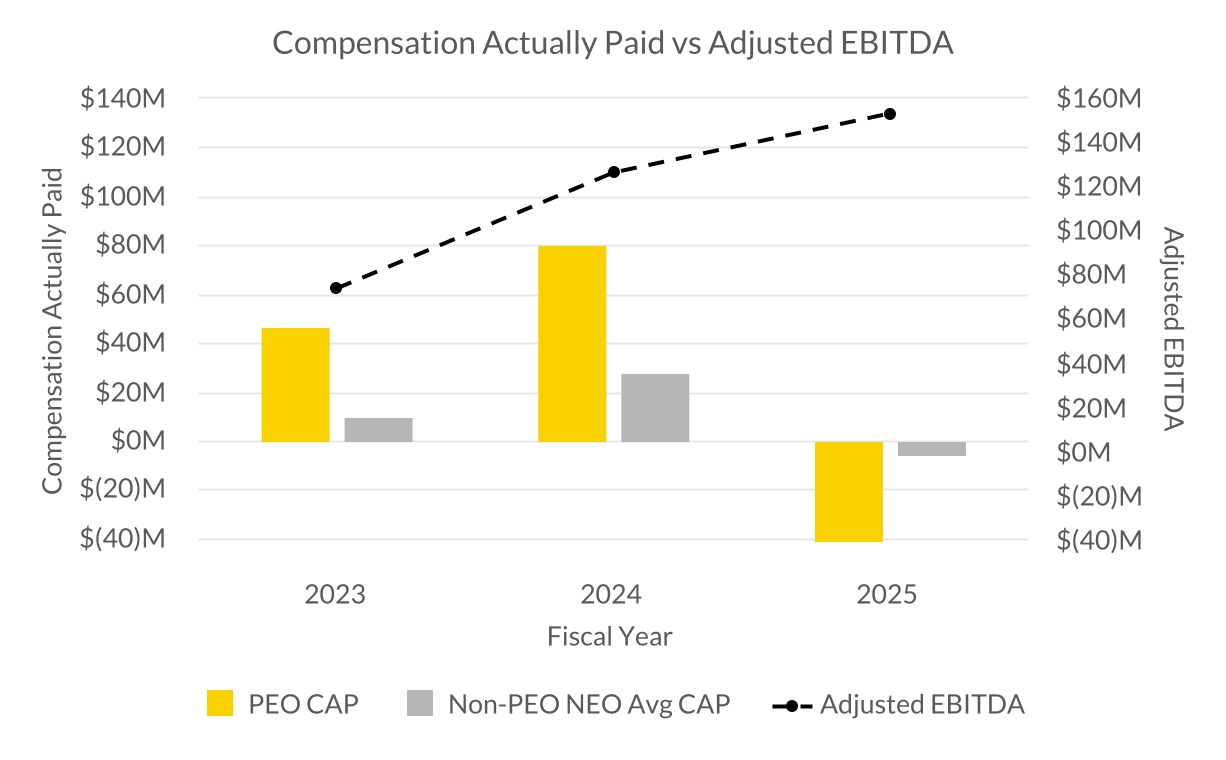
| Compensation Actually Paid vs. Company Selected Measure |
|
|
|
| Total Shareholder Return Vs Peer Group |
|
|
|
| Tabular List, Table |
| | | Most Important Performance Measures for 2025 Compensation | | Adjusted EBITDA | Revenue |
|
|
|
| Total Shareholder Return Amount |
$ 134
|
255
|
96
|
| Peer Group Total Shareholder Return Amount |
110
|
111
|
105
|
| Net Income (Loss) |
$ 63,743,000
|
$ 130,319,000
|
$ 13,280,000
|
| Company Selected Measure Amount |
152,760,000
|
126,248,000
|
73,825,000
|
| PEO Name |
Brett Schulman
|
|
|
| Additional 402(v) Disclosure |
For the relevant fiscal year, represents the cumulative total shareholder return ("TSR") of CAVA through the last day of the applicable fiscal year, assuming $100 was invested on the date of our IPO, June 15, 2023.Reflects CAVA’s net income for each of the fiscal years ended December 28, 2025, December 29, 2024, and December 31, 2023. Net income in fiscal 2024 included a one-time $80.1 million net benefit from the release of the valuation allowance against deferred tax assets.
|
|
|
| Measure:: 1 |
|
|
|
| Pay vs Performance Disclosure |
|
|
|
| Name |
Adjusted EBITDA
|
|
|
| Non-GAAP Measure Description |
Company Selected Measure is Adjusted EBITDA, which is defined as net income adjusted to exclude interest income, net, (benefit from) provision for income taxes, and depreciation and amortization, further adjusted to exclude equity-based compensation, other income, net, impairment and asset disposal costs, restructuring and other costs, certain non-recurring public company costs, and executive transitions costs to the extent applicable in each fiscal year.
|
|
|
| Measure:: 2 |
|
|
|
| Pay vs Performance Disclosure |
|
|
|
| Name |
Revenue
|
|
|
| PEO | Aggregate Grant Date Fair Value of Equity Award Amounts Reported in Summary Compensation Table |
|
|
|
| Pay vs Performance Disclosure |
|
|
|
| Adjustment to Compensation, Amount |
$ (1,999,946)
|
$ 0
|
$ (15,088,300)
|
| PEO | Year-end Fair Value of Equity Awards Granted in Covered Year that are Outstanding and Unvested |
|
|
|
| Pay vs Performance Disclosure |
|
|
|
| Adjustment to Compensation, Amount |
1,187,042
|
0
|
34,898,602
|
| PEO | Year-over-Year Change in Fair Value of Equity Awards Granted in Prior Years That are Outstanding and Unvested |
|
|
|
| Pay vs Performance Disclosure |
|
|
|
| Adjustment to Compensation, Amount |
(36,817,175)
|
69,029,501
|
9,657,763
|
| PEO | Vesting Date Fair Value of Equity Awards Granted and Vested in Covered Year |
|
|
|
| Pay vs Performance Disclosure |
|
|
|
| Adjustment to Compensation, Amount |
(7,109,483)
|
9,194,702
|
(2,330)
|
| PEO | Prior Year End Fair Value of Equity Awards Granted in Any Prior Year that Fail to Meet Applicable Vesting Conditions During Covered Year |
|
|
|
| Pay vs Performance Disclosure |
|
|
|
| Adjustment to Compensation, Amount |
0
|
0
|
0
|
| Non-PEO NEO | Aggregate Grant Date Fair Value of Equity Award Amounts Reported in Summary Compensation Table |
|
|
|
| Pay vs Performance Disclosure |
|
|
|
| Adjustment to Compensation, Amount |
(959,952)
|
0
|
(1,854,424)
|
| Non-PEO NEO | Year-end Fair Value of Equity Awards Granted in Covered Year that are Outstanding and Unvested |
|
|
|
| Pay vs Performance Disclosure |
|
|
|
| Adjustment to Compensation, Amount |
427,328
|
0
|
5,065,659
|
| Non-PEO NEO | Year-over-Year Change in Fair Value of Equity Awards Granted in Prior Years That are Outstanding and Unvested |
|
|
|
| Pay vs Performance Disclosure |
|
|
|
| Adjustment to Compensation, Amount |
(3,647,051)
|
20,921,990
|
3,245,653
|
| Non-PEO NEO | Vesting Date Fair Value of Equity Awards Granted and Vested in Covered Year |
|
|
|
| Pay vs Performance Disclosure |
|
|
|
| Adjustment to Compensation, Amount |
(860,596)
|
5,651,187
|
690,991
|
| Non-PEO NEO | Prior Year End Fair Value of Equity Awards Granted in Any Prior Year that Fail to Meet Applicable Vesting Conditions During Covered Year |
|
|
|
| Pay vs Performance Disclosure |
|
|
|
| Adjustment to Compensation, Amount |
$ (2,213,627)
|
$ 0
|
$ 0
|