Pay vs Performance Disclosure - USD ($)
Dec. 31, 2025
Dec. 31, 2024
Dec. 31, 2023
| (a) | (b) | (c) | (d) | (e) | (f) | (g) | |||||||||||||||||||||||||||||
| Year | Summary compensation table total for PEO*(1) | Compensation actually paid to PEO*(5) | Average Summary compensation table total for non-PEO NEOs(5) | Average Compensation actually paid to non-PEO NEOs(5) | Value of initial fixed $100 investment based on total share-holder return(3) | Net loss (in thousands) (4) | |||||||||||||||||||||||||||||
| 2025 | $ | 6,638,252 | $ | 5,734,297 | $ | 1,292,084 | $ | 2,805,245 | $ | 143.31 | $ | (26,974) | |||||||||||||||||||||||
| 2024 | $ | 3,863,827 | $ | 1,978,633 | $ | 1,520,277 | $ | 1,299,820 | $ | 50.77 | $ | (18,462) | |||||||||||||||||||||||
| 2023 | $ | 1,331,955 | $ | 697,403 | $ | 670,249 | $ | 499,391 | $ | 42.28 | $ | (20,250) | |||||||||||||||||||||||
* This column represents disclosure for the individual who served as PEO as of December 31 of each respective year.
| 2025 | |||||||||||
| PEO | NON-PEO NEOs | ||||||||||
| Sekhri | Tuch and Tung | ||||||||||
| Total Compensation Reported in 2025 Summary Compensation Table | $ | 6,638,252 | $ | 1,292,084 | |||||||
| Less, Grant Date Fair Value of Stock & Option Awards Reported in the 2025 Summary Compensation Table | (5,601,712) | 1,009,311 | |||||||||
| Plus, Year-End Fair Value of Awards Granted in 2025 that are Outstanding and Unvested | 3,517,891 | 731,617 | |||||||||
| Plus, Change in Fair Value of Awards Granted in Prior Years that are Outstanding and Unvested (From Prior Year-End to Year-End) | 1,055,358 | — | |||||||||
| Plus, Vesting Date Fair Value of Awards Granted in 2025 that Vested in 2025 | — | — | |||||||||
| Plus, Change in Fair Value of Awards Granted in Prior Years that Vested in 2025 (From Prior Year-End to Vesting Date) | 124,508 | 7,780 | |||||||||
| Less, Prior Year-End Fair Value of Awards Granted in Prior Years that Failed to Vest in 2025 | — | (235,547) | |||||||||
| Plus, Dollar Value of Dividends or other Earnings Paid on Stock & Option Awards in 2025 prior to Vesting (if not reflected in the fair value of such award or included in Total Compensation for 2025) | — | — | |||||||||
| Total Adjustments | (903,955) | 1,513,161 | |||||||||
| Compensation Actually Paid for Fiscal Year 2025 | $ | 5,734,297 | $ | 2,805,245 | |||||||
| 2024 | |||||||||||
| PEO | NON-PEO NEOs | ||||||||||
| Sekhri | Tuch | ||||||||||
| Total Compensation Reported in 2024 Summary Compensation Table | $ | 3,863,827 | $ | 1,520,277 | |||||||
| Less, Grant Date Fair Value of Stock & Option Awards Reported in the 2024 Summary Compensation Table | (2,949,001) | (928,619) | |||||||||
| Plus, Year-End Fair Value of Awards Granted in 2024 that are Outstanding and Unvested | 696,502 | 485,290 | |||||||||
| Plus, Change in Fair Value of Awards Granted in Prior Years that are Outstanding and Unvested (From Prior Year-End to Year-End) | 54,974 | 9,088 | |||||||||
| Plus, Vesting Date Fair Value of Awards Granted in 2024 that Vested in 2024 | 285,592 | 198,992 | |||||||||
| Plus, Change in Fair Value of Awards Granted in Prior Years that Vested in 2024 (From Prior Year-End to Vesting Date) | 26,739 | 14,792 | |||||||||
| Less, Prior Year-End Fair Value of Awards Granted in Prior Years that Failed to Vest in 2024 | — | — | |||||||||
| Plus, Dollar Value of Dividends or other Earnings Paid on Stock & Option Awards in 2024 prior to Vesting (if not reflected in the fair value of such award or included in Total Compensation for 2024) | — | — | |||||||||
| Total Adjustments | (1,885,193) | (220,457) | |||||||||
| Compensation Actually Paid for Fiscal Year 2024 | $ | 1,978,633 | $ | 1,299,820 | |||||||
| 2023 | |||||||||||
| PEO | NON-PEO NEOs | ||||||||||
| Sekhri | Tuch | ||||||||||
| Total Compensation Reported in 2023 Summary Compensation Table | $ | 1,331,955 | $ | 670,249 | |||||||
| Less, Grant Date Fair Value of Stock & Option Awards Reported in the 2023 Summary Compensation Table | — | — | |||||||||
| Plus, Year-End Fair Value of Awards Granted in 2023 that are Outstanding and Unvested | — | — | |||||||||
| Plus, Change in Fair Value of Awards Granted in Prior Years that are Outstanding and Unvested (From Prior Year-End to Year-End) | (499,317) | (108,970) | |||||||||
| Plus, Vesting Date Fair Value of Awards Granted in 2023 that Vested in 2023 | — | — | |||||||||
| Plus, Change in Fair Value of Awards Granted in Prior Years that Vested in 2023 (From Prior Year-End to Vesting Date) | (135,235) | (61,888) | |||||||||
| Less, Prior Year-End Fair Value of Awards Granted in Prior Years that Failed to Vest in 2023 | — | — | |||||||||
| Plus, Dollar Value of Dividends or other Earnings Paid on Stock & Option Awards in 2023 prior to Vesting (if not reflected in the fair value of such award or included in Total Compensation for 2023) | — | — | |||||||||
| Total Adjustments | (634,552) | (170,858) | |||||||||
| Compensation Actually Paid for Fiscal Year 2023 | $ | 697,403 | $ | 499,391 | |||||||
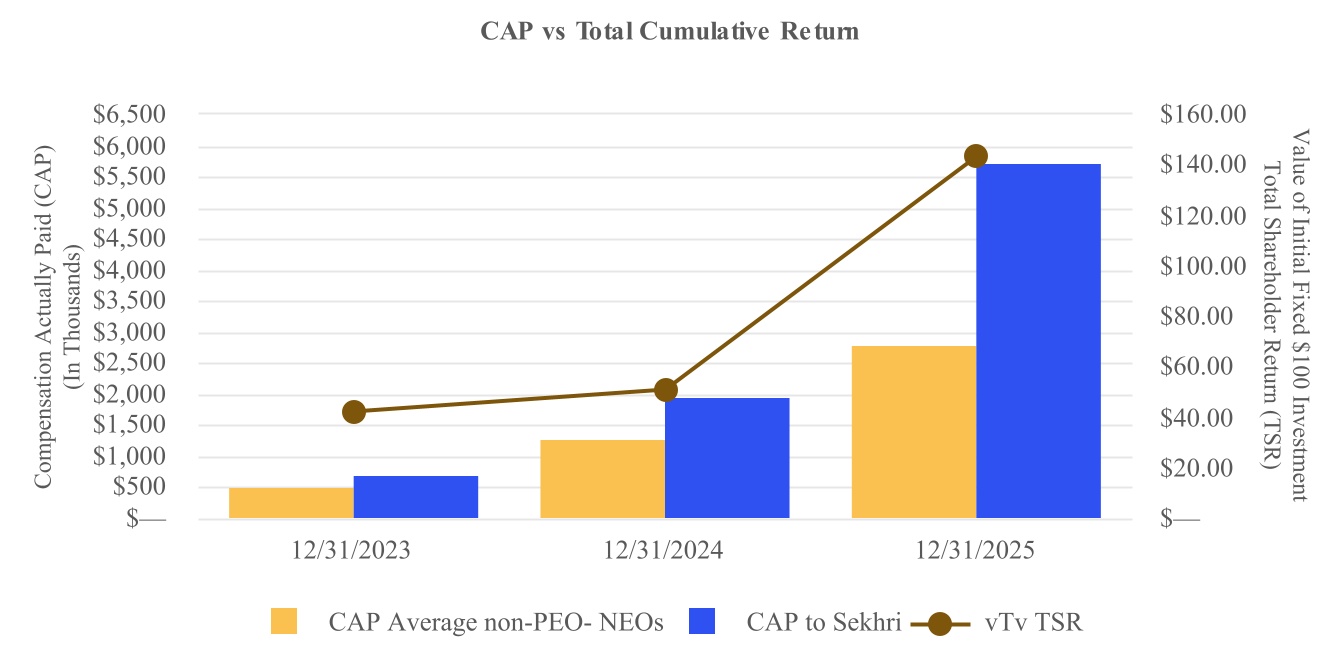
Compensation Actually Paid versus Total Cumulative Return
As demonstrated by the following graph, the amount of “compensation actually paid” to the PEOs and the average amount of “compensation actually paid” to the non-PEO NEOs is directionally aligned with the Company’s TSR over the three years presented in the table. This is because a significant portion of the “compensation actually paid” to the PEOs and to the non-PEO NEOs is comprised of equity awards.
The Company’s stock price has had the most profound impact on the change from the compensation reported in the “Summary Compensation Table.” Specifically, our stock price performance in 2025, 2024, and 2023 has resulted in a significant increase in the fair value of the Company’s TSR, as measured at the end of the applicable fiscal years, and particularly as of the end of fiscal year 2025.
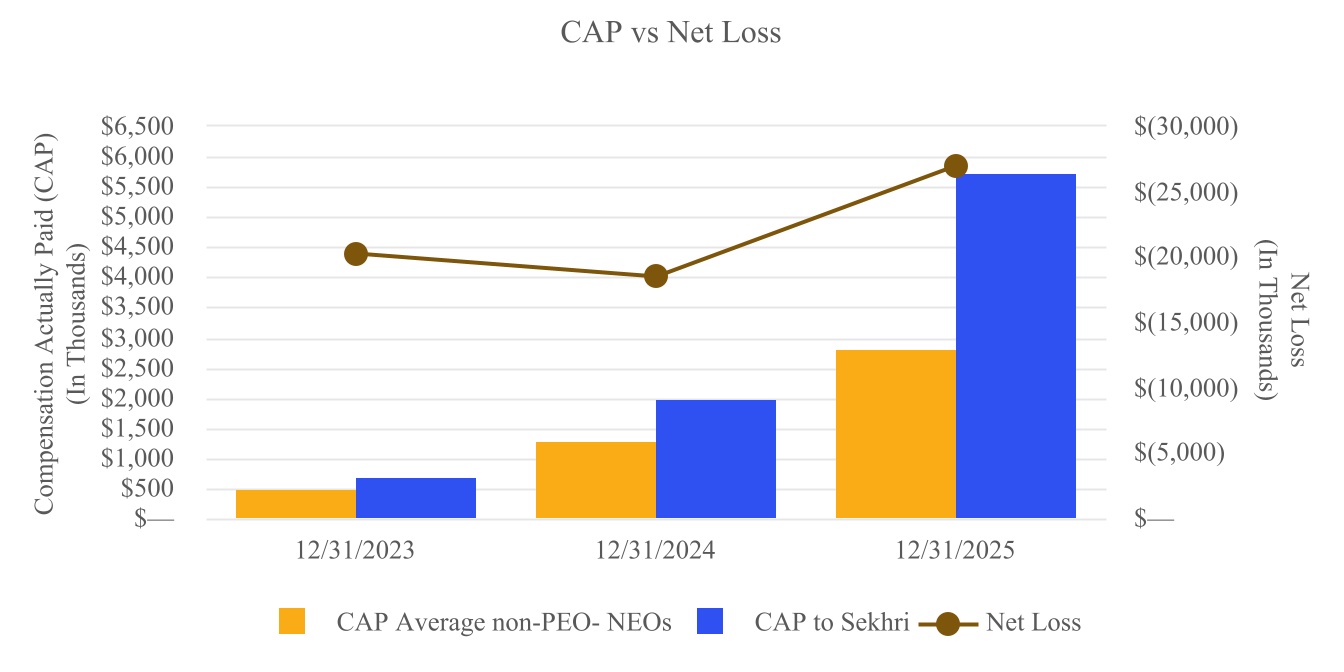
Compensation Actually Paid versus Net Loss
As demonstrated by the following graph, the amount of “compensation actually paid” to the PEOs and the average amount of “compensation actually paid” to the non-PEO NEOs is not directionally aligned with the Company’s net loss over the three years presented in the table due to the weight placed on equity-based compensation in our pay mix, as well as the impact the Company’s stock price has had on the “compensation actually paid” amounts during the applicable fiscal years.