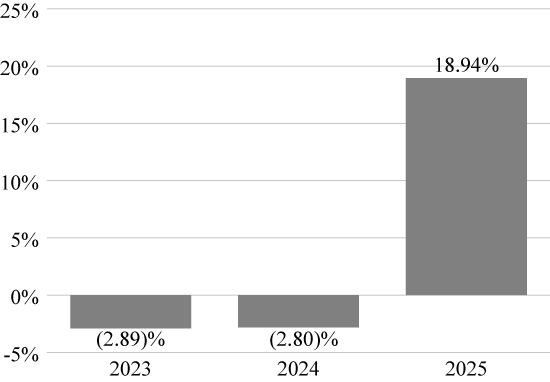
The bar chart and table below indicate the risks of investing in the Fund by showing changes in the Fund’s performance and comparing that performance to a broad-based securities market index. On April 30, 2025, the Fund expanded its investment strategy to include principal investments in ether, ether Futures, and other Digital Assets, including Digital Asset-related operating companies. Before this change, the Fund’s investment strategy focused on bitcoin and bitcoin Futures. The Fund’s past performance, before and after taxes, does not necessarily indicate how the Fund will perform in the future. Updated performance information will be available at no cost by calling 216-329-4271 or by visiting its website at www.idx-funds.com.
| Best Quarter: | 10.36% | th Quarter 2025 |
| Worst Quarter: | -5.19% | nd Quarter 2024 |
| One Year | Since Inception 11/1/2022 | |
| Return Before Taxes | 18.94% | 3.53% |
| Return After Taxes on Distributions | 15.31% | 1.78% |
| Return
After Taxes on Distributions and Sale of Fund Shares |
11.10% | 1.92% |
| Bloomberg Global-Aggregate Total Return Index | 8.17% | 18.21% |
| ICE BofA SOFR Overnight Rate Index | 4.40% | 5.20% |
| SGA CTA Index | -0.16% | -6.48% |
After-tax returns are calculated using the historical highest individual federal marginal income tax rates and do not reflect the effect of state and local taxes. Actual after-tax returns depend on an investor’s tax situation and may differ from those shown, and after-tax returns shown are not relevant to investors who hold shares of the Fund through tax-deferred arrangements, such as 401(k) plans or IRAs.