Pay vs Performance Disclosure - USD ($)
Dec. 31, 2025
Dec. 31, 2024
Dec. 31, 2023
Dec. 31, 2022
Dec. 31, 2021
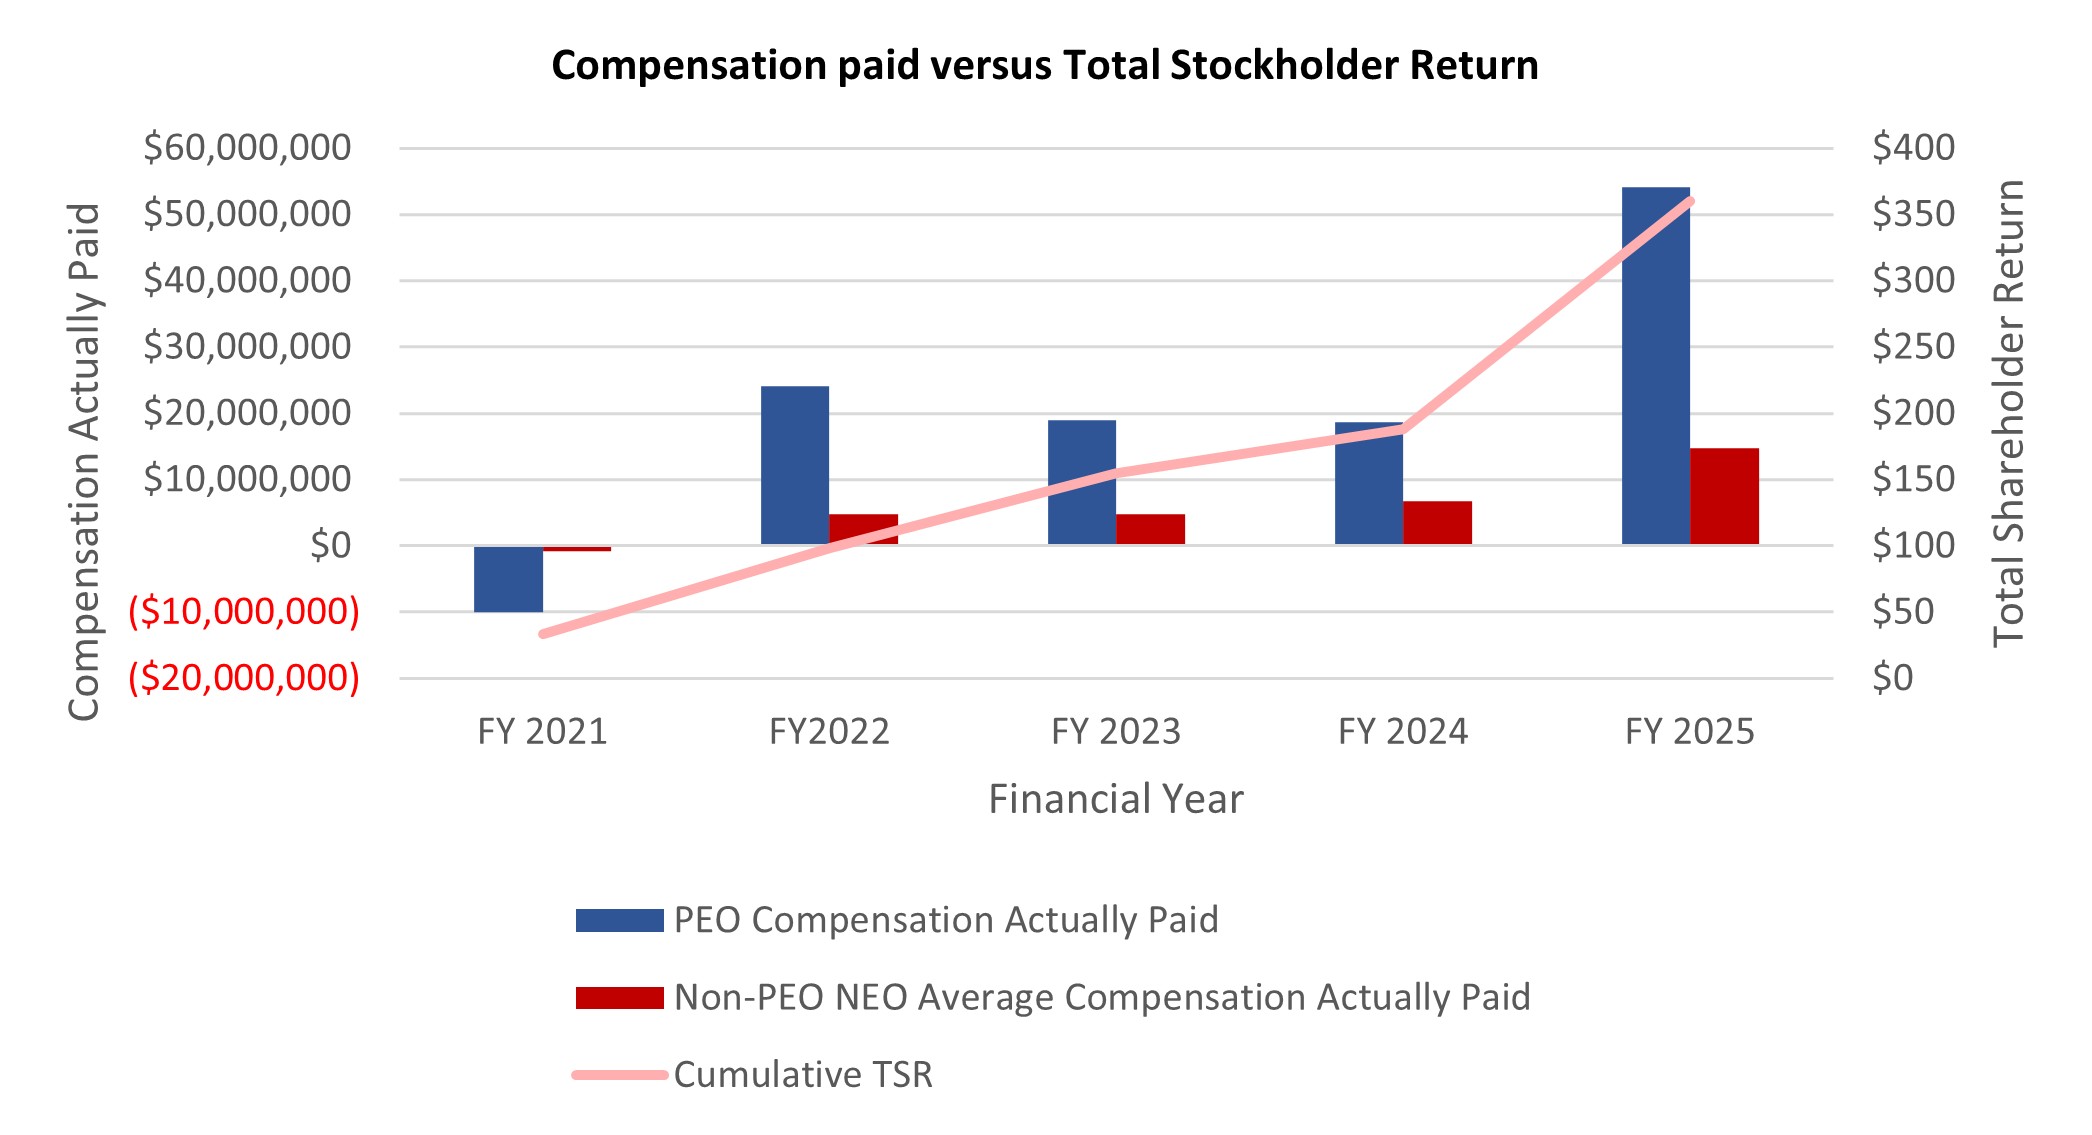
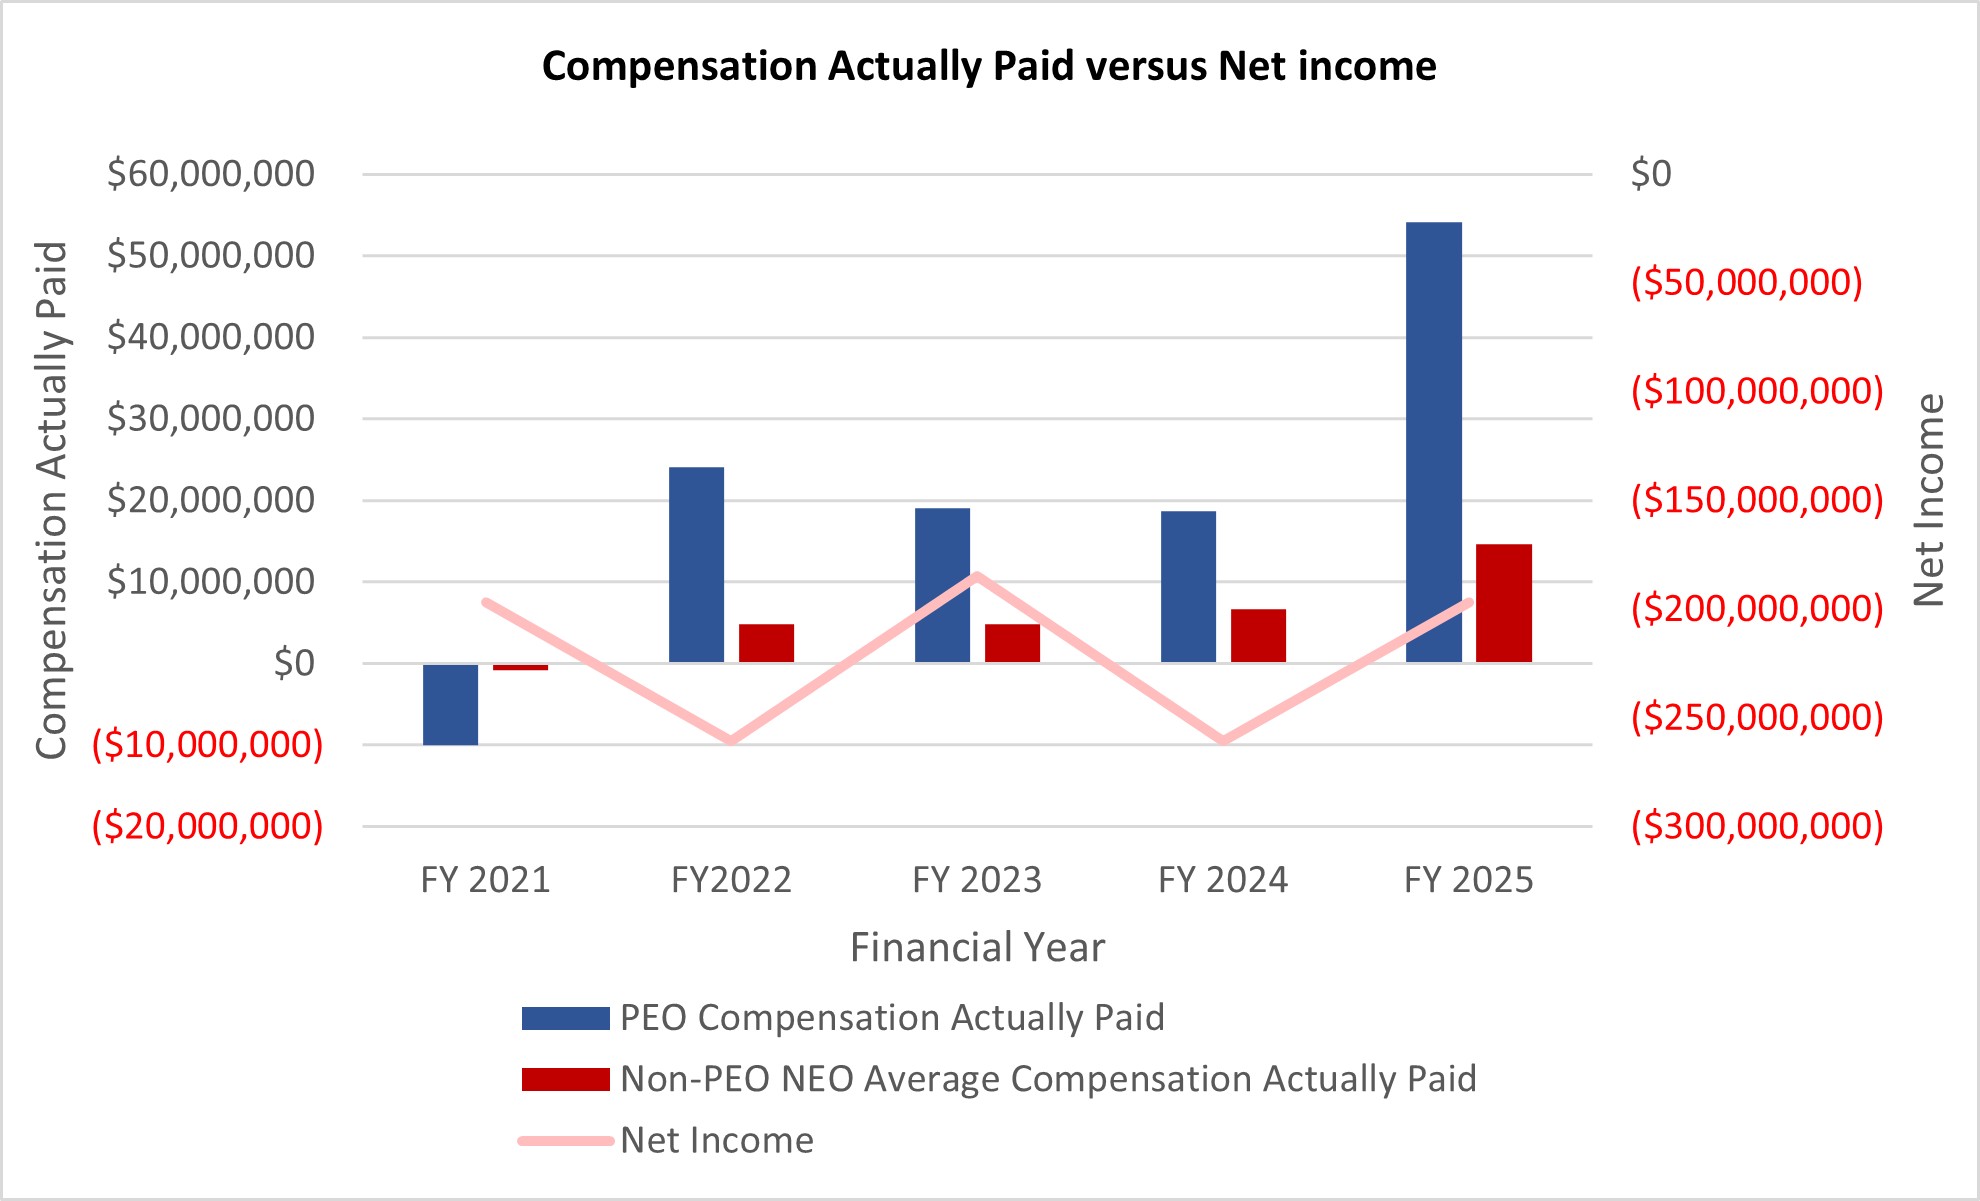
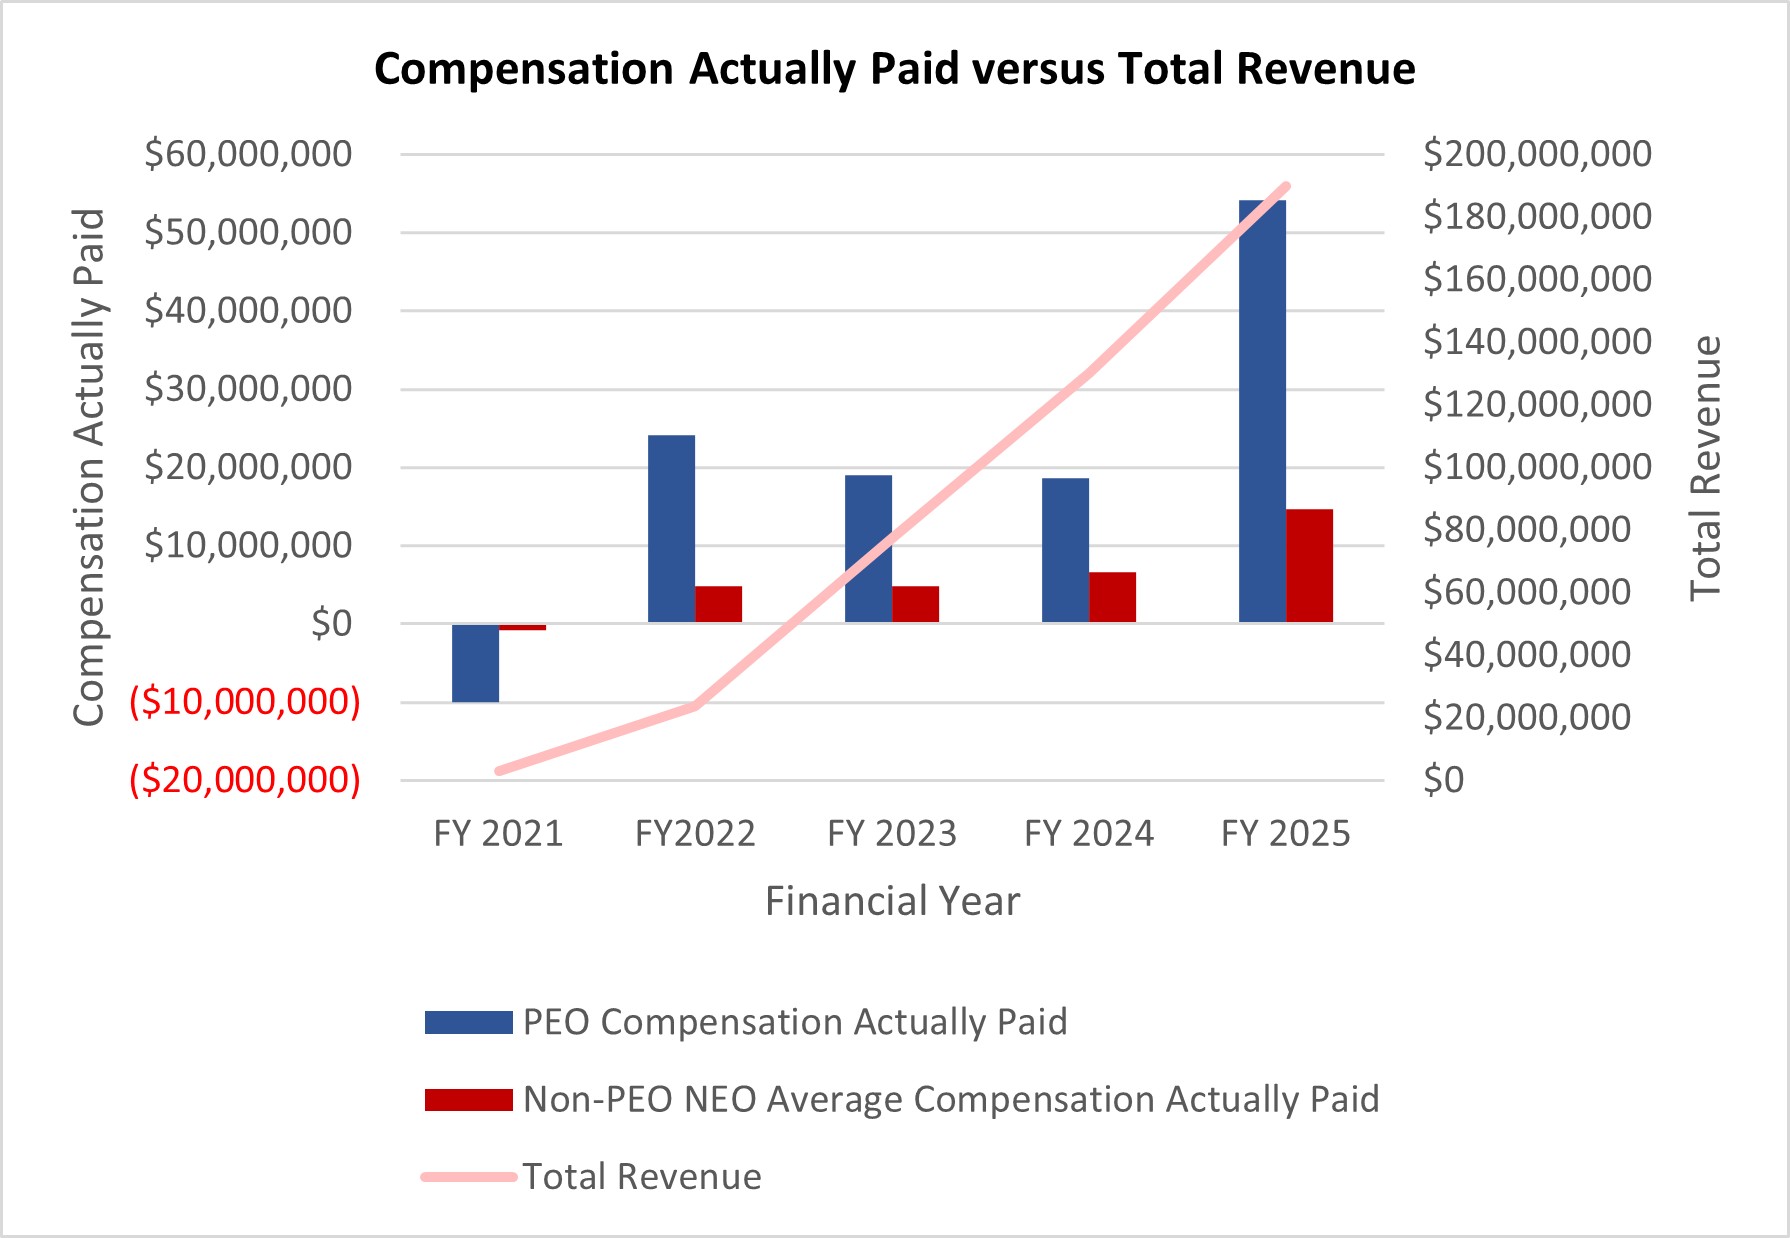
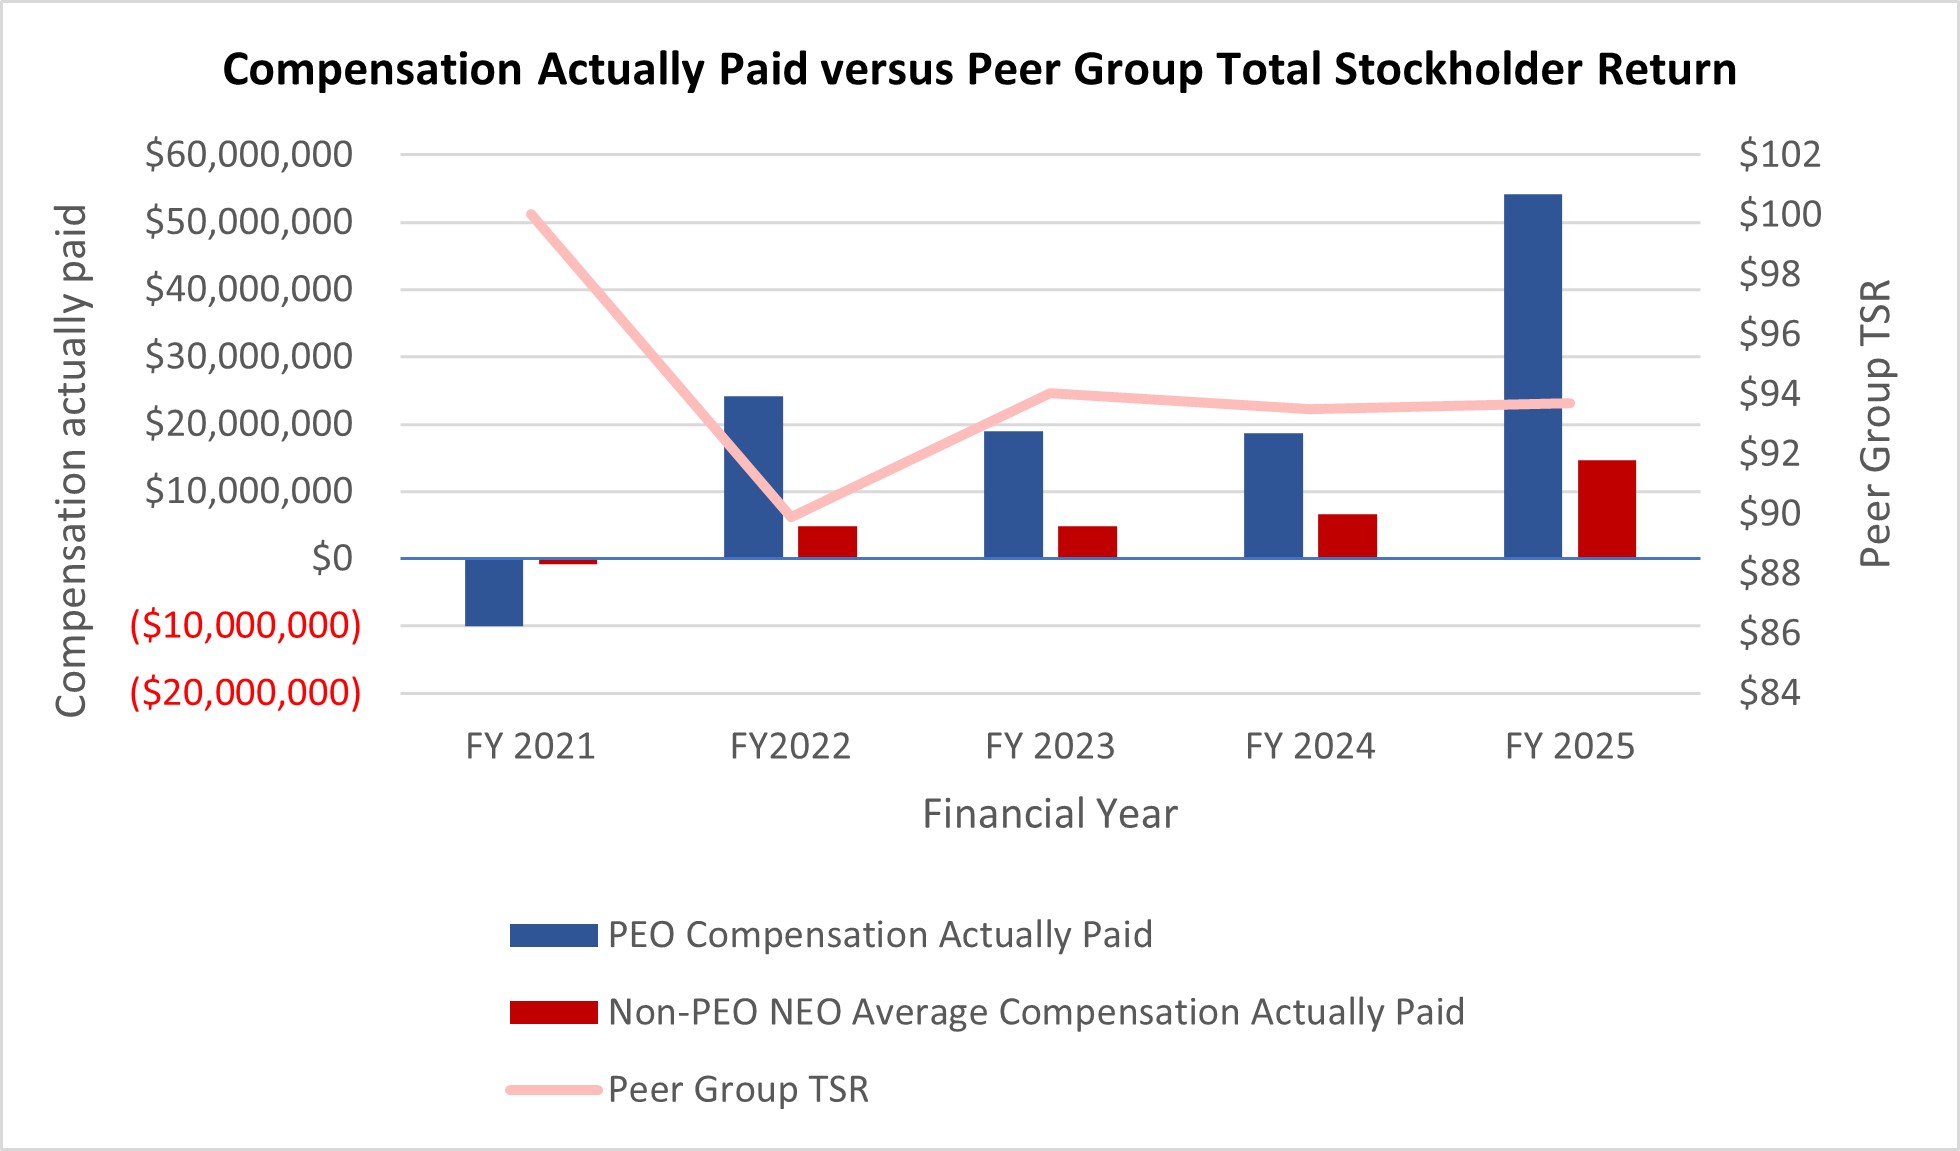
| Year | Summary Compensation Table Total for PEO ($) | Compensation Actually Paid to PEO ($)(1) | Average Summary Compensation Table Total for Non-PEO NEOs ($) | Average Compensation Actually Paid to Non-PEO NEOs ($)(1) | Value of Initial Fixed $100 Investment Based on: | Net Income ($) | Total Revenues ($)(3) | |||||||||||||||||||||||||||||||||||||||||||
| Total Stockholder Return ($) | Peer Group Total Stockholder Return ($)(2) | |||||||||||||||||||||||||||||||||||||||||||||||||
| 2025 | 17,544,525 | 17,544,525 | 54,157,885 | 5,594,181 | 14,695,734 | 360.00 | 93.71 | (196,539) | 189,757 | |||||||||||||||||||||||||||||||||||||||||
| 2024 | 14,663,742 | 18,680,784 | 4,600,098 | 6,662,641 | 188.27 | 93.49 | (260,602) | 130,126 | ||||||||||||||||||||||||||||||||||||||||||
| 2023 | 7,230,457 | 19,005,711 | 1,974,174 | 4,813,432 | 154.61 | 94.03 | (184,678) | 77,428 | ||||||||||||||||||||||||||||||||||||||||||
| 2022 | 3,325,758 | 24,142,912 | 1,110,455 | 4,805,393 | 97.94 | 89.90 | (181,119) | 23,638 | ||||||||||||||||||||||||||||||||||||||||||
| 2021 | 6,458,360 | (10,017,699) | 2,069,493 | (775,040) | 33.57 | 100.02 | (69,612) | 3,154 | ||||||||||||||||||||||||||||||||||||||||||
_______________________________________________________
(1)The significant variability in Compensation Actually Paid across periods is primarily driven by changes in the fair value of equity awards, which are sensitive to stock price performance and vesting conditions. Amounts represent compensation actually paid to our PEO and the average compensation actually paid to our remaining NEOs for the relevant fiscal year, as determined under SEC rules (and described in Note 2 below), which includes the individuals indicated in the table below for each fiscal year:
| Year | PEO | Non-PEO NEOs | ||||||||||||
| 2025 | David P. Meeker | Hunter C. Smith, Jennifer Lee, Yann Mazabraud and Alastair Garfield | ||||||||||||
| 2024 | David P. Meeker | Hunter C. Smith, Jennifer Lee, Yann Mazabraud and Joseph Shulman | ||||||||||||
| 2023 | David P. Meeker | Hunter C. Smith, Jennifer Lee, Yann Mazabraud and Joseph Shulman | ||||||||||||
| 2022 | David P. Meeker | Hunter C. Smith, Jennifer Lee, Yann Mazabraud and Joseph Shulman | ||||||||||||
| 2021 | David P. Meeker | Hunter C. Smith, Murray Stewart, Jennifer Lee, Yann Mazabraud and Joseph Shulman | ||||||||||||
The 2025 Summary Compensation Table totals reported for the PEO and the average of the Other NEOs for each year were subject to the following adjustments per Item 402(v)(2)(iii) of Regulation S-K to calculate “compensation actually paid”:
| 2025 | |||||||||||
| PEO | Average for Other NEO’s | ||||||||||
| Summary Compensation Table Total | 17,544,525 | 5,594,181 | |||||||||
ADJUSTMENTS(a): | |||||||||||
| Deduction for Amounts reported under the “Stock Awards” and “Option Awards” Columns in the Summary Compensation Table(a) | (15,963,345) | (4,716,770) | |||||||||
| Increase based on ASC 718 Fair Value of Awards Granted during Applicable FY that Remain Unvested as of Applicable FY End, determined as of Applicable FY End | 27,463,032 | 7,464,689 | |||||||||
| Increase based on ASC 718 Fair Value of Awards Granted during Applicable FY that Vested during Applicable FY, determined as of Vesting Date | 2,236,519 | 608,054 | |||||||||
| Increase/deduction for Awards Granted during Prior FY that were Outstanding and Unvested as of Applicable FY End, determined based on change in ASC 718 Fair Value from Prior FY End to Applicable FY End | 17,766,871 | 4,961,562 | |||||||||
| Increase/deduction for Awards Granted during Prior FY that Vested During Applicable FY, determined based on change in ASC 718 Fair Value from Prior FY End to Vesting Date | 5,110,282 | 784,018 | |||||||||
| Deduction of ASC 718 Fair Value of Awards Granted during Prior FY that were Forfeited during Applicable FY, determined as of Prior FY End | — | — | |||||||||
| Increase based on Dividends or Other Earnings Paid during Applicable FY prior to Vesting Date | — | — | |||||||||
| Increase based on Incremental Fair Value of Options/SARs Modified during Applicable FY | — | — | |||||||||
| Adjustments Related to Defined Benefit and Actuarial Pension Plans | — | — | |||||||||
| Compensation Actually Paid | 54,157,885 | 14,695,734 | |||||||||
Measurement date equity fair values are calculated with assumptions derived on a basis consistent with those used for grant date fair value purposes. RSUs and PSUs are valued based on the closing stock price on the relevant measurement date. Stock options are valued using a Black-Scholes model as at the relevant measurement dates.
(2)For the relevant fiscal year, represents the cumulative TSR (the “Peer Group TSR”) of the NASDAQ Biotechnology Index (the “Peer Group”). The dollar amounts reported represent the amount of net loss reflected in the Company's audited financial statements for the applicable fiscal year.
(3)Revenue is the Company’s selected GAAP measure.
(1)The significant variability in Compensation Actually Paid across periods is primarily driven by changes in the fair value of equity awards, which are sensitive to stock price performance and vesting conditions. Amounts represent compensation actually paid to our PEO and the average compensation actually paid to our remaining NEOs for the relevant fiscal year, as determined under SEC rules (and described in Note 2 below), which includes the individuals indicated in the table below for each fiscal year:
| Year | PEO | Non-PEO NEOs | ||||||||||||
| 2025 | David P. Meeker | Hunter C. Smith, Jennifer Lee, Yann Mazabraud and Alastair Garfield | ||||||||||||
| 2024 | David P. Meeker | Hunter C. Smith, Jennifer Lee, Yann Mazabraud and Joseph Shulman | ||||||||||||
| 2023 | David P. Meeker | Hunter C. Smith, Jennifer Lee, Yann Mazabraud and Joseph Shulman | ||||||||||||
| 2022 | David P. Meeker | Hunter C. Smith, Jennifer Lee, Yann Mazabraud and Joseph Shulman | ||||||||||||
| 2021 | David P. Meeker | Hunter C. Smith, Murray Stewart, Jennifer Lee, Yann Mazabraud and Joseph Shulman | ||||||||||||
(2)For the relevant fiscal year, represents the cumulative TSR (the “Peer Group TSR”) of the NASDAQ Biotechnology Index (the “Peer Group”). The dollar amounts reported represent the amount of net loss reflected in the Company's audited financial statements for the applicable fiscal year.
The 2025 Summary Compensation Table totals reported for the PEO and the average of the Other NEOs for each year were subject to the following adjustments per Item 402(v)(2)(iii) of Regulation S-K to calculate “compensation actually paid”:
| 2025 | |||||||||||
| PEO | Average for Other NEO’s | ||||||||||
| Summary Compensation Table Total | 17,544,525 | 5,594,181 | |||||||||
ADJUSTMENTS(a): | |||||||||||
| Deduction for Amounts reported under the “Stock Awards” and “Option Awards” Columns in the Summary Compensation Table(a) | (15,963,345) | (4,716,770) | |||||||||
| Increase based on ASC 718 Fair Value of Awards Granted during Applicable FY that Remain Unvested as of Applicable FY End, determined as of Applicable FY End | 27,463,032 | 7,464,689 | |||||||||
| Increase based on ASC 718 Fair Value of Awards Granted during Applicable FY that Vested during Applicable FY, determined as of Vesting Date | 2,236,519 | 608,054 | |||||||||
| Increase/deduction for Awards Granted during Prior FY that were Outstanding and Unvested as of Applicable FY End, determined based on change in ASC 718 Fair Value from Prior FY End to Applicable FY End | 17,766,871 | 4,961,562 | |||||||||
| Increase/deduction for Awards Granted during Prior FY that Vested During Applicable FY, determined based on change in ASC 718 Fair Value from Prior FY End to Vesting Date | 5,110,282 | 784,018 | |||||||||
| Deduction of ASC 718 Fair Value of Awards Granted during Prior FY that were Forfeited during Applicable FY, determined as of Prior FY End | — | — | |||||||||
| Increase based on Dividends or Other Earnings Paid during Applicable FY prior to Vesting Date | — | — | |||||||||
| Increase based on Incremental Fair Value of Options/SARs Modified during Applicable FY | — | — | |||||||||
| Adjustments Related to Defined Benefit and Actuarial Pension Plans | — | — | |||||||||
| Compensation Actually Paid | 54,157,885 | 14,695,734 | |||||||||
Pay Versus Performance Tabular List
We believe the following performance measures represent the most important financial performance measures used by us to link compensation actually paid to our NEOs for the fiscal year ended December 31, 2025:
•Total revenues;
•Total stockholders return; and
•Cash used in operations.
Measurement date equity fair values are calculated with assumptions derived on a basis consistent with those used for grant date fair value purposes. RSUs and PSUs are valued based on the closing stock price on the relevant measurement date. Stock options are valued using a Black-Scholes model as at the relevant measurement dates.
(3)Revenue is the Company’s selected GAAP measure.