Pay vs Performance Disclosure - USD ($)
Dec. 31, 2025
Dec. 31, 2024
Dec. 31, 2023
Pay Versus Performance Table
The following table sets forth information concerning the compensation of our NEOs for each of the fiscal years ended December 31, 2023, 2024, and 2025 and our financial performance for each such fiscal year:
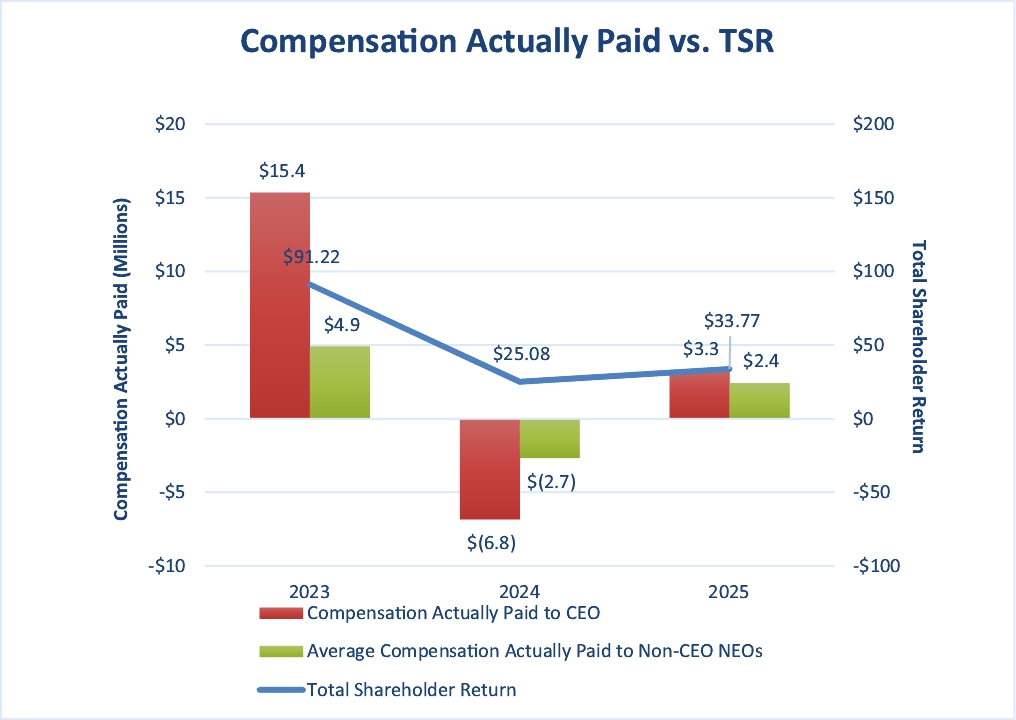
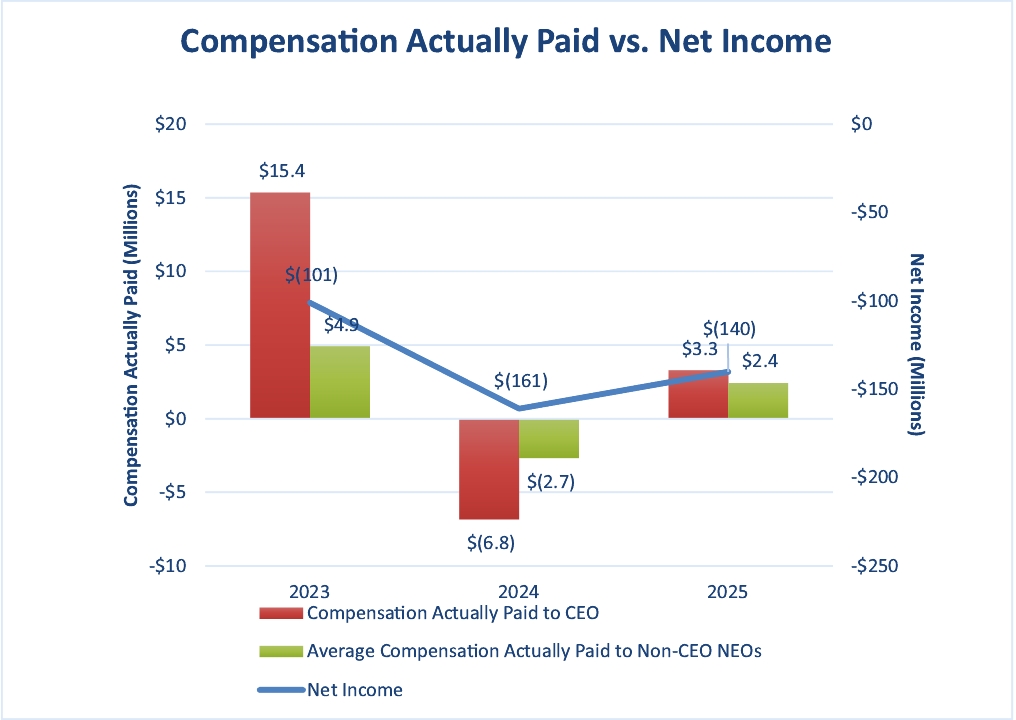
Year | Summary Compensation Table Total for PEO ($) | Compensation Actually Paid to PEO ($)(1)(2) | Average Summary Compensation Table Total for Non-PEO NEOs ($) | Average Compensation Actually Paid to Non-PEO NEOs ($)(1)(2) | Value of Initial Fixed $100 Investment Based on Total Shareholder Return ($)(3) | Net Income (thousands) ($) | ||||||||||||
2025 | 2,051,343 | 3,294,878 | 2,716,238 | 2,430,045 | 33.77 | (140,109) | ||||||||||||
2024 | 1,009,004 | (6,841,155) | 779,253 | (2,676,111) | 25.08 | (160,868) | ||||||||||||
2023 | 10,286,808 | 15,354,119 | 4,254,605 | 4,914,905 | 91.22 | (100,837) | ||||||||||||
(1) | Amounts represent compensation actually paid to our principal executive officer (the “PEO” or the “principal executive officer”) and the average compensation actually paid to our remaining NEOs for the relevant fiscal year, as determined under Securities Exchange Commission rules (and described below), which includes the individuals indicated in the table below for each fiscal year: |
Year | PEO | Non-PEO NEOs | ||||
2025 | David Kirn | Kristian Humer, Fariborz Kamal | ||||
2024 | David Kirn | Fariborz Kamal, Uneek Mehra | ||||
2023 | David Kirn | Fariborz Kamal, Robert Kim | ||||
Compensation actually paid to our NEOs represents the “Total” compensation reported in the Summary Compensation Table for the applicable fiscal year, as adjusted as follows:
2025 | 2024 | 2023 | ||||||||||||||||
Adjustments | PEO ($) | Average Non-PEO NEOs ($) | PEO ($) | Average Non-PEO NEOs ($) | PEO ($) | Average Non-PEO NEOs ($) | ||||||||||||
Summary Compensation Table – Total Compensation Reported | 2,051,343 | 2,716,238 | 1,009,004 | 779,253 | 10,286,808 | 4,254,605 | ||||||||||||
Deduction for Amounts Reported under the “Stock Awards” and “Option Awards” Columns in the Summary Compensation Table for Applicable FY | (822,750) | (2,211,680) | — | — | (9,278,715) | (3,509,083) | ||||||||||||
Increase based on ASC 718 Fair Value of Awards Granted during Applicable FY that Remain Unvested as of Applicable FY End, determined as of Applicable FY End | 1,316,331 | 1,722,669 | — | — | 11,572,246 | 4,636,819 | ||||||||||||
Increase/deduction for Awards Granted during Prior FY that were Outstanding and Unvested as of Applicable FY End, determined based on change in ASC 718 Fair Value from Prior FY End to Applicable FY End | 428,652 | 100,824 | (7,621,346) | (3,201,389) | 1,594,335 | (303,526) | ||||||||||||
Increase based on ASC 718 Fair Value of Awards Granted during Applicable FY that Vested during Applicable FY, determined as of Vesting Date | 243,987 | 81,352 | — | — | 470,412 | 132,708 | ||||||||||||
Increase/deduction for Awards Granted during Prior FY that Vested During Applicable FY, determined based on change in ASC 718 Fair Value from Prior FY End to Vesting Date | 77,314 | 20,643 | (228,813) | (253,975) | 709,033 | (296,618) | ||||||||||||
Compensation Actually Paid | 3,294,878 | 2,430,045 | (6,841,155) | (2,676,111) | 15,354,119 | 4,914,905 | ||||||||||||
(2) | Fair value or change in fair value, as applicable, of equity awards in the “Compensation Actually Paid” columns was determined by reference to a Black Scholes value as of the applicable year-end or vesting date(s), determined based on the same methodology as used to determine grant date fair value but using the closing stock price on the applicable revaluation date as the current market price and with an expected life calculated as of the revaluation date, and in all cases based on volatility and risk free rates determined as of the revaluation date based on the expected life period and based on an expected dividend rate of 0%. For additional information on the assumptions used to calculate the valuation of the awards, see the Notes to Consolidated Financial Statements in our Annual Report on Form 10-K for the fiscal year ended December 31, 2025 and prior fiscal years. |
(3) | Assumes $100 was invested for the period starting December 31, 2022, through the end of the listed year. Historical stock performance is not necessarily indicative of future stock performance. |
(1) | Amounts represent compensation actually paid to our principal executive officer (the “PEO” or the “principal executive officer”) and the average compensation actually paid to our remaining NEOs for the relevant fiscal year, as determined under Securities Exchange Commission rules (and described below), which includes the individuals indicated in the table below for each fiscal year: |
Year | PEO | Non-PEO NEOs | ||||
2025 | David Kirn | Kristian Humer, Fariborz Kamal | ||||
2024 | David Kirn | Fariborz Kamal, Uneek Mehra | ||||
2023 | David Kirn | Fariborz Kamal, Robert Kim | ||||
Compensation actually paid to our NEOs represents the “Total” compensation reported in the Summary Compensation Table for the applicable fiscal year, as adjusted as follows:
2025 | 2024 | 2023 | ||||||||||||||||
Adjustments | PEO ($) | Average Non-PEO NEOs ($) | PEO ($) | Average Non-PEO NEOs ($) | PEO ($) | Average Non-PEO NEOs ($) | ||||||||||||
Summary Compensation Table – Total Compensation Reported | 2,051,343 | 2,716,238 | 1,009,004 | 779,253 | 10,286,808 | 4,254,605 | ||||||||||||
Deduction for Amounts Reported under the “Stock Awards” and “Option Awards” Columns in the Summary Compensation Table for Applicable FY | (822,750) | (2,211,680) | — | — | (9,278,715) | (3,509,083) | ||||||||||||
Increase based on ASC 718 Fair Value of Awards Granted during Applicable FY that Remain Unvested as of Applicable FY End, determined as of Applicable FY End | 1,316,331 | 1,722,669 | — | — | 11,572,246 | 4,636,819 | ||||||||||||
Increase/deduction for Awards Granted during Prior FY that were Outstanding and Unvested as of Applicable FY End, determined based on change in ASC 718 Fair Value from Prior FY End to Applicable FY End | 428,652 | 100,824 | (7,621,346) | (3,201,389) | 1,594,335 | (303,526) | ||||||||||||
Increase based on ASC 718 Fair Value of Awards Granted during Applicable FY that Vested during Applicable FY, determined as of Vesting Date | 243,987 | 81,352 | — | — | 470,412 | 132,708 | ||||||||||||
Increase/deduction for Awards Granted during Prior FY that Vested During Applicable FY, determined based on change in ASC 718 Fair Value from Prior FY End to Vesting Date | 77,314 | 20,643 | (228,813) | (253,975) | 709,033 | (296,618) | ||||||||||||
Compensation Actually Paid | 3,294,878 | 2,430,045 | (6,841,155) | (2,676,111) | 15,354,119 | 4,914,905 | ||||||||||||
(2) | Fair value or change in fair value, as applicable, of equity awards in the “Compensation Actually Paid” columns was determined by reference to a Black Scholes value as of the applicable year-end or vesting date(s), determined based on the same methodology as used to determine grant date fair value but using the closing stock price on the applicable revaluation date as the current market price and with an expected life calculated as of the revaluation date, and in all cases based on volatility and risk free rates determined as of the revaluation date based on the expected life period and based on an expected dividend rate of 0%. For additional information on the assumptions used to calculate the valuation of the awards, see the Notes to Consolidated Financial Statements in our Annual Report on Form 10-K for the fiscal year ended December 31, 2025 and prior fiscal years. |
TSR amounts reported in the graph assume an initial fixed investment of $100, and that all dividends, if any, were reinvested.