Pay vs Performance Disclosure - USD ($)
Dec. 31, 2025
Dec. 31, 2024
Dec. 31, 2023
| Year | Summary Compensation Table (“SCT”) Total for PEO ($) | Compensation Actually Paid to PEO ($)(1) | Average SCT Total for Non-PEO NEOs ($)(2) | Average Compensation Actually Paid to Non-PEO NEOs ($)(2)(3) | Value of Initial Fixed $100 Investment Based On: | Net Loss ($)(in thousands) | ||||||||||||||
| Editas Total Shareholder Return ($)(4) | ||||||||||||||||||||
| 2025 | 2,353,655 | 3,119,632 | 999,023 | 1,173,992 | 23.11 | (160,060) | ||||||||||||||
| 2024 | 5,126,868 | (3,071,419) | 1,315,361 | (573,093) | 14.32 | (237,093) | ||||||||||||||
| 2023 | 2,392,309 | 3,764,809 | 1,555,391 | 1,575,614 | 114.21 | (153,219) | ||||||||||||||
PEO Summary Compensation Total to CAP Reconciliation
| Year | PEO | SCT Total for PEO($) | SCT Value of Equity Awards($)(i) | Equity Award Adjustments($)(ii) | Compensation Actually Paid to PEO($) | ||||||||||||
| 2025 | Gilmore O’Neill | 2,353,655 | 1,282,937 | 2,048,914 | 3,119,632 | ||||||||||||
| 2024 | Gilmore O’Neill | 5,126,868 | 4,010,582 | (4,187,705) | (3,071,419) | ||||||||||||
| 2023 | Gilmore O’Neill | 2,392,309 | 1,351,390 | 2,723,890 | 3,764,809 | ||||||||||||
(i)The amounts included in this column are the amounts reported in the “Stock Awards” and “Option Awards” columns of the Summary Compensation Table for each applicable year.
(ii)The equity award adjustments for each applicable year were calculated in accordance with the methodology required by Item 402(v) of Regulation S-K. The amounts added or deducted in calculating the equity award adjustments are provided in the table below:
| Equity Award Adjustments | |||||||||||||||||||||||
| Year | PEO | Year-End Fair Value of Awards Granted During Applicable Year That Remain Outstanding and Unvested as of Year-End($) | Change in Fair Value as of Year- End of any Prior-Year Awards that Remain Outstanding and Unvested as of Year- End($) | Fair Value as of the Vesting Date of Awards Granted and Vested During the Applicable Year($) | Change in Fair Value as of the Vesting Date of any Prior-Year Awards that Vested During Applicable Year($) | Fair Value at Prior-Year-End of any Prior- Year Awards that Failed to Meet Applicable Vesting Conditions During the Applicable Year($) | Total Equity Awards Adjustments($) | ||||||||||||||||
| 2025 | Gilmore O’Neill | 1,316,398 | 235,220 | 287,655 | 209,641 | — | 2,048,914 | ||||||||||||||||
| 2024 | Gilmore O’Neill | 273,351 | (3,511,297) | 170,662 | (1,120,421) | — | (4,187,705) | ||||||||||||||||
| 2023 | Gilmore O’Neill | 1,355,969 | 1,115,369 | 158,944 | 93,608 | — | 2,723,890 | ||||||||||||||||
Average Non-PEO NEO Summary Compensation Total to CAP Reconciliation
| Year | Average SCT Total for Non-PEO NEOs($) | Average SCT Value of Equity Awards for Non-PEO NEOs($) | Average Equity Award Adjustments($)(i) | Average Compensation Actually Paid to Non-PEO NEOs($) | ||||||||||
| 2025 | 999,023 | 353,776 | 528,745 | 1,173,992 | ||||||||||
| 2024 | 1,315,361 | 580,531 | (1,307,923) | (573,093) | ||||||||||
| 2023 | 1,555,391 | 1,023,385 | 1,043,608 | 1,575,614 | ||||||||||
(i)The amounts added or deducted in calculating the total average equity award adjustments are provided in the table below:
| Equity Award Adjustments | ||||||||||||||||||||
| Year | Average Year-End Fair Value of Awards Granted During Applicable Year That Remain Outstanding and Unvested as of Year-End($) | Average Change in Fair Value as of Year-End of any Prior-Year Awards that Remain Outstanding and Unvested as of Year-End($) | Average Fair Value as of the Vesting Date of Awards Granted and Vested During the Applicable Year($) | Average Change in Fair Value as of the Vesting Date of any Prior-Year Awards that Vested During Applicable Year($) | Average Fair Value at Prior-Year-End of any Prior-Year Awards that Failed to Meet Applicable Vesting Conditions During the Applicable Year($) | Total Average Equity Awards Adjustments($) | ||||||||||||||
| 2025 | 377,474 | 37,631 | 79,304 | 34,336 | — | 528,745 | ||||||||||||||
| 2024 | 173,603 | (1,155,110) | 56,322 | (382,738) | — | (1,307,923) | ||||||||||||||
| 2023 | 926,961 | 99,157 | 30,033 | (12,543) | — | 1,043,608 | ||||||||||||||
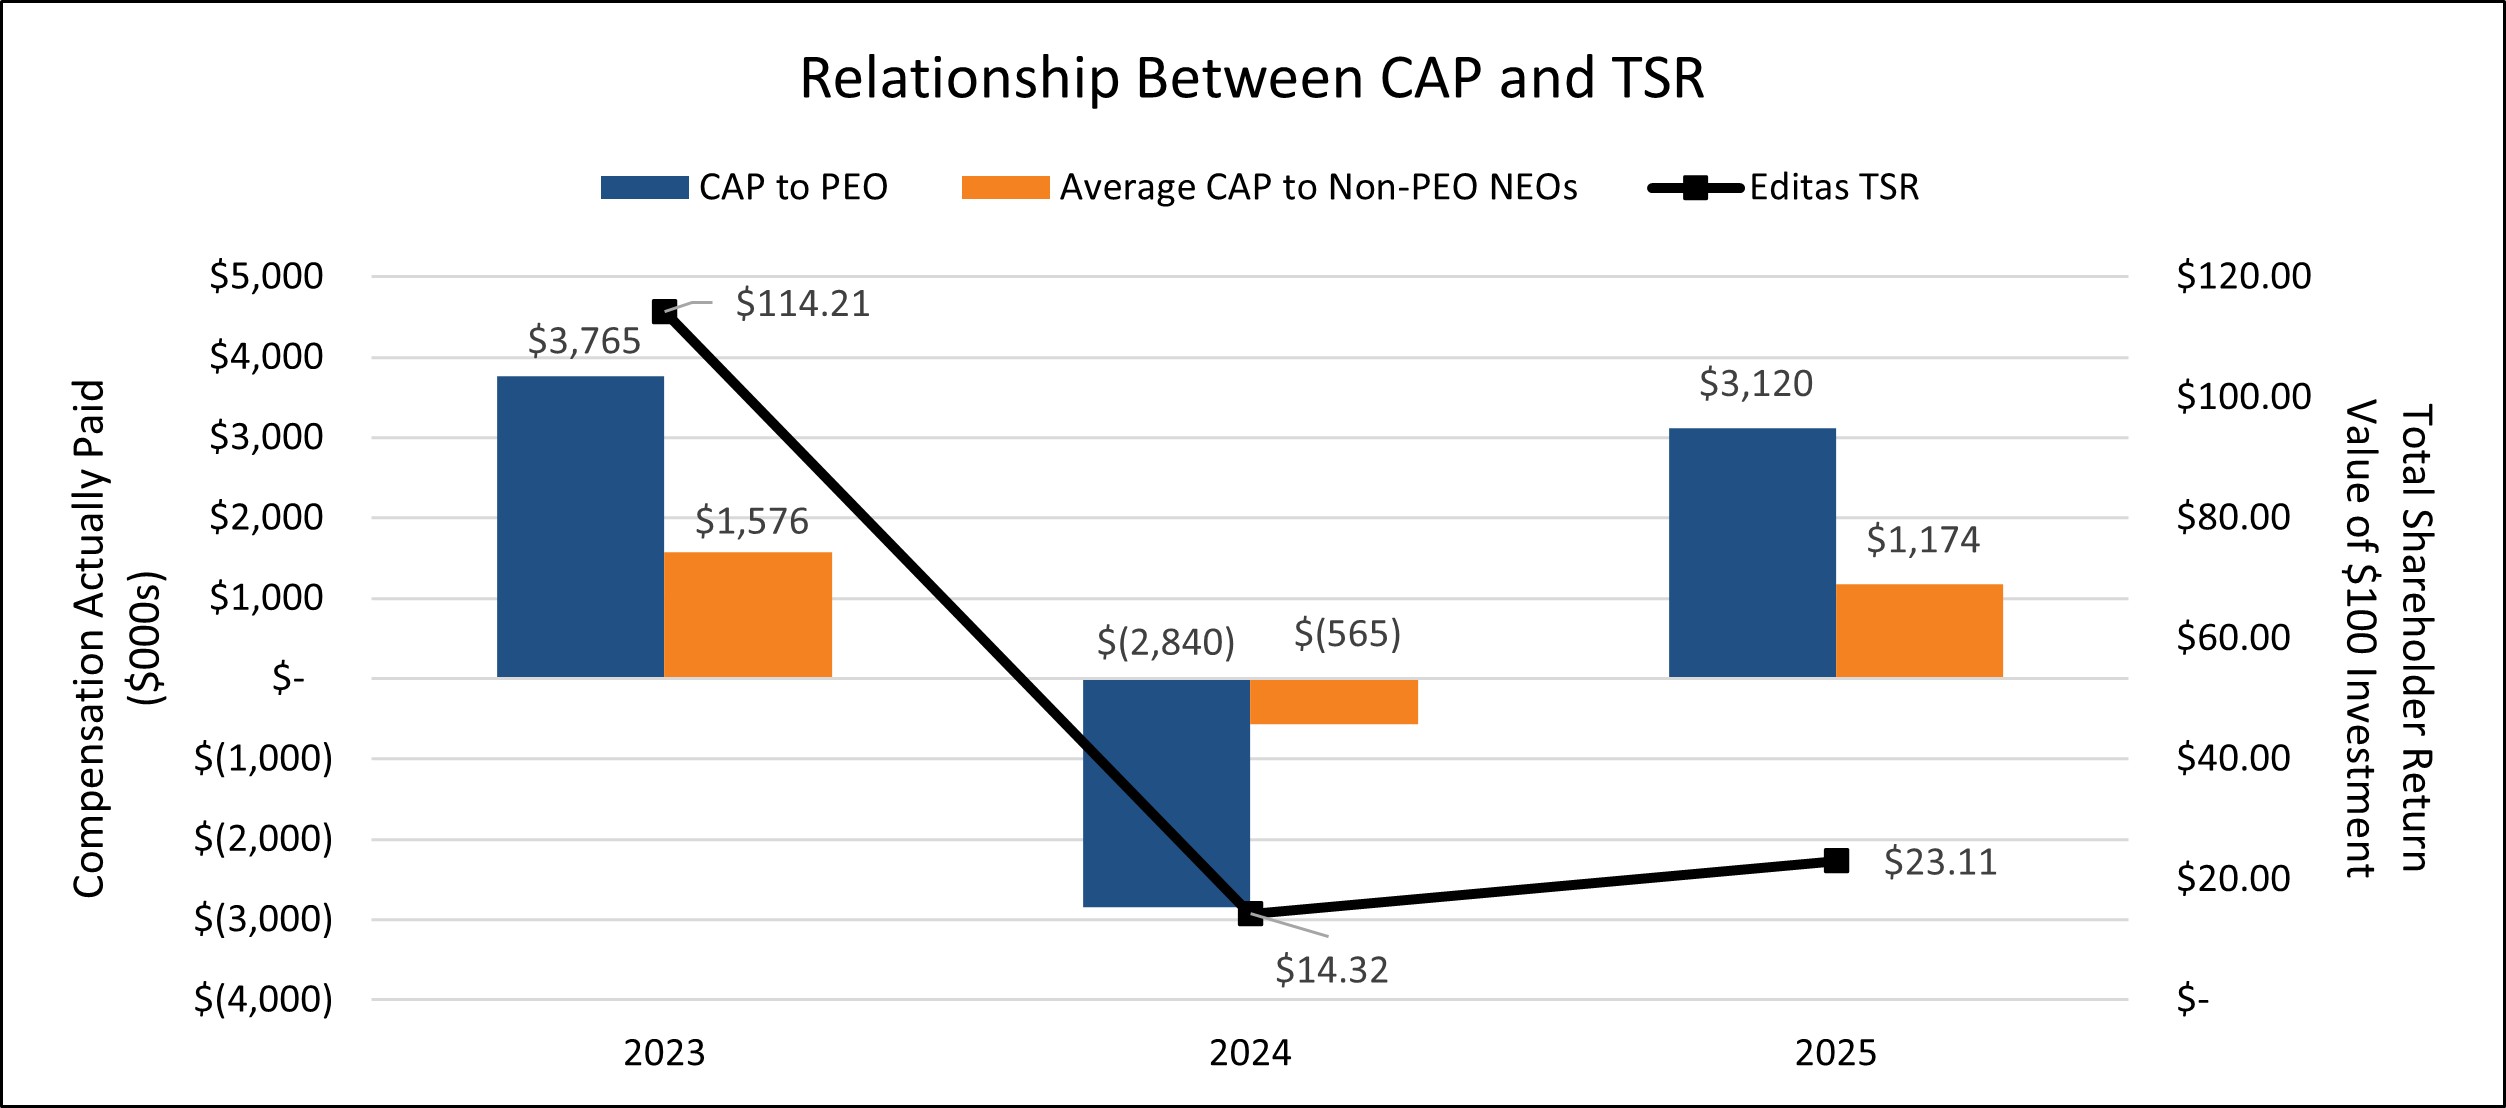
CAP and Cumulative TSR
CAP and Net Income (Loss)
Analysis of the Information Presented in the Pay Versus Performance Table
We describe the relationships between CAP and our cumulative TSR and net loss below. We currently do not use financial performance measures, including our cumulative TSR or our net loss in our compensation program or for comparison to any corporate goals. Instead, our compensation program is designed primarily to advance our product development pipeline and preclinical programs, thereby driving long-term stockholder value. For example, our 2025 annual performance-based cash bonus program included goals relating to our objective to be a late-stage, in vivo development company, building a differentiated in vivo therapeutic pipeline, sustaining a best-in-class employee experience, and maintaining financial discipline. See “Overview of Executive Compensation” for a detailed description of our compensation program. We believe that using these non-financial performance metrics best incentivizes our executive management and strengthens our alignment with our pay for performance compensation philosophy, while focusing on our long-term sustainable growth.
Components of Compensation Actually Paid that Vary with Performance
The components of CAP that vary with performance each year are: our annual incentive payouts, the fair value of long-term incentive awards granted in each year and the change in fair value of equity awards during the year. The decisions regarding our annual incentive payouts and our long-term incentive awards are described in our proxy statements for the applicable year, including this Proxy Statement.
The addition of the change in fair value of equity awards during the year is the most significant performance-related difference between CAP and the totals reported in the Summary Compensation Table. The change in fair value of equity awards during the year varies with our annual share price appreciation and performance against our outstanding PSU goals.
Pay versus Performance: Graphical Descriptions
The illustrations below provide a graphical description of CAP (as calculated in accordance with the SEC rules) and the following measures:
•Editas’ cumulative TSR; and
•Editas’ net loss.
For purposes of reflecting CAP in these charts, we have aggregated the compensation of the PEOs in each year where there was more than one PEO for such year.