Pay Versus Performance
In accordance with rules adopted by the Securities and Exchange Commission pursuant to the Dodd-Frank Wall Street Reform and Consumer Protection Act of 2010, we provide the following disclosure regarding executive compensation for our principal executive officer (“PEO”) and Non-PEO NEOs and Company performance for the fiscal years listed below. The Compensation Committee did not consider the pay versus performance disclosure below in making its pay decisions for any of the years shown.
|
|
|
|
|
|
|
|
Average |
|
|
|
|
|
|
|
|
|
|
||||||
|
|
|
|
|
|
|
|
Summary |
|
|
Average |
|
|
Value of Initial |
|
|
|
|
||||||
|
|
|
|
|
|
|
|
Compensation |
|
|
Compensation |
|
|
Fixed $100 |
|
|
|
|
||||||
|
|
|
|
|
|
|
|
Table Total |
|
|
Actually Paid |
|
|
Investment |
|
|
|
|
||||||
|
|
Summary |
|
|
|
|
|
for Non-PEO |
|
|
to Non-PEO |
|
|
Based On: |
|
|
|
|
||||||
|
|
Compensation |
|
|
Compensation |
|
|
Named |
|
|
Named |
|
|
Total |
|
|
|
|
||||||
|
|
Table Total |
|
|
Actually Paid |
|
|
Executive |
|
|
Executive |
|
|
Stockholder |
|
|
Net Income |
|
||||||
Fiscal |
|
for PEO(1) |
|
|
to PEO(1)(2)(3) |
|
|
Officers(1) |
|
|
Officers(1)(2)(3) |
|
|
Return(4) |
|
|
(Loss)(5) |
|
||||||
Year |
|
($) |
|
|
($) |
|
|
($) |
|
|
($) |
|
|
($) |
|
|
($ in thousands) |
|
||||||
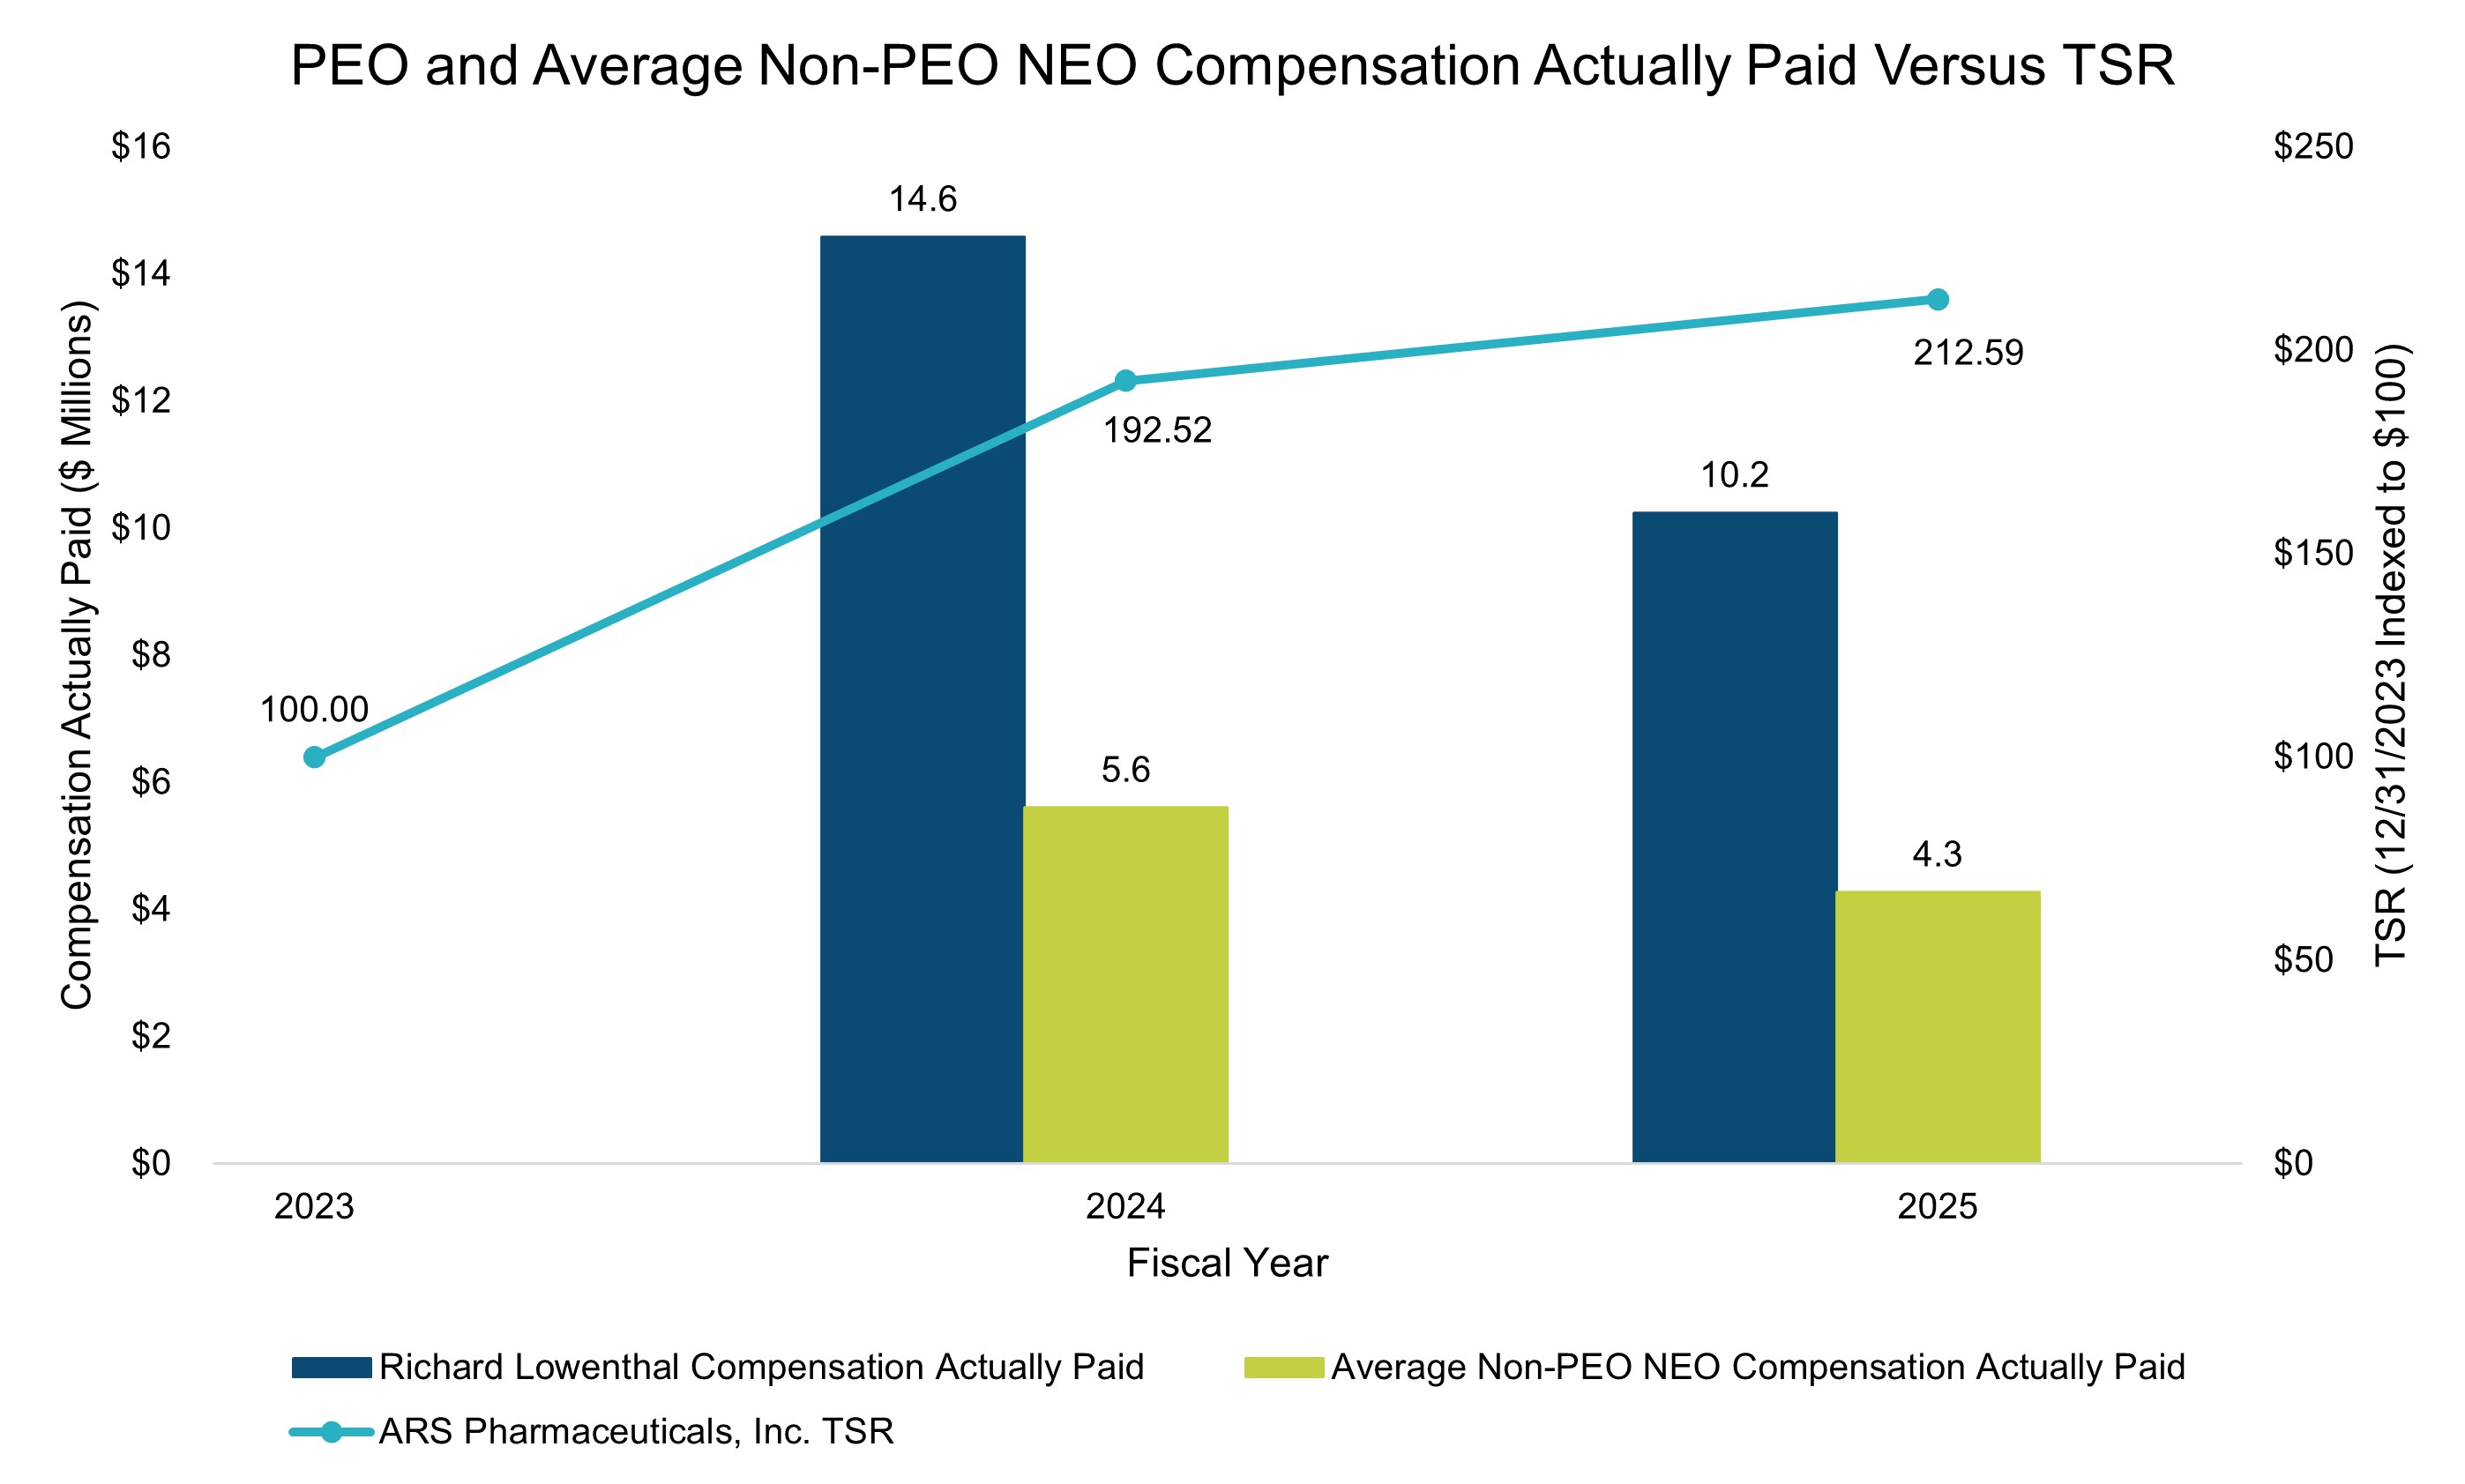
2025 |
|
|
9,656,400 |
|
|
|
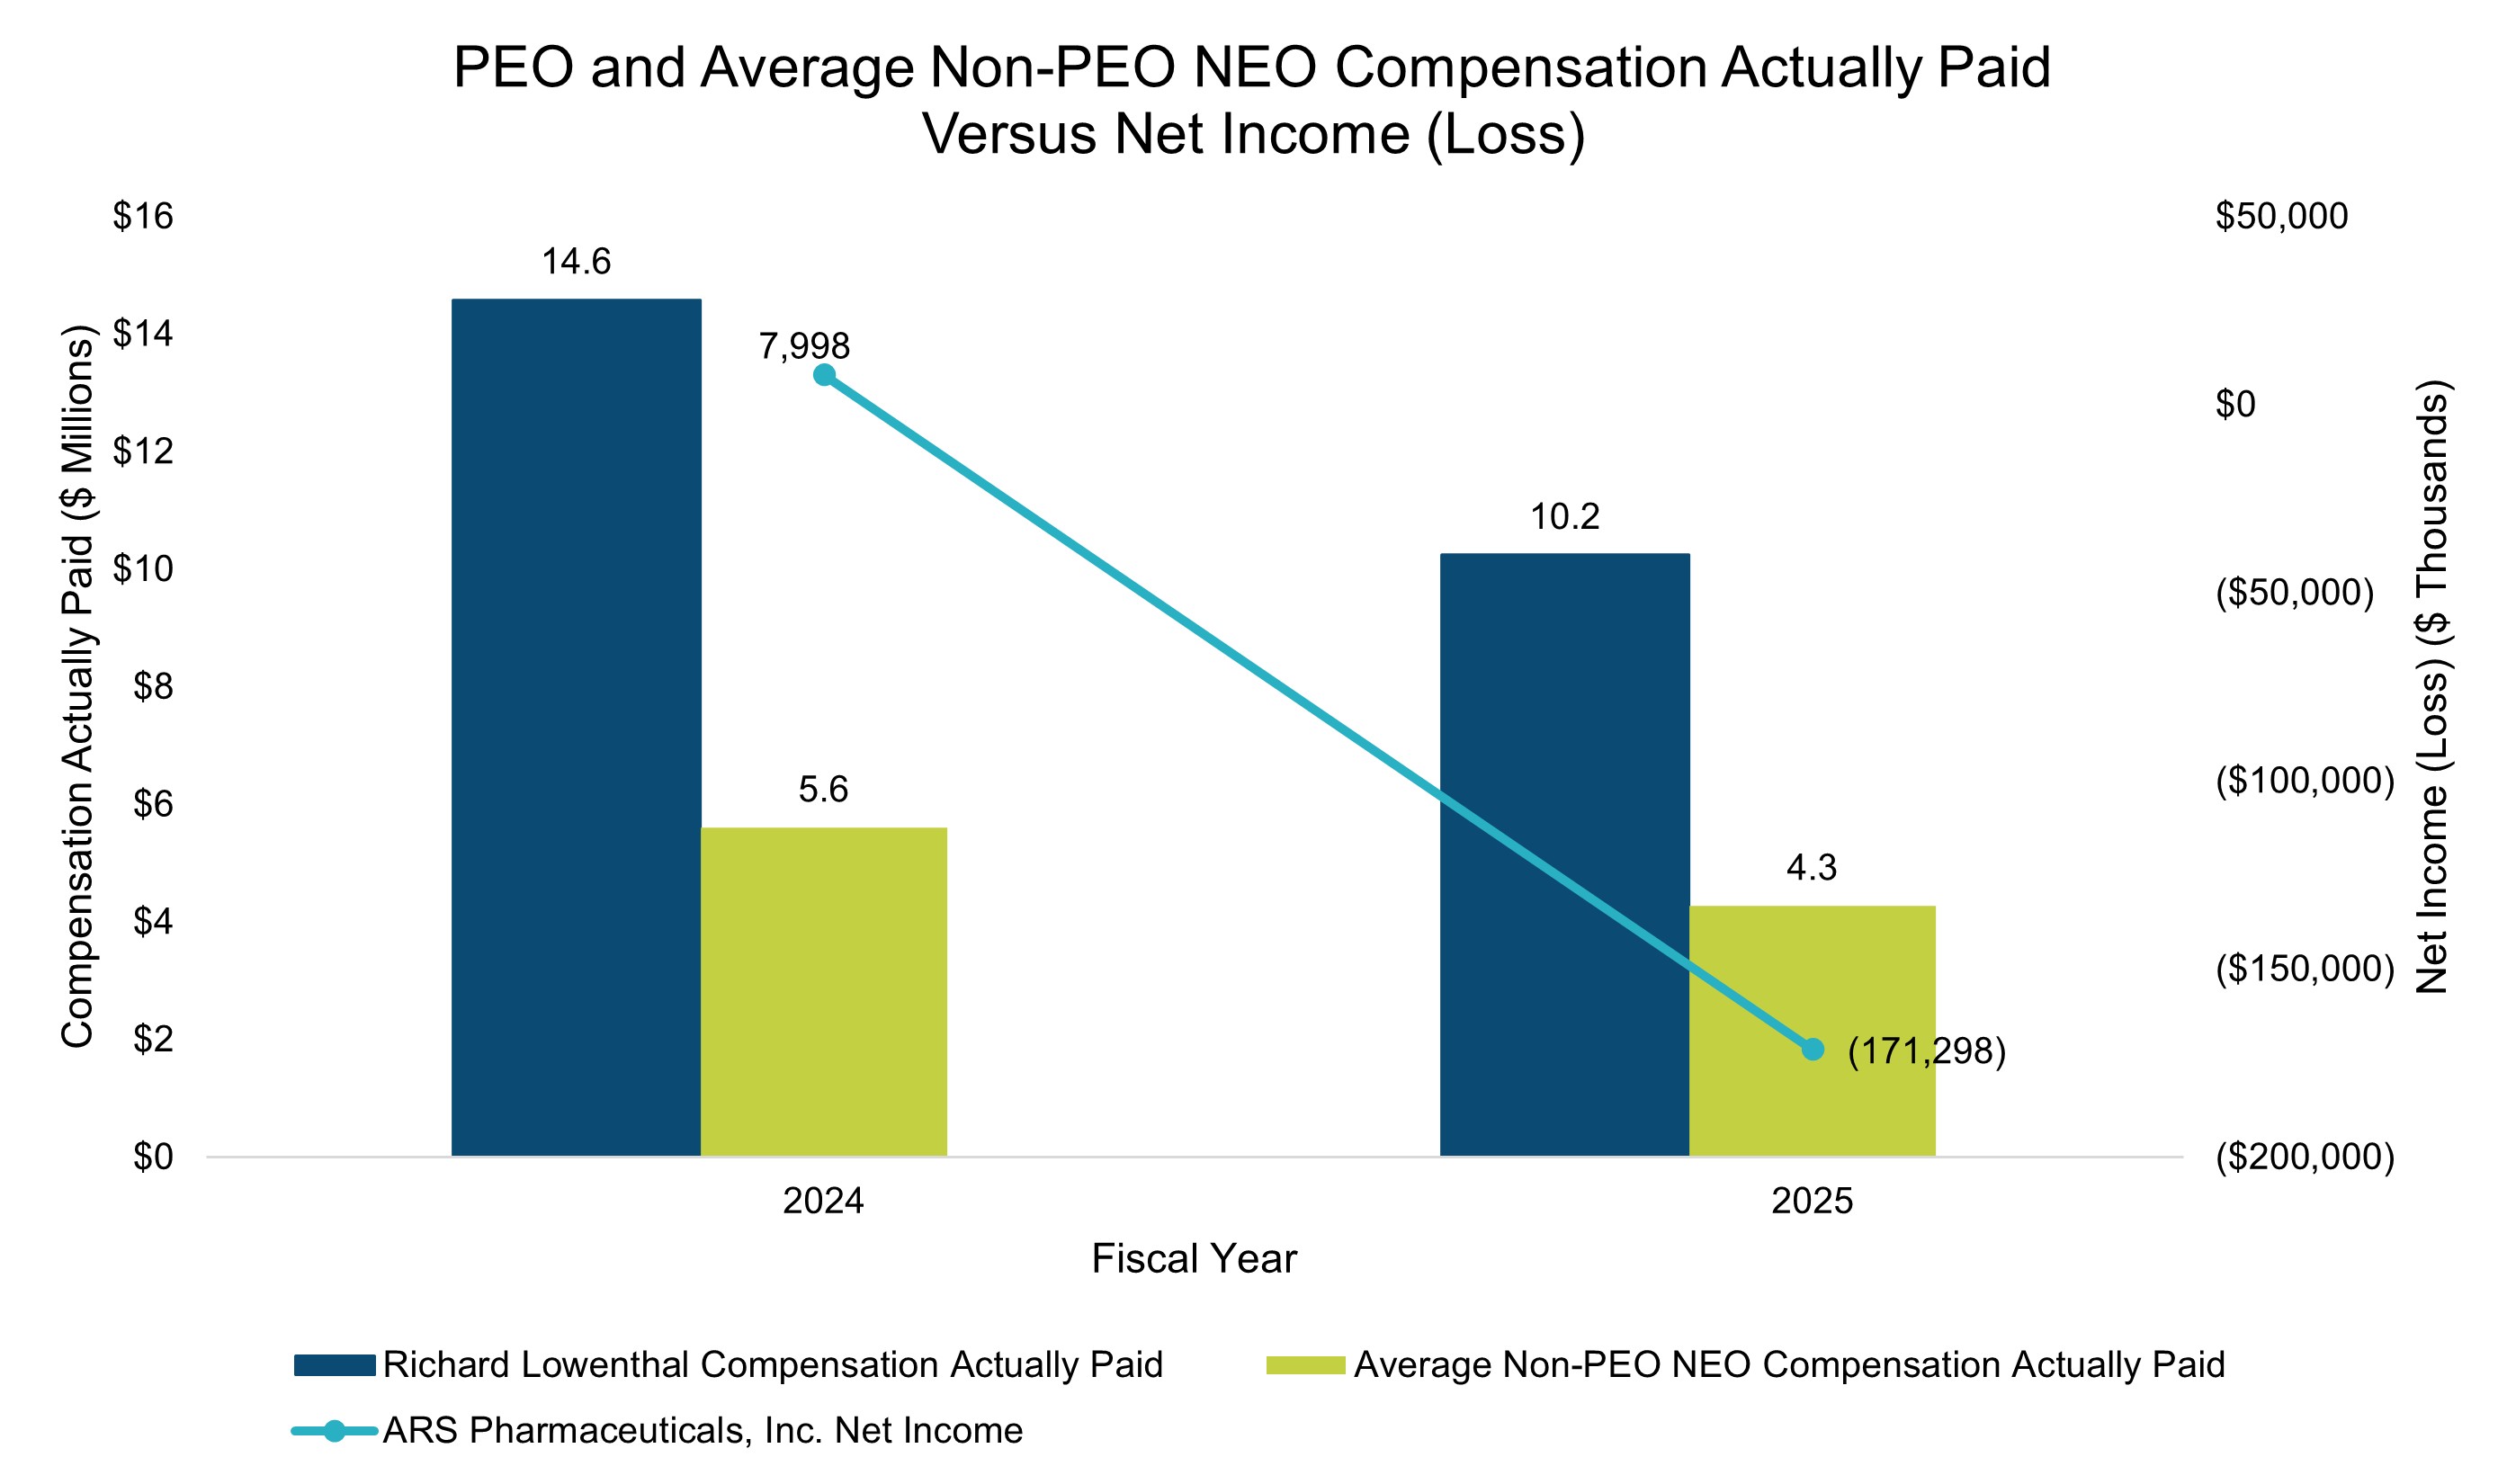
10,249,084 |
|
|
|
4,089,290 |
|
|
|
4,278,578 |
|
|
|
213 |
|
|
|
(171,298 |
) |
2024 |
|
|
7,174,995 |
|
|
|
14,589,562 |
|
|
|
3,240,922 |
|
|
|
5,610,043 |
|
|
|
193 |
|
|
|
7,998 |
|
2024 |
|
2025 |
Sarina Tanimoto |
|
Sarina Tanimoto |
Brian T. Dorsey |
|
Justin Chakma |
|
|
|
Fiscal Year |
|
|||||
|
|
|
2025 |
|
|
2024 |
|
||
Summary Compensation Table Total for PEO |
|
$ |
9,656,400 |
|
|
$ |
7,174,995 |
|
|
( - ) |
Grant Date Fair Value of Stock Options Granted in the Fiscal Year |
|
|
(6,176,110 |
) |
|
|
(3,842,080 |
) |
( + ) |
Fair Value at Fiscal Year End of Outstanding and Unvested Stock Options Granted in the Fiscal Year |
|
|
4,773,539 |
|
|
|
7,649,271 |
|
( + ) |
Change in Fair Value at Fiscal Year End of Outstanding and Unvested Stock Options Granted in Prior Fiscal Years |
|
|
143,534 |
|
|
|
2,393,046 |
|
( + ) |
Fair Value at Vesting of Stock Options Granted and Vested in the Fiscal Year |
|
|
1,534,951 |
|
|
|
— |
|
( + ) |
Change in Fair Value as of the Vesting Date of Stock Options Granted in Prior Fiscal Years that Vested in the Fiscal Year |
|
|
316,770 |
|
|
|
1,214,330 |
|
Compensation Actually Paid to PEO |
|
$ |
10,249,084 |
|
|
$ |
14,589,562 |
|
|
|
|
|
Fiscal Year |
|
|||||
|
|
|
2025 |
|
|
2024 |
|
||
Average Summary Compensation Table Total for Non-PEO Named Executive Officers |
|
$ |
4,089,290 |
|
|
$ |
3,240,922 |
|
|
( - ) |
Grant Date Fair Value of Stock Options Granted in the Fiscal Year |
|
|
(2,156,328 |
) |
|
|
(1,418,950 |
) |
( + ) |
Fair Value at Fiscal Year End of Outstanding and Unvested Stock Options Granted in the Fiscal Year |
|
|
1,666,639 |
|
|
|
2,825,015 |
|
( + ) |
Change in Fair Value at Fiscal Year End of Outstanding and Unvested Stock Options Granted in Prior Fiscal Years |
|
|
50,921 |
|
|
|
603,669 |
|
( + ) |
Fair Value at Vesting of Stock Options Granted and Vested in the Fiscal Year |
|
|
535,908 |
|
|
|
— |
|
( + ) |
Change in Fair Value as of the Vesting Date of Stock Options Granted in Prior Fiscal Years that Vested in the Fiscal Year |
|
|
92,148 |
|
|
|
359,387 |
|
Average Compensation Actually Paid to Non-PEO Named Executive Officers |
|
$ |
4,278,578 |
|
|
$ |
5,610,043 |
|
|
2024 |
|
2025 |
Sarina Tanimoto |
|
Sarina Tanimoto |
Brian T. Dorsey |
|
Justin Chakma |
|
|
|
Fiscal Year |
|
|||||
|
|
|
2025 |
|
|
2024 |
|
||
Summary Compensation Table Total for PEO |
|
$ |
9,656,400 |
|
|
$ |
7,174,995 |
|
|
( - ) |
Grant Date Fair Value of Stock Options Granted in the Fiscal Year |
|
|
(6,176,110 |
) |
|
|
(3,842,080 |
) |
( + ) |
Fair Value at Fiscal Year End of Outstanding and Unvested Stock Options Granted in the Fiscal Year |
|
|
4,773,539 |
|
|
|
7,649,271 |
|
( + ) |
Change in Fair Value at Fiscal Year End of Outstanding and Unvested Stock Options Granted in Prior Fiscal Years |
|
|
143,534 |
|
|
|
2,393,046 |
|
( + ) |
Fair Value at Vesting of Stock Options Granted and Vested in the Fiscal Year |
|
|
1,534,951 |
|
|
|
— |
|
( + ) |
Change in Fair Value as of the Vesting Date of Stock Options Granted in Prior Fiscal Years that Vested in the Fiscal Year |
|
|
316,770 |
|
|
|
1,214,330 |
|
Compensation Actually Paid to PEO |
|
$ |
10,249,084 |
|
|
$ |
14,589,562 |
|
|
|
|
|
Fiscal Year |
|
|||||
|
|
|
2025 |
|
|
2024 |
|
||
Average Summary Compensation Table Total for Non-PEO Named Executive Officers |
|
$ |
4,089,290 |
|
|
$ |
3,240,922 |
|
|
( - ) |
Grant Date Fair Value of Stock Options Granted in the Fiscal Year |
|
|
(2,156,328 |
) |
|
|
(1,418,950 |
) |
( + ) |
Fair Value at Fiscal Year End of Outstanding and Unvested Stock Options Granted in the Fiscal Year |
|
|
1,666,639 |
|
|
|
2,825,015 |
|
( + ) |
Change in Fair Value at Fiscal Year End of Outstanding and Unvested Stock Options Granted in Prior Fiscal Years |
|
|
50,921 |
|
|
|
603,669 |
|
( + ) |
Fair Value at Vesting of Stock Options Granted and Vested in the Fiscal Year |
|
|
535,908 |
|
|
|
— |
|
( + ) |
Change in Fair Value as of the Vesting Date of Stock Options Granted in Prior Fiscal Years that Vested in the Fiscal Year |
|
|
92,148 |
|
|
|
359,387 |
|
Average Compensation Actually Paid to Non-PEO Named Executive Officers |
|
$ |
4,278,578 |
|
|
$ |
5,610,043 |
|
|