Pay vs Performance Disclosure - USD ($)
Dec. 31, 2025
Dec. 31, 2024
Dec. 31, 2023
Dec. 31, 2022
Dec. 31, 2021
Pay versus Performance
As required by Item 402(v) of Regulation ”) to our NEOs, we are required to make various adjustments to amounts that have been previously reported in the Summary Compensation Table in previous years, as the SEC’s valuation methods for this section differ from those required in the Summary Compensation Table.
S-K,
we are providing the following information regarding the relationship between executive compensation and our financial performance for each of the last four completed calendar years. In determining the “compensation actually paid” (“CAP
Year |
Summary Compensation Total for PEO($) (1) |
Compensation Actually Paid to PEO($) (2) |
Average Summary Compensation Table Total for Non-PEO NEOs($) (1) |
Average Compensation Actually Paid to Non-PEO NEOs($) (2) |
Value of Initial Fixed $100 Investment Based On: |
Net Income($) (4) |
Adjusted Operating Profit($) (4) |
|||||||||||||||||||||||||
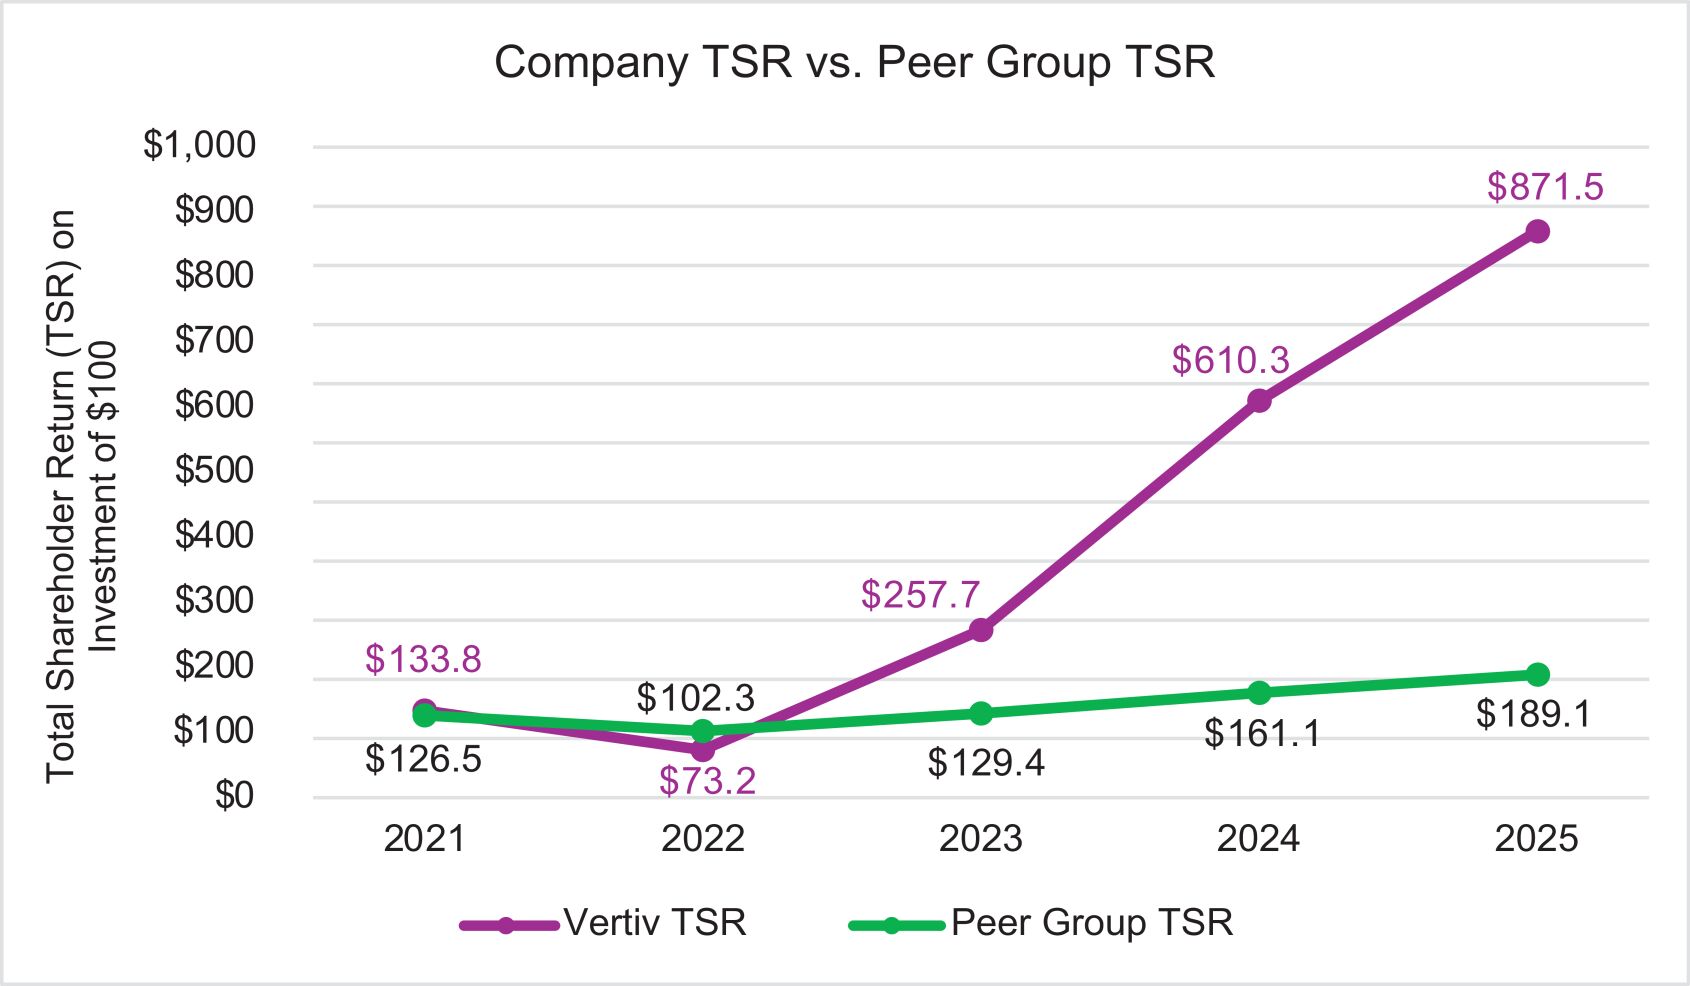
Total Shareholder Return($) (3) |
Peer Group Total Shareholder Return($) (3) |
|||||||||||||||||||||||||||||||
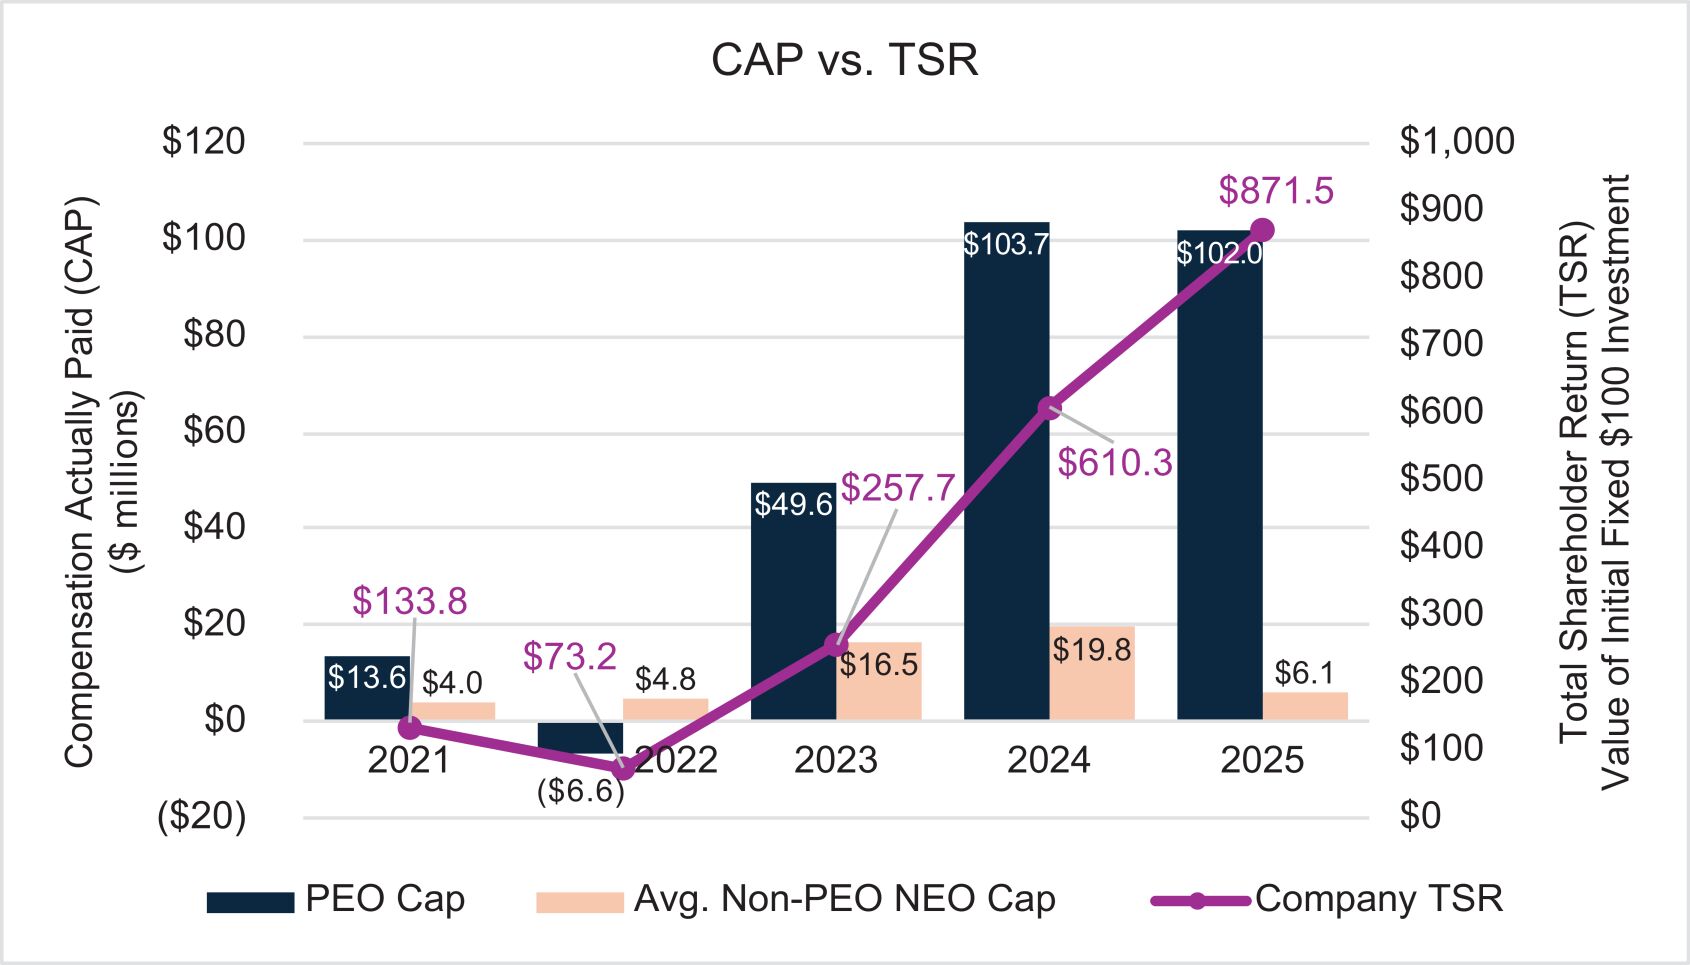
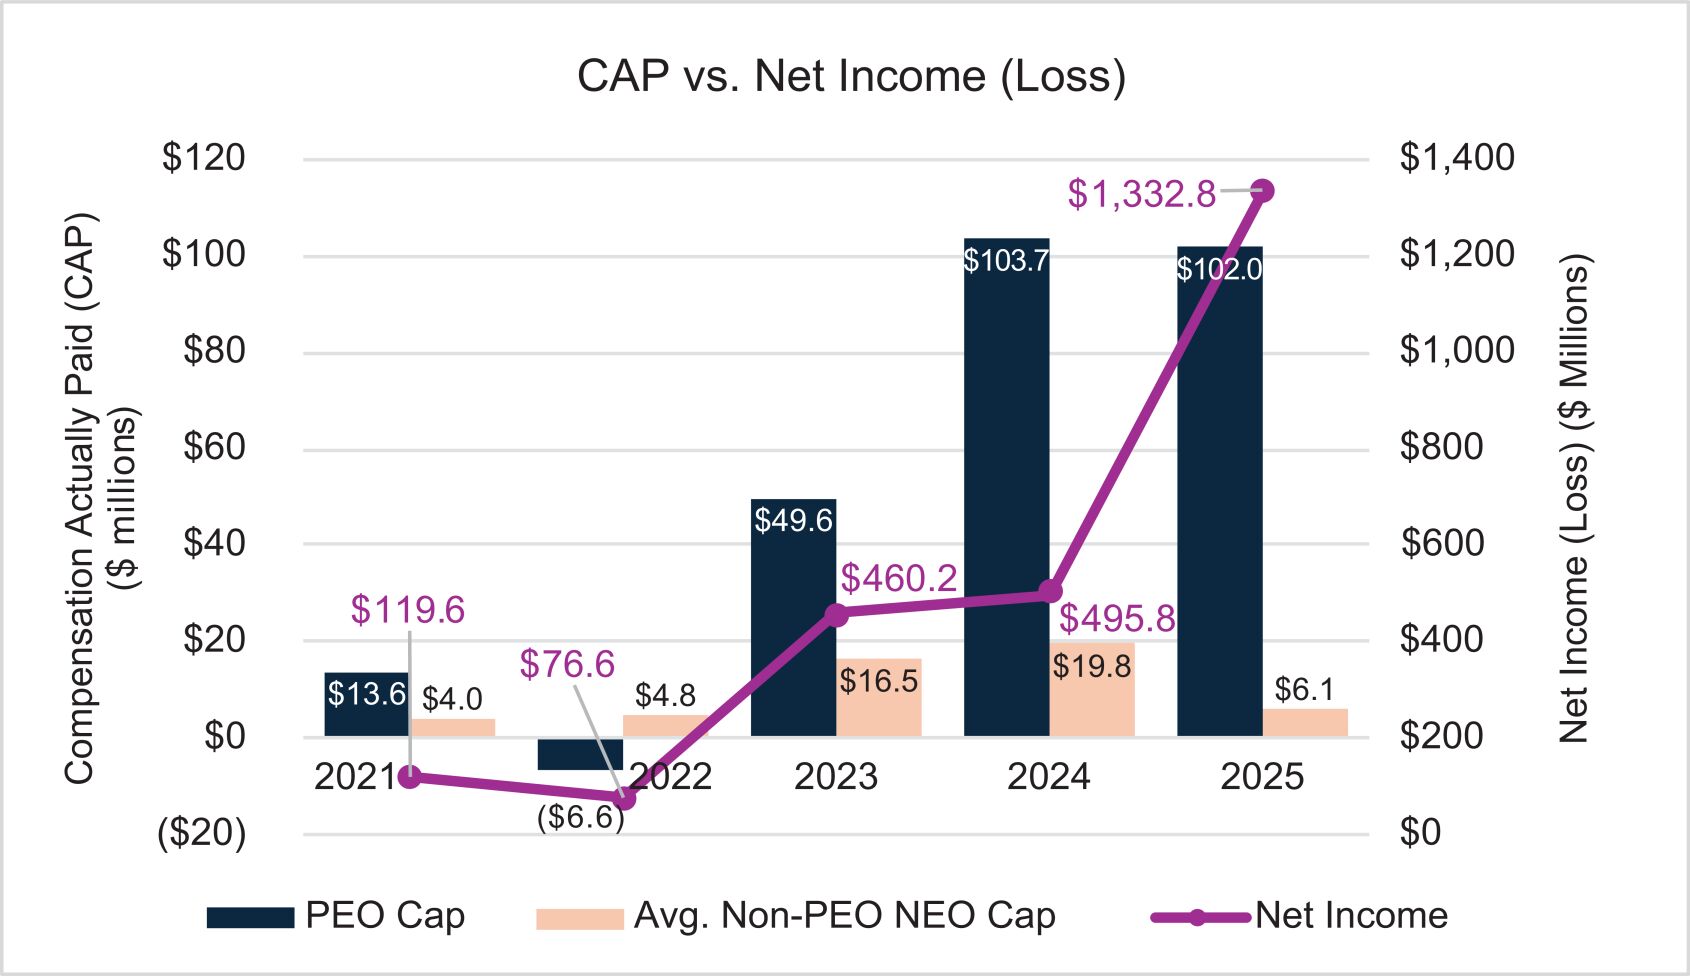
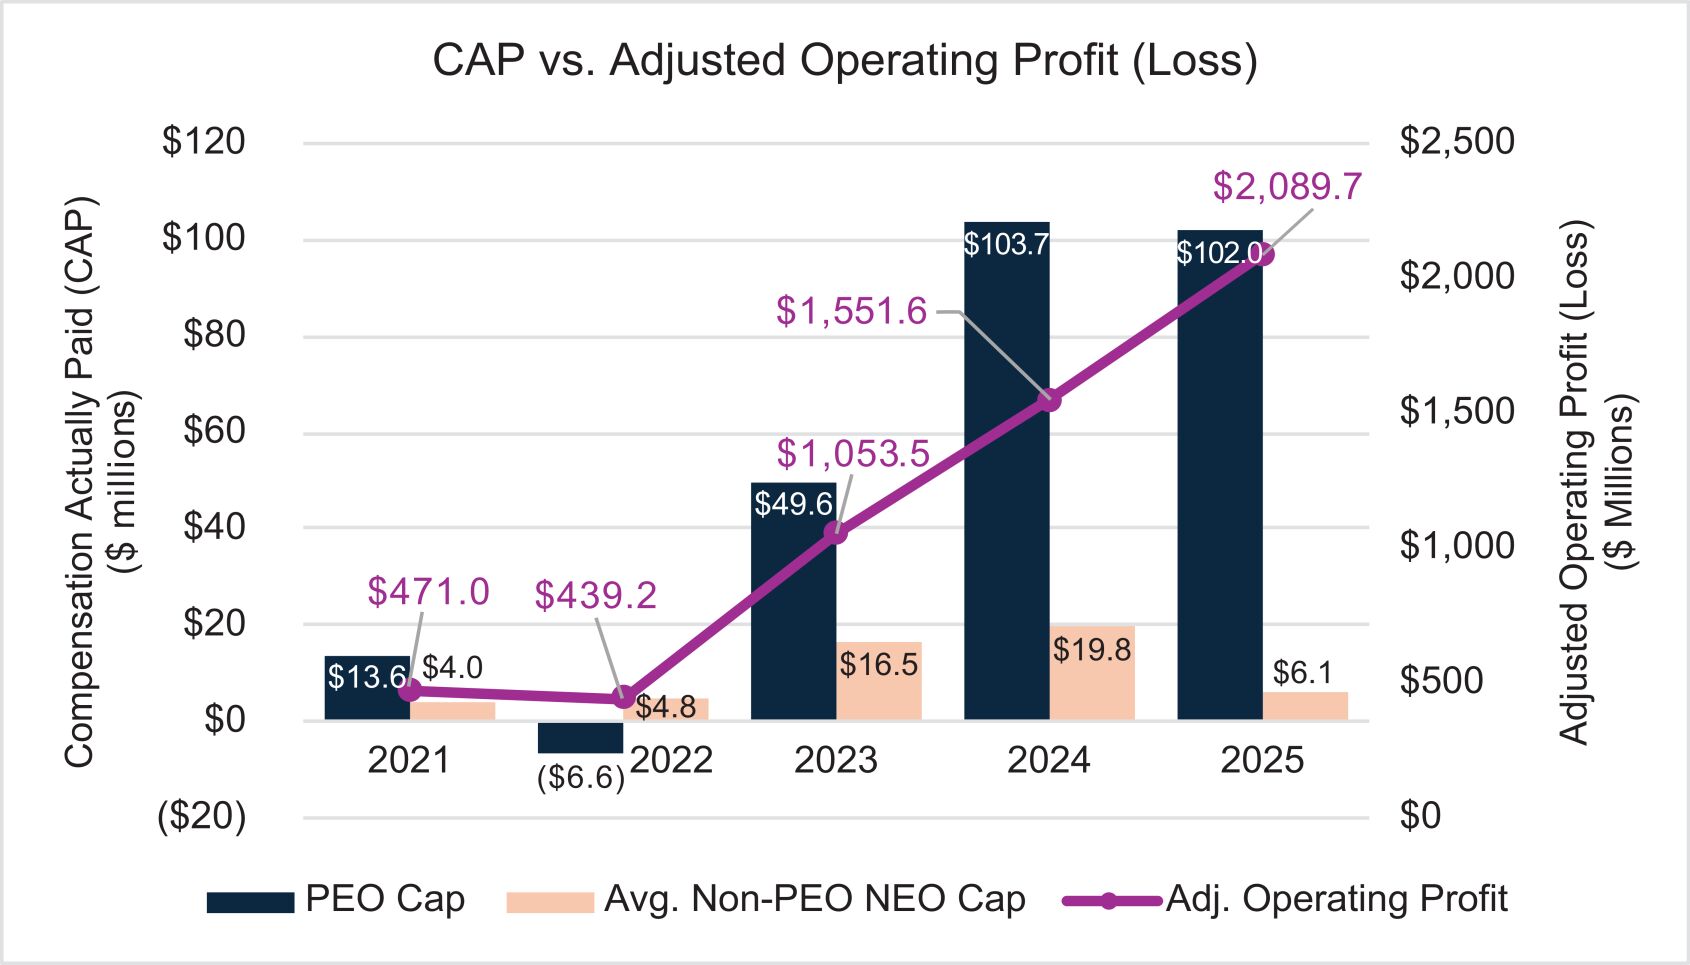
2025 |
18,311,719 | 102,015,794 | 2,462,002 | 6,115,522 | 871.48 | 189.10 | 1,332.8M | 2,089.7M | ||||||||||||||||||||||||
2024 |
12,276,743 | 103,652,963 | 2,244,615 | 19,771,553 | 610.28 | 161.12 | 495.8M | 1,551.6M | ||||||||||||||||||||||||
2023 |
6,183,174 | 49,586,394 | 2,973,889 | 16,527,970 | 257.70 | 129.40 | 460.2M | 1,053.5M | ||||||||||||||||||||||||
2022 |
8,033,521 | (6,564,566 | ) | 6,546,724 | 4,820,353 | 73.25 | 102.27 | 76.6M | 439.2M | |||||||||||||||||||||||
2021 |
5,180,837 | 13,610,394 | 1,798,692 | 4,039,817 | 133.80 | 126.45 | 119.6M | 471M | ||||||||||||||||||||||||
| (1) | The dollar amounts reported in these columns are, respectively, (x) the amounts of total compensation reported for our Principal Executive Officer (“ PEO non-PEO named executive officers (“Non-PEO NEOsthe Non-PEO NEOs are as follows: Giordano Albertazzi (2022), Craig Chamberlin (2025), Scott Armul (2025), David Fallon (2025, 2024, 2023, 2022, 2021), Stephen Liang (2023, 2022, 2021), Anand Sanghi (2025, 2024, 2023), Anders Karlborg (2024, 2023), Phil Doherty (2022), Stephanie Gill (2025, 2024, 2021), and Jason Forcier (2021). |
| (2) | The dollar amounts reported in these columns represent the amount of “compensation actually paid” in the applicable fiscal year, as computed in accordance with Item 402(v) of Regulation S-K. The dollar amounts do not reflect the actual amount of compensation earned by or paid during the applicable year. In accordance with the requirements of Item 402(v) of Regulation S-K, the adjustments set forth below were made to the total compensation for each year to determine the compensation actually paid. Adjusted fair values have been determined using, as applicable, updated stock price and assumptions (i.e., term, volatility, dividend yield, risk free rates) as of the measurement date. |
Fiscal Year 2025 |
PEO($) |
Non-PEO NEOs($) |
||||||
Total from Summary Compensation Table |
18,311,719 | 2,462,002 | ||||||
- Amount reported in the Summary Compensation Table for Stock Awards and Option Awards |
13,040,000 | 1,078,106 | ||||||
+ Fair Value at Fiscal Year-End of Outstanding and Unvested Option Awards and Stock Awards Granted in Fiscal Year (Including Dividend Equivalents) |
39,212,000 | 2,147,247 | ||||||
+ Change in Fair Value of Outstanding and Unvested Option Awards and Stock Awards Granted in Prior Fiscal Years (Including Modifications) |
29,538,445 | 2,057,507 | ||||||
- Fair Value at Prior Fiscal Year-End of Stock and Option Awards Forfeited during the Covered Year |
— | — | ||||||
+ Fair Value at Vesting Date of Option Awards and Stock Awards Grants and Vested During the Fiscal Year |
— | 280,500 | ||||||
+ Change in Fair Value as of Vesting Date of Option Awards and Stock Awards Granted in Prior Fiscal Years For Which Applicable Vesting Conditions Were Satisfied During Fiscal Year |
1,913,630 | (1,909,840 | ) | |||||
Compensation Actually Paid |
102,015,794 | 6,115,522 | ||||||
| (3) | Cumulative TSR is calculated by dividing the sum of the cumulative amount of dividends for the measurement period, assuming dividend reinvestment, and the difference between the Company’s share price at the end and the beginning of the measurement period by the Company’s share price at the beginning of the measurement period. Peer group TSR shown in the table was based on the index we use for purposes of Item 201(e)(1)(ii) of Regulation S-K. If we used the Compensation Peer Group (with the list of companies provided in the “Compensation Discussion and Analysis |
| (4) | Dollar amounts reported represent (i) the amount of net income reflected in the Company’s audited financial statements for the applicable year and (ii) the amount of adjusted operating profit ( “AOP a non-GAAP measure we used under the VIP for 2025. For an explanation and reconciliation of AOP, please see Annex A. |
S-K.
If we used the Compensation Peer Group (with the list of companies provided in the “Compensation Discussion and Analysis
| (2) | The dollar amounts reported in these columns represent the amount of “compensation actually paid” in the applicable fiscal year, as computed in accordance with Item 402(v) of Regulation S-K. The dollar amounts do not reflect the actual amount of compensation earned by or paid during the applicable year. In accordance with the requirements of Item 402(v) of Regulation S-K, the adjustments set forth below were made to the total compensation for each year to determine the compensation actually paid. Adjusted fair values have been determined using, as applicable, updated stock price and assumptions (i.e., term, volatility, dividend yield, risk free rates) as of the measurement date. |
Fiscal Year 2025 |
PEO($) |
Non-PEO NEOs($) |
||||||
Total from Summary Compensation Table |
18,311,719 | 2,462,002 | ||||||
- Amount reported in the Summary Compensation Table for Stock Awards and Option Awards |
13,040,000 | 1,078,106 | ||||||
+ Fair Value at Fiscal Year-End of Outstanding and Unvested Option Awards and Stock Awards Granted in Fiscal Year (Including Dividend Equivalents) |
39,212,000 | 2,147,247 | ||||||
+ Change in Fair Value of Outstanding and Unvested Option Awards and Stock Awards Granted in Prior Fiscal Years (Including Modifications) |
29,538,445 | 2,057,507 | ||||||
- Fair Value at Prior Fiscal Year-End of Stock and Option Awards Forfeited during the Covered Year |
— | — | ||||||
+ Fair Value at Vesting Date of Option Awards and Stock Awards Grants and Vested During the Fiscal Year |
— | 280,500 | ||||||
+ Change in Fair Value as of Vesting Date of Option Awards and Stock Awards Granted in Prior Fiscal Years For Which Applicable Vesting Conditions Were Satisfied During Fiscal Year |
1,913,630 | (1,909,840 | ) | |||||
Compensation Actually Paid |
102,015,794 | 6,115,522 | ||||||
Performance Measures.
and non-financial performance
measures which in our assessment represent the most important financial performance measures we use to link compensation actually paid to our named executive officers, for 2025, to Company performance. Measure |
How We Used the Measure | |
Adjusted Operating Profit (AOP) |
Metric in VIP and Strategic Performance Awards | |
Adjusted Free Cash Flow |
Metric in VIP | |
Stock Price |
Used to determine exercise price of stock options and ultimate realized value of all equity awards | |
“AOP
a non-GAAP measure
we used under the VIP for 2025. For an explanation and reconciliation of AOP, please see Annex A.