Pay vs Performance Disclosure
|
12 Months Ended |
|
Dec. 31, 2025
USD ($)
$ / shares
|
Dec. 31, 2024
USD ($)
$ / shares
|
Dec. 31, 2023
USD ($)
$ / shares
|
Dec. 31, 2022
USD ($)
$ / shares
|
Dec. 31, 2021
USD ($)
$ / shares
|
| Pay vs Performance Disclosure |
|
|
|
|
|
| Pay vs Performance Disclosure, Table |
| | | | | | | | | | | | | | | | | | | | | | | | | | | | | | | | Value of Initial Fixed $100 Investment Based on(5): | | | | Fiscal Year | Summary Compensation Table Total for CEO ($)(1) | Compensation Actually Paid to CEO ($)(2) | Average Summary Compensation Table Total for Non-CEO NEOs ($)(3) | Average Compensation Actually Paid to Non-CEO NEOs ($)(4) | Total Shareholder Return
($) | Peer Group Total Shareholder Return
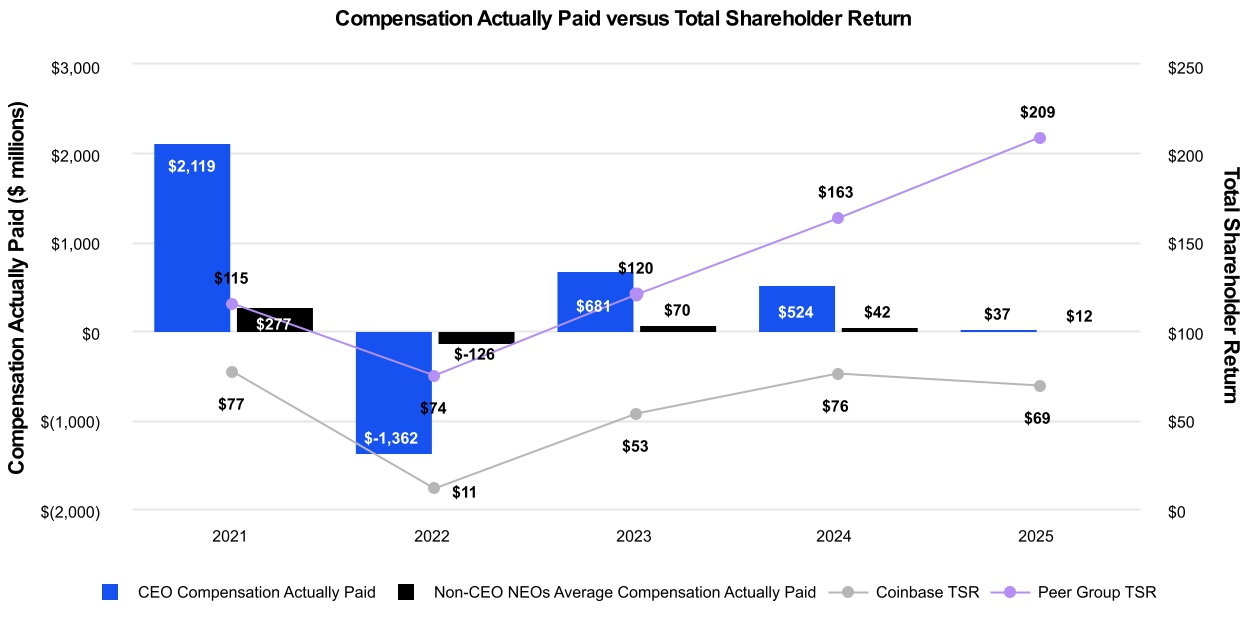
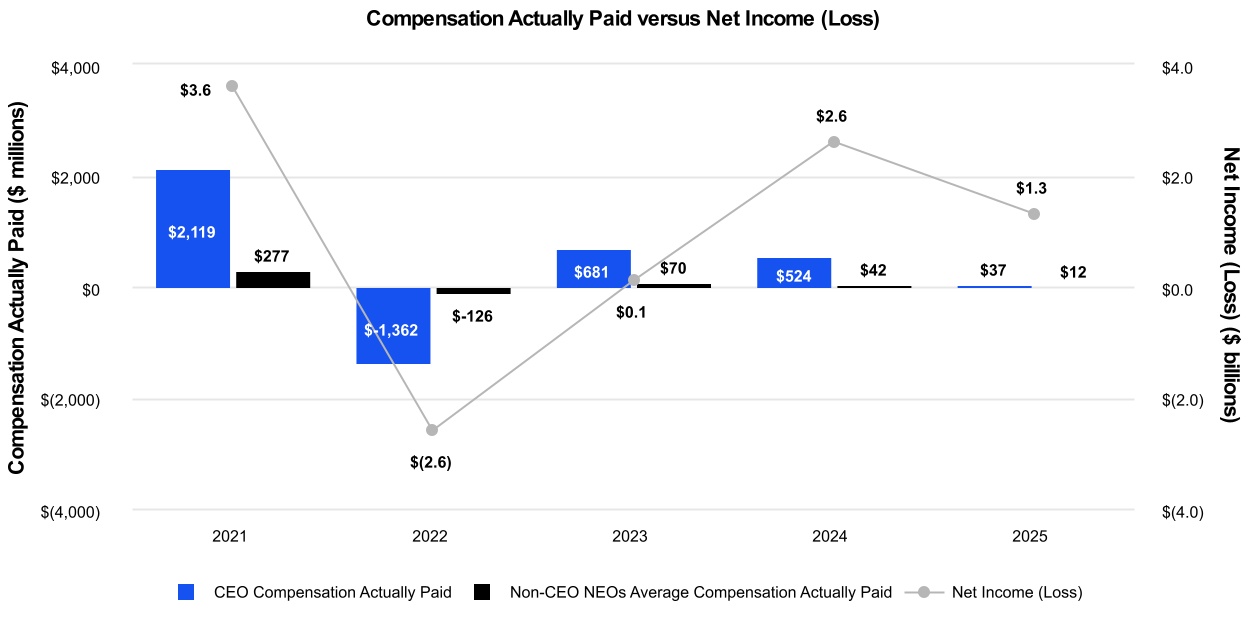
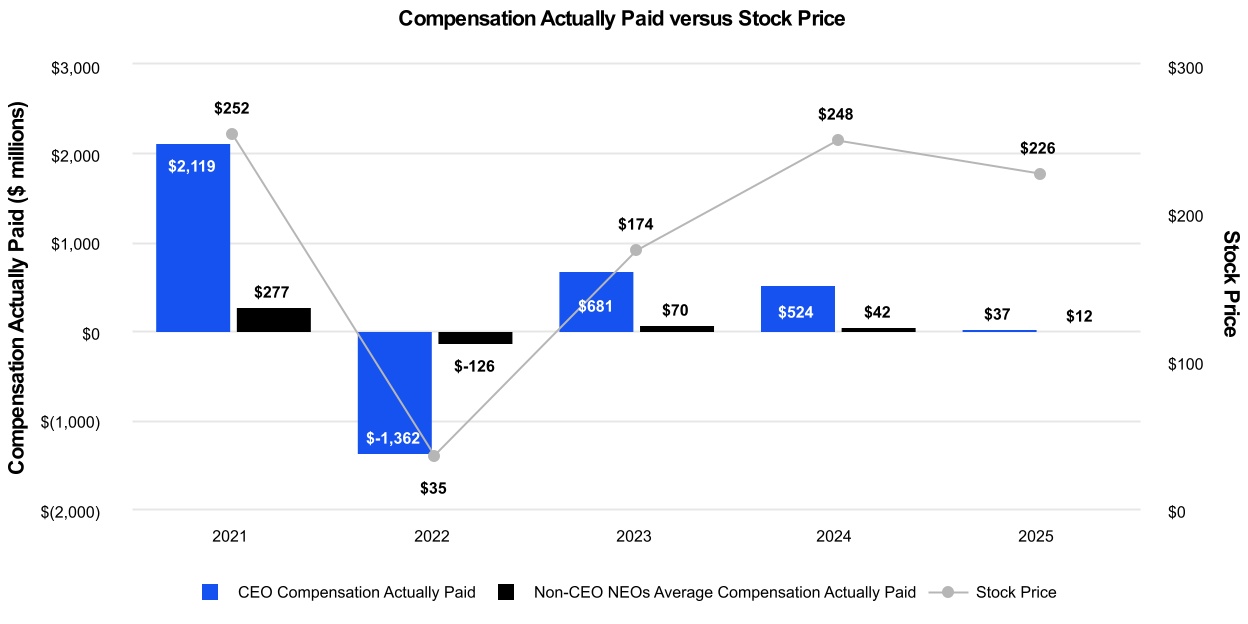
($) | Net Income (Loss) ($ in Billions)(6) | Stock Price ($)(7) | 2025 | 9,713,000 | 37,243,000 | 16,729,488 | 12,015,778 | 69 | 209 | 1.3 | 226.14 | 2024 | 7,235,090 | 523,635,090 | 12,039,123 | 42,082,320 | 76 | 163 | 2.6 | 248.30 | | 2023 | 4,704,800 | 680,876,182 | 12,361,785 | 69,907,750 | 53 | 120 | 0.1 | 173.92 | | 2022 | 7,465,350 | (1,362,073,553) | 15,916,740 | (125,780,983) | 11 | 74 | (2.6) | 35.39 | 2021 | 3,267,027 | 2,118,756,064 | 4,768,927 | 277,238,370 | 77 | 115 | 3.6 | 252.37 |
|
|
|
|
|
| Company Selected Measure Name |
stock price
|
|
|
|
|
| Named Executive Officers, Footnote |
Mr. Armstrong has been our CEO since May 2012.The individuals comprising our Non-CEO NEOs for each of fiscal years 2022 and 2021 consist of Emilie Choi, Alesia Haas, Surojit Chatterjee and Paul Grewal. The individuals comprising our Non-CEO NEOs for each of fiscal years 2025, 2024 and 2023 consist of Emilie Choi, Alesia Haas, Paul Grewal and Lawrence Brock.
|
|
|
|
|
| Peer Group Issuers, Footnote |
The Peer Group Total Shareholder Return (“TSR”) set forth in this table utilizes the S&P North American Technology Index, which we also utilize in the stock performance graph required by Item 201(e) of Regulation S-K included in the Annual Report. The comparison assumes $100 was invested for the period starting April 14, 2021, the first day the Company’s Class A common stock began trading on the Nasdaq Global Select Market through the end of the listed year in the Company and in the S&P North American Technology Index, respectively. Historical stock performance is not necessarily indicative of future stock performance.
|
|
|
|
|
| PEO Total Compensation Amount |
$ 9,713,000
|
$ 7,235,090
|
$ 4,704,800
|
$ 7,465,350
|
$ 3,267,027
|
| PEO Actually Paid Compensation Amount |
$ 37,243,000
|
523,635,090
|
680,876,182
|
(1,362,073,553)
|
2,118,756,064
|
| Adjustment To PEO Compensation, Footnote |
Compensation Actually Paid to our CEO in the table above reflects the following adjustments from the Summary Compensation Table (“SCT”) for the years set forth in the table below. The amounts shown for Compensation Actually Paid to our CEO have been calculated in accordance with Item 402(v) of Regulation S-K and do not reflect compensation actually earned, realized or received by our CEO during the applicable year. | | | | | | | | | | | | | | | | | | | CEO | | Fiscal Year | 2025 | 2024 | 2023 | 2022 | 2021 | | SCT Total | $ | 9,713,000 | | $ | 7,235,090 | | $ | 4,704,800 | | $ | 7,465,350 | | $ | 3,267,027 | | | Plus: Change in Fair Value of Outstanding and Unvested Option Awards and Stock Awards Granted in Prior Fiscal Years | $ | (113,260,000) | | $ | 516,400,000 | | $ | 670,110,000 | | $ | (1,273,645,578) | | $ | 1,386,999,851 | | | Plus: Change in Fair Value as of Vesting Date of Option Awards and Stock Awards Granted in Prior Fiscal Years For Which Applicable Vesting Conditions Were Satisfied During Fiscal Year | $ | 140,790,000 | | $ | — | | $ | 6,061,382 | | $ | (95,893,325) | | $ | 728,489,186 | | | Compensation Actually Paid | $ | 37,243,000 | | $ | 523,635,090 | | $ | 680,876,182 | | $ | (1,362,073,553) | | $ | 2,118,756,064 | |
|
|
|
|
|
| Non-PEO NEO Average Total Compensation Amount |
$ 16,729,488
|
12,039,123
|
12,361,785
|
15,916,740
|
4,768,927
|
| Non-PEO NEO Average Compensation Actually Paid Amount |
$ 12,015,778
|
42,082,320
|
69,907,750
|
(125,780,983)
|
277,238,370
|
| Adjustment to Non-PEO NEO Compensation Footnote |
Average Compensation Actually Paid to our Non-CEO NEOs in the table above reflects the following adjustments from the SCT for the years set forth in the table below. The amounts shown for average Compensation Actually Paid to our Non-CEO NEOs have been calculated in accordance with Item 402(v) of Regulation S-K and do not reflect compensation actually earned, realized or received by our Non-CEO NEOs during the applicable year. The amounts reported for Average Compensation Actually Paid to our Non-CEO NEOs for fiscal years 2024 and 2023 have been updated from the previously disclosed amounts of $38,535,438 for 2024 and $53,452,196 for 2023 to correct an error in the calculation of the fair value of the 2023 COO Performance Award. | | | | | | | | | | | | | | | | | | | | | | | | | | | | | | | | | | | Non-CEO NEOs | | Fiscal Year | | 2025 | | 2024 | | 2023 | | 2022 | | 2021 | | Average SCT Total | | $ | 16,729,488 | | | $ | 12,039,123 | | | $ | 12,361,785 | | | $ | 15,916,740 | | | $ | 4,768,927 | | | Less: Grant Date Fair Value of Option Awards and Stock Awards Granted in Fiscal Year | | $ | (15,624,903) | | | $ | (11,249,903) | | | $ | (11,584,300) | | | $ | (15,068,622) | | | $ | (3,876,486) | | | Plus: Fair Value at Fiscal Year-End of Outstanding and Unvested Option Awards and Stock Awards Granted During Fiscal Year | | $ | 10,176,017 | | | $ | 13,115,206 | | | $ | 46,994,844 | | | $ | 2,509,293 | | | $ | 20,919,202 | | | Plus: Change in Fair Value of Outstanding and Unvested Option Awards and Stock Awards Granted in Prior Fiscal Year | | $ | (3,965,938) | | | $ | 16,189,784 | | | $ | 12,799,811 | | | $ | (80,270,713) | | | $ | 144,726,114 | | | Plus: Fair Value at Vesting of Option Awards and Stock Awards Granted in Fiscal Year That Vested During Fiscal Year | | $ | 3,205,529 | | | $ | 6,046,276 | | | $ | 2,471,750 | | | $ | 3,151,760 | | | $ | 10,948,391 | | | Plus: Change in Fair Value as of Vesting Date of Option Awards and Stock Awards Granted in Prior Fiscal Years For Which Applicable Vesting Conditions Were Satisfied During Fiscal Year | | $ | 1,495,584 | | | $ | 5,941,835 | | | $ | 6,863,860 | | | $ | (52,019,441) | | | $ | 99,752,222 | | | Average Compensation Actually Paid | | $ | 12,015,778 | | | $ | 42,082,320 | | | $ | 69,907,750 | | | $ | (125,780,983) | | | $ | 277,238,370 | |
|
|
|
|
|
| Compensation Actually Paid vs. Total Shareholder Return |
Chart Showing Graphical Relationship Between CEO and Non-CEO NEOs Compensation Actually Paid and TSR
|
|
|
|
|
| Compensation Actually Paid vs. Net Income |
Chart Showing Graphical Relationship Between CEO and Non-CEO NEOs Compensation Actually Paid and Net Income (Loss)
|
|
|
|
|
| Compensation Actually Paid vs. Company Selected Measure |
Chart Showing Graphical Relationship Between CEO and Non-CEO NEOs Compensation Actually Paid and Stock Price
|
|
|
|
|
| Total Shareholder Return Vs Peer Group |
Chart Showing Graphical Relationship Between CEO and Non-CEO NEOs Compensation Actually Paid and TSR
|
|
|
|
|
| Tabular List, Table |
| | | | Total Shareholder Return | | Net Income (Loss) | | Stock Price | | Revenue | | Adjusted EBITDA |
|
|
|
|
|
| Total Shareholder Return Amount |
$ 69
|
76
|
53
|
11
|
77
|
| Peer Group Total Shareholder Return Amount |
209
|
163
|
120
|
74
|
115
|
| Net Income (Loss) |
$ 1,300,000,000
|
$ 2,600,000,000
|
$ 100,000,000
|
$ (2,600,000,000)
|
$ 3,600,000,000
|
| Company Selected Measure Amount | $ / shares |
226.14
|
248.30
|
173.92
|
35.39
|
252.37
|
| PEO Name |
Mr. Armstrong
|
|
|
|
|
| Additional 402(v) Disclosure |
The dollar amounts reported represent the amount of net income (loss) reflected in our audited financial statements for the applicable fiscal year.
|
|
|
|
|
| Measure:: 1 |
|
|
|
|
|
| Pay vs Performance Disclosure |
|
|
|
|
|
| Name |
Total Shareholder Return
|
|
|
|
|
| Measure:: 2 |
|
|
|
|
|
| Pay vs Performance Disclosure |
|
|
|
|
|
| Name |
Net Income (Loss)
|
|
|
|
|
| Measure:: 3 |
|
|
|
|
|
| Pay vs Performance Disclosure |
|
|
|
|
|
| Name |
Stock Price
|
|
|
|
|
| Non-GAAP Measure Description |
The stock price reported represents the closing price of the Company’s Class A common stock as reported on the Nasdaq Global Select Market on the last trading day of the applicable fiscal year. We selected stock price as our company-selected measure because Mr. Armstrong’s 2020 CEO Performance Award, a stock option which is earned upon the achievement of performance conditions based on Class A common stock price targets as more fully described under “Executive Compensation—Compensation Discussion and Analysis—Equity Compensation: 2020 CEO Performance Award,” is a significant driver of Mr. Armstrong’s compensation actually paid and is the most significant element of his individual and our overall compensation program due to the significant size of the award. While, aside from the 2020 CEO Performance Award, we do not otherwise use stock price to link compensation actually paid to our Non-CEO NEOs’ performance in making executive compensation decisions, we believe our executives’ incentives are closely aligned with those of our shareholders and the overall performance of the Company by means of the grant of time-based stock options and RSUs, and in the case of Ms. Choi, the 2023 COO Performance Award the values of which are tied to the Company’s stock performance over time. For more information, see the section titled “Executive Compensation—Compensation Discussion and Analysis.”
|
|
|
|
|
| Measure:: 4 |
|
|
|
|
|
| Pay vs Performance Disclosure |
|
|
|
|
|
| Name |
Revenue
|
|
|
|
|
| Measure:: 5 |
|
|
|
|
|
| Pay vs Performance Disclosure |
|
|
|
|
|
| Name |
Adjusted EBITDA
|
|
|
|
|
| PEO | Year-over-Year Change in Fair Value of Equity Awards Granted in Prior Years That are Outstanding and Unvested |
|
|
|
|
|
| Pay vs Performance Disclosure |
|
|
|
|
|
| Adjustment to Compensation, Amount |
$ (113,260,000)
|
$ 516,400,000
|
$ 670,110,000
|
$ (1,273,645,578)
|
$ 1,386,999,851
|
| PEO | Change in Fair Value as of Vesting Date of Prior Year Equity Awards Vested in Covered Year |
|
|
|
|
|
| Pay vs Performance Disclosure |
|
|
|
|
|
| Adjustment to Compensation, Amount |
140,790,000
|
0
|
6,061,382
|
(95,893,325)
|
728,489,186
|
| Non-PEO NEO | Aggregate Grant Date Fair Value of Equity Award Amounts Reported in Summary Compensation Table |
|
|
|
|
|
| Pay vs Performance Disclosure |
|
|
|
|
|
| Adjustment to Compensation, Amount |
(15,624,903)
|
(11,249,903)
|
(11,584,300)
|
(15,068,622)
|
(3,876,486)
|
| Non-PEO NEO | Year-end Fair Value of Equity Awards Granted in Covered Year that are Outstanding and Unvested |
|
|
|
|
|
| Pay vs Performance Disclosure |
|
|
|
|
|
| Adjustment to Compensation, Amount |
10,176,017
|
13,115,206
|
46,994,844
|
2,509,293
|
20,919,202
|
| Non-PEO NEO | Year-over-Year Change in Fair Value of Equity Awards Granted in Prior Years That are Outstanding and Unvested |
|
|
|
|
|
| Pay vs Performance Disclosure |
|
|
|
|
|
| Adjustment to Compensation, Amount |
(3,965,938)
|
16,189,784
|
12,799,811
|
(80,270,713)
|
144,726,114
|
| Non-PEO NEO | Vesting Date Fair Value of Equity Awards Granted and Vested in Covered Year |
|
|
|
|
|
| Pay vs Performance Disclosure |
|
|
|
|
|
| Adjustment to Compensation, Amount |
3,205,529
|
6,046,276
|
2,471,750
|
3,151,760
|
10,948,391
|
| Non-PEO NEO | Change in Fair Value as of Vesting Date of Prior Year Equity Awards Vested in Covered Year |
|
|
|
|
|
| Pay vs Performance Disclosure |
|
|
|
|
|
| Adjustment to Compensation, Amount |
$ 1,495,584
|
$ 5,941,835
|
$ 6,863,860
|
$ (52,019,441)
|
$ 99,752,222
|