Pay vs Performance Disclosure - USD ($)
Dec. 31, 2023
Aug. 31, 2023
Dec. 31, 2025
Dec. 31, 2024
Dec. 31, 2023
Pay Versus Performance
As required by Item 402(v) of Regulation
S-K,
we are providing the following information about the relationship between “compensation actually paid” to our principal executive officers (“PEOs”) and the average of our other named executive officers (“NEOs”) and certain financial metrics of our Company. The following table also provides information regarding company performance over the same periods, as well as the relationship of “compensation actually paid” to our PEOs and NEOs to company performance. Value of Initial Fixed $100 Investment Based On: |
||||||||||||||||||||||||||||||||||||||||
Year |
Summary Compensation Table Total for Esther Rajavelu ($)(1) |
Summary Compensation Table Total for Satyavrat Shukla ($)(2) |
Summary Compensation Table Total for Ankit Mahadevia ($)(3) |
Compensation Actually Paid to Esther Rajavelu ($)(4)(5) |
Compensation Actually Paid to Satyavrat Shukla ($)(3)(5) |
Compensation Actually Paid to Ankit Mahadevia ($)(4)(5) |
Average Summary Compensation Table Total Compensation for Other NEOs ($)(6) |
Average Compensation Actually Paid to Other NEOs ($)(6)(7) |
Company TSR ($)(8) |
Net Income (loss) ($ in thousands) (9) |
||||||||||||||||||||||||||||||
| 2025 | 2,061,496 | 2,025,178 | — | 3,344,368 | 982,033 | — | 1,440,820 | 2,268,982 | 12 | 8,572 | ||||||||||||||||||||||||||||||
| 2024 | — | 1,953,238 | — | 2,245,682 | — | 944,965 | 1,721,025 | 5 | (68,566 | ) | ||||||||||||||||||||||||||||||
| 2023 | — | 2,024,647 | 2,385,905 | 2,020,658 | 2,622,030 | 1,446,848 | 1,487,365 | 8 | 22,806 | |||||||||||||||||||||||||||||||
| (1) | Ms. Rajavelu was one of our PEOs during 2025. |
| (2) | Calculated in accordance with Item 402(v)(2) of Regulation S-K. The following adjustments were made to Mr. Shukla’s total compensation as reported in the Summary Compensation Table to determine “compensation actually paid.” |
Year |
Summary Compensation Table Total ($) |
Deductions for Reported Grant Date Fair Value of Stock Awards ($)(a) |
Deductions for Reported Grant Date Fair Value of Option Awards ($)(a) |
Additions for Pay Versus Performance Equity Adjustments ($)(b) |
Compensation Actually Paid ($) |
|||||||||||||||||
| 2025 | 2,025,178 | (603,380 | ) | — | (439,765 | ) | 982,033 | |||||||||||||||
| 2024 | 1,953,238 | (1,066,817 | ) | — | 1,359,261 | 2,245,682 | ||||||||||||||||
| (a) | Reflects the amounts reported in the Stock Awards column of the Summary Compensation Table in the relevant years. |
| (b) | The pay versus performance equity adjustments reflect the aggregated sum of the following values for the respective years. |
Year |
Year-End FairValue of Outstanding and Unvested Equity Awards Granted in the Covered Year ($) |
Year Over Year Change in Fair Value of Outstanding and Unvested Equity Awards Granted in Prior Years ($) |
Year Over Year Change in Fair Value of Equity Awards Granted in Prior Years That Vested in the Covered Year ($) |
Total Pay Versus Performance Equity Adjustments ($) |
||||||||||||||
| 2025 | — | (404,790 | ) | (34,975 | ) | (439,765 | ) | |||||||||||
| 2024 | 858,445 | 494,488 | 6,328 | 1,359,261 | ||||||||||||||
| (3) | Dr. Mahadevia was one of our PEOs during 2023. Calculated in accordance with Item 402(v)(2) of Regulation S-K. The following adjustments were made to Dr. Mahadevia’s total compensation as reported in the Summary Compensation Table to determine “compensation actually paid.” |
Year |
Summary Compensation Table Total ($) |
Deductions for Reported Grant Date Fair Value of Stock Awards ($)(a) |
Deductions for Reported Grant Date Fair Value of Option Awards ($)(a) |
Additions for Pay Versus Performance Equity Adjustments ($)(b) |
Compensation Actually Paid ($) |
|||||||||||||||||
| 2023 | 2,385,905 | (999,998 | ) | — | 1,236,123 | 2,622,030 | ||||||||||||||||
| (a) | Reflects the amounts reported in the Stock Awards columns of the Summary Compensation Table in the relevant year. |
| (b) | The pay versus performance equity adjustments reflect the aggregated sum of the following values for the respective years. |
| (4) | Calculated in accordance with Item 402(v)(2) of Regulation S-K. The following adjustments were made to Ms. Rajavelu’s total compensation as reported in the Summary Compensation Table to determine “compensation actually paid.” |
Year |
Summary Compensation Table Total ($) |
Deductions for Reported Grant Date Fair Value of Stock Awards ($)(a) |
Deductions for Reported Grant Date Fair Value of Option Awards ($) |
Additions for Pay Versus Performance Equity Adjustments ($)(b) |
Compensation Actually Paid ($) | |||||||
| 2025 | 2,061,496 | (413,705) | — | 1,696,577 | 3,344,368 | |||||||
| (a) | Reflects the amounts reported in the Stock Awards column of the Summary Compensation Table in the relevant years. |
| (b) | The pay versus performance equity adjustments reflect the aggregated sum of the following values in the relevant year. |
Year |
Year-End Fair Value of Outstanding and Unvested Equity Awards Granted in the Covered Year ($) |
Year Over Year Change in Fair Value of Outstanding and Unvested Equity Awards Granted in Prior Years ($) |
Year Over Year Change in Fair Value of Equity Awards Granted in Prior Years That Vested in the Covered Year ($) |
Total Pay Versus Performance Equity Adjustments ($) |
||||||||||||
| 2025 | 1,284,154 | 311,869 | 100,554 | 1,696,577 | ||||||||||||
| (5) | Measurement date equity fair values are calculated with assumptions derived on a basis consistent with those used for grant date fair value purposes. RSUs are valued based on the closing stock price on the relevant measurement date. Stock options are valued using a Black-Scholes model as at the relevant measurement dates. |
| (6) | Reflects compensation for the following non-PEO NEOs: |
2025: Mr. Keutzer
2024: Ms. Rajavelu and Mr. Keutzer
2023: Ms. Tamara Joseph, our former Chief Legal Officer and Corporate Secretary and Mr. Keutzer
| (7) | Average “compensation actually paid” for the non-PEO NEOs has been calculated in accordance with Item 402(v)(2) of Regulation S-K. The following adjustments were made to average Summary Compensation Table total compensation for each year to determine average “compensation actually paid.” |
Year |
Summary Compensation Table Total |
Deductions for Reported Grant Date Fair Value of Stock Awards(a) |
Deductions for Reported Grant Date Fair Value of Option Awards(a) |
Additions for Pay Versus Performance Equity Adjustments(b) |
Compensation Actually Paid |
|||||||||||||||||
| 2025 | 1,440,820 | (213,710 | ) | — | 1,041,872 | 2,268,982 | ||||||||||||||||
| 2024 | 944,965 | (282,284 | ) | — | 1,058,344 | 1,721,025 | ||||||||||||||||
| 2023 | 1,446,848 | (499,999 | ) | — | 540,516 | 1,487,365 | ||||||||||||||||
| (a) | Reflects the average amounts reported in the Stock Awards and Option Awards columns of the Summary Compensation Table in the relevant years. |
| (b) | The pay versus performance equity adjustments reflect the aggregated sum of the following values for the respective years. |
Year |
Average Year-End Fair Value of Outstanding and Unvested Equity Awards Granted in the Covered Year ($) |
Average Year Over Year Change in Fair Value of Outstanding and Unvested Equity Awards Granted in Prior Years ($) |
Average Year Over Year Change in Fair Value of Equity Awards Granted in Prior Years That Vested in the Covered Year ($) |
Total Pay Versus Performance Equity Adjustments ($) |
||||||||||||||
| 2025 | 620,104 | 427,938 | (6,170 | ) | 1,041,872 | |||||||||||||
| 2024 | 908,191 | 153,664 | (3,511 | ) | 1,058,344 | |||||||||||||
| 2023 | 147,945 | 371,929 | 20,642 | 540,516 | ||||||||||||||
| (8) | As required under Item 201(e) of Regulation S-K, total shareholder return (“TSR”) measures the cumulative value of $100 invested on the last trading day before the earliest fiscal year in the table, or December 31, 2022, through and including the end of the applicable fiscal year for which total shareholder return is calculated, or December 31, 2023, December 31, 2024, and December 31, 2025, respectively. |
| (9) | The dollar amounts are our net income (loss) amounts reflected in our audited financial statements for the applicable year. |
| (6) | Reflects compensation for the following non-PEO NEOs: |
2025: Mr. Keutzer
2024: Ms. Rajavelu and Mr. Keutzer
2023: Ms. Tamara Joseph, our former Chief Legal Officer and Corporate Secretary and Mr. Keutzer
| (2) | Calculated in accordance with Item 402(v)(2) of Regulation S-K. The following adjustments were made to Mr. Shukla’s total compensation as reported in the Summary Compensation Table to determine “compensation actually paid.” |
Year |
Summary Compensation Table Total ($) |
Deductions for Reported Grant Date Fair Value of Stock Awards ($)(a) |
Deductions for Reported Grant Date Fair Value of Option Awards ($)(a) |
Additions for Pay Versus Performance Equity Adjustments ($)(b) |
Compensation Actually Paid ($) |
|||||||||||||||||
| 2025 | 2,025,178 | (603,380 | ) | — | (439,765 | ) | 982,033 | |||||||||||||||
| 2024 | 1,953,238 | (1,066,817 | ) | — | 1,359,261 | 2,245,682 | ||||||||||||||||
| (a) | Reflects the amounts reported in the Stock Awards column of the Summary Compensation Table in the relevant years. |
| (b) | The pay versus performance equity adjustments reflect the aggregated sum of the following values for the respective years. |
Year |
Year-End FairValue of Outstanding and Unvested Equity Awards Granted in the Covered Year ($) |
Year Over Year Change in Fair Value of Outstanding and Unvested Equity Awards Granted in Prior Years ($) |
Year Over Year Change in Fair Value of Equity Awards Granted in Prior Years That Vested in the Covered Year ($) |
Total Pay Versus Performance Equity Adjustments ($) |
||||||||||||||
| 2025 | — | (404,790 | ) | (34,975 | ) | (439,765 | ) | |||||||||||
| 2024 | 858,445 | 494,488 | 6,328 | 1,359,261 | ||||||||||||||
| (3) | Dr. Mahadevia was one of our PEOs during 2023. Calculated in accordance with Item 402(v)(2) of Regulation S-K. The following adjustments were made to Dr. Mahadevia’s total compensation as reported in the Summary Compensation Table to determine “compensation actually paid.” |
Year |
Summary Compensation Table Total ($) |
Deductions for Reported Grant Date Fair Value of Stock Awards ($)(a) |
Deductions for Reported Grant Date Fair Value of Option Awards ($)(a) |
Additions for Pay Versus Performance Equity Adjustments ($)(b) |
Compensation Actually Paid ($) |
|||||||||||||||||
| 2023 | 2,385,905 | (999,998 | ) | — | 1,236,123 | 2,622,030 | ||||||||||||||||
| (a) | Reflects the amounts reported in the Stock Awards columns of the Summary Compensation Table in the relevant year. |
| (b) | The pay versus performance equity adjustments reflect the aggregated sum of the following values for the respective years. |
| (4) | Calculated in accordance with Item 402(v)(2) of Regulation S-K. The following adjustments were made to Ms. Rajavelu’s total compensation as reported in the Summary Compensation Table to determine “compensation actually paid.” |
Year |
Summary Compensation Table Total ($) |
Deductions for Reported Grant Date Fair Value of Stock Awards ($)(a) |
Deductions for Reported Grant Date Fair Value of Option Awards ($) |
Additions for Pay Versus Performance Equity Adjustments ($)(b) |
Compensation Actually Paid ($) | |||||||
| 2025 | 2,061,496 | (413,705) | — | 1,696,577 | 3,344,368 | |||||||
| (a) | Reflects the amounts reported in the Stock Awards column of the Summary Compensation Table in the relevant years. |
| (b) | The pay versus performance equity adjustments reflect the aggregated sum of the following values in the relevant year. |
Year |
Year-End Fair Value of Outstanding and Unvested Equity Awards Granted in the Covered Year ($) |
Year Over Year Change in Fair Value of Outstanding and Unvested Equity Awards Granted in Prior Years ($) |
Year Over Year Change in Fair Value of Equity Awards Granted in Prior Years That Vested in the Covered Year ($) |
Total Pay Versus Performance Equity Adjustments ($) |
||||||||||||
| 2025 | 1,284,154 | 311,869 | 100,554 | 1,696,577 | ||||||||||||
| (7) | Average “compensation actually paid” for the non-PEO NEOs has been calculated in accordance with Item 402(v)(2) of Regulation S-K. The following adjustments were made to average Summary Compensation Table total compensation for each year to determine average “compensation actually paid.” |
Year |
Summary Compensation Table Total |
Deductions for Reported Grant Date Fair Value of Stock Awards(a) |
Deductions for Reported Grant Date Fair Value of Option Awards(a) |
Additions for Pay Versus Performance Equity Adjustments(b) |
Compensation Actually Paid |
|||||||||||||||||
| 2025 | 1,440,820 | (213,710 | ) | — | 1,041,872 | 2,268,982 | ||||||||||||||||
| 2024 | 944,965 | (282,284 | ) | — | 1,058,344 | 1,721,025 | ||||||||||||||||
| 2023 | 1,446,848 | (499,999 | ) | — | 540,516 | 1,487,365 | ||||||||||||||||
| (a) | Reflects the average amounts reported in the Stock Awards and Option Awards columns of the Summary Compensation Table in the relevant years. |
| (b) | The pay versus performance equity adjustments reflect the aggregated sum of the following values for the respective years. |
Year |
Average Year-End Fair Value of Outstanding and Unvested Equity Awards Granted in the Covered Year ($) |
Average Year Over Year Change in Fair Value of Outstanding and Unvested Equity Awards Granted in Prior Years ($) |
Average Year Over Year Change in Fair Value of Equity Awards Granted in Prior Years That Vested in the Covered Year ($) |
Total Pay Versus Performance Equity Adjustments ($) |
||||||||||||||
| 2025 | 620,104 | 427,938 | (6,170 | ) | 1,041,872 | |||||||||||||
| 2024 | 908,191 | 153,664 | (3,511 | ) | 1,058,344 | |||||||||||||
| 2023 | 147,945 | 371,929 | 20,642 | 540,516 | ||||||||||||||
The following graph visually describes the relationship between “compensation actually paid” to PEOs for each applicable year and the average “compensation actually paid” to our other
Non-PEO
NEOs, to the cumulative total stockholder return of our company. 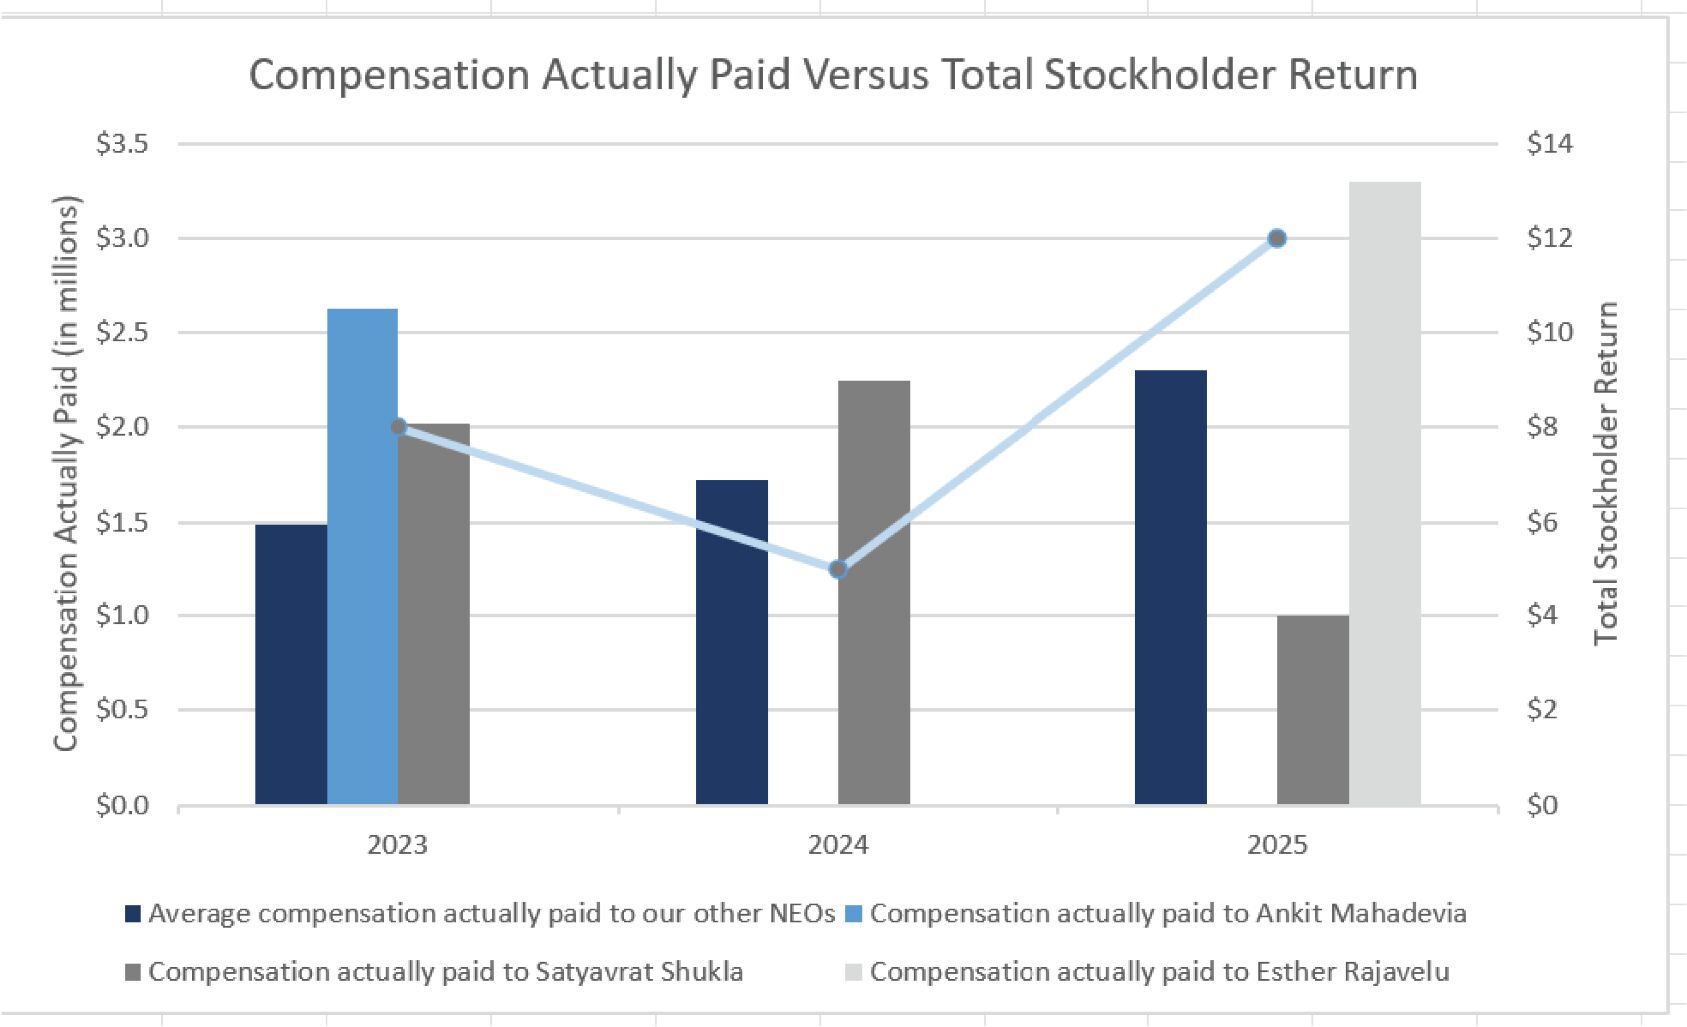
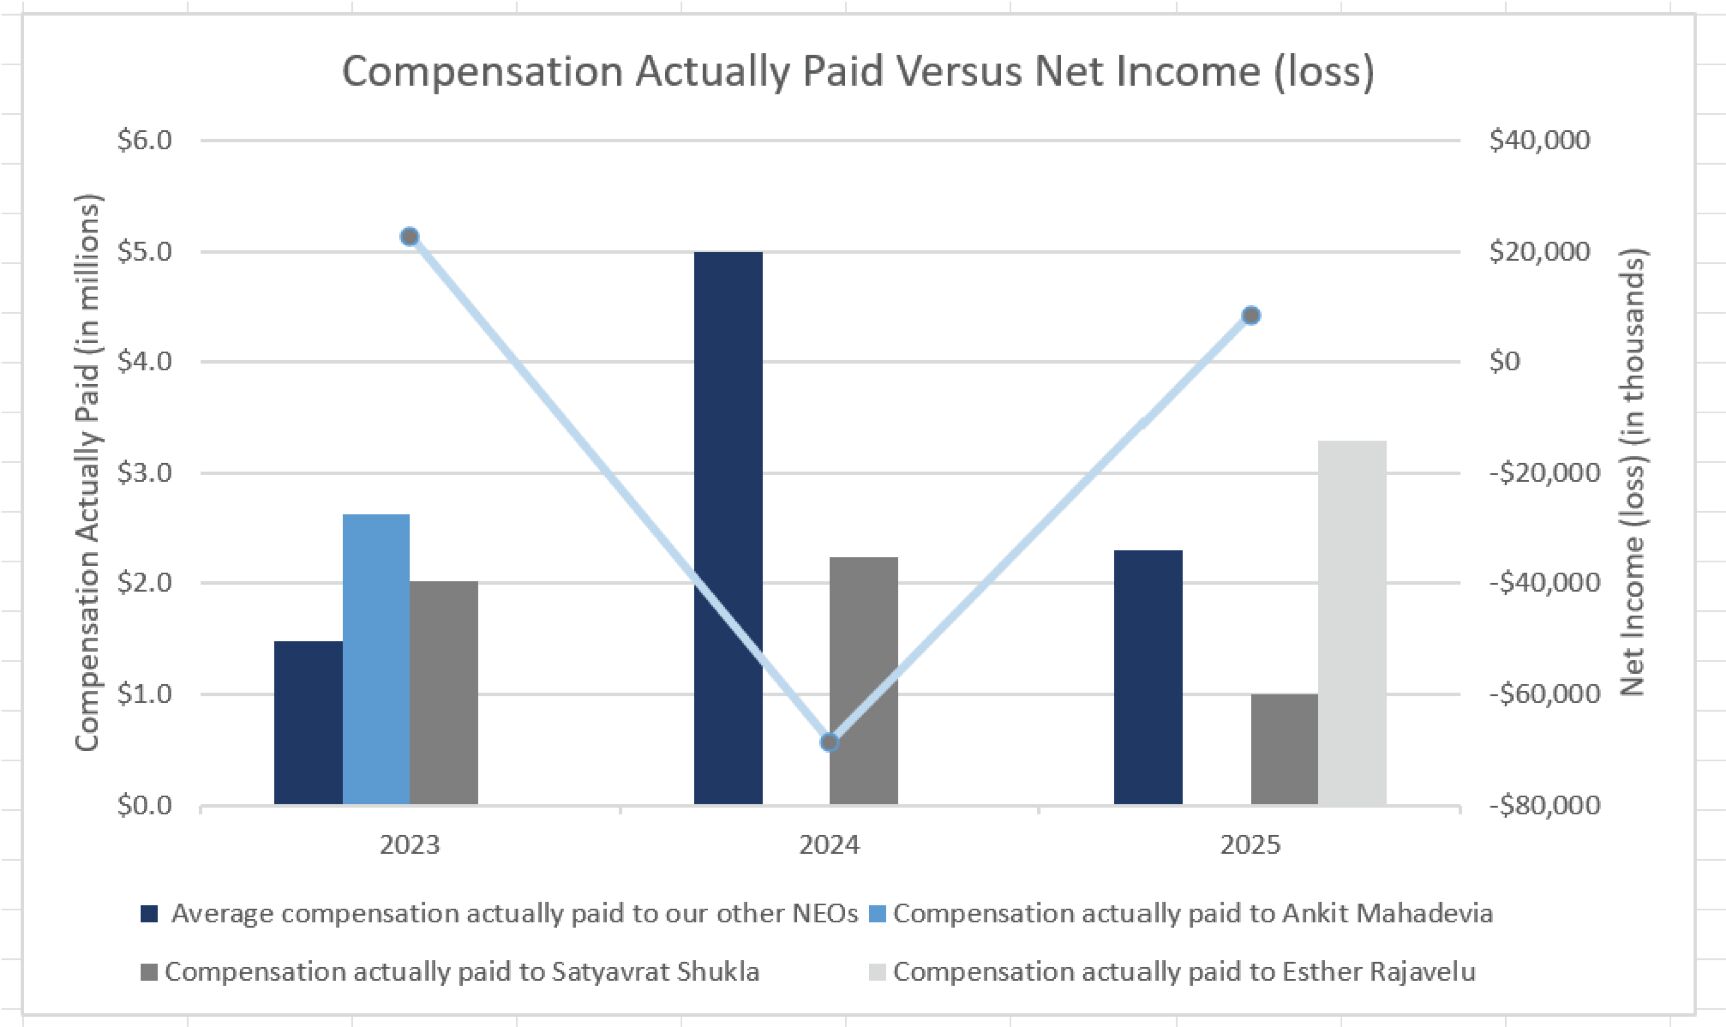
The following graph visually describes the relationship between “compensation actually paid” to our PEOs for each applicable year and the
average
“compensation actually paid” to our other Non-PEO
NEOs, to net income (loss).