Pay vs Performance Disclosure - USD ($)
Dec. 31, 2025
Dec. 31, 2024
Dec. 31, 2023
Dec. 31, 2025
Nov. 12, 2024
| Year | Summary Compensation Table Total for PEO (Julie Eastland)(1) ($) | Summary Compensation Table Total for PEO (Kimberly Blackwell)(2) ($) | Compensation Actually Paid to PEO (Julie Eastland)(3)(4) ($) | Compensation Actually Paid to PEO (Kimberly Blackwell)(3)(4) ($) | Average Summary Compensation Table Total for Non-PEO Named Executive Officers ($) | Average Compensation Actually Paid to Non-PEO Named Executive Officers(3)(4) ($) | Value of Initial Fixed $100 Investment Based on: | Net (Loss) Income ($) | |||||||||||||||||||||
Total Shareholder Return(5) ($) | |||||||||||||||||||||||||||||
| 2025 | 1,300,731 | — | (2,421,000) | — | 1,436,959 | 212,506 | 7 | (137,060,000) | |||||||||||||||||||||
| 2024 | 8,188,909 | 7,466,453 | 5,924,960 | (24,580,169) | 5,337,654 | (619,342) | 15 | (165,867,000) | |||||||||||||||||||||
| 2023 | — | 12,853,590 | — | 6,594,382 | 5,576,632 | 3,027,114 | 75 | (292,305,000) | |||||||||||||||||||||
(2)Kimberly Blackwell resigned as Chief Executive Officer of the Company effective November 13, 2024.
(3)Amounts represent compensation actually paid to our PEOs and the average compensation actually paid to our remaining named executive officers for the relevant fiscal year, as determined under SEC rules (and described below), which includes the individuals indicated in the table below for each fiscal year:
| Year | PEO(s) | Non-PEO Named Executive Officers | ||||||
| 2025 | Julie Eastland | Ingmar Bruns, James Bucher, Andrea Paul, Mark Lackner | ||||||
| 2024 | Julie Eastland, Kimberly Blackwell | Andrea Paul, Cam Gallagher, Diana Hausman, Mark Lackner | ||||||
| 2023 | Kimberly Blackwell | Cam Gallagher, Andrea Paul, Melissa Epperly, Kevin Bunker and Iris Roth | ||||||
The amounts reported in the “Compensation Actually Paid to PEO” and “Average Compensation Actually Paid to Non-PEO Named Executive Officers” columns do not reflect the actual compensation paid to or realized by our PEOs or our non-PEO named executive officers during each applicable year. The calculation of compensation actually paid for purposes of this table includes point-in-time fair values of stock awards and these values will fluctuate based on our stock price, various accounting valuation assumptions and projected performance related to our performance awards. See "—2025 Summary Compensation Table" for certain other compensation of our PEOs and our non-PEO named executive officers for each applicable fiscal year.
The amounts reported in the "Compensation Actually Paid" columns represent the “Total” compensation reported in the 2025 Summary Compensation Table for the applicable fiscal year, as adjusted as follows:
| Adjustments | 2025 | 2024 | 2023 | ||||||||||||||||||||
Julie Eastland | Average Non-PEO Named Executive Officers | Julie Eastland | Kimberly Blackwell | Average Non-PEO Named Executive Officers | Kimberly Blackwell | Average Non-PEO Named Executive Officers | |||||||||||||||||
| Deduction for Amounts Reported under the “Stock Awards” and “Option Awards” Columns in the Summary Compensation Table for Applicable FY | $ | (156,747) | $ | (841,263) | $ | (7,791,824) | $ | (5,182,129) | $ | (4,491,769) | $ | (11,680,083) | $ | (4,634,962) | |||||||||
| Increase based on ASC 718 Fair Value of Awards Granted during Applicable FY that Remain Unvested as of Applicable FY End, determined as of Applicable FY End | 25,772 | 32,082 | 5,409,437 | 1,640,051 | 485,164 | 6,869,408 | 1,849,498 | ||||||||||||||||
| Increase based on ASC 718 Fair Value of Awards Granted during Applicable FY that Vested during Applicable FY, determined as of Vesting Date | 12,821 | 14,550 | 118,439 | 298,144 | 193,082 | 1,137,084 | 368,524 | ||||||||||||||||
| Increase/deduction for Awards Granted during Prior FY that were Outstanding and Unvested as of Applicable FY End, determined based on change in ASC 718 Fair Value from Prior FY End to Applicable FY End | (2,321,134) | (264,294) | — | (4,186,750) | (1,919,130) | (3,450,560) | (420,993) | ||||||||||||||||
| Increase/deduction for Awards Granted during Prior FY that Vested During Applicable FY, determined based on change in ASC 718 Fair Value from Prior FY End to Vesting Date | (1,282,445) | (115,117) | — | (3,378,771) | (549,691) | 864,943 | 288,415 | ||||||||||||||||
| Deduction of ASC 718 Fair Value of Awards Granted during Prior FY that were Forfeited during Applicable FY, determined as of Prior FY End | — | (50,410) | — | (23,185,118) | — | — | — | ||||||||||||||||
| Increase based on Incremental Fair Value of Options/SARs Modified during Applicable FY | — | — | — | 1,947,951 | 325,348 | — | — | ||||||||||||||||
| Total Adjustments | (3,721,731) | (1,224,452) | (2,263,949) | (32,046,622) | (5,956,996) | (6,259,208) | (2,549,518) | ||||||||||||||||
| Compensation Actually Paid | $(2,421,000) | $212,506 | $5,924,960 | $(24,580,169) | $(619,342) | $6,594,382 | $3,027,114 | ||||||||||||||||
Relationship Between Financial Performance Measures
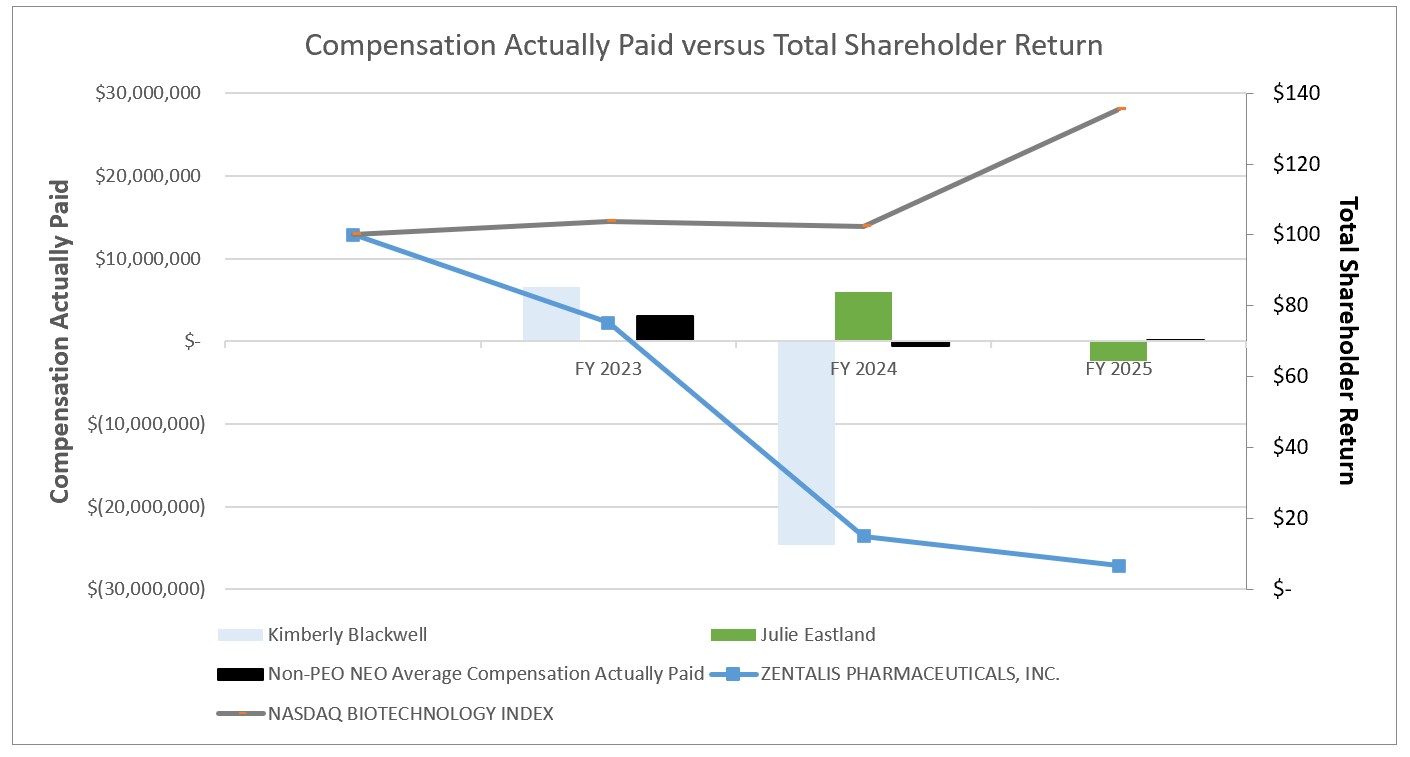
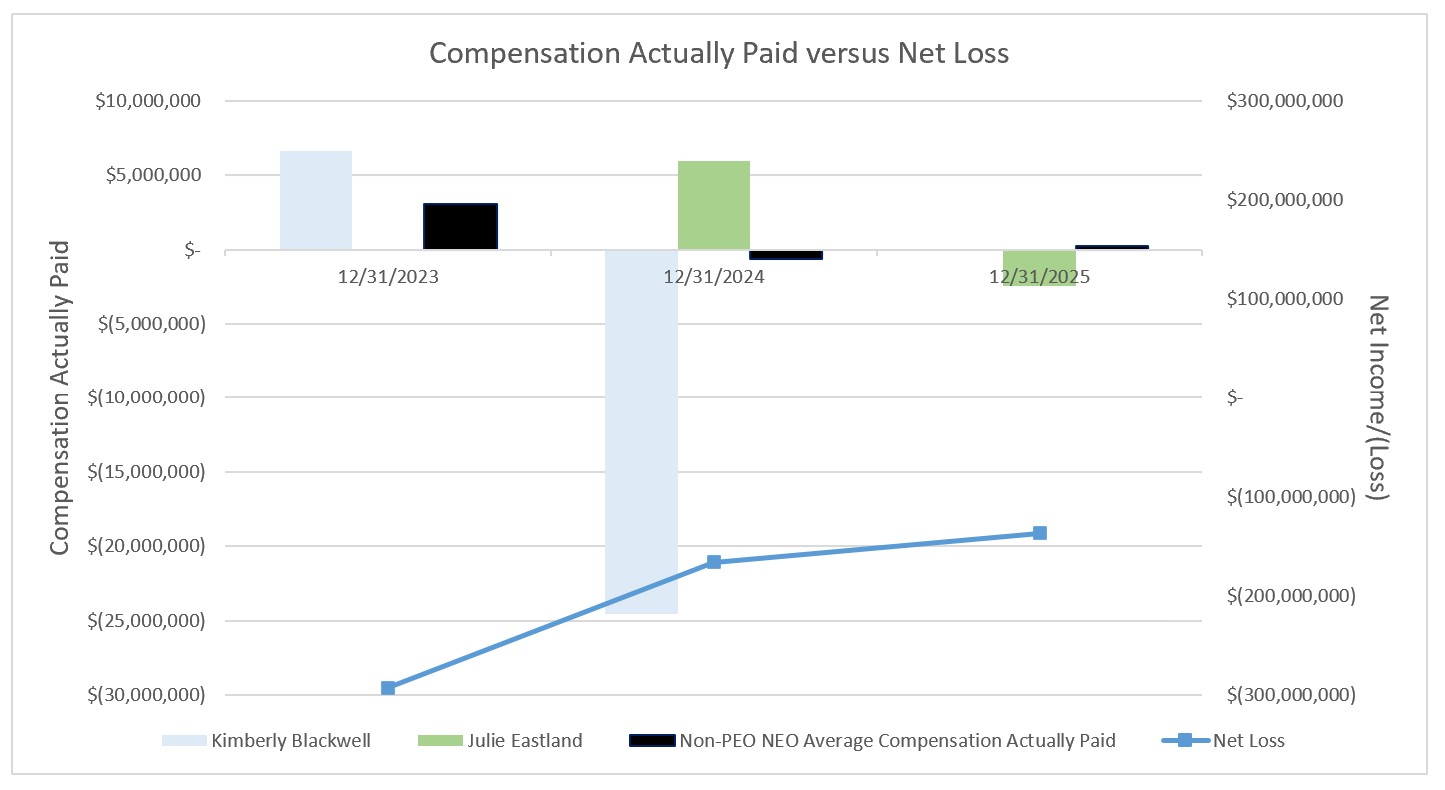
The graphs below compare the compensation actually paid to our PEOs and the average of the compensation actually paid to our non-PEO named executive officers, with (i) our cumulative TSR and (ii) our net (loss) income, in each case, for the fiscal years ended December 31, 2025, 2024 and 2023.
Relationship Between Financial Performance Measures
The graphs below compare the compensation actually paid to our PEOs and the average of the compensation actually paid to our non-PEO named executive officers, with (i) our cumulative TSR and (ii) our net (loss) income, in each case, for the fiscal years ended December 31, 2025, 2024 and 2023.