Pay vs Performance Disclosure - USD ($)
Dec. 31, 2025
Dec. 31, 2024
Dec. 31, 2023
Dec. 31, 2022
Dec. 31, 2021
Principal Executive Officers (“PEOs”)(1) | Value of Initial Fixed $100 Investment Based on: | Net Income (Loss)(5) ($MM) | Company Selected Measure: Adj. EBITDA(6) ($MM) | |||||||||||||||||||||||||||||||||||||||||||||||||||||||||||||||||||||||||||||||||||
| Summary Compensation Table Total | Compensation Actually Paid Total(3) | Average Other Non-PEO NEOs(2) | ||||||||||||||||||||||||||||||||||||||||||||||||||||||||||||||||||||||||||||||||||||
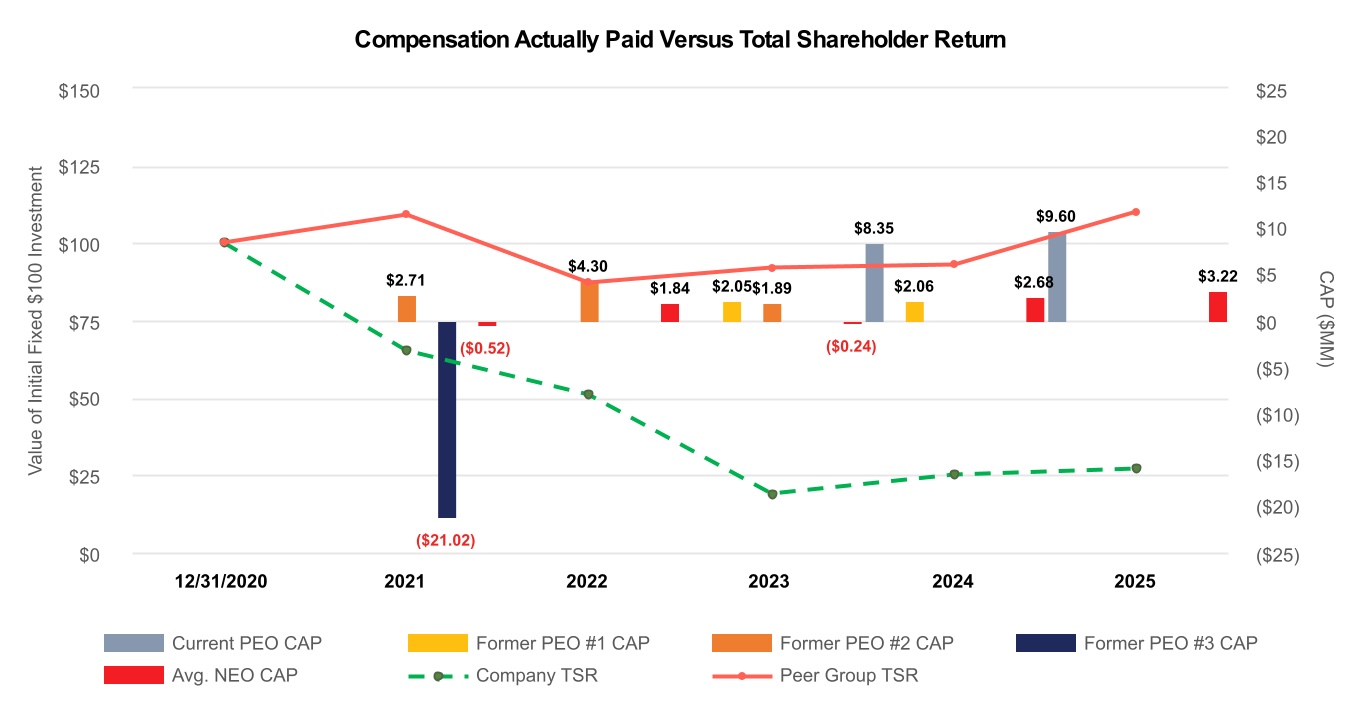
| Fiscal Year | Current: Suzanne Foster | Former: Richard Barasch | Former: Stephen Griggs | Former: Luke McGee | Current: Suzanne Foster | Former: Richard Barasch | Former: Stephen Griggs | Former: Luke McGee | Summary Comp Table Total | Comp Actually Paid Total(3) | Company TSR(4) | Peer Group TSR(4) | ||||||||||||||||||||||||||||||||||||||||||||||||||||||||||||||||||||||||||
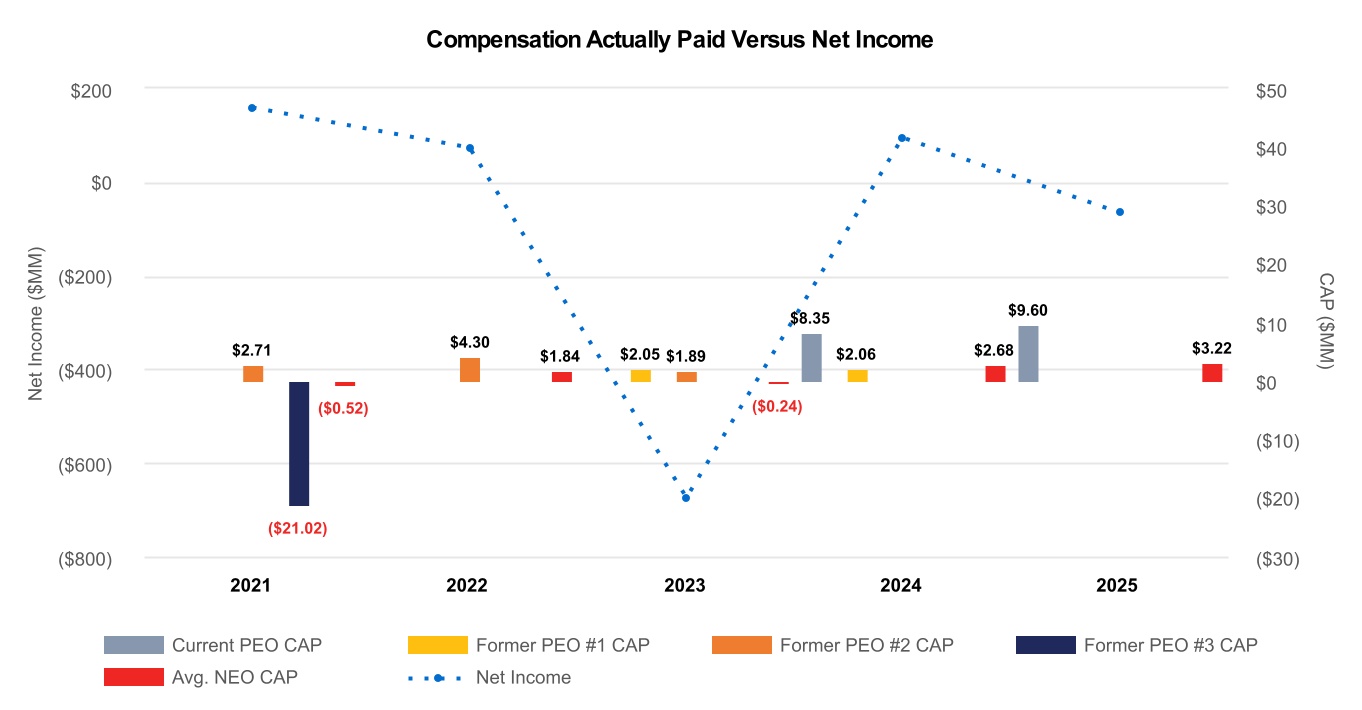
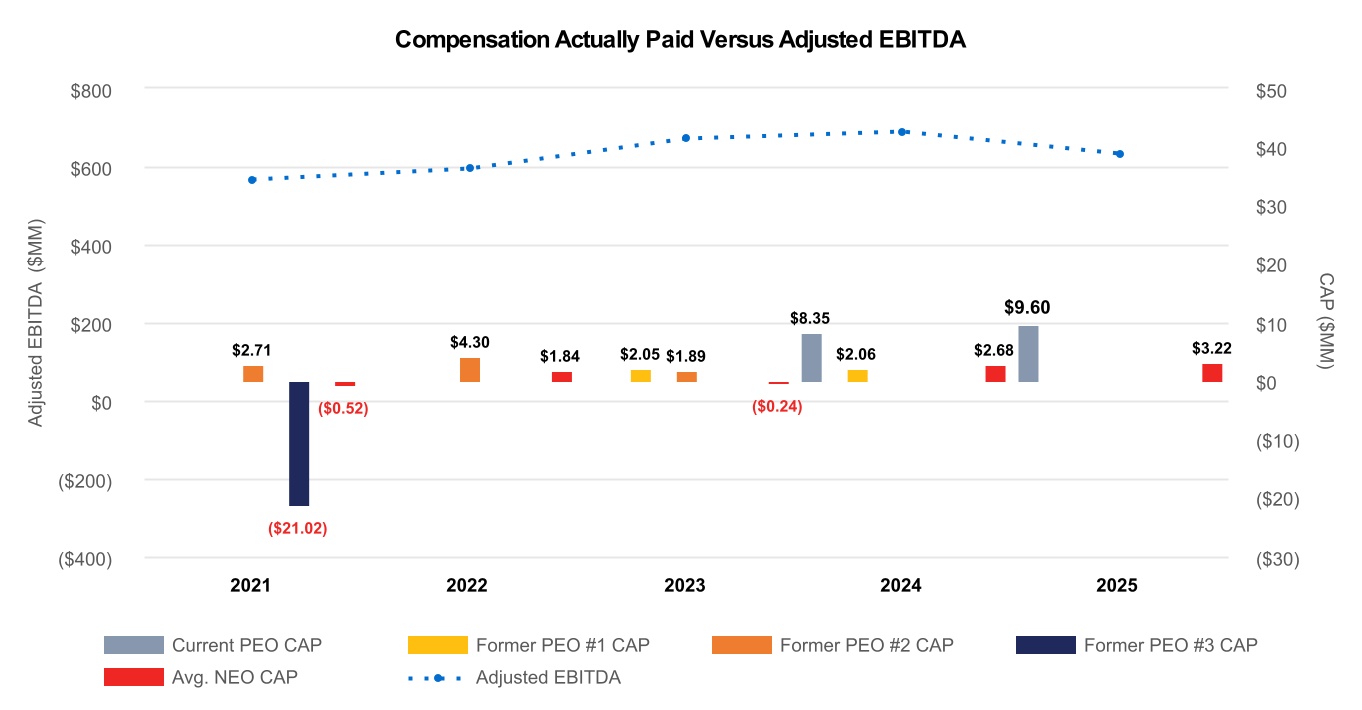
| 2025 | $ | 10,256,240 | n/a | n/a | n/a | $ | 9,602,139 | n/a | n/a | n/a | $ | 3,424,642 | $ | 3,219,184 | $ | 27 | $ | 110 | $ | (66) | $ | 631 | ||||||||||||||||||||||||||||||||||||||||||||||||||||||||||||||||
| 2024 | $ | 8,391,752 | $ | 2,074,106 | n/a | n/a | $ | 8,347,867 | $ | 2,060,486 | n/a | n/a | $ | 4,122,211 | $ | 2,675,520 | $ | 25 | $ | 93 | $ | 95 | $ | 689 | ||||||||||||||||||||||||||||||||||||||||||||||||||||||||||||||
| 2023 | n/a | $ | 2,265,183 | $ | 10,437,819 | n/a | n/a | $ | 2,048,248 | $ | 1,893,765 | n/a | $ | 2,440,283 | $ | (238,940) | $ | 19 | $ | 92 | $ | (675) | $ | 671 | ||||||||||||||||||||||||||||||||||||||||||||||||||||||||||||||
| 2022 | n/a | n/a | $ | 4,724,344 | n/a | n/a | n/a | $ | 4,296,449 | n/a | $ | 2,823,510 | $ | 1,841,864 | $ | 51 | $ | 87 | $ | 73 | $ | 594 | ||||||||||||||||||||||||||||||||||||||||||||||||||||||||||||||||
| 2021 | n/a | n/a | $ | 3,935,883 | $ | 8,061,871 | n/a | n/a | $ | 2,710,254 | $ | (21,022,257) | $ | 3,348,903 | $ | (523,574) | $ | 65 | $ | 109 | $ | 158 | $ | 566 | ||||||||||||||||||||||||||||||||||||||||||||||||||||||||||||||
(1)For 2025, our PEO was Ms. Foster. For 2024, our PEOs included both our current CEO, Ms. Foster, and our former interim CEO, Mr. Barasch. For 2023, our PEOs included both our former interim CEO, Mr. Barasch, and our former CEO, Mr. Griggs. For 2022, our PEO was Mr. Griggs. For 2021, our PEOs included both Mr. Griggs and our former CEO, Mr. McGee.
For 2024, our non-PEO NEOs were Messrs. Clemens, Prast, Barnhart, Parnes, and Rietkerk, and Ms. Archbold. For 2023, our non-PEO NEOs were Messrs. Parnes, Clemens, Prast, and Rietkerk. For 2022, our non-PEO NEOs were Messrs. Parnes, Clemens, Joyce and Prast. For 2021, our non-PEO NEOs were Messrs. Parnes, Clemens, Prast and Bunting.
(3)In calculating the “Compensation Actually Paid” (“CAP”) amounts reflected in these columns, the fair value or change in fair value, as applicable, of the equity award adjustments included in such calculations were computed in accordance with FASB ASC Topic 718. Stock option grant date fair values are calculated based on the Black-Scholes option pricing model as of date of grant. Adjustments have been made using stock option fair values as of each measurement date using the stock price as of the measurement date and updated assumptions as of the measurement date. Time-vested restricted stock/unit grant date fair values are calculated using the stock price as of date of grant. Adjustments have been made using the stock price as of year-end and as of each vesting date. Performance-vested restricted stock unit fair values are calculated based on the Monte Carlo valuation model as of the date of grant. Adjustments have been made using performance-vested restricted stock unit fair values as of each measurement date using the stock price as of the measurement date and updated Monte Carlo assumptions. The assumptions used to calculate the fair value for purposes of determining CAP are consistent with the methodology used for calculating the grant date fair value for financial reporting purposes. There are no dividends or other earnings paid on stock or option awards in the applicable year prior to the vesting date that are not otherwise included in the CAP amounts for the applicable year.
In the calculation of CAP presented in the table, the following amounts were deducted and added:
Reconciliation of Summary Compensation Table (“SCT”) total to Compensation Actually Paid (“CAP”)
| FY2025 | FY2024 | FY2023 | FY2022 | FY2021 | |||||||||||||||||||||||||||||||||||||||||||||||||||||||
| Description of Elements Added / Subtracted to SCT Total to Calculate CAP | Current PEO Foster | Average Other NEOs | Current PEO Foster | Former PEO Barasch | Average Other NEOs | Former PEO Barasch | Former PEO Griggs | Average Other NEOs | Former PEO Griggs | Average Other NEOs | Former PEO Griggs | Former PEO McGee | Average Other NEOs | ||||||||||||||||||||||||||||||||||||||||||||||
| Summary Compensation Table (“SCT”) Total | $ | 10,256,240 | $ | 3,424,642 | $ | 8,391,752 | $ | 2,074,106 | $ | 4,122,211 | $ | 2,265,183 | $ | 10,437,819 | $ | 2,440,283 | $ | 4,724,344 | $ | 2,823,510 | $ | 3,935,883 | $ | 8,061,871 | $ | 3,348,903 | |||||||||||||||||||||||||||||||||
| - | Pension and equity amounts reported in SCT | $ | 7,530,880 | $ | 2,221,309 | $ | 6,592,784 | $ | 474,408 | $ | 2,914,398 | $ | 743,274 | $ | 7,257,900 | $ | 1,372,050 | $ | 3,698,882 | $ | 1,963,262 | $ | 2,795,498 | $ | 5,808,758 | $ | 2,474,283 | ||||||||||||||||||||||||||||||||
| + | Fair value of equity compensation granted in current year and outstanding at year end | $ | 6,815,203 | $ | 2,012,341 | $ | 6,548,899 | $ | — | $ | 1,618,903 | $ | 186,726 | $ | 294,606 | $ | 434,705 | $ | 3,950,263 | $ | 2,096,688 | $ | 1,569,869 | $ | — | $ | 1,646,856 | ||||||||||||||||||||||||||||||||
| + | Change in fair value of equity granted in prior years that remains outstanding at current year end; reflects fair value at current year end - fair value at prior year end | $ | 94,912 | $ | (5,647) | $ | — | $ | — | $ | 12,040 | $ | — | $ | (2,179,990) | $ | (1,729,450) | $ | (504,103) | $ | (357,484) | $ | — | $ | — | $ | (1,549,939) | ||||||||||||||||||||||||||||||||
| - | Fair value of awards forfeited in current year valued at prior year end | $ | — | $ | — | $ | — | $ | — | $ | 184,256 | $ | — | $ | — | $ | — | $ | — | $ | — | $ | — | $ | 20,840,650 | $ | — | ||||||||||||||||||||||||||||||||
| + | Fair value of equity compensation granted and vested in current year | $ | — | $ | — | $ | — | $ | 391,375 | $ | — | $ | 471,798 | $ | 948,505 | $ | — | $ | — | $ | — | $ | — | $ | — | $ | — | ||||||||||||||||||||||||||||||||
| + | Change in fair value of equity granted in prior years and vested in current year | $ | (33,336) | $ | 9,157 | $ | — | $ | 69,413 | $ | 21,020 | $ | (132,185) | $ | (349,275) | $ | (12,428) | $ | (175,173) | $ | (757,588) | $ | — | $ | (2,434,720) | $ | (1,495,111) | ||||||||||||||||||||||||||||||||
| Compensation Actually Paid (“CAP”) | $ | 9,602,139 | $ | 3,219,184 | $ | 8,347,867 | $ | 2,060,486 | $ | 2,675,520 | $ | 2,048,248 | $ | 1,893,765 | $ | (238,940) | $ | 4,296,449 | $ | 1,841,864 | $ | 2,710,254 | $ | (21,022,257) | $ | (523,574) | |||||||||||||||||||||||||||||||||
Pay Versus Performance Tabular List
The following table lists our most important financial performance measures used to link CAP to our NEOs to company performance for fiscal year 2025.
Most Important Performance Measures
Adjusted EBITDA
Free Cash Flow
Relative Total Shareholder Return
Net Revenue
(6)We have selected Adjusted EBITDA as our most important financial measure (that is not otherwise required to be disclosed in the table) used to link compensation actually paid to our NEOs to Company performance for fiscal year 2025. Our Compensation Committee determined the 2025 annual bonus outcome for eligible NEOs partially based on the achievement of this measure, which was adjusted for a litigation settlement expense that was approved by the Committee for purposes of determining Adjusted EBITDA for payment of the 2025 annual incentive for the
Company's NEOs. See the section titled "Year in Review and Alignment of Company Performance with Pay" on page 23 of this Proxy Statement for additional information.