Pay vs Performance Disclosure - USD ($)
Dec. 31, 2025
Dec. 31, 2024
Dec. 31, 2023
| Year (1) | Summary Compensation Table Total for PEO ($) | Compensation Actually Paid to PEO ($)(2) | Average Summary Compensation Table Total for Non-PEO NEOs ($) | Average Compensation Actually Paid to Non-PEO NEOs ($)(2) | Value of Initial Fixed $100 Investment Based on: Total Shareholder Return ($) | Net Income (Loss) ($) | |||||||||||||||||||||||||||||
| 2025 | 2,300,455 | 9,202,304 | 1,217,087 | 3,783,341 | 143 | (170,370,000) | |||||||||||||||||||||||||||||
| 2024 | 2,005,432 | 1,859,722 | 1,118,479 | 1,062,307 | 42 | (56,528,000) | |||||||||||||||||||||||||||||
| 2023 | 2,095,988 | 1,592,883 | 1,309,364 | 1,205,267 | 42 | (179,817,000) | |||||||||||||||||||||||||||||
| 2023 | 2024 | 2025 | ||||||||||||||||||
| Adjustments(a) | PEO | Average Non-PEO NEOs | PEO | Average Non-PEO NEOs | PEO | Average Non-PEO NEOs | ||||||||||||||
| Deduction for Amounts Reported under the “Stock Awards” and “Option Awards” Columns in the Summary Compensation Table for Applicable FY | $(1,185,725) | $(887,420) | $(1,043,438) | $(409,922) | $(1,392,006) | $(546,860) | ||||||||||||||
| Increase based on ASC 718 Fair Value of Awards Granted during Applicable FY that Remain Unvested as of Applicable FY End, determined as of Applicable FY End | 1,163,964 | 697,241 | 914,944 | 359,442 | 4,195,730 | 1,648,323 | ||||||||||||||
| Increase based on ASC 718 Fair Value of Awards Granted during Applicable FY that Vested during Applicable FY, determined as of Vesting Date | — | — | — | — | — | — | ||||||||||||||
| Increase/deduction for Awards Granted during Prior FY that were Outstanding and Unvested as of Applicable FY End, determined based on change in ASC 718 Fair Value from Prior FY End to Applicable FY End | (454,994) | (64,086) | (53,304) | (14,259) | 3,514,536 | 1,205,319 | ||||||||||||||
| Increase/deduction for Awards Granted during Prior FY that Vested During Applicable FY, determined based on change in ASC 718 Fair Value from Prior FY End to Vesting Date | (26,350) | 57,086 | 36,087 | 8,567 | 583,589 | 259,472 | ||||||||||||||
| Deduction of ASC 718 Fair Value of Awards Granted during Prior FY that were Forfeited during Applicable FY, determined as of Prior FY End | — | (48,564) | — | — | — | — | ||||||||||||||
| Increase based on Dividends or Other Earnings Paid during Applicable FY prior to Vesting Date | — | — | — | — | — | — | ||||||||||||||
| Increase based on Incremental Fair Value of Options/SARs Modified during Applicable FY | — | 141,646 | — | — | — | — | ||||||||||||||
| TOTAL ADJUSTMENTS | $(503,105) | $(104,097) | $(145,711) | $(56,172) | $6,901,849 | $2,566,254 | ||||||||||||||
(a) The fair value of stock options reported for CAP purposes in the Adjustments table is estimated using a Black-Scholes and Monte Carlo option pricing models. These models use both historical data and current market data to estimate the fair value of options and requires several assumptions. The assumptions used in estimating fair value for options (other than Mr. Hasnain’s performance-based options) included in the adjustments calculation are as follows:
| Year | 2023 | 2024 | 2025 | |||||||||||||||||
| Volatility | 62.34 - 131.17% | 101.12 - 134.90% | 86.34 - 134.90% | |||||||||||||||||
| Expected life (in years) | 1.96 - 6.01 years | 2.08 - 5.08 years | 2.08 - 5.08 years | |||||||||||||||||
| Expected dividend yield | —% | —% | —% | |||||||||||||||||
| Risk-free rate | 3.37 - 5.04% | 3.42 - 4.85% | 3.47 - 4.42% | |||||||||||||||||
The assumptions used in estimating the fair value of Mr. Hasnain’s performance-based options granted in May 2023, which contain both service-based and market-based vesting conditions, as of the last day of 2025, was determined using the Geometric Brownian Motion/Monte Carlo model and the following assumptions: the company’s common stock price as of December 31, 2025 of $3.10; a four-year continuously compounded equivalent risk-free rate of 3.64%; an expected stock price volatility of 110.21%; a dividend yield of 0%; and an expected term of approximately 4 years. The assumptions used in estimating the fair value of Mr. Hasnain’s performance-based options granted in May 2023, which contain both service-based and market-based vesting
conditions, as of the last day of 2024, was determined using the Geometric Brownian Motion/Monte Carlo model and the following assumptions: the company’s common stock price as of December 31, 2024 of $0.90; a five-year continuously compounded equivalent risk-free rate of 4.38%; an expected stock price volatility of 101.19%; a dividend yield of 0%; and an expected term of approximately five years. The assumptions used in estimating the fair value of Mr. Hasnain’s performance-based options granted in May 2023, which contain both service-based and market-based vesting conditions, as of the last day of 2023, was determined using the Geometric Brownian Motion/Monte Carlo model and the following assumptions: the company’s common stock price as of December 31, 2023 of $0.91; a six-year continuously compounded equivalent risk-free rate of 3.86%; an expected stock price volatility of 103.89%; a dividend yield of 0%; and an expected term of approximately six years.
The fair value of RSUs reported for CAP purposes in the Adjustments table is estimated using the closing price per share of our common stock on the applicable measurement date.
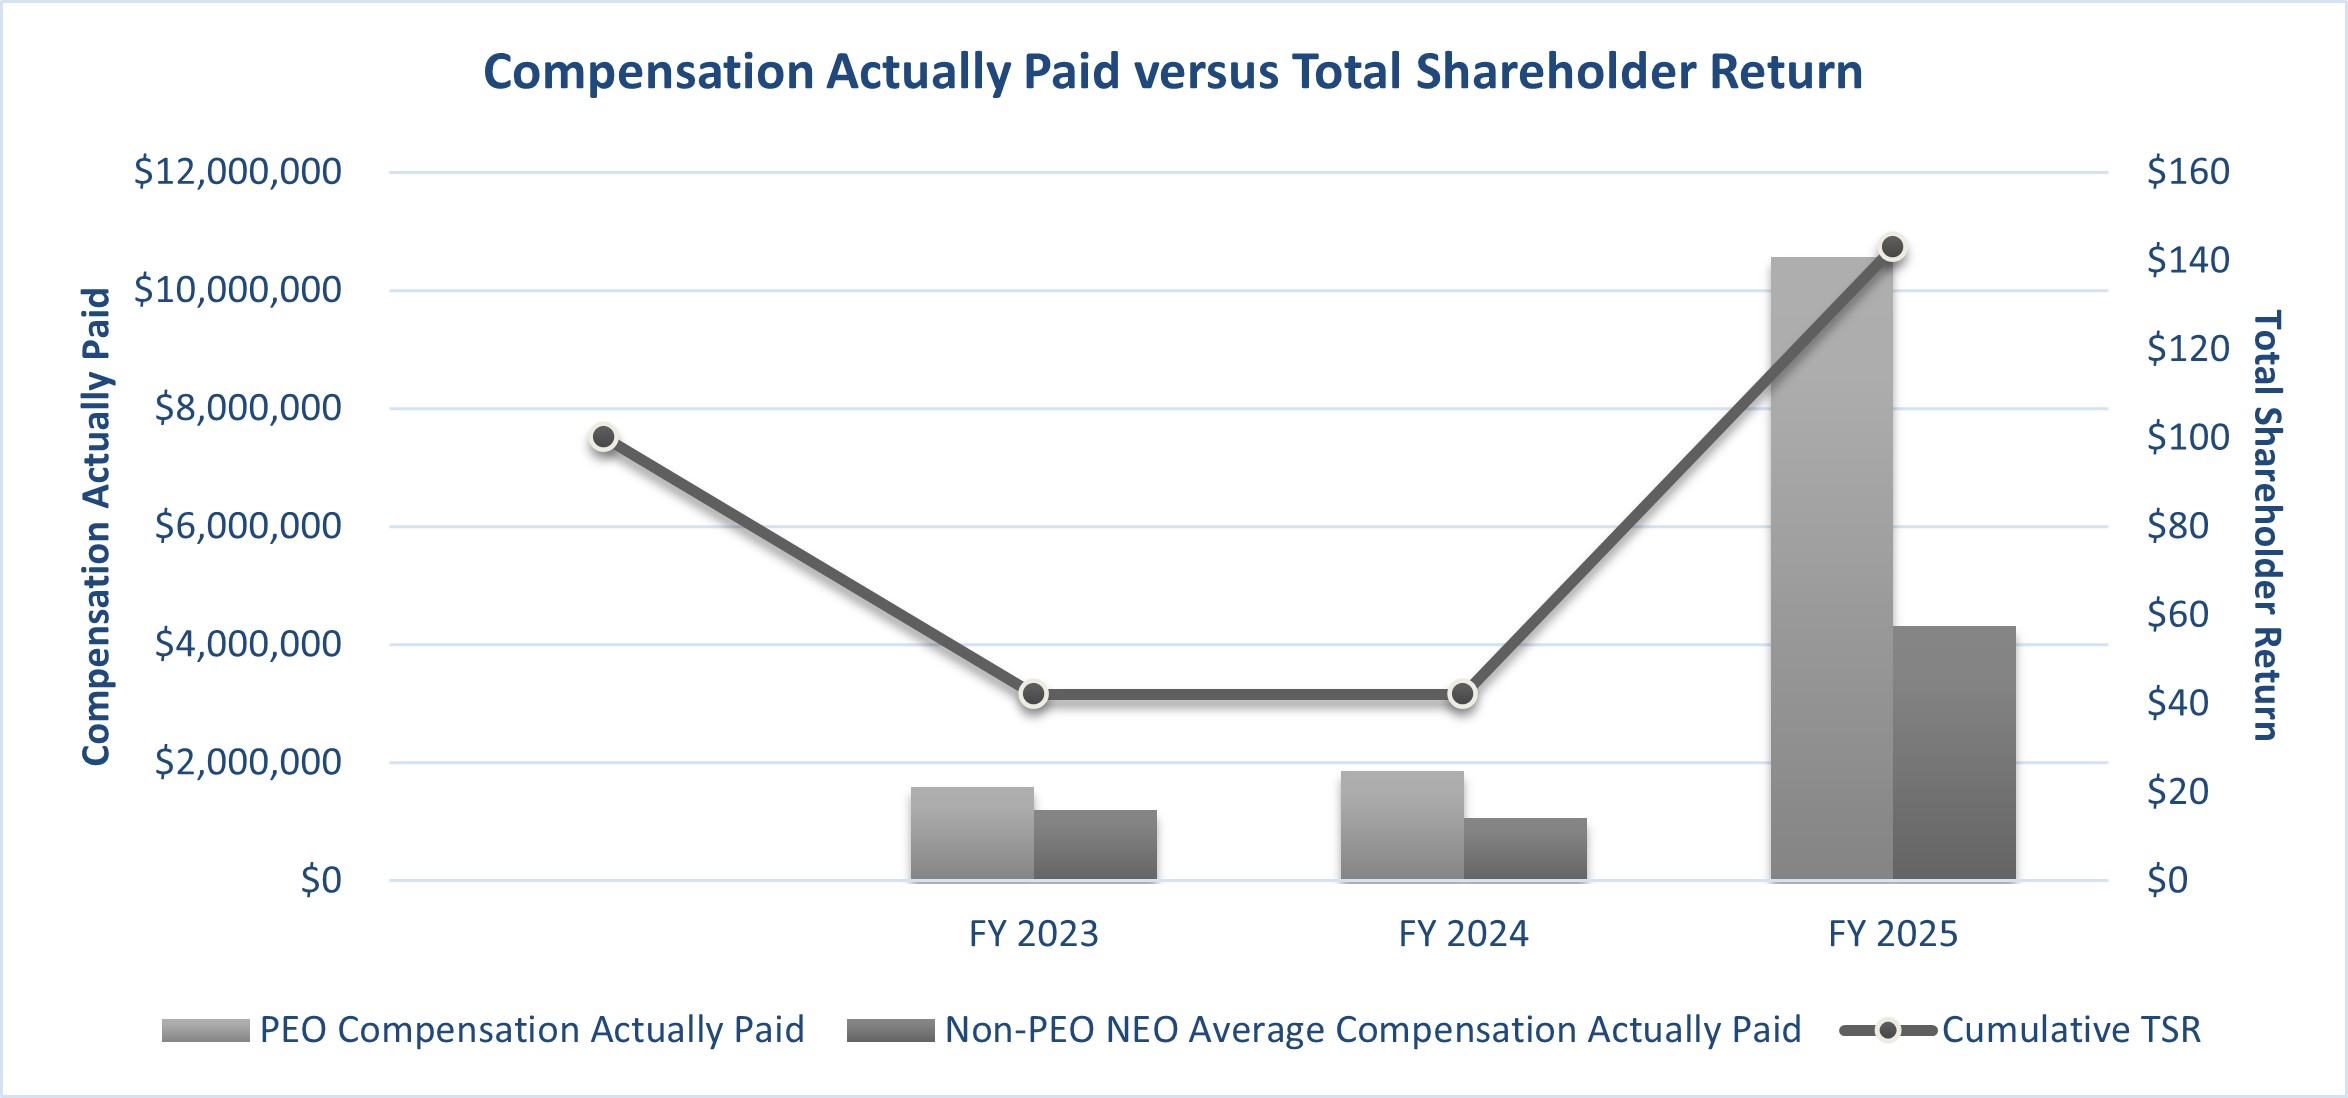
Relationship between CAP and TSR
The graphs below reflect the relationship between the PEO and Average Non-PEO NEO CAP and the company’s cumulative indexed Total Shareholder Return, or TSR, (assuming an initial fixed investment of $100) for the fiscal years ended December 31, 2023, 2024 and 2025:
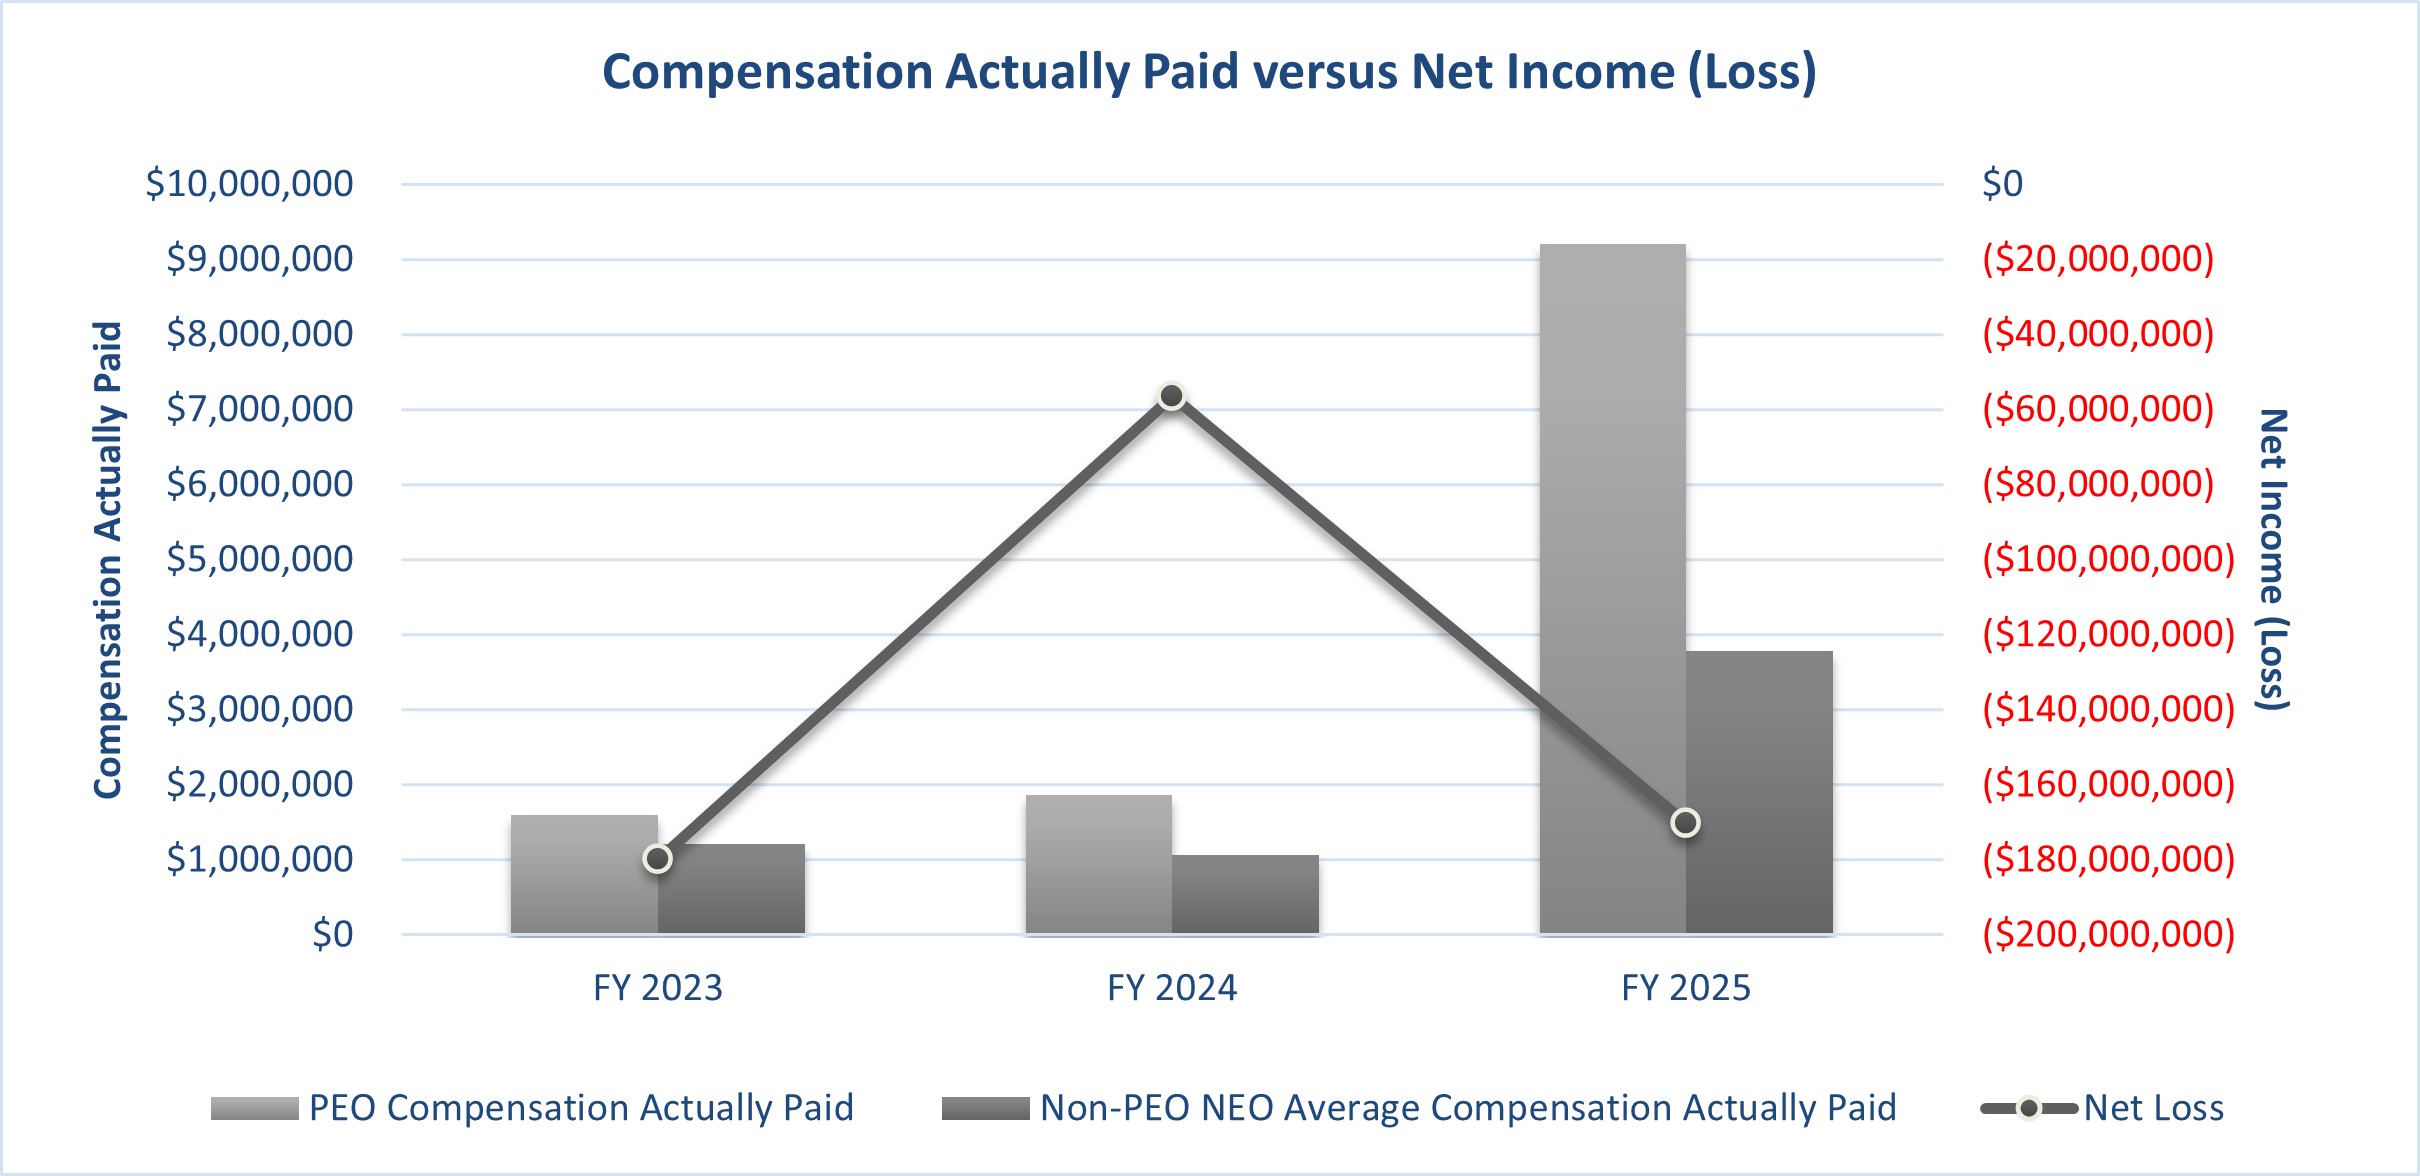
Relationship between CAP and Net Income (Loss)
The graph below reflects the relationship between the PEO and Average Non-PEO NEO CAP and the company’s Net Income (Loss) for the fiscal years ended December 31, 2023, 2024 and 2025: