Pay vs Performance Disclosure - USD ($)
Dec. 31, 2025
Dec. 31, 2024
Dec. 31, 2023
Dec. 31, 2022
Dec. 31, 2021
Pay Versus Performance
The disclosure included in this section is prescribed by SEC rules and does not necessarily align with how the Company or the Compensation and Human Capital Committee view the link between the Company’s performance and named executive officer pay. For additional information about our pay-for-performance philosophy and how we align executive compensation with Company performance, refer to the Compensation Discussion and Analysis.
Required Tabular Disclosure of Pay Versus Performance
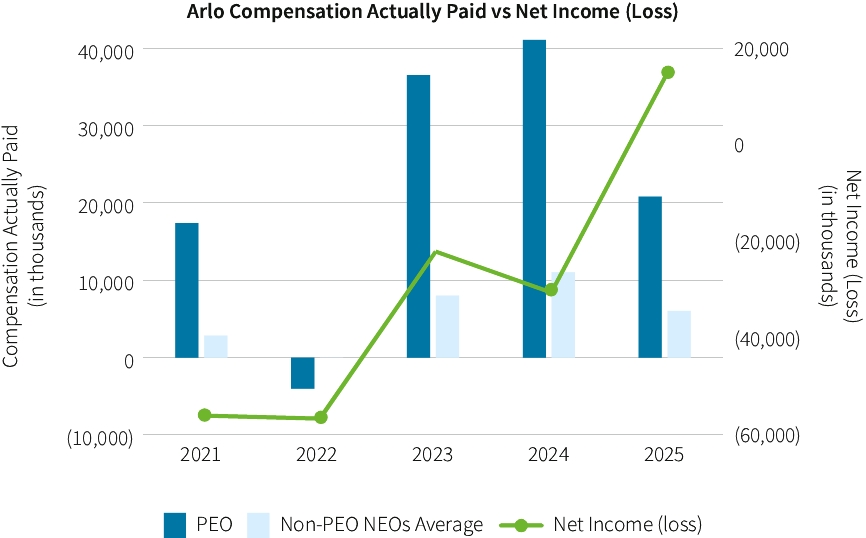
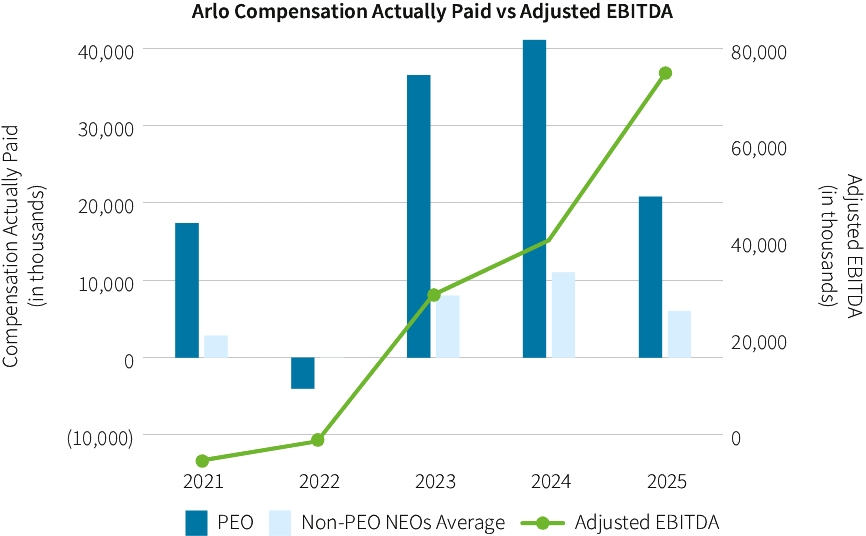
The following table reports the compensation of our principal executive officer (“PEO”) and the average compensation of the other named executive officers (“NEO”) as disclosed in the Summary Compensation Table (“SCT”) for the past four fiscal years, as well as their “compensation actually paid,” as defined and calculated pursuant to Item 402(v) of Regulation S-K, and certain performance measures required by the rules. The table also provides information on our cumulative TSR, the cumulative TSR of our peer group, net income (loss), and adjusted EBITDA. Use of the term “compensation actually paid” (“CAP”) is required by the SEC’s rules and as a result of the calculation methodology required by the SEC, such amounts differ from compensation actually received by the individuals and the compensation decisions described in the “Compensation Discussion and Analysis” section above.
Value of initial fixed $100 investment based on: | ||||||||||||||||||||||||||
Year(1) | Summary compensation table total for PEO | Compensation actually paid to PEO(2) | Average SCT total for Non-PEO NEOs | Average compensation actually paid to Non-PEO NEOs(2) | Arlo TSR(3) | Peer group TSR(3) | Net income (loss) (in thousands) | Adjusted EBITDA (in thousands)(4) | ||||||||||||||||||
2025 | $7,358,402 | $20,816,002 | $3,313,152 | $6,049,638 | $179.59 | $138.92 | $14,926 | $74,749 | ||||||||||||||||||
2024 | $23,268,296 | $41,102,735 | $6,600,417 | $11,016,997 | $143.65 | $116.91 | $(30,504) | $40,321 | ||||||||||||||||||
2023 | $9,911,634 | $36,543,991 | $1,367,684 | $8,011,446 | $122.21 | $118.16 | $(22,036) | $29,013 | ||||||||||||||||||
2022 | $15,405,950 | $(4,020,347) | $4,282,541 | $(18,473) | $45.06 | $97.95 | $(56,626) | $(1,296) | ||||||||||||||||||
2021 | $10,458,023 | $17,399,037 | $1,691,808 | $2,843,554 | $134.66 | $126.53 | $(56,029) | $(5,251) | ||||||||||||||||||
(1) | Mr. McRae served as our PEO for 2025, 2024, 2023, 2022, and 2021. The non-PEO NEOs included for purposes of calculating the average amounts in each applicable year are as follows: (i) for 2025, 2024 and 2023, Kurtis Binder and Brian Busse; (ii) for 2022, Kurtis Binder, Brian Busse and Gordon Mattingly; and (iii) for 2021, Brian Busse and Gordon Mattingly. |
(2) | Represents compensation actually paid to Mr. McRae and the average amount paid to our non-PEO NEOs as a group, as computed in accordance with Item 402(v) of Regulation S-K. The dollar amounts do not reflect the actual amount of compensation earned during the applicable year. In accordance with the requirements of Item 402(v) of Regulation S-K, the following adjustments were made to Mr. McRae’s total compensation and average total reported compensation for our non-PEO NEOs as a group for 2025 as reported in the Summary Compensation Table to determine the CAP. The following table reflects the value of equity calculated in accordance with the SEC methodology for determining CAP for each year shown. We use the closing price on the applicable date as a basis for fair value. Fair values for certain PSU award are measured using a Monte Carlo simulation model as PSUs contain a market condition at the time of grant (as calculated in accordance with FASB ASC Topic 718), and the valuation assumptions used to calculate fair values did not materially differ from those disclosed at the time of the grant. |
Year and position | Summary compensation table total | Less: Grant date fair value of equity awards reported in the summary compensation table | Plus: Fair value of equity awards granted during the year that remain unvested as of year end | Plus: Fair value of equity awards granted during the year that vested during the year | Plus: Change in fair value of prior years’ equity awards that outstanding and unvested as of year end | Plus: Change in fair value of prior years’ equity awards vested during the year | Less: Fair value of prior years’ equity awards that failed to meet vesting conditions | Compensation actually paid | ||||||||||||||||||
PEO | ||||||||||||||||||||||||||
2025 | $7,358,402 | $5,590,000 | $6,995,000 | $2,735,020 | $574,389 | $8,743,191 | $— | $20,816,002 | ||||||||||||||||||
Average Non-PEO Named Executive Officers | ||||||||||||||||||||||||||
2025 | $3,313,152 | $2,515,500 | $3,147,750 | $1,246,166 | $201,758 | $656,312 | $— | $6,049,638 | ||||||||||||||||||
(3) | Arlo TSR is cumulative for the measurement periods beginning on December 31, 2021 and ending on December 31, 2025, respectively, calculated in accordance with Item 201(e) of Regulation S-K. Peer Group TSR is calculated based on the S&P 600 Information Technology Index, which is used for purposes of Item 201(e) of Regulation S-K. |
(4) | As required by Item 402(v) of Regulation S-K, we have determined adjusted EBITDA as the company selected measure starting with 2025. Refer to Annex A of this Proxy Statement for reconciliations of non-GAAP financial measures. |
(1) | Mr. McRae served as our PEO for 2025, 2024, 2023, 2022, and 2021. The non-PEO NEOs included for purposes of calculating the average amounts in each applicable year are as follows: (i) for 2025, 2024 and 2023, Kurtis Binder and Brian Busse; (ii) for 2022, Kurtis Binder, Brian Busse and Gordon Mattingly; and (iii) for 2021, Brian Busse and Gordon Mattingly. |
(3) | Arlo TSR is cumulative for the measurement periods beginning on December 31, 2021 and ending on December 31, 2025, respectively, calculated in accordance with Item 201(e) of Regulation S-K. Peer Group TSR is calculated based on the S&P 600 Information Technology Index, which is used for purposes of Item 201(e) of Regulation S-K. |
(2) | Represents compensation actually paid to Mr. McRae and the average amount paid to our non-PEO NEOs as a group, as computed in accordance with Item 402(v) of Regulation S-K. The dollar amounts do not reflect the actual amount of compensation earned during the applicable year. In accordance with the requirements of Item 402(v) of Regulation S-K, the following adjustments were made to Mr. McRae’s total compensation and average total reported compensation for our non-PEO NEOs as a group for 2025 as reported in the Summary Compensation Table to determine the CAP. The following table reflects the value of equity calculated in accordance with the SEC methodology for determining CAP for each year shown. We use the closing price on the applicable date as a basis for fair value. Fair values for certain PSU award are measured using a Monte Carlo simulation model as PSUs contain a market condition at the time of grant (as calculated in accordance with FASB ASC Topic 718), and the valuation assumptions used to calculate fair values did not materially differ from those disclosed at the time of the grant. |
Year and position | Summary compensation table total | Less: Grant date fair value of equity awards reported in the summary compensation table | Plus: Fair value of equity awards granted during the year that remain unvested as of year end | Plus: Fair value of equity awards granted during the year that vested during the year | Plus: Change in fair value of prior years’ equity awards that outstanding and unvested as of year end | Plus: Change in fair value of prior years’ equity awards vested during the year | Less: Fair value of prior years’ equity awards that failed to meet vesting conditions | Compensation actually paid | ||||||||||||||||||
PEO | ||||||||||||||||||||||||||
2025 | $7,358,402 | $5,590,000 | $6,995,000 | $2,735,020 | $574,389 | $8,743,191 | $— | $20,816,002 | ||||||||||||||||||
Average Non-PEO Named Executive Officers | ||||||||||||||||||||||||||
2025 | $3,313,152 | $2,515,500 | $3,147,750 | $1,246,166 | $201,758 | $656,312 | $— | $6,049,638 | ||||||||||||||||||
Required Tabular Disclosure of Most Important Financial Performance Measures
Listed below are the financial measures that in our assessment represent the most important performance measures we use to link CAP for the last fiscal year to company performance:
• | Adjusted EBITDA |
• | Cumulative paid accounts |
• | Annual recurring revenue |
Required Disclosure of the Relationship Between Compensation Actually Paid and Financial Performance Measures
As required by Item 402(v) of Regulation S-K, we are providing the following graphs to illustrate the relationship between the pay and performance figures that are included in the pay versus performance tabular disclosure above. In addition, the first graph below further illustrates the relationship between Company TSR and that of the S&P 600 IT Index. As noted above, CAP for purposes of the tabular disclosure and the following graphs were calculated in accordance with SEC rules and do not fully represent the actual final amount of compensation earned by or actually paid to our named executive officers during the applicable years.
Our management team’s successful execution of Arlo’s transformation strategy resulted in Arlo developing a reputation for operational excellence and financial discipline. Consistently meeting and exceeding our operational targets generated a significant boost to Arlo’s financial outlook and resulted in TSR of nearly 300% since December 2022, which outperformed Arlo’s peer group and the S&P 600 IT Index.
(4) | As required by Item 402(v) of Regulation S-K, we have determined adjusted EBITDA as the company selected measure starting with 2025. Refer to Annex A of this Proxy Statement for reconciliations of non-GAAP financial measures. |