Pay vs Performance Disclosure - USD ($)
Dec. 31, 2025
Dec. 31, 2024
Pay Versus Performance
The following tables and related disclosures provide information about (i) the “total compensation” of our principal executive officers, or PEOs, and our other named executive officers, or the Other NEOs, as presented in the Summary Compensation Table on page 28 of this proxy statement, or the SCT Amounts, (ii) the “compensation actually paid” to our PEOs and our Other NEOs, as calculated pursuant to the SEC’s
pay-versus-performance
rules, or the CAP Amounts, (iii) certain financial performance measures, and (iv) the relationship of the CAP Amounts to those financial performance measures. This disclosure has been prepared in accordance with Item 402(v) of Regulation
S-K
under the Exchange Act and does not necessarily reflect value actually realized by the executives or how our compensation committee evaluates compensation decisions in light of company or individual performance. Oxtoby, Andrew |
Sinha, Vikas |
Brainard, Diana |
||||||||||||||||||||||||||||||||||||||||||||||||
| Fiscal Year |
Summary Compensation Table Total for PEO (1) |
Compensation Actually Paid to PEO (2) |
Summary Compensation Table Total for PEO (1) |
Compensation Actually Paid to PEO (2) |
Summary Compensation Table Total for PEO (1) |
Compensation Actually Paid to PEO (2) |
Average Summary Compensation Table Total for Non- PEO Named Executive Officers (1) |
Average Compensation Actually Paid to Non- PEO Named Executive Officers (2) |
Value of Initial Fixed $100 Investment Based on: Total Shareholder Return |
Net Income (Loss) (in thousands) | ||||||||||||||||||||||||||||||||||||||||
| 2025 |
$ | 2,569,115 | $ | 4,509,544 | $ | 1,100,954 | $ | 1,097,848 | — | — | $ | 1,392,517 | $ | 1,725,759 | $ | 54 | ($ | 43,432 | ) | |||||||||||||||||||||||||||||||
| 2024 |
— | — | $ | 544,400 | $ | 456,150 | $ | 3,028,669 | $ | 2,830,341 | $ | 721,002 | $ | 684,351 | $ | 62 | ($ | 69,167 | ) | |||||||||||||||||||||||||||||||
| (1) | For 2025, the PEOs were Andrew Oxtoby and Vikas Sinha and the Other NEOs were Matthew Feinsod, Matthew Gall and Brett Hagen. For 2024, the PEOs were Vikas Sinha and Diana Brainard, AlloVir’s former Chief Executive Officer, and the Other NEOs were Edward Miller, AlloVir’s General Counsel, and Brett Hagen. Effective as of December 19, 2024, the AlloVir board of directors determined that Dr. Brainard would no longer serve as Chief Executive Officer of AlloVir. On March 18, 2025, in accordance with the terms of the Merger Agreement, effective as of the effective time of the Merger, Mr. Miller resigned as General Counsel and Secretary of AlloVir. |
| (2) | The following table describes the adjustments, each of which is prescribed by SEC rule, to calculate the CAP Amounts from the SCT Amounts. The SCT Amounts and the CAP Amounts do not reflect the actual amount of compensation earned by or paid to our executives during the applicable years, but rather are amounts determined in accordance with Item 402 of Regulation S-K under the Exchange Act. |
| Adjustments |
2025 |
2024 |
||||||||||||||||||||||
Oxtoby, Andrew |
Sinha, Vikas |
Other NEOs* |
Sinha, Vikas |
Brainard, Diana |
Other NEOs* |
|||||||||||||||||||
| Summary Compensation Table (SCT) Total |
$ | 2,569,115 | $ | 1,100,954 | $ | 1,392,517 | $ | 544,400 | $ | 3,028,669 | $ | 721,002 | ||||||||||||
| Subtract: Aggregate value for stock awards and option awards included in SCT Amounts for the covered fiscal year |
$ | 1,687,076 | — | $ | 751,033 | — | — | — | ||||||||||||||||
| Add: Fair value at year end of awards granted during the covered fiscal year that were outstanding and unvested at the covered fiscal year end |
$ | 1,884,171 | — | $ | 1,041,428 | — | — | — | ||||||||||||||||
| Add (Subtract): Year-over-year change in fair value at covered fiscal year end of awards granted in any prior fiscal year that were outstanding and unvested at the covered fiscal year end |
$ | 1,553,813 | — | $ | 38,993 | ($ | 90,091 | ) | — | ($ | 37,901 | ) | ||||||||||||
| Add (Subtract): Change as of the vesting date (from the end of the prior fiscal year) in fair value of awards granted in any prior fiscal year for which vesting conditions were satisfied during the covered fiscal year |
$ | 189,522 | ($ | 3,107 | ) | $ | 3,854 | $ | 1,841 | ($ | 198,328 | ) | $ | 1,250 | ||||||||||
| Compensation Actually Paid (as calculated) |
$ | 4,509,544 | $ | 1,097,848 | $ | 1,725,759 | $ | 456,150 | $ | 2,830,341 | $ | 684,351 | ||||||||||||
| * | Amounts presented are averages for the entire group of Other NEOs in each respective year. |
For the equity values included in the above tables, the valuation assumptions used to calculate fair values of stock options were materially different from those disclosed at the time of the grant of the stock options. The assumptions used in determining fair value of the stock options that vested during 2025 and 2024, or that were outstanding as of December 31, 2025 or December 31, 2024, as applicable, are as follows:
Options Vested During Year or Outstanding on December 31 of: |
||||||||
2025 |
2024 |
|||||||
| Expected Volatility |
90.16% - 116.1% |
101.74% - 113.39% |
||||||
| Risk-Free Interest Rate |
3.53% - 4.38% | 3.55% - 4.81% | ||||||
| Expected Dividend Yield |
0.00% | 0.00% | ||||||
| Expected Term (in years) |
2.53 - 6.85 | 2.79 - 6.51 | ||||||
| (1) | For 2025, the PEOs were Andrew Oxtoby and Vikas Sinha and the Other NEOs were Matthew Feinsod, Matthew Gall and Brett Hagen. For 2024, the PEOs were Vikas Sinha and Diana Brainard, AlloVir’s former Chief Executive Officer, and the Other NEOs were Edward Miller, AlloVir’s General Counsel, and Brett Hagen. Effective as of December 19, 2024, the AlloVir board of directors determined that Dr. Brainard would no longer serve as Chief Executive Officer of AlloVir. On March 18, 2025, in accordance with the terms of the Merger Agreement, effective as of the effective time of the Merger, Mr. Miller resigned as General Counsel and Secretary of AlloVir. |
| (2) | The following table describes the adjustments, each of which is prescribed by SEC rule, to calculate the CAP Amounts from the SCT Amounts. The SCT Amounts and the CAP Amounts do not reflect the actual amount of compensation earned by or paid to our executives during the applicable years, but rather are amounts determined in accordance with Item 402 of Regulation S-K under the Exchange Act. |
| Adjustments |
2025 |
2024 |
||||||||||||||||||||||
Oxtoby, Andrew |
Sinha, Vikas |
Other NEOs* |
Sinha, Vikas |
Brainard, Diana |
Other NEOs* |
|||||||||||||||||||
| Summary Compensation Table (SCT) Total |
$ | 2,569,115 | $ | 1,100,954 | $ | 1,392,517 | $ | 544,400 | $ | 3,028,669 | $ | 721,002 | ||||||||||||
| Subtract: Aggregate value for stock awards and option awards included in SCT Amounts for the covered fiscal year |
$ | 1,687,076 | — | $ | 751,033 | — | — | — | ||||||||||||||||
| Add: Fair value at year end of awards granted during the covered fiscal year that were outstanding and unvested at the covered fiscal year end |
$ | 1,884,171 | — | $ | 1,041,428 | — | — | — | ||||||||||||||||
| Add (Subtract): Year-over-year change in fair value at covered fiscal year end of awards granted in any prior fiscal year that were outstanding and unvested at the covered fiscal year end |
$ | 1,553,813 | — | $ | 38,993 | ($ | 90,091 | ) | — | ($ | 37,901 | ) | ||||||||||||
| Add (Subtract): Change as of the vesting date (from the end of the prior fiscal year) in fair value of awards granted in any prior fiscal year for which vesting conditions were satisfied during the covered fiscal year |
$ | 189,522 | ($ | 3,107 | ) | $ | 3,854 | $ | 1,841 | ($ | 198,328 | ) | $ | 1,250 | ||||||||||
| Compensation Actually Paid (as calculated) |
$ | 4,509,544 | $ | 1,097,848 | $ | 1,725,759 | $ | 456,150 | $ | 2,830,341 | $ | 684,351 | ||||||||||||
| * | Amounts presented are averages for the entire group of Other NEOs in each respective year. |
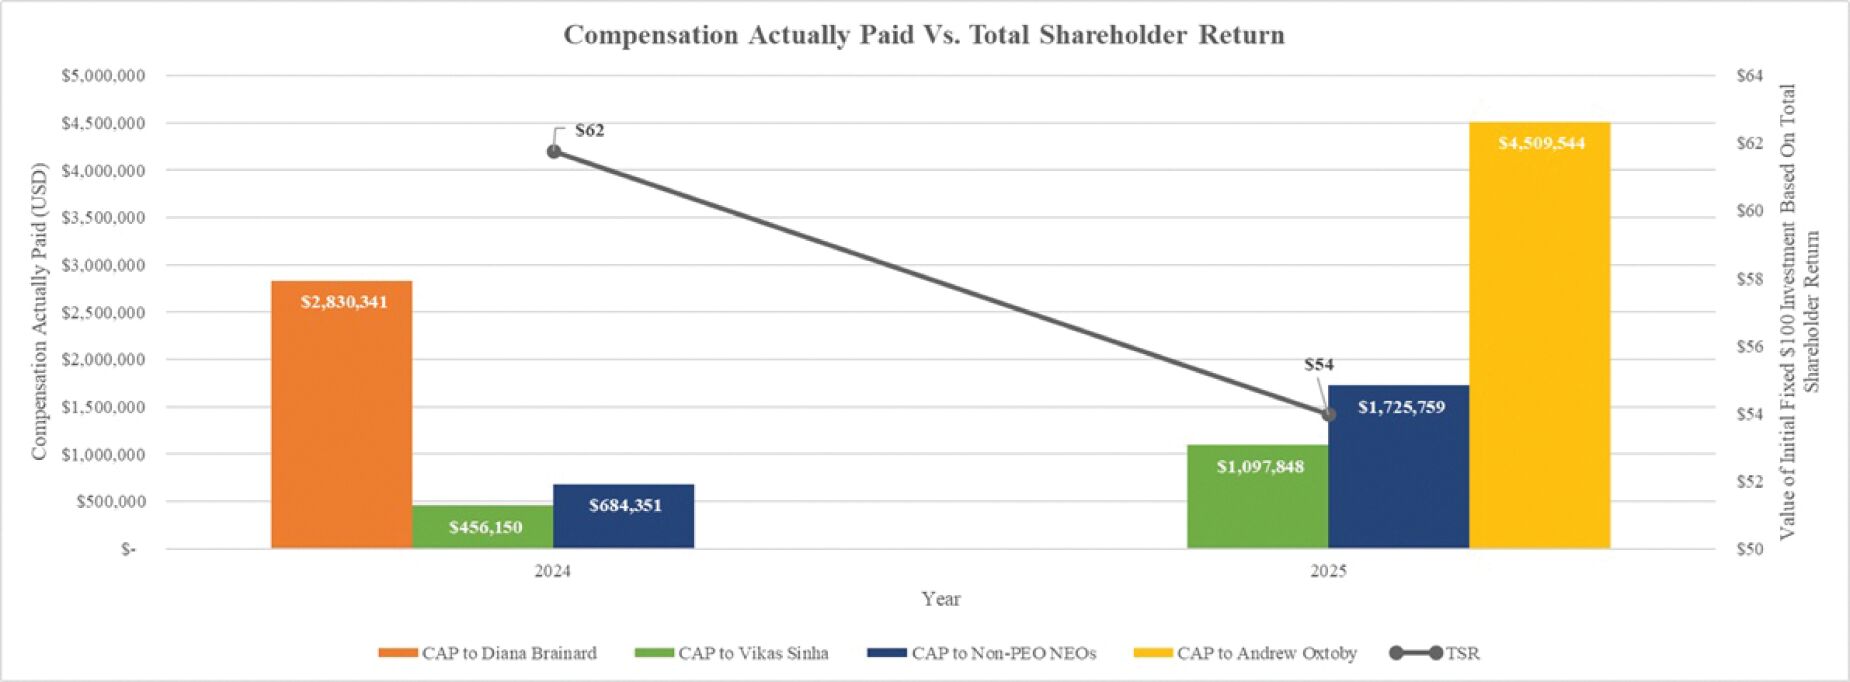
Description of Relationship Between NEO Compensation Actual
ly Pai
d and Company Total Shareholder Return (“TSR”) The following chart sets forth the relationship between the CAP Amounts to our PEO, the average of CAP Amounts to our Other NEOs, and our TSR over the fiscal two year period from 2024 through 2025.
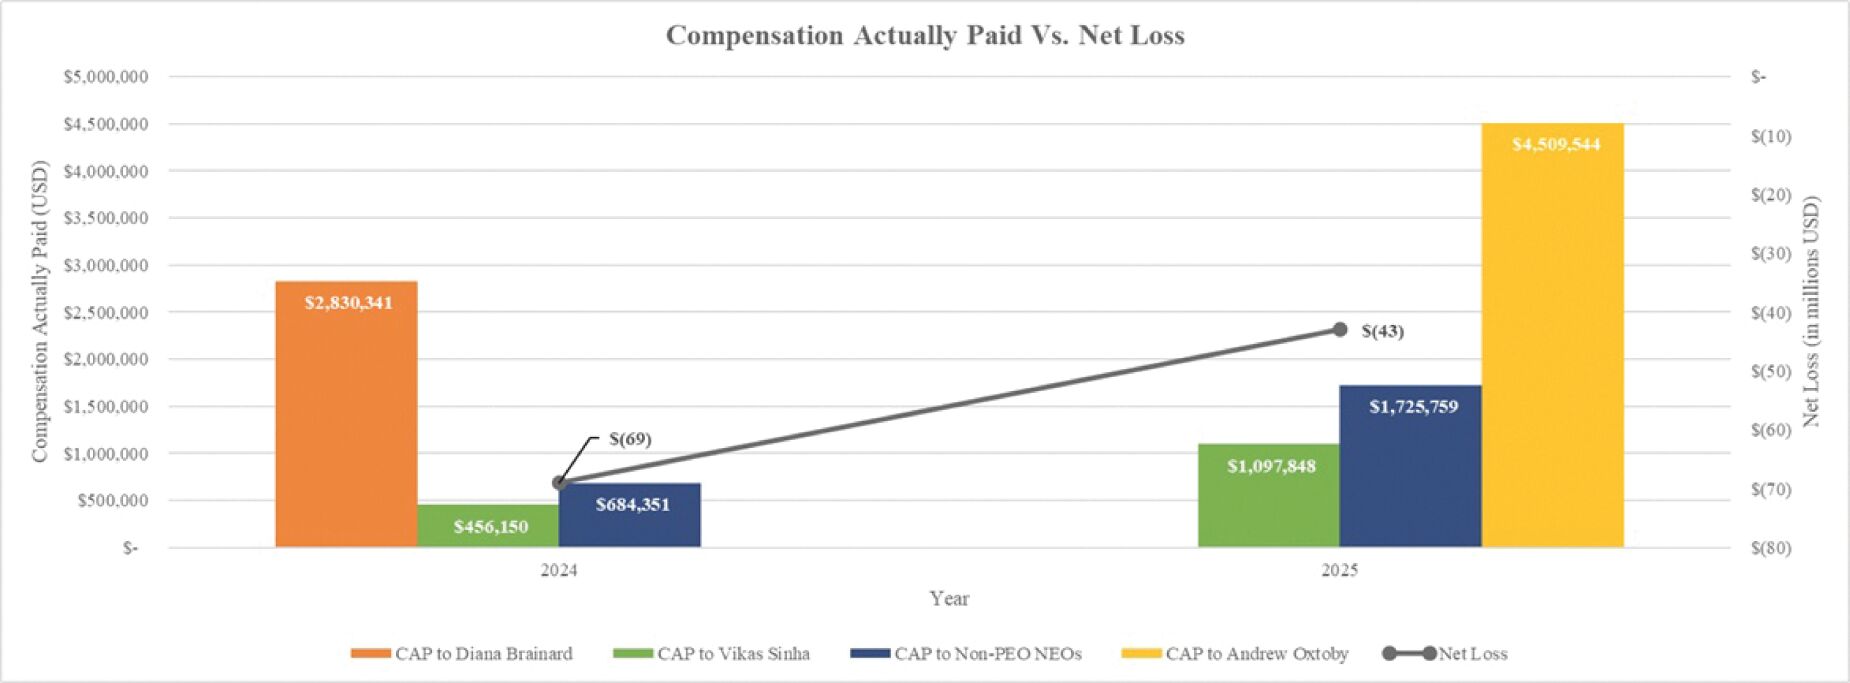
Description of Relationship Between NEO Compensation Actually Paid and Net Income/(Loss)
The following chart sets forth the relationship between CAP Amounts to our PEO, the average of CAP Amounts to our Other NEOs, and our Net Income (Loss) over the fiscal two year period from 2024 through 2025.