Pay vs Performance Disclosure - USD ($)
|
12 Months Ended |
Dec. 31, 2025 |
Dec. 31, 2024 |
Dec. 31, 2023 |
| Pay vs Performance Disclosure |
|
|
|
| Pay vs Performance Disclosure, Table |
| | | | | | | | | | | | | | | | | | | | | | | | | | | | | | | | | | | | | | | | | | | | | | | | | | | | | | | | | | | | Year | SCT Total for Former CEO (Carrington) $ | Compensation
Actually Paid
to Former CEO (Carrington)
$ (1) | SCT Total for Former Interim CEO (Buzby)
$ | Compensation Actually Paid to Former Interim CEO (Buzby)
$ (1) | SCT Total for CEO (Narayanan)
$ | Compensation Actually Paid to CEO (Narayanan) $ (1) | Average SCT Total for Non-CEO NEOs
$ (2) | Average Compensation Actually Paid to Non-CEO NEOs
$ (1)(2) | Value of
Initial
Fixed $100
Investment
Based
On Total
Shareholder
Return
(“TSR”)
| | | | | Net Income (in millions)
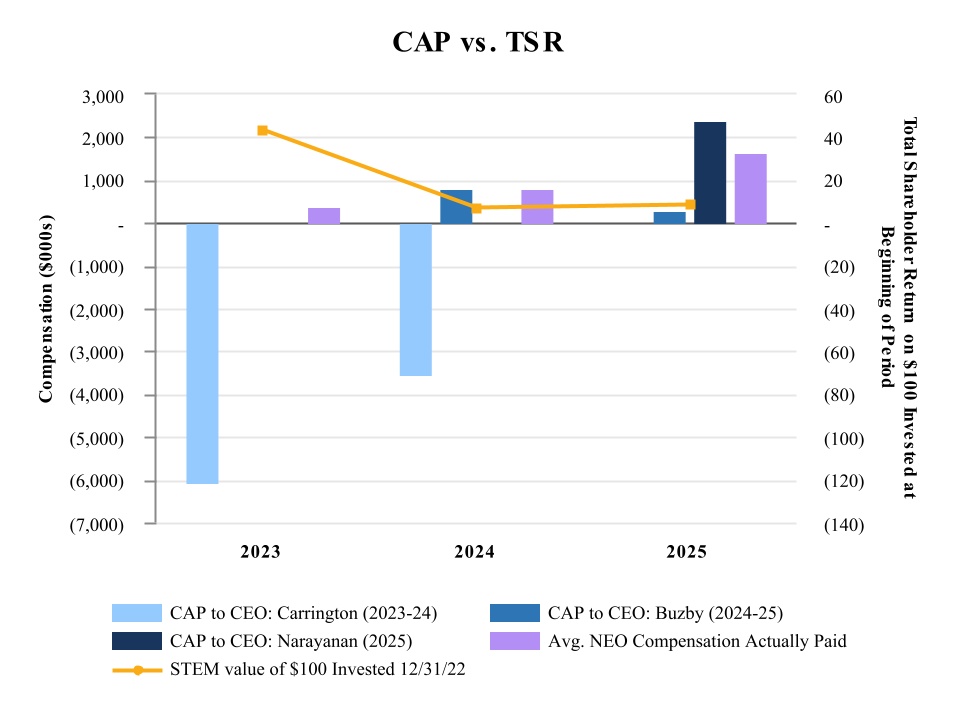
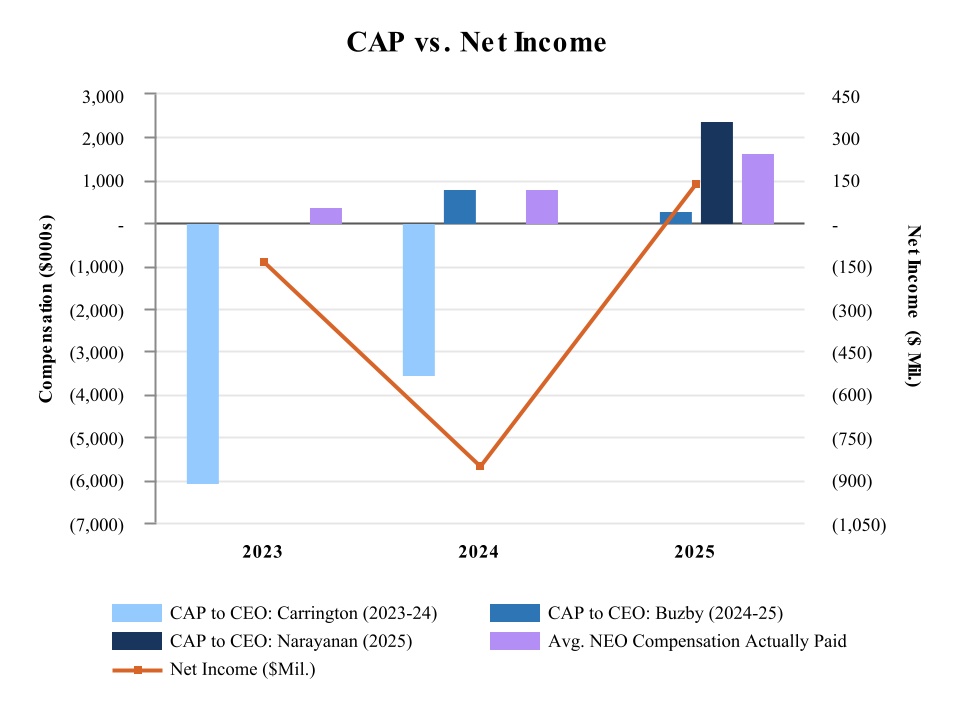
$ | | | | | | 2025 | — | | — | | 264,911 | | 307,553 | | 2,068,248 | | 2,370,091 | | 1,357,836 | | 1,623,284 | | 8.42 | | | | | | 137.8 | | | | | | | 2024 | 2,296,957 | | (3,541,104) | | 1,012,318 | | 824,094 | | — | | — | | 1,138,587 | | 816,569 | | 6.74 | | | | | | (854.0) | | | | | | | 2023 | 3,884,232 | | (6,086,830) | | — | | — | | — | | — | | 3,154,648 | | 380,032 | | 43.40 | | | | | | (140.4) | | | | | |
_______________
|
|
|
| Named Executive Officers, Footnote |
The other NEOs in each covered year were as follows: •2025: Michael Carlson, Saul Laureles • 2024: Doran Hole, Michael Carlson • 2023: William Bush, Saul Laureles, Alan Russo, Prakesh Patel
|
|
|
| Adjustment To PEO Compensation, Footnote |
Deductions from, and additions to, total compensation in the Summary Compensation Table for 2025 to calculate Compensation Actually Paid include: | | | | | | | | | | | | | | | | | | | | | 2025 | | | | | | David Buzby | Arun Narayanan | Average Other NEOs (2) | | | | | | | | | | Total Compensation from Summary Compensation Table | $ | 264,911 | | $ | 2,068,248 | | $ | 1,357,836 | | | | | | | | | | | | | | | | | | | | | | | Adjustments for Equity Awards | | | | | | | | | | | | Adjustment for grant date values in the Summary Compensation Table | $ | (91,822) | | $ | (791,213) | | $ | (555,060) | | | | | | | | | | Year-end fair value of unvested awards granted in the current year | $ | 112,664 | | $ | 1,093,056 | | $ | 725,129 | | | | | | | | | | Year-over-year difference of year-end fair values for unvested awards granted in prior years | $ | — | | $ | — | | $ | 26,106 | | | | | | | | | | Fair values at vest date for awards granted and vested in current year | $ | 37,253 | | $ | — | | $ | — | | | | | | | | | | Difference in fair values between prior year-end fair values and vest date fair values for awards granted in prior years | $ | (15,453) | | $ | — | | $ | 69,274 | | | | | | | | | | Forfeitures during current year equal to prior year-end fair value | $ | — | | $ | — | | $ | — | | | | | | | | | | Dividends or dividend equivalents not otherwise included in total compensation | $ | — | | $ | — | | $ | — | | | | | | | | | | | Total Adjustments for Equity Awards | $ | 42,642 | | $ | 301,843 | | $ | 265,449 | | | | | | | | | | | | | | | | | | | | | | | Compensation Actually Paid (as calculated) | $ | 307,553 | | $ | 2,370,091 | | $ | 1,623,284 | | | | | | | | | | | | | | | | | | | | | |
_______________* All stock option and Performance Stock Unit (PSU) valuations included in “Compensation Actually Paid” values were performed using the Black-Scholes option pricing model and Monte Carlo simulation valuation method, respectively, in a manner consistent with the process used to determine stock option grant date fair values under ASC 718. All stock award valuations (other than for PSUs) included in “Compensation Actually Paid” values were performed using the closing price of the Company’s common stock.
|
|
|
| Non-PEO NEO Average Total Compensation Amount |
$ 1,357,836
|
$ 1,138,587
|
$ 3,154,648
|
| Non-PEO NEO Average Compensation Actually Paid Amount |
$ 1,623,284
|
816,569
|
380,032
|
| Adjustment to Non-PEO NEO Compensation Footnote |
Deductions from, and additions to, total compensation in the Summary Compensation Table for 2025 to calculate Compensation Actually Paid include: | | | | | | | | | | | | | | | | | | | | | 2025 | | | | | | David Buzby | Arun Narayanan | Average Other NEOs (2) | | | | | | | | | | Total Compensation from Summary Compensation Table | $ | 264,911 | | $ | 2,068,248 | | $ | 1,357,836 | | | | | | | | | | | | | | | | | | | | | | | Adjustments for Equity Awards | | | | | | | | | | | | Adjustment for grant date values in the Summary Compensation Table | $ | (91,822) | | $ | (791,213) | | $ | (555,060) | | | | | | | | | | Year-end fair value of unvested awards granted in the current year | $ | 112,664 | | $ | 1,093,056 | | $ | 725,129 | | | | | | | | | | Year-over-year difference of year-end fair values for unvested awards granted in prior years | $ | — | | $ | — | | $ | 26,106 | | | | | | | | | | Fair values at vest date for awards granted and vested in current year | $ | 37,253 | | $ | — | | $ | — | | | | | | | | | | Difference in fair values between prior year-end fair values and vest date fair values for awards granted in prior years | $ | (15,453) | | $ | — | | $ | 69,274 | | | | | | | | | | Forfeitures during current year equal to prior year-end fair value | $ | — | | $ | — | | $ | — | | | | | | | | | | Dividends or dividend equivalents not otherwise included in total compensation | $ | — | | $ | — | | $ | — | | | | | | | | | | | Total Adjustments for Equity Awards | $ | 42,642 | | $ | 301,843 | | $ | 265,449 | | | | | | | | | | | | | | | | | | | | | | | Compensation Actually Paid (as calculated) | $ | 307,553 | | $ | 2,370,091 | | $ | 1,623,284 | | | | | | | | | | | | | | | | | | | | | |
_______________* All stock option and Performance Stock Unit (PSU) valuations included in “Compensation Actually Paid” values were performed using the Black-Scholes option pricing model and Monte Carlo simulation valuation method, respectively, in a manner consistent with the process used to determine stock option grant date fair values under ASC 718. All stock award valuations (other than for PSUs) included in “Compensation Actually Paid” values were performed using the closing price of the Company’s common stock.
|
|
|
| Compensation Actually Paid vs. Total Shareholder Return |
|
|
|
| Compensation Actually Paid vs. Net Income |
|
|
|
| Compensation Actually Paid vs. Company Selected Measure |
|
|
|
| Total Shareholder Return Vs Peer Group |
|
|
|
| Total Shareholder Return Amount |
$ 8.42
|
6.74
|
43.40
|
| Net Income (Loss), Including Portion Attributable to Noncontrolling Interest |
$ 137,800,000
|
$ (854,000,000.0)
|
(140,400,000)
|
| PEO Name |
Arun Narayanan
|
David Buzby
|
|
| John Carrington [Member] |
|
|
|
| Pay vs Performance Disclosure |
|
|
|
| PEO Total Compensation Amount |
$ 0
|
$ 2,296,957
|
3,884,232
|
| PEO Actually Paid Compensation Amount |
0
|
(3,541,104)
|
(6,086,830)
|
| David Buzby [Member] |
|
|
|
| Pay vs Performance Disclosure |
|
|
|
| PEO Total Compensation Amount |
264,911
|
1,012,318
|
0
|
| PEO Actually Paid Compensation Amount |
307,553
|
824,094
|
0
|
| Arun Narayanan [Member] |
|
|
|
| Pay vs Performance Disclosure |
|
|
|
| PEO Total Compensation Amount |
2,068,248
|
0
|
0
|
| PEO Actually Paid Compensation Amount |
2,370,091
|
$ 0
|
$ 0
|
| PEO | David Buzby [Member] |
|
|
|
| Pay vs Performance Disclosure |
|
|
|
| Adjustment to Compensation, Amount |
42,642
|
|
|
| PEO | David Buzby [Member] | Aggregate Grant Date Fair Value of Equity Award Amounts Reported in Summary Compensation Table |
|
|
|
| Pay vs Performance Disclosure |
|
|
|
| Adjustment to Compensation, Amount |
(91,822)
|
|
|
| PEO | David Buzby [Member] | Year-end Fair Value of Equity Awards Granted in Covered Year that are Outstanding and Unvested |
|
|
|
| Pay vs Performance Disclosure |
|
|
|
| Adjustment to Compensation, Amount |
112,664
|
|
|
| PEO | David Buzby [Member] | Year-over-Year Change in Fair Value of Equity Awards Granted in Prior Years That are Outstanding and Unvested |
|
|
|
| Pay vs Performance Disclosure |
|
|
|
| Adjustment to Compensation, Amount |
0
|
|
|
| PEO | David Buzby [Member] | Vesting Date Fair Value of Equity Awards Granted and Vested in Covered Year |
|
|
|
| Pay vs Performance Disclosure |
|
|
|
| Adjustment to Compensation, Amount |
37,253
|
|
|
| PEO | David Buzby [Member] | Change in Fair Value as of Vesting Date of Prior Year Equity Awards Vested in Covered Year |
|
|
|
| Pay vs Performance Disclosure |
|
|
|
| Adjustment to Compensation, Amount |
(15,453)
|
|
|
| PEO | David Buzby [Member] | Prior Year End Fair Value of Equity Awards Granted in Any Prior Year that Fail to Meet Applicable Vesting Conditions During Covered Year |
|
|
|
| Pay vs Performance Disclosure |
|
|
|
| Adjustment to Compensation, Amount |
0
|
|
|
| PEO | David Buzby [Member] | Dividends or Other Earnings Paid on Equity Awards not Otherwise Reflected in Total Compensation for Covered Year |
|
|
|
| Pay vs Performance Disclosure |
|
|
|
| Adjustment to Compensation, Amount |
0
|
|
|
| PEO | Arun Narayanan [Member] |
|
|
|
| Pay vs Performance Disclosure |
|
|
|
| Adjustment to Compensation, Amount |
301,843
|
|
|
| PEO | Arun Narayanan [Member] | Aggregate Grant Date Fair Value of Equity Award Amounts Reported in Summary Compensation Table |
|
|
|
| Pay vs Performance Disclosure |
|
|
|
| Adjustment to Compensation, Amount |
(791,213)
|
|
|
| PEO | Arun Narayanan [Member] | Year-end Fair Value of Equity Awards Granted in Covered Year that are Outstanding and Unvested |
|
|
|
| Pay vs Performance Disclosure |
|
|
|
| Adjustment to Compensation, Amount |
1,093,056
|
|
|
| PEO | Arun Narayanan [Member] | Year-over-Year Change in Fair Value of Equity Awards Granted in Prior Years That are Outstanding and Unvested |
|
|
|
| Pay vs Performance Disclosure |
|
|
|
| Adjustment to Compensation, Amount |
0
|
|
|
| PEO | Arun Narayanan [Member] | Vesting Date Fair Value of Equity Awards Granted and Vested in Covered Year |
|
|
|
| Pay vs Performance Disclosure |
|
|
|
| Adjustment to Compensation, Amount |
0
|
|
|
| PEO | Arun Narayanan [Member] | Change in Fair Value as of Vesting Date of Prior Year Equity Awards Vested in Covered Year |
|
|
|
| Pay vs Performance Disclosure |
|
|
|
| Adjustment to Compensation, Amount |
0
|
|
|
| PEO | Arun Narayanan [Member] | Prior Year End Fair Value of Equity Awards Granted in Any Prior Year that Fail to Meet Applicable Vesting Conditions During Covered Year |
|
|
|
| Pay vs Performance Disclosure |
|
|
|
| Adjustment to Compensation, Amount |
0
|
|
|
| PEO | Arun Narayanan [Member] | Dividends or Other Earnings Paid on Equity Awards not Otherwise Reflected in Total Compensation for Covered Year |
|
|
|
| Pay vs Performance Disclosure |
|
|
|
| Adjustment to Compensation, Amount |
0
|
|
|
| Non-PEO NEO |
|
|
|
| Pay vs Performance Disclosure |
|
|
|
| Adjustment to Compensation, Amount |
265,449
|
|
|
| Non-PEO NEO | Aggregate Grant Date Fair Value of Equity Award Amounts Reported in Summary Compensation Table |
|
|
|
| Pay vs Performance Disclosure |
|
|
|
| Adjustment to Compensation, Amount |
(555,060)
|
|
|
| Non-PEO NEO | Year-end Fair Value of Equity Awards Granted in Covered Year that are Outstanding and Unvested |
|
|
|
| Pay vs Performance Disclosure |
|
|
|
| Adjustment to Compensation, Amount |
725,129
|
|
|
| Non-PEO NEO | Year-over-Year Change in Fair Value of Equity Awards Granted in Prior Years That are Outstanding and Unvested |
|
|
|
| Pay vs Performance Disclosure |
|
|
|
| Adjustment to Compensation, Amount |
26,106
|
|
|
| Non-PEO NEO | Vesting Date Fair Value of Equity Awards Granted and Vested in Covered Year |
|
|
|
| Pay vs Performance Disclosure |
|
|
|
| Adjustment to Compensation, Amount |
0
|
|
|
| Non-PEO NEO | Change in Fair Value as of Vesting Date of Prior Year Equity Awards Vested in Covered Year |
|
|
|
| Pay vs Performance Disclosure |
|
|
|
| Adjustment to Compensation, Amount |
69,274
|
|
|
| Non-PEO NEO | Prior Year End Fair Value of Equity Awards Granted in Any Prior Year that Fail to Meet Applicable Vesting Conditions During Covered Year |
|
|
|
| Pay vs Performance Disclosure |
|
|
|
| Adjustment to Compensation, Amount |
0
|
|
|
| Non-PEO NEO | Dividends or Other Earnings Paid on Equity Awards not Otherwise Reflected in Total Compensation for Covered Year |
|
|
|
| Pay vs Performance Disclosure |
|
|
|
| Adjustment to Compensation, Amount |
$ 0
|
|
|