Pay vs Performance Disclosure - USD ($)
|
12 Months Ended |
Dec. 31, 2025 |
Dec. 31, 2024 |
Dec. 31, 2023 |
Dec. 31, 2022 |
Dec. 31, 2021 |
| Pay vs Performance Disclosure |
|
|
|
|
|
| Pay vs Performance Disclosure, Table |
| | | | | | | | | | | | | | | | | | | | | | | | | | | | | | | Year | Summary Compensation Table Total for PEO1
($) | Compensation Actually Paid to PEO1,2,3
($) | Average Summary Compensation Table Total for Non-PEO NEOs1
($) | Average Compensation Actually Paid to Non-PEO NEOs1,2,3
($) | Value of Initial Fixed $100 Investment based on:4 | Net Income
($ Millions) | Stock Price⁵ | | TSR
($) | Peer Group TSR
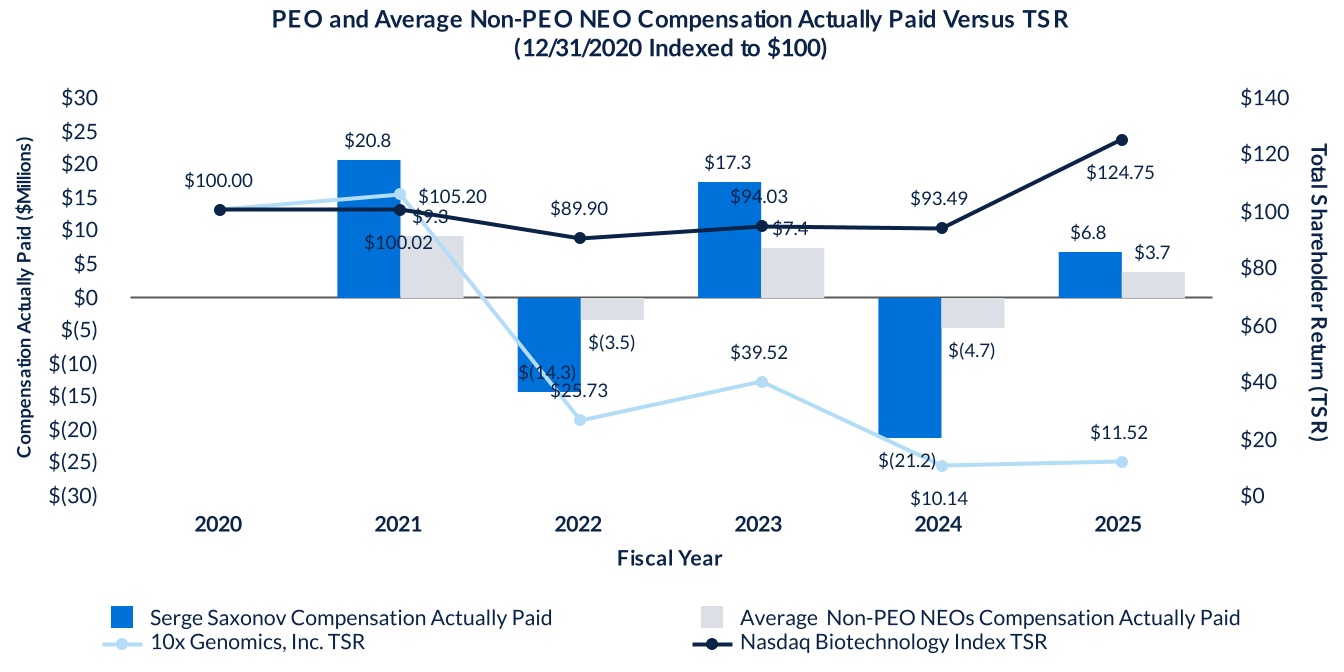
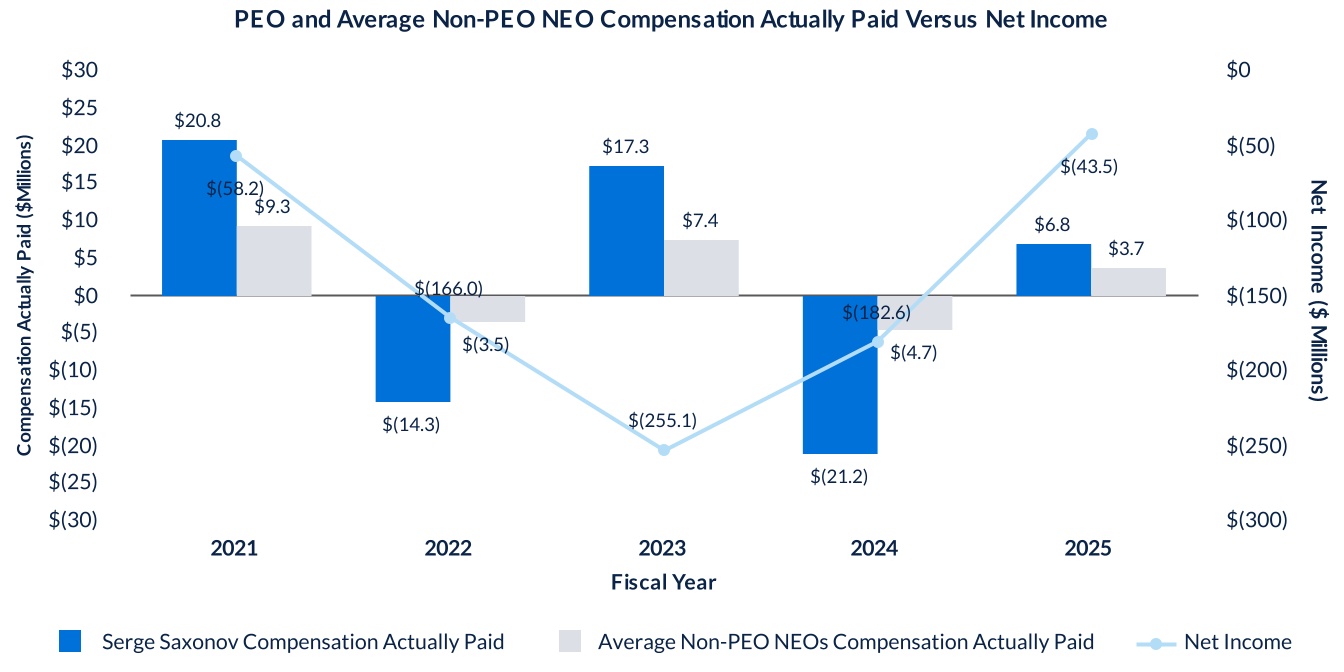
($) | | | | | | | | | | | | | 2025 | 6,329,244 | | 6,788,069 | | 2,759,812 | | 3,670,771 | | 11.52 | | 124.75 | | (43.5) | | 16.31 | | | | 2024 | 7,929,349 | | (21,169,246) | | 4,399,950 | | (4,682,313) | | 10.14 | | 93.49 | | (182.6) | | 14.36 | | | | 2023 | 8,286,049 | | 17,348,412 | | 3,397,530 | | 7,387,885 | | 39.52 | | 94.03 | | (255.1) | | 55.96 | | | | 2022 | 18,805,294 | | (14,310,774) | | 9,376,988 | | (3,497,039) | | 25.73 | | 89.90 | | (166.0) | | 36.44 | | | | 2021 | 11,700,985 | | 20,812,842 | | 4,979,234 | | 9,325,452 | | 105.20 | | 100.02 | | (58.2) | | 148.96 | | |
|
|
|
|
|
| Company Selected Measure Name |
stock price
|
|
|
|
|
| Named Executive Officers, Footnote |
Serge Saxonov was our PEO for each year presented. The individuals comprising the Non-PEO NEOs for each year presented are listed below. | | | | | | | | | | | | | | | | 2021 | 2022 | 2023 | 2024 | 2025 | | Justin J. McAnear | Justin J. McAnear | Justin J. McAnear | Adam S. Taich | Adam S. Taich | | Benjamin J. Hindson | Benjamin J. Hindson | Benjamin J. Hindson | Benjamin J. Hindson | Benjamin J. Hindson | | Eric S. Whitaker | Eric S. Whitaker | Eric S. Whitaker | Eric S. Whitaker | Eric S. Whitaker | | Bradford J. Crutchfield | James Wilbur | James Wilbur | Justin J. McAnear | |
|
|
|
|
|
| Peer Group Issuers, Footnote |
The Peer Group TSR set forth in this table utilizes the Nasdaq Biotechnology Composite Index, which we also utilize in the stock performance graph required by Item 201(e) of Regulation S-K included in our Annual Report for the year ended December 31, 2025. The comparison assumes $100 was invested for the period starting December 31, 2020, through the end of the listed year in the Company and in the Nasdaq Biotechnology Composite Index, respectively. Historical stock performance is not necessarily indicative of future stock performance.
|
|
|
|
|
| PEO Total Compensation Amount |
$ 6,329,244
|
$ 7,929,349
|
$ 8,286,049
|
$ 18,805,294
|
$ 11,700,985
|
| PEO Actually Paid Compensation Amount |
$ 6,788,069
|
(21,169,246)
|
17,348,412
|
(14,310,774)
|
20,812,842
|
| Adjustment To PEO Compensation, Footnote |
Compensation Actually Paid reflects the exclusions and inclusions of certain amounts for the PEO and the Non-PEO NEOs as set forth below. Equity values are calculated in accordance with FASB ASC Topic 718. Amounts in the Exclusion of Stock Awards and Option Awards column are the totals from the Stock Awards and Option Awards columns set forth in the Summary Compensation Table. | | | | | | | | | | | | | | | | | | | Year | Summary Compensation Table Total for Serge Saxonov
($) | Exclusion of Stock Awards and Option Awards for Serge Saxonov
($) | Inclusion of Equity Values for Serge Saxonov
($) | Compensation Actually Paid to Serge Saxonov
($) | | | | | | | | | 2025 | 6,329,244 | | (5,020,269) | | 5,479,094 | | 6,788,069 | | |
| | | | | | | | | | | | | | | | | | | Year | Average Summary Compensation Table Total for Non-PEO NEOs
($) | Average Exclusion of Stock Awards and Option Awards for Non-PEO NEOs
($) | Average Inclusion of Equity Values for Non-PEO NEOs
($) | Average Compensation Actually Paid to Non-PEO NEOs
($) | | | | | | | | | 2025 | 2,759,812 | | (1,954,729) | | 2,865,688 | | 3,670,771 | | |
The amounts in the Inclusion of Equity Values in the tables above are derived from the amounts set forth in the following tables: | | | | | | | | | | | | | | | | | | | | | | | | | | | | Year | Year-End Fair Value of Equity Awards Granted During Year That Remained Unvested as of Last Day of Year for Serge Saxonov
($) | Change in Fair Value from Last Day of Prior Year to Last Day of Year of Unvested Equity Awards for Serge Saxonov
($) | Vesting-Date Fair Value of Equity Awards Granted During Year that Vested During Year for Serge Saxonov
($) | Change in Fair Value from Last Day of Prior Year to Vesting Date of Unvested Equity Awards that Vested During Year for Serge Saxonov
($) | Fair Value at Last Day of Prior Year of Equity Awards Forfeited During Year for Serge Saxonov
($) | Value of Dividends or Other Earnings Paid on Equity Awards Not Otherwise Included for Serge Saxonov
($) | Total - Inclusion of Equity Values for Serge Saxonov
($) | | | | | | | | | | | | 2025 | 5,290,273 | | (212,419) | | 568,003 | | (166,763) | | — | | — | | 5,479,094 | | |
| | | | | | | | | | | | | | | | | | | | | | | | | | | | Year | Average Year-End Fair Value of Equity Awards Granted During Year That Remained Unvested as of Last Day of Year for Non-PEO NEOs
($) | Average Change in Fair Value from Last Day of Prior Year to Last Day of Year of Unvested Equity Awards for Non-PEO NEOs
($) | Average Vesting-Date Fair Value of Equity Awards Granted During Year that Vested During Year for Non-PEO NEOs
($) | Average Change in Fair Value from Last Day of Prior Year to Vesting Date of Unvested Equity Awards that Vested During Year for Non-PEO NEOs
($) | Average Fair Value at Last Day of Prior Year of Equity Awards Forfeited During Year for Non-PEO NEOs
($) | Average Value of Dividends or Other Earnings Paid on Equity Awards Not Otherwise Included for Non-PEO NEOs
($) | Total - Average Inclusion of
Equity Values for Non-PEO NEOs
($) | | | | | | | | | | | | 2025 | 2,353,457 | | 147,538 | | 476,288 | | (111,595) | | — | | — | | 2,865,688 | | |
|
|
|
|
|
| Non-PEO NEO Average Total Compensation Amount |
$ 2,759,812
|
4,399,950
|
3,397,530
|
9,376,988
|
4,979,234
|
| Non-PEO NEO Average Compensation Actually Paid Amount |
$ 3,670,771
|
(4,682,313)
|
7,387,885
|
(3,497,039)
|
9,325,452
|
| Adjustment to Non-PEO NEO Compensation Footnote |
Compensation Actually Paid reflects the exclusions and inclusions of certain amounts for the PEO and the Non-PEO NEOs as set forth below. Equity values are calculated in accordance with FASB ASC Topic 718. Amounts in the Exclusion of Stock Awards and Option Awards column are the totals from the Stock Awards and Option Awards columns set forth in the Summary Compensation Table. | | | | | | | | | | | | | | | | | | | Year | Summary Compensation Table Total for Serge Saxonov
($) | Exclusion of Stock Awards and Option Awards for Serge Saxonov
($) | Inclusion of Equity Values for Serge Saxonov
($) | Compensation Actually Paid to Serge Saxonov
($) | | | | | | | | | 2025 | 6,329,244 | | (5,020,269) | | 5,479,094 | | 6,788,069 | | |
| | | | | | | | | | | | | | | | | | | Year | Average Summary Compensation Table Total for Non-PEO NEOs
($) | Average Exclusion of Stock Awards and Option Awards for Non-PEO NEOs
($) | Average Inclusion of Equity Values for Non-PEO NEOs
($) | Average Compensation Actually Paid to Non-PEO NEOs
($) | | | | | | | | | 2025 | 2,759,812 | | (1,954,729) | | 2,865,688 | | 3,670,771 | | |
The amounts in the Inclusion of Equity Values in the tables above are derived from the amounts set forth in the following tables: | | | | | | | | | | | | | | | | | | | | | | | | | | | | Year | Year-End Fair Value of Equity Awards Granted During Year That Remained Unvested as of Last Day of Year for Serge Saxonov
($) | Change in Fair Value from Last Day of Prior Year to Last Day of Year of Unvested Equity Awards for Serge Saxonov
($) | Vesting-Date Fair Value of Equity Awards Granted During Year that Vested During Year for Serge Saxonov
($) | Change in Fair Value from Last Day of Prior Year to Vesting Date of Unvested Equity Awards that Vested During Year for Serge Saxonov
($) | Fair Value at Last Day of Prior Year of Equity Awards Forfeited During Year for Serge Saxonov
($) | Value of Dividends or Other Earnings Paid on Equity Awards Not Otherwise Included for Serge Saxonov
($) | Total - Inclusion of Equity Values for Serge Saxonov
($) | | | | | | | | | | | | 2025 | 5,290,273 | | (212,419) | | 568,003 | | (166,763) | | — | | — | | 5,479,094 | | |
| | | | | | | | | | | | | | | | | | | | | | | | | | | | Year | Average Year-End Fair Value of Equity Awards Granted During Year That Remained Unvested as of Last Day of Year for Non-PEO NEOs
($) | Average Change in Fair Value from Last Day of Prior Year to Last Day of Year of Unvested Equity Awards for Non-PEO NEOs
($) | Average Vesting-Date Fair Value of Equity Awards Granted During Year that Vested During Year for Non-PEO NEOs
($) | Average Change in Fair Value from Last Day of Prior Year to Vesting Date of Unvested Equity Awards that Vested During Year for Non-PEO NEOs
($) | Average Fair Value at Last Day of Prior Year of Equity Awards Forfeited During Year for Non-PEO NEOs
($) | Average Value of Dividends or Other Earnings Paid on Equity Awards Not Otherwise Included for Non-PEO NEOs
($) | Total - Average Inclusion of
Equity Values for Non-PEO NEOs
($) | | | | | | | | | | | | 2025 | 2,353,457 | | 147,538 | | 476,288 | | (111,595) | | — | | — | | 2,865,688 | | |
|
|
|
|
|
| Compensation Actually Paid vs. Total Shareholder Return |
|
|
|
|
|
| Compensation Actually Paid vs. Net Income |
|
|
|
|
|
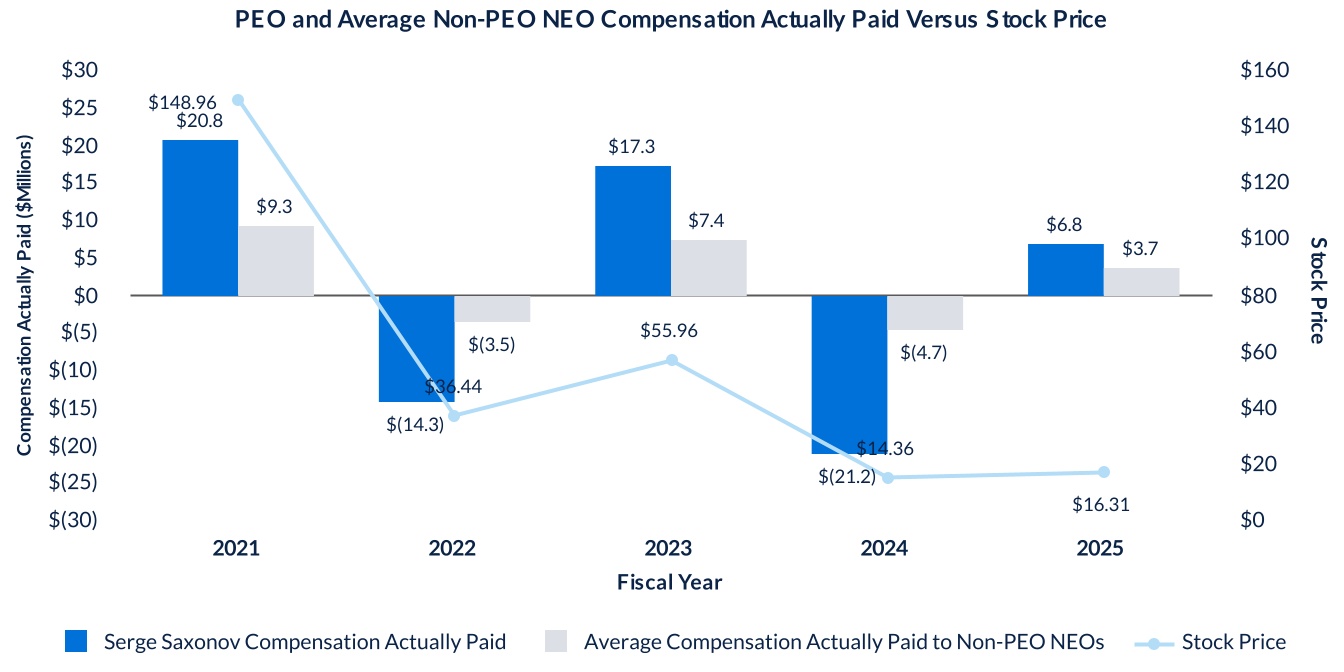
| Compensation Actually Paid vs. Company Selected Measure |
|
|
|
|
|
| Total Shareholder Return Vs Peer Group |
|
|
|
|
|
| Tabular List, Table |
| | | Stock Price | | Relative TSR | Revenue |
|
|
|
|
|
| Total Shareholder Return Amount |
$ 11.52
|
10.14
|
39.52
|
25.73
|
105.20
|
| Peer Group Total Shareholder Return Amount |
124.75
|
93.49
|
94.03
|
89.90
|
100.02
|
| Net Income (Loss) |
$ (43,500,000)
|
$ (182,600,000)
|
$ (255,100,000)
|
$ (166,000,000.0)
|
$ (58,200,000)
|
| Company Selected Measure Amount |
16.31
|
14.36
|
55.96
|
36.44
|
148.96
|
| PEO Name |
Serge Saxonov
|
|
|
|
|
| Additional 402(v) Disclosure |
The amounts shown for Compensation Actually Paid have been calculated in accordance with Item 402(v) of Regulation S-K and do not reflect compensation actually earned, realized or received by the Company’s Non-PEO NEOs. These amounts reflect the Summary Compensation Table Total with certain adjustments as described in footnote 3 below.We determined stock price to be the most important financial performance measure used to link Company performance to Compensation Actually Paid to our PEO and Non-PEO NEOs in 2025. The amounts in the column represent the closing price on the last trading day of the listed year.
|
|
|
|
|
| Measure:: 1 |
|
|
|
|
|
| Pay vs Performance Disclosure |
|
|
|
|
|
| Name |
Stock Price
|
|
|
|
|
| Measure:: 2 |
|
|
|
|
|
| Pay vs Performance Disclosure |
|
|
|
|
|
| Name |
Relative TSR
|
|
|
|
|
| Measure:: 3 |
|
|
|
|
|
| Pay vs Performance Disclosure |
|
|
|
|
|
| Name |
Revenue
|
|
|
|
|
| PEO | Aggregate Grant Date Fair Value of Equity Award Amounts Reported in Summary Compensation Table |
|
|
|
|
|
| Pay vs Performance Disclosure |
|
|
|
|
|
| Adjustment to Compensation, Amount |
$ (5,020,269)
|
|
|
|
|
| PEO | Equity Awards Adjustments, Excluding Value Reported in Compensation Table |
|
|
|
|
|
| Pay vs Performance Disclosure |
|
|
|
|
|
| Adjustment to Compensation, Amount |
5,479,094
|
|
|
|
|
| PEO | Year-end Fair Value of Equity Awards Granted in Covered Year that are Outstanding and Unvested |
|
|
|
|
|
| Pay vs Performance Disclosure |
|
|
|
|
|
| Adjustment to Compensation, Amount |
5,290,273
|
|
|
|
|
| PEO | Year-over-Year Change in Fair Value of Equity Awards Granted in Prior Years That are Outstanding and Unvested |
|
|
|
|
|
| Pay vs Performance Disclosure |
|
|
|
|
|
| Adjustment to Compensation, Amount |
(212,419)
|
|
|
|
|
| PEO | Vesting Date Fair Value of Equity Awards Granted and Vested in Covered Year |
|
|
|
|
|
| Pay vs Performance Disclosure |
|
|
|
|
|
| Adjustment to Compensation, Amount |
568,003
|
|
|
|
|
| PEO | Change in Fair Value as of Vesting Date of Prior Year Equity Awards Vested in Covered Year |
|
|
|
|
|
| Pay vs Performance Disclosure |
|
|
|
|
|
| Adjustment to Compensation, Amount |
(166,763)
|
|
|
|
|
| PEO | Prior Year End Fair Value of Equity Awards Granted in Any Prior Year that Fail to Meet Applicable Vesting Conditions During Covered Year |
|
|
|
|
|
| Pay vs Performance Disclosure |
|
|
|
|
|
| Adjustment to Compensation, Amount |
0
|
|
|
|
|
| PEO | Dividends or Other Earnings Paid on Equity Awards not Otherwise Reflected in Total Compensation for Covered Year |
|
|
|
|
|
| Pay vs Performance Disclosure |
|
|
|
|
|
| Adjustment to Compensation, Amount |
0
|
|
|
|
|
| Non-PEO NEO | Aggregate Grant Date Fair Value of Equity Award Amounts Reported in Summary Compensation Table |
|
|
|
|
|
| Pay vs Performance Disclosure |
|
|
|
|
|
| Adjustment to Compensation, Amount |
(1,954,729)
|
|
|
|
|
| Non-PEO NEO | Equity Awards Adjustments, Excluding Value Reported in Compensation Table |
|
|
|
|
|
| Pay vs Performance Disclosure |
|
|
|
|
|
| Adjustment to Compensation, Amount |
2,865,688
|
|
|
|
|
| Non-PEO NEO | Year-end Fair Value of Equity Awards Granted in Covered Year that are Outstanding and Unvested |
|
|
|
|
|
| Pay vs Performance Disclosure |
|
|
|
|
|
| Adjustment to Compensation, Amount |
2,353,457
|
|
|
|
|
| Non-PEO NEO | Year-over-Year Change in Fair Value of Equity Awards Granted in Prior Years That are Outstanding and Unvested |
|
|
|
|
|
| Pay vs Performance Disclosure |
|
|
|
|
|
| Adjustment to Compensation, Amount |
147,538
|
|
|
|
|
| Non-PEO NEO | Vesting Date Fair Value of Equity Awards Granted and Vested in Covered Year |
|
|
|
|
|
| Pay vs Performance Disclosure |
|
|
|
|
|
| Adjustment to Compensation, Amount |
476,288
|
|
|
|
|
| Non-PEO NEO | Change in Fair Value as of Vesting Date of Prior Year Equity Awards Vested in Covered Year |
|
|
|
|
|
| Pay vs Performance Disclosure |
|
|
|
|
|
| Adjustment to Compensation, Amount |
(111,595)
|
|
|
|
|
| Non-PEO NEO | Prior Year End Fair Value of Equity Awards Granted in Any Prior Year that Fail to Meet Applicable Vesting Conditions During Covered Year |
|
|
|
|
|
| Pay vs Performance Disclosure |
|
|
|
|
|
| Adjustment to Compensation, Amount |
0
|
|
|
|
|
| Non-PEO NEO | Dividends or Other Earnings Paid on Equity Awards not Otherwise Reflected in Total Compensation for Covered Year |
|
|
|
|
|
| Pay vs Performance Disclosure |
|
|
|
|
|
| Adjustment to Compensation, Amount |
$ 0
|
|
|
|
|