false2025FY0001786909P20YP1MP1MP3DP3DP3DP3DP3DP3YP3YP3YP3YP1YP2YP3DP30DP200DP5YP3YP1YP1YP1YP1MP5Dxbrli:sharesiso4217:ZARiso4217:ZARxbrli:sharessbsw:continentsbsw:regionsbsw:shaftComplexsbsw:shaftsbsw:plantsbsw:reefxbrli:puresbsw:concentratorsbsw:facilitysbsw:agreementiso4217:ZARiso4217:USDiso4217:ZARiso4217:EURiso4217:ZARiso4217:AUDsbsw:tranchesbsw:performanceCriteriasbsw:peerGroupCompanyiso4217:USDxbrli:sharesiso4217:ZARutr:ozutr:oziso4217:AUDutr:tutr:tiso4217:AUDiso4217:USDutr:oziso4217:USDutr:tiso4217:ZARutr:kgiso4217:USDutr:lbiso4217:USDiso4217:AUDxbrli:sharesiso4217:EURiso4217:EURxbrli:sharessbsw:extension_optionsbsw:componentutr:kgiso4217:ZARiso4217:GBP00017869092025-01-012025-12-310001786909dei:BusinessContactMember2025-01-012025-12-310001786909sbsw:AmericanDepositarySharesMember2025-01-012025-12-3100017869092025-12-3100017869092024-01-012024-12-3100017869092023-01-012023-12-3100017869092024-12-3100017869092023-12-3100017869092022-12-310001786909ifrs-full:IssuedCapitalMember2022-12-310001786909sbsw:ReorganisationReserveMember2022-12-310001786909ifrs-full:ReserveOfSharebasedPaymentsMember2022-12-310001786909sbsw:ReserveOfMarkToMarketMember2022-12-310001786909ifrs-full:ReserveOfExchangeDifferencesOnTranslationMember2022-12-310001786909ifrs-full:RetainedEarningsMember2022-12-310001786909ifrs-full:EquityAttributableToOwnersOfParentMember2022-12-310001786909ifrs-full:NoncontrollingInterestsMember2022-12-310001786909sbsw:ReserveOfMarkToMarketMember2023-01-012023-12-310001786909ifrs-full:ReserveOfExchangeDifferencesOnTranslationMember2023-01-012023-12-310001786909ifrs-full:RetainedEarningsMember2023-01-012023-12-310001786909ifrs-full:EquityAttributableToOwnersOfParentMember2023-01-012023-12-310001786909ifrs-full:NoncontrollingInterestsMember2023-01-012023-12-310001786909ifrs-full:ReserveOfSharebasedPaymentsMember2023-01-012023-12-310001786909ifrs-full:ReserveOfExchangeDifferencesOnTranslationMembersbsw:KeliberOyMember2023-01-012023-12-310001786909ifrs-full:RetainedEarningsMembersbsw:KeliberOyMember2023-01-012023-12-310001786909ifrs-full:EquityAttributableToOwnersOfParentMembersbsw:KeliberOyMember2023-01-012023-12-310001786909ifrs-full:NoncontrollingInterestsMembersbsw:KeliberOyMember2023-01-012023-12-310001786909sbsw:KeliberOyMember2023-01-012023-12-310001786909ifrs-full:ReserveOfExchangeDifferencesOnTranslationMembersbsw:NewCenturyResourcesLimitedMember2023-01-012023-12-310001786909ifrs-full:RetainedEarningsMembersbsw:NewCenturyResourcesLimitedMember2023-01-012023-12-310001786909ifrs-full:EquityAttributableToOwnersOfParentMembersbsw:NewCenturyResourcesLimitedMember2023-01-012023-12-310001786909ifrs-full:NoncontrollingInterestsMembersbsw:NewCenturyResourcesLimitedMember2023-01-012023-12-310001786909sbsw:NewCenturyResourcesLimitedMember2023-01-012023-12-310001786909ifrs-full:IssuedCapitalMember2023-12-310001786909sbsw:ReorganisationReserveMember2023-12-310001786909ifrs-full:ReserveOfSharebasedPaymentsMember2023-12-310001786909sbsw:ReserveOfMarkToMarketMember2023-12-310001786909ifrs-full:ReserveOfExchangeDifferencesOnTranslationMember2023-12-310001786909ifrs-full:RetainedEarningsMember2023-12-310001786909ifrs-full:EquityAttributableToOwnersOfParentMember2023-12-310001786909ifrs-full:NoncontrollingInterestsMember2023-12-310001786909sbsw:ReserveOfMarkToMarketMember2024-01-012024-12-310001786909ifrs-full:ReserveOfExchangeDifferencesOnTranslationMember2024-01-012024-12-310001786909ifrs-full:RetainedEarningsMember2024-01-012024-12-310001786909ifrs-full:EquityAttributableToOwnersOfParentMember2024-01-012024-12-310001786909ifrs-full:NoncontrollingInterestsMember2024-01-012024-12-310001786909ifrs-full:ReserveOfSharebasedPaymentsMember2024-01-012024-12-310001786909ifrs-full:IssuedCapitalMember2024-12-310001786909sbsw:ReorganisationReserveMember2024-12-310001786909ifrs-full:ReserveOfSharebasedPaymentsMember2024-12-310001786909sbsw:ReserveOfMarkToMarketMember2024-12-310001786909ifrs-full:ReserveOfExchangeDifferencesOnTranslationMember2024-12-310001786909ifrs-full:RetainedEarningsMember2024-12-310001786909ifrs-full:EquityAttributableToOwnersOfParentMember2024-12-310001786909ifrs-full:NoncontrollingInterestsMember2024-12-310001786909sbsw:ReserveOfMarkToMarketMember2025-01-012025-12-310001786909ifrs-full:ReserveOfExchangeDifferencesOnTranslationMember2025-01-012025-12-310001786909ifrs-full:RetainedEarningsMember2025-01-012025-12-310001786909ifrs-full:EquityAttributableToOwnersOfParentMember2025-01-012025-12-310001786909ifrs-full:NoncontrollingInterestsMember2025-01-012025-12-310001786909ifrs-full:ReserveOfSharebasedPaymentsMember2025-01-012025-12-310001786909ifrs-full:RetainedEarningsMembersbsw:DrdgoldLimitedMember2025-01-012025-12-310001786909ifrs-full:EquityAttributableToOwnersOfParentMembersbsw:DrdgoldLimitedMember2025-01-012025-12-310001786909ifrs-full:NoncontrollingInterestsMembersbsw:DrdgoldLimitedMember2025-01-012025-12-310001786909sbsw:DrdgoldLimitedMember2025-01-012025-12-310001786909ifrs-full:IssuedCapitalMember2025-12-310001786909sbsw:ReorganisationReserveMember2025-12-310001786909ifrs-full:ReserveOfSharebasedPaymentsMember2025-12-310001786909sbsw:ReserveOfMarkToMarketMember2025-12-310001786909ifrs-full:ReserveOfExchangeDifferencesOnTranslationMember2025-12-310001786909ifrs-full:RetainedEarningsMember2025-12-310001786909ifrs-full:EquityAttributableToOwnersOfParentMember2025-12-310001786909ifrs-full:NoncontrollingInterestsMember2025-12-310001786909sbsw:BeatrixSegmentMember2025-01-012025-12-310001786909sbsw:DriefonteinSegmentMember2025-01-012025-12-310001786909sbsw:KloofSegmentMember2025-01-012025-12-310001786909sbsw:CookeSegmentMember2025-01-012025-12-310001786909sbsw:MimosaSegmentMember2025-01-012025-12-310001786909sbsw:MarikanaOperationsSegmentMember2025-01-012025-12-310001786909sbsw:RustenburgOperationsSegmentMember2025-01-012025-12-310001786909sbsw:KroondalSegmentMember2025-01-012025-12-310001786909sbsw:MetallixGroupMember2025-01-012025-12-310001786909sbsw:KeliberOyMember2025-01-012025-12-310001786909sbsw:NewCenturyResourcesLimitedMember2025-01-012025-12-310001786909sbsw:CopperMinesOfTasmaniaProprietaryLimitedMember2025-01-012025-12-310001786909sbsw:SibanyeRustenburgPlatinumMinesProprietaryLimitedSubsidiaryMember2025-12-310001786909sbsw:RustenburgMineEmployeesTrustNoncontrollingInterestMember2025-01-012025-12-310001786909sbsw:RustenburgMineCommunityDevelopmentTrustNoncontrollingInterestMember2025-01-012025-12-310001786909sbsw:BakgatlaBaKgafelaInvestmentHoldingsNoncontrollingInterestMember2025-01-012025-12-310001786909sbsw:SiyandaResourcesProprietaryLimitedNoncontrollingInterestMember2025-01-012025-12-310001786909sbsw:RustenburgMineEmployeesTrustNoncontrollingInterestMember2025-12-310001786909sbsw:RustenburgMineCommunityDevelopmentTrustNoncontrollingInterestMember2025-12-310001786909sbsw:LonplatsSiyakhulaEmployeeProfitShareTrustMember2025-01-012025-12-310001786909sbsw:BapoBaMogaleLocalEconomicDevelopmentTrustMember2025-01-012025-12-310001786909sbsw:MarikanaCommunityTrustMember2025-01-012025-12-310001786909sbsw:MarikanaCommunityTrustMember2025-12-310001786909sbsw:DrdgoldLimitedMember2020-01-102020-01-100001786909sbsw:DrdgoldLimitedMember2024-01-012024-12-310001786909sbsw:DrdgoldLimitedMember2023-01-012023-12-310001786909sbsw:PeregrineMetalsLtd.Member2025-01-012025-12-310001786909sbsw:AldebaranResourcesInc.Member2025-01-012025-12-310001786909sbsw:Newshelf1114SubsidiaryMember2025-01-012025-12-310001786909sbsw:Newshelf1335ProprietaryLimitedMember2025-01-012025-12-310001786909sbsw:KeliberOyMember2024-01-012024-12-310001786909sbsw:NewCenturyResourcesLimitedMember2023-05-102023-05-100001786909sbsw:ReldanGroupMember2024-03-150001786909sbsw:MetallixGroupMember2025-09-040001786909ifrs-full:AssetsAndLiabilitiesClassifiedAsHeldForSaleMember2024-07-012024-12-310001786909ifrs-full:AssetsAndLiabilitiesClassifiedAsHeldForSaleMembersbsw:NeoEnergyMetalsPlcMember2024-12-310001786909sbsw:NeoEnergyMetalsPlcMember2024-07-012024-12-310001786909ifrs-full:AssetsAndLiabilitiesClassifiedAsHeldForSaleMember2025-12-310001786909ifrs-full:AssetsAndLiabilitiesClassifiedAsHeldForSaleMember2024-12-310001786909sbsw:IoneerLimitedMember2025-06-300001786909sbsw:IoneerLimitedMember2025-01-012025-06-300001786909sbsw:IoneerLimitedMemberifrs-full:AssetsAndLiabilitiesClassifiedAsHeldForSaleMember2025-06-300001786909sbsw:IoneerLimitedMemberifrs-full:AssetsAndLiabilitiesClassifiedAsHeldForSaleMember2025-07-012025-12-310001786909sbsw:StellarMember2025-01-012025-06-300001786909ifrs-full:AssetsAndLiabilitiesClassifiedAsHeldForSaleMembersbsw:StellarMember2025-06-300001786909ifrs-full:AssetsAndLiabilitiesClassifiedAsHeldForSaleMembersbsw:StellarMember2025-07-012025-12-310001786909ifrs-full:AssetsAndLiabilitiesClassifiedAsHeldForSaleMembersbsw:StellarMember2024-12-310001786909ifrs-full:OperatingSegmentsMembersbsw:SouthAfricaRegionMember2025-01-012025-12-310001786909ifrs-full:OperatingSegmentsMembersbsw:SouthAfricaRegionMembersbsw:PlatinumDivisionSegmentMember2025-01-012025-12-310001786909ifrs-full:OperatingSegmentsMembersbsw:SouthAfricaRegionMembersbsw:GoldDivisionSegmentMember2025-01-012025-12-310001786909ifrs-full:OperatingSegmentsMembersbsw:InternationalOperationsMember2025-01-012025-12-310001786909ifrs-full:OperatingSegmentsMembersrt:NorthAmericaMember2025-01-012025-12-310001786909ifrs-full:OperatingSegmentsMembersrt:EuropeMember2025-01-012025-12-310001786909ifrs-full:OperatingSegmentsMembercountry:AU2025-01-012025-12-310001786909ifrs-full:MaterialReconcilingItemsMember2025-01-012025-12-310001786909ifrs-full:OperatingSegmentsMembersbsw:SouthAfricaRegionMember2024-01-012024-12-310001786909ifrs-full:OperatingSegmentsMembersbsw:SouthAfricaRegionMembersbsw:PlatinumDivisionSegmentMember2024-01-012024-12-310001786909ifrs-full:OperatingSegmentsMembersbsw:SouthAfricaRegionMembersbsw:GoldDivisionSegmentMember2024-01-012024-12-310001786909ifrs-full:OperatingSegmentsMembersbsw:InternationalOperationsMember2024-01-012024-12-310001786909ifrs-full:OperatingSegmentsMembersrt:NorthAmericaMember2024-01-012024-12-310001786909ifrs-full:OperatingSegmentsMembersrt:EuropeMember2024-01-012024-12-310001786909ifrs-full:OperatingSegmentsMembercountry:AU2024-01-012024-12-310001786909ifrs-full:MaterialReconcilingItemsMember2024-01-012024-12-310001786909ifrs-full:OperatingSegmentsMembersbsw:SouthAfricaRegionMember2023-01-012023-12-310001786909ifrs-full:OperatingSegmentsMembersbsw:SouthAfricaRegionMembersbsw:PlatinumDivisionSegmentMember2023-01-012023-12-310001786909ifrs-full:OperatingSegmentsMembersbsw:SouthAfricaRegionMembersbsw:GoldDivisionSegmentMember2023-01-012023-12-310001786909ifrs-full:OperatingSegmentsMembersbsw:InternationalOperationsMember2023-01-012023-12-310001786909ifrs-full:OperatingSegmentsMembersrt:NorthAmericaMember2023-01-012023-12-310001786909ifrs-full:OperatingSegmentsMembersrt:EuropeMember2023-01-012023-12-310001786909ifrs-full:OperatingSegmentsMembercountry:AU2023-01-012023-12-310001786909ifrs-full:MaterialReconcilingItemsMember2023-01-012023-12-310001786909sbsw:MarketForMineOutputUndergroundSourceMember2025-01-012025-12-310001786909ifrs-full:OperatingSegmentsMembersbsw:SouthAfricaRegionMembersbsw:MarketForMineOutputUndergroundSourceMember2025-01-012025-12-310001786909ifrs-full:OperatingSegmentsMembersbsw:SouthAfricaRegionMembersbsw:PlatinumDivisionSegmentMembersbsw:MarketForMineOutputUndergroundSourceMember2025-01-012025-12-310001786909ifrs-full:OperatingSegmentsMembersbsw:SouthAfricaRegionMembersbsw:GoldDivisionSegmentMembersbsw:MarketForMineOutputUndergroundSourceMember2025-01-012025-12-310001786909ifrs-full:OperatingSegmentsMembersbsw:InternationalOperationsMembersbsw:MarketForMineOutputUndergroundSourceMember2025-01-012025-12-310001786909ifrs-full:OperatingSegmentsMembersrt:NorthAmericaMembersbsw:MarketForMineOutputUndergroundSourceMember2025-01-012025-12-310001786909ifrs-full:OperatingSegmentsMembersrt:EuropeMembersbsw:MarketForMineOutputUndergroundSourceMember2025-01-012025-12-310001786909ifrs-full:OperatingSegmentsMembercountry:AUsbsw:MarketForMineOutputUndergroundSourceMember2025-01-012025-12-310001786909ifrs-full:MaterialReconcilingItemsMembersbsw:MarketForMineOutputUndergroundSourceMember2025-01-012025-12-310001786909sbsw:MarketForMineOutputUndergroundSourceMember2024-01-012024-12-310001786909ifrs-full:OperatingSegmentsMembersbsw:SouthAfricaRegionMembersbsw:MarketForMineOutputUndergroundSourceMember2024-01-012024-12-310001786909ifrs-full:OperatingSegmentsMembersbsw:SouthAfricaRegionMembersbsw:PlatinumDivisionSegmentMembersbsw:MarketForMineOutputUndergroundSourceMember2024-01-012024-12-310001786909ifrs-full:OperatingSegmentsMembersbsw:SouthAfricaRegionMembersbsw:GoldDivisionSegmentMembersbsw:MarketForMineOutputUndergroundSourceMember2024-01-012024-12-310001786909ifrs-full:OperatingSegmentsMembersbsw:InternationalOperationsMembersbsw:MarketForMineOutputUndergroundSourceMember2024-01-012024-12-310001786909ifrs-full:OperatingSegmentsMembersrt:NorthAmericaMembersbsw:MarketForMineOutputUndergroundSourceMember2024-01-012024-12-310001786909ifrs-full:OperatingSegmentsMembersrt:EuropeMembersbsw:MarketForMineOutputUndergroundSourceMember2024-01-012024-12-310001786909ifrs-full:OperatingSegmentsMembercountry:AUsbsw:MarketForMineOutputUndergroundSourceMember2024-01-012024-12-310001786909ifrs-full:MaterialReconcilingItemsMembersbsw:MarketForMineOutputUndergroundSourceMember2024-01-012024-12-310001786909sbsw:MarketForMineOutputUndergroundSourceMember2023-01-012023-12-310001786909ifrs-full:OperatingSegmentsMembersbsw:SouthAfricaRegionMembersbsw:MarketForMineOutputUndergroundSourceMember2023-01-012023-12-310001786909ifrs-full:OperatingSegmentsMembersbsw:SouthAfricaRegionMembersbsw:PlatinumDivisionSegmentMembersbsw:MarketForMineOutputUndergroundSourceMember2023-01-012023-12-310001786909ifrs-full:OperatingSegmentsMembersbsw:SouthAfricaRegionMembersbsw:GoldDivisionSegmentMembersbsw:MarketForMineOutputUndergroundSourceMember2023-01-012023-12-310001786909ifrs-full:OperatingSegmentsMembersbsw:InternationalOperationsMembersbsw:MarketForMineOutputUndergroundSourceMember2023-01-012023-12-310001786909ifrs-full:OperatingSegmentsMembersrt:NorthAmericaMembersbsw:MarketForMineOutputUndergroundSourceMember2023-01-012023-12-310001786909ifrs-full:OperatingSegmentsMembersrt:EuropeMembersbsw:MarketForMineOutputUndergroundSourceMember2023-01-012023-12-310001786909ifrs-full:OperatingSegmentsMembercountry:AUsbsw:MarketForMineOutputUndergroundSourceMember2023-01-012023-12-310001786909ifrs-full:MaterialReconcilingItemsMembersbsw:MarketForMineOutputUndergroundSourceMember2023-01-012023-12-310001786909sbsw:MarketForMineOutputSurfaceSourceMember2025-01-012025-12-310001786909ifrs-full:OperatingSegmentsMembersbsw:SouthAfricaRegionMembersbsw:MarketForMineOutputSurfaceSourceMember2025-01-012025-12-310001786909ifrs-full:OperatingSegmentsMembersbsw:SouthAfricaRegionMembersbsw:PlatinumDivisionSegmentMembersbsw:MarketForMineOutputSurfaceSourceMember2025-01-012025-12-310001786909ifrs-full:OperatingSegmentsMembersbsw:SouthAfricaRegionMembersbsw:GoldDivisionSegmentMembersbsw:MarketForMineOutputSurfaceSourceMember2025-01-012025-12-310001786909ifrs-full:OperatingSegmentsMembersbsw:InternationalOperationsMembersbsw:MarketForMineOutputSurfaceSourceMember2025-01-012025-12-310001786909ifrs-full:OperatingSegmentsMembersrt:NorthAmericaMembersbsw:MarketForMineOutputSurfaceSourceMember2025-01-012025-12-310001786909ifrs-full:OperatingSegmentsMembersrt:EuropeMembersbsw:MarketForMineOutputSurfaceSourceMember2025-01-012025-12-310001786909ifrs-full:OperatingSegmentsMembercountry:AUsbsw:MarketForMineOutputSurfaceSourceMember2025-01-012025-12-310001786909ifrs-full:MaterialReconcilingItemsMembersbsw:MarketForMineOutputSurfaceSourceMember2025-01-012025-12-310001786909sbsw:MarketForMineOutputSurfaceSourceMember2024-01-012024-12-310001786909ifrs-full:OperatingSegmentsMembersbsw:SouthAfricaRegionMembersbsw:MarketForMineOutputSurfaceSourceMember2024-01-012024-12-310001786909ifrs-full:OperatingSegmentsMembersbsw:SouthAfricaRegionMembersbsw:PlatinumDivisionSegmentMembersbsw:MarketForMineOutputSurfaceSourceMember2024-01-012024-12-310001786909ifrs-full:OperatingSegmentsMembersbsw:SouthAfricaRegionMembersbsw:GoldDivisionSegmentMembersbsw:MarketForMineOutputSurfaceSourceMember2024-01-012024-12-310001786909ifrs-full:OperatingSegmentsMembersbsw:InternationalOperationsMembersbsw:MarketForMineOutputSurfaceSourceMember2024-01-012024-12-310001786909ifrs-full:OperatingSegmentsMembersrt:NorthAmericaMembersbsw:MarketForMineOutputSurfaceSourceMember2024-01-012024-12-310001786909ifrs-full:OperatingSegmentsMembersrt:EuropeMembersbsw:MarketForMineOutputSurfaceSourceMember2024-01-012024-12-310001786909ifrs-full:OperatingSegmentsMembercountry:AUsbsw:MarketForMineOutputSurfaceSourceMember2024-01-012024-12-310001786909ifrs-full:MaterialReconcilingItemsMembersbsw:MarketForMineOutputSurfaceSourceMember2024-01-012024-12-310001786909sbsw:MarketForMineOutputSurfaceSourceMember2023-01-012023-12-310001786909ifrs-full:OperatingSegmentsMembersbsw:SouthAfricaRegionMembersbsw:MarketForMineOutputSurfaceSourceMember2023-01-012023-12-310001786909ifrs-full:OperatingSegmentsMembersbsw:SouthAfricaRegionMembersbsw:PlatinumDivisionSegmentMembersbsw:MarketForMineOutputSurfaceSourceMember2023-01-012023-12-310001786909ifrs-full:OperatingSegmentsMembersbsw:SouthAfricaRegionMembersbsw:GoldDivisionSegmentMembersbsw:MarketForMineOutputSurfaceSourceMember2023-01-012023-12-310001786909ifrs-full:OperatingSegmentsMembersbsw:InternationalOperationsMembersbsw:MarketForMineOutputSurfaceSourceMember2023-01-012023-12-310001786909ifrs-full:OperatingSegmentsMembersrt:NorthAmericaMembersbsw:MarketForMineOutputSurfaceSourceMember2023-01-012023-12-310001786909ifrs-full:OperatingSegmentsMembersrt:EuropeMembersbsw:MarketForMineOutputSurfaceSourceMember2023-01-012023-12-310001786909ifrs-full:OperatingSegmentsMembercountry:AUsbsw:MarketForMineOutputSurfaceSourceMember2023-01-012023-12-310001786909ifrs-full:MaterialReconcilingItemsMembersbsw:MarketForMineOutputSurfaceSourceMember2023-01-012023-12-310001786909sbsw:MarketForRecycledProductsIncludingProcessingMember2025-01-012025-12-310001786909ifrs-full:OperatingSegmentsMembersbsw:SouthAfricaRegionMembersbsw:MarketForRecycledProductsIncludingProcessingMember2025-01-012025-12-310001786909ifrs-full:OperatingSegmentsMembersbsw:SouthAfricaRegionMembersbsw:PlatinumDivisionSegmentMembersbsw:MarketForRecycledProductsIncludingProcessingMember2025-01-012025-12-310001786909ifrs-full:OperatingSegmentsMembersbsw:SouthAfricaRegionMembersbsw:GoldDivisionSegmentMembersbsw:MarketForRecycledProductsIncludingProcessingMember2025-01-012025-12-310001786909ifrs-full:OperatingSegmentsMembersbsw:InternationalOperationsMembersbsw:MarketForRecycledProductsIncludingProcessingMember2025-01-012025-12-310001786909ifrs-full:OperatingSegmentsMembersrt:NorthAmericaMembersbsw:MarketForRecycledProductsIncludingProcessingMember2025-01-012025-12-310001786909ifrs-full:OperatingSegmentsMembersrt:EuropeMembersbsw:MarketForRecycledProductsIncludingProcessingMember2025-01-012025-12-310001786909ifrs-full:OperatingSegmentsMembercountry:AUsbsw:MarketForRecycledProductsIncludingProcessingMember2025-01-012025-12-310001786909ifrs-full:MaterialReconcilingItemsMembersbsw:MarketForRecycledProductsIncludingProcessingMember2025-01-012025-12-310001786909sbsw:MarketForRecycledProductsMember2024-01-012024-12-310001786909ifrs-full:OperatingSegmentsMembersbsw:SouthAfricaRegionMembersbsw:MarketForRecycledProductsMember2024-01-012024-12-310001786909ifrs-full:OperatingSegmentsMembersbsw:SouthAfricaRegionMembersbsw:PlatinumDivisionSegmentMembersbsw:MarketForRecycledProductsMember2024-01-012024-12-310001786909ifrs-full:OperatingSegmentsMembersbsw:SouthAfricaRegionMembersbsw:GoldDivisionSegmentMembersbsw:MarketForRecycledProductsMember2024-01-012024-12-310001786909ifrs-full:OperatingSegmentsMembersbsw:InternationalOperationsMembersbsw:MarketForRecycledProductsMember2024-01-012024-12-310001786909ifrs-full:OperatingSegmentsMembersrt:NorthAmericaMembersbsw:MarketForRecycledProductsMember2024-01-012024-12-310001786909ifrs-full:OperatingSegmentsMembersrt:EuropeMembersbsw:MarketForRecycledProductsMember2024-01-012024-12-310001786909ifrs-full:OperatingSegmentsMembercountry:AUsbsw:MarketForRecycledProductsMember2024-01-012024-12-310001786909ifrs-full:MaterialReconcilingItemsMembersbsw:MarketForRecycledProductsMember2024-01-012024-12-310001786909sbsw:MarketForRecycledProductsMember2023-01-012023-12-310001786909ifrs-full:OperatingSegmentsMembersbsw:SouthAfricaRegionMembersbsw:MarketForRecycledProductsMember2023-01-012023-12-310001786909ifrs-full:OperatingSegmentsMembersbsw:SouthAfricaRegionMembersbsw:PlatinumDivisionSegmentMembersbsw:MarketForRecycledProductsMember2023-01-012023-12-310001786909ifrs-full:OperatingSegmentsMembersbsw:SouthAfricaRegionMembersbsw:GoldDivisionSegmentMembersbsw:MarketForRecycledProductsMember2023-01-012023-12-310001786909ifrs-full:OperatingSegmentsMembersbsw:InternationalOperationsMembersbsw:MarketForRecycledProductsMember2023-01-012023-12-310001786909ifrs-full:OperatingSegmentsMembersrt:NorthAmericaMembersbsw:MarketForRecycledProductsMember2023-01-012023-12-310001786909ifrs-full:OperatingSegmentsMembersrt:EuropeMembersbsw:MarketForRecycledProductsMember2023-01-012023-12-310001786909ifrs-full:OperatingSegmentsMembercountry:AUsbsw:MarketForRecycledProductsMember2023-01-012023-12-310001786909ifrs-full:MaterialReconcilingItemsMembersbsw:MarketForRecycledProductsMember2023-01-012023-12-310001786909ifrs-full:OperatingSegmentsMembersbsw:SouthAfricaRegionMembersbsw:RustenburgOperationsSegmentMember2025-01-012025-12-310001786909ifrs-full:OperatingSegmentsMembersbsw:SouthAfricaRegionMembersbsw:MarikanaOperationsSegmentMember2025-01-012025-12-310001786909ifrs-full:OperatingSegmentsMembersbsw:SouthAfricaRegionMembersbsw:PlatinumMileSegmentMember2025-01-012025-12-310001786909ifrs-full:OperatingSegmentsMembersbsw:SouthAfricaRegionMembersbsw:MimosaSegmentMember2025-01-012025-12-310001786909ifrs-full:MaterialReconcilingItemsMembersbsw:SouthAfricaRegionMembersbsw:PlatinumDivisionSegmentMember2025-01-012025-12-310001786909ifrs-full:OperatingSegmentsMembersbsw:SouthAfricaRegionMembersbsw:DriefonteinSegmentMember2025-01-012025-12-310001786909ifrs-full:OperatingSegmentsMembersbsw:SouthAfricaRegionMembersbsw:KloofSegmentMember2025-01-012025-12-310001786909ifrs-full:OperatingSegmentsMembersbsw:SouthAfricaRegionMembersbsw:BeatrixSegmentMember2025-01-012025-12-310001786909ifrs-full:OperatingSegmentsMembersbsw:SouthAfricaRegionMembersbsw:DrdGoldSegmentMember2025-01-012025-12-310001786909ifrs-full:MaterialReconcilingItemsMembersbsw:SouthAfricaRegionMembersbsw:GoldDivisionSegmentMember2025-01-012025-12-310001786909ifrs-full:OperatingSegmentsMembersbsw:SouthAfricaRegionMembersbsw:RustenburgOperationsSegmentMembersbsw:MarketForMineOutputUndergroundSourceMember2025-01-012025-12-310001786909ifrs-full:OperatingSegmentsMembersbsw:SouthAfricaRegionMembersbsw:MarikanaOperationsSegmentMembersbsw:MarketForMineOutputUndergroundSourceMember2025-01-012025-12-310001786909ifrs-full:OperatingSegmentsMembersbsw:SouthAfricaRegionMembersbsw:PlatinumMileSegmentMembersbsw:MarketForMineOutputUndergroundSourceMember2025-01-012025-12-310001786909ifrs-full:OperatingSegmentsMembersbsw:SouthAfricaRegionMembersbsw:MimosaSegmentMembersbsw:MarketForMineOutputUndergroundSourceMember2025-01-012025-12-310001786909ifrs-full:MaterialReconcilingItemsMembersbsw:SouthAfricaRegionMembersbsw:PlatinumDivisionSegmentMembersbsw:MarketForMineOutputUndergroundSourceMember2025-01-012025-12-310001786909ifrs-full:OperatingSegmentsMembersbsw:SouthAfricaRegionMembersbsw:DriefonteinSegmentMembersbsw:MarketForMineOutputUndergroundSourceMember2025-01-012025-12-310001786909ifrs-full:OperatingSegmentsMembersbsw:SouthAfricaRegionMembersbsw:KloofSegmentMembersbsw:MarketForMineOutputUndergroundSourceMember2025-01-012025-12-310001786909ifrs-full:OperatingSegmentsMembersbsw:SouthAfricaRegionMembersbsw:BeatrixSegmentMembersbsw:MarketForMineOutputUndergroundSourceMember2025-01-012025-12-310001786909ifrs-full:OperatingSegmentsMembersbsw:SouthAfricaRegionMembersbsw:DrdGoldSegmentMembersbsw:MarketForMineOutputUndergroundSourceMember2025-01-012025-12-310001786909ifrs-full:MaterialReconcilingItemsMembersbsw:SouthAfricaRegionMembersbsw:GoldDivisionSegmentMembersbsw:MarketForMineOutputUndergroundSourceMember2025-01-012025-12-310001786909ifrs-full:OperatingSegmentsMembersbsw:SouthAfricaRegionMembersbsw:RustenburgOperationsSegmentMembersbsw:MarketForMineOutputSurfaceSourceMember2025-01-012025-12-310001786909ifrs-full:OperatingSegmentsMembersbsw:SouthAfricaRegionMembersbsw:MarikanaOperationsSegmentMembersbsw:MarketForMineOutputSurfaceSourceMember2025-01-012025-12-310001786909ifrs-full:OperatingSegmentsMembersbsw:SouthAfricaRegionMembersbsw:PlatinumMileSegmentMembersbsw:MarketForMineOutputSurfaceSourceMember2025-01-012025-12-310001786909ifrs-full:OperatingSegmentsMembersbsw:SouthAfricaRegionMembersbsw:MimosaSegmentMembersbsw:MarketForMineOutputSurfaceSourceMember2025-01-012025-12-310001786909ifrs-full:MaterialReconcilingItemsMembersbsw:SouthAfricaRegionMembersbsw:PlatinumDivisionSegmentMembersbsw:MarketForMineOutputSurfaceSourceMember2025-01-012025-12-310001786909ifrs-full:OperatingSegmentsMembersbsw:SouthAfricaRegionMembersbsw:DriefonteinSegmentMembersbsw:MarketForMineOutputSurfaceSourceMember2025-01-012025-12-310001786909ifrs-full:OperatingSegmentsMembersbsw:SouthAfricaRegionMembersbsw:KloofSegmentMembersbsw:MarketForMineOutputSurfaceSourceMember2025-01-012025-12-310001786909ifrs-full:OperatingSegmentsMembersbsw:SouthAfricaRegionMembersbsw:BeatrixSegmentMembersbsw:MarketForMineOutputSurfaceSourceMember2025-01-012025-12-310001786909ifrs-full:OperatingSegmentsMembersbsw:SouthAfricaRegionMembersbsw:DrdGoldSegmentMembersbsw:MarketForMineOutputSurfaceSourceMember2025-01-012025-12-310001786909ifrs-full:MaterialReconcilingItemsMembersbsw:SouthAfricaRegionMembersbsw:GoldDivisionSegmentMembersbsw:MarketForMineOutputSurfaceSourceMember2025-01-012025-12-310001786909ifrs-full:OperatingSegmentsMembersbsw:SouthAfricaRegionMembersbsw:RustenburgOperationsSegmentMembersbsw:MarketForRecycledProductsIncludingProcessingMember2025-01-012025-12-310001786909ifrs-full:OperatingSegmentsMembersbsw:SouthAfricaRegionMembersbsw:MarikanaOperationsSegmentMembersbsw:MarketForRecycledProductsIncludingProcessingMember2025-01-012025-12-310001786909ifrs-full:OperatingSegmentsMembersbsw:SouthAfricaRegionMembersbsw:PlatinumMileSegmentMembersbsw:MarketForRecycledProductsIncludingProcessingMember2025-01-012025-12-310001786909ifrs-full:OperatingSegmentsMembersbsw:SouthAfricaRegionMembersbsw:MimosaSegmentMembersbsw:MarketForRecycledProductsIncludingProcessingMember2025-01-012025-12-310001786909ifrs-full:MaterialReconcilingItemsMembersbsw:SouthAfricaRegionMembersbsw:PlatinumDivisionSegmentMembersbsw:MarketForRecycledProductsIncludingProcessingMember2025-01-012025-12-310001786909ifrs-full:OperatingSegmentsMembersbsw:SouthAfricaRegionMembersbsw:DriefonteinSegmentMembersbsw:MarketForRecycledProductsIncludingProcessingMember2025-01-012025-12-310001786909ifrs-full:OperatingSegmentsMembersbsw:SouthAfricaRegionMembersbsw:KloofSegmentMembersbsw:MarketForRecycledProductsIncludingProcessingMember2025-01-012025-12-310001786909ifrs-full:OperatingSegmentsMembersbsw:SouthAfricaRegionMembersbsw:BeatrixSegmentMembersbsw:MarketForRecycledProductsIncludingProcessingMember2025-01-012025-12-310001786909ifrs-full:OperatingSegmentsMembersbsw:SouthAfricaRegionMembersbsw:DrdGoldSegmentMembersbsw:MarketForRecycledProductsIncludingProcessingMember2025-01-012025-12-310001786909ifrs-full:MaterialReconcilingItemsMembersbsw:SouthAfricaRegionMembersbsw:GoldDivisionSegmentMembersbsw:MarketForRecycledProductsIncludingProcessingMember2025-01-012025-12-310001786909ifrs-full:MaterialReconcilingItemsMembersbsw:SouthAfricaRegionMembersbsw:MarketForMineOutputUndergroundSourceMember2025-01-012025-12-310001786909ifrs-full:MaterialReconcilingItemsMembersbsw:SouthAfricaRegionMembersbsw:MarketForMineOutputSurfaceSourceMember2025-01-012025-12-310001786909ifrs-full:MaterialReconcilingItemsMembersbsw:SouthAfricaRegionMembersbsw:MarketForRecycledProductsIncludingProcessingMember2025-01-012025-12-310001786909ifrs-full:OperatingSegmentsMembersbsw:SouthAfricaRegionMembersbsw:RustenburgOperationsSegmentMember2024-01-012024-12-310001786909ifrs-full:OperatingSegmentsMembersbsw:SouthAfricaRegionMembersbsw:MarikanaOperationsSegmentMember2024-01-012024-12-310001786909ifrs-full:OperatingSegmentsMembersbsw:SouthAfricaRegionMembersbsw:KroondalSegmentMember2024-01-012024-12-310001786909ifrs-full:OperatingSegmentsMembersbsw:SouthAfricaRegionMembersbsw:PlatinumMileSegmentMember2024-01-012024-12-310001786909ifrs-full:OperatingSegmentsMembersbsw:SouthAfricaRegionMembersbsw:MimosaSegmentMember2024-01-012024-12-310001786909ifrs-full:MaterialReconcilingItemsMembersbsw:SouthAfricaRegionMembersbsw:PlatinumDivisionSegmentMember2024-01-012024-12-310001786909ifrs-full:OperatingSegmentsMembersbsw:SouthAfricaRegionMembersbsw:DriefonteinSegmentMember2024-01-012024-12-310001786909ifrs-full:OperatingSegmentsMembersbsw:SouthAfricaRegionMembersbsw:KloofSegmentMember2024-01-012024-12-310001786909ifrs-full:OperatingSegmentsMembersbsw:SouthAfricaRegionMembersbsw:BeatrixSegmentMember2024-01-012024-12-310001786909ifrs-full:OperatingSegmentsMembersbsw:SouthAfricaRegionMembersbsw:DrdGoldSegmentMember2024-01-012024-12-310001786909ifrs-full:MaterialReconcilingItemsMembersbsw:SouthAfricaRegionMembersbsw:GoldDivisionSegmentMember2024-01-012024-12-310001786909ifrs-full:OperatingSegmentsMembersbsw:SouthAfricaRegionMembersbsw:RustenburgOperationsSegmentMembersbsw:MarketForMineOutputUndergroundSourceMember2024-01-012024-12-310001786909ifrs-full:OperatingSegmentsMembersbsw:SouthAfricaRegionMembersbsw:MarikanaOperationsSegmentMembersbsw:MarketForMineOutputUndergroundSourceMember2024-01-012024-12-310001786909ifrs-full:OperatingSegmentsMembersbsw:SouthAfricaRegionMembersbsw:KroondalSegmentMembersbsw:MarketForMineOutputUndergroundSourceMember2024-01-012024-12-310001786909ifrs-full:OperatingSegmentsMembersbsw:SouthAfricaRegionMembersbsw:PlatinumMileSegmentMembersbsw:MarketForMineOutputUndergroundSourceMember2024-01-012024-12-310001786909ifrs-full:OperatingSegmentsMembersbsw:SouthAfricaRegionMembersbsw:MimosaSegmentMembersbsw:MarketForMineOutputUndergroundSourceMember2024-01-012024-12-310001786909ifrs-full:MaterialReconcilingItemsMembersbsw:SouthAfricaRegionMembersbsw:PlatinumDivisionSegmentMembersbsw:MarketForMineOutputUndergroundSourceMember2024-01-012024-12-310001786909ifrs-full:OperatingSegmentsMembersbsw:SouthAfricaRegionMembersbsw:DriefonteinSegmentMembersbsw:MarketForMineOutputUndergroundSourceMember2024-01-012024-12-310001786909ifrs-full:OperatingSegmentsMembersbsw:SouthAfricaRegionMembersbsw:KloofSegmentMembersbsw:MarketForMineOutputUndergroundSourceMember2024-01-012024-12-310001786909ifrs-full:OperatingSegmentsMembersbsw:SouthAfricaRegionMembersbsw:BeatrixSegmentMembersbsw:MarketForMineOutputUndergroundSourceMember2024-01-012024-12-310001786909ifrs-full:OperatingSegmentsMembersbsw:SouthAfricaRegionMembersbsw:DrdGoldSegmentMembersbsw:MarketForMineOutputUndergroundSourceMember2024-01-012024-12-310001786909ifrs-full:MaterialReconcilingItemsMembersbsw:SouthAfricaRegionMembersbsw:GoldDivisionSegmentMembersbsw:MarketForMineOutputUndergroundSourceMember2024-01-012024-12-310001786909ifrs-full:OperatingSegmentsMembersbsw:SouthAfricaRegionMembersbsw:RustenburgOperationsSegmentMembersbsw:MarketForMineOutputSurfaceSourceMember2024-01-012024-12-310001786909ifrs-full:OperatingSegmentsMembersbsw:SouthAfricaRegionMembersbsw:MarikanaOperationsSegmentMembersbsw:MarketForMineOutputSurfaceSourceMember2024-01-012024-12-310001786909ifrs-full:OperatingSegmentsMembersbsw:SouthAfricaRegionMembersbsw:KroondalSegmentMembersbsw:MarketForMineOutputSurfaceSourceMember2024-01-012024-12-310001786909ifrs-full:OperatingSegmentsMembersbsw:SouthAfricaRegionMembersbsw:PlatinumMileSegmentMembersbsw:MarketForMineOutputSurfaceSourceMember2024-01-012024-12-310001786909ifrs-full:OperatingSegmentsMembersbsw:SouthAfricaRegionMembersbsw:MimosaSegmentMembersbsw:MarketForMineOutputSurfaceSourceMember2024-01-012024-12-310001786909ifrs-full:MaterialReconcilingItemsMembersbsw:SouthAfricaRegionMembersbsw:PlatinumDivisionSegmentMembersbsw:MarketForMineOutputSurfaceSourceMember2024-01-012024-12-310001786909ifrs-full:OperatingSegmentsMembersbsw:SouthAfricaRegionMembersbsw:DriefonteinSegmentMembersbsw:MarketForMineOutputSurfaceSourceMember2024-01-012024-12-310001786909ifrs-full:OperatingSegmentsMembersbsw:SouthAfricaRegionMembersbsw:KloofSegmentMembersbsw:MarketForMineOutputSurfaceSourceMember2024-01-012024-12-310001786909ifrs-full:OperatingSegmentsMembersbsw:SouthAfricaRegionMembersbsw:BeatrixSegmentMembersbsw:MarketForMineOutputSurfaceSourceMember2024-01-012024-12-310001786909ifrs-full:OperatingSegmentsMembersbsw:SouthAfricaRegionMembersbsw:DrdGoldSegmentMembersbsw:MarketForMineOutputSurfaceSourceMember2024-01-012024-12-310001786909ifrs-full:MaterialReconcilingItemsMembersbsw:SouthAfricaRegionMembersbsw:GoldDivisionSegmentMembersbsw:MarketForMineOutputSurfaceSourceMember2024-01-012024-12-310001786909ifrs-full:OperatingSegmentsMembersbsw:SouthAfricaRegionMembersbsw:RustenburgOperationsSegmentMembersbsw:MarketForRecycledProductsMember2024-01-012024-12-310001786909ifrs-full:OperatingSegmentsMembersbsw:SouthAfricaRegionMembersbsw:MarikanaOperationsSegmentMembersbsw:MarketForRecycledProductsMember2024-01-012024-12-310001786909ifrs-full:OperatingSegmentsMembersbsw:SouthAfricaRegionMembersbsw:KroondalSegmentMembersbsw:MarketForRecycledProductsMember2024-01-012024-12-310001786909ifrs-full:OperatingSegmentsMembersbsw:SouthAfricaRegionMembersbsw:PlatinumMileSegmentMembersbsw:MarketForRecycledProductsMember2024-01-012024-12-310001786909ifrs-full:OperatingSegmentsMembersbsw:SouthAfricaRegionMembersbsw:MimosaSegmentMembersbsw:MarketForRecycledProductsMember2024-01-012024-12-310001786909ifrs-full:MaterialReconcilingItemsMembersbsw:SouthAfricaRegionMembersbsw:PlatinumDivisionSegmentMembersbsw:MarketForRecycledProductsMember2024-01-012024-12-310001786909ifrs-full:OperatingSegmentsMembersbsw:SouthAfricaRegionMembersbsw:DriefonteinSegmentMembersbsw:MarketForRecycledProductsMember2024-01-012024-12-310001786909ifrs-full:OperatingSegmentsMembersbsw:SouthAfricaRegionMembersbsw:KloofSegmentMembersbsw:MarketForRecycledProductsMember2024-01-012024-12-310001786909ifrs-full:OperatingSegmentsMembersbsw:SouthAfricaRegionMembersbsw:BeatrixSegmentMembersbsw:MarketForRecycledProductsMember2024-01-012024-12-310001786909ifrs-full:OperatingSegmentsMembersbsw:SouthAfricaRegionMembersbsw:DrdGoldSegmentMembersbsw:MarketForRecycledProductsMember2024-01-012024-12-310001786909ifrs-full:MaterialReconcilingItemsMembersbsw:SouthAfricaRegionMembersbsw:GoldDivisionSegmentMembersbsw:MarketForRecycledProductsMember2024-01-012024-12-310001786909ifrs-full:MaterialReconcilingItemsMembersbsw:SouthAfricaRegionMembersbsw:MarketForMineOutputUndergroundSourceMember2024-01-012024-12-310001786909ifrs-full:MaterialReconcilingItemsMembersbsw:SouthAfricaRegionMembersbsw:MarketForMineOutputSurfaceSourceMember2024-01-012024-12-310001786909ifrs-full:MaterialReconcilingItemsMembersbsw:SouthAfricaRegionMembersbsw:MarketForRecycledProductsMember2024-01-012024-12-310001786909sbsw:SouthAfricaRegionMember2024-01-012024-12-310001786909sbsw:PGMOperationsWorkInProgressMembersbsw:SouthAfricaRegionMember2024-01-012024-12-310001786909sbsw:PGMOperationsFinishedGoodsMembersbsw:SouthAfricaRegionMember2024-01-012024-12-310001786909sbsw:RustenburgOperationsSegmentMembersbsw:SouthAfricaRegionMember2025-01-012025-12-310001786909sbsw:KroondalSegmentMembersbsw:SouthAfricaRegionMember2025-01-012025-12-310001786909sbsw:MarikanaOperationsSegmentMembersbsw:SouthAfricaRegionMember2025-01-012025-12-310001786909ifrs-full:OperatingSegmentsMembersbsw:SouthAfricaRegionMembersbsw:RustenburgOperationsSegmentMember2023-01-012023-12-310001786909ifrs-full:OperatingSegmentsMembersbsw:SouthAfricaRegionMembersbsw:MarikanaOperationsSegmentMember2023-01-012023-12-310001786909ifrs-full:OperatingSegmentsMembersbsw:SouthAfricaRegionMembersbsw:KroondalSegmentMember2023-01-012023-12-310001786909ifrs-full:OperatingSegmentsMembersbsw:SouthAfricaRegionMembersbsw:PlatinumMileSegmentMember2023-01-012023-12-310001786909ifrs-full:OperatingSegmentsMembersbsw:SouthAfricaRegionMembersbsw:MimosaSegmentMember2023-01-012023-12-310001786909ifrs-full:MaterialReconcilingItemsMembersbsw:SouthAfricaRegionMembersbsw:PlatinumDivisionSegmentMember2023-01-012023-12-310001786909ifrs-full:OperatingSegmentsMembersbsw:SouthAfricaRegionMembersbsw:DriefonteinSegmentMember2023-01-012023-12-310001786909ifrs-full:OperatingSegmentsMembersbsw:SouthAfricaRegionMembersbsw:KloofSegmentMember2023-01-012023-12-310001786909ifrs-full:OperatingSegmentsMembersbsw:SouthAfricaRegionMembersbsw:BeatrixSegmentMember2023-01-012023-12-310001786909ifrs-full:OperatingSegmentsMembersbsw:SouthAfricaRegionMembersbsw:DrdGoldSegmentMember2023-01-012023-12-310001786909ifrs-full:MaterialReconcilingItemsMembersbsw:SouthAfricaRegionMembersbsw:GoldDivisionSegmentMember2023-01-012023-12-310001786909ifrs-full:OperatingSegmentsMembersbsw:SouthAfricaRegionMembersbsw:RustenburgOperationsSegmentMembersbsw:MarketForMineOutputUndergroundSourceMember2023-01-012023-12-310001786909ifrs-full:OperatingSegmentsMembersbsw:SouthAfricaRegionMembersbsw:MarikanaOperationsSegmentMembersbsw:MarketForMineOutputUndergroundSourceMember2023-01-012023-12-310001786909ifrs-full:OperatingSegmentsMembersbsw:SouthAfricaRegionMembersbsw:KroondalSegmentMembersbsw:MarketForMineOutputUndergroundSourceMember2023-01-012023-12-310001786909ifrs-full:OperatingSegmentsMembersbsw:SouthAfricaRegionMembersbsw:PlatinumMileSegmentMembersbsw:MarketForMineOutputUndergroundSourceMember2023-01-012023-12-310001786909ifrs-full:OperatingSegmentsMembersbsw:SouthAfricaRegionMembersbsw:MimosaSegmentMembersbsw:MarketForMineOutputUndergroundSourceMember2023-01-012023-12-310001786909ifrs-full:MaterialReconcilingItemsMembersbsw:SouthAfricaRegionMembersbsw:PlatinumDivisionSegmentMembersbsw:MarketForMineOutputUndergroundSourceMember2023-01-012023-12-310001786909ifrs-full:OperatingSegmentsMembersbsw:SouthAfricaRegionMembersbsw:DriefonteinSegmentMembersbsw:MarketForMineOutputUndergroundSourceMember2023-01-012023-12-310001786909ifrs-full:OperatingSegmentsMembersbsw:SouthAfricaRegionMembersbsw:KloofSegmentMembersbsw:MarketForMineOutputUndergroundSourceMember2023-01-012023-12-310001786909ifrs-full:OperatingSegmentsMembersbsw:SouthAfricaRegionMembersbsw:BeatrixSegmentMembersbsw:MarketForMineOutputUndergroundSourceMember2023-01-012023-12-310001786909ifrs-full:OperatingSegmentsMembersbsw:SouthAfricaRegionMembersbsw:DrdGoldSegmentMembersbsw:MarketForMineOutputUndergroundSourceMember2023-01-012023-12-310001786909ifrs-full:MaterialReconcilingItemsMembersbsw:SouthAfricaRegionMembersbsw:GoldDivisionSegmentMembersbsw:MarketForMineOutputUndergroundSourceMember2023-01-012023-12-310001786909ifrs-full:OperatingSegmentsMembersbsw:SouthAfricaRegionMembersbsw:RustenburgOperationsSegmentMembersbsw:MarketForMineOutputSurfaceSourceMember2023-01-012023-12-310001786909ifrs-full:OperatingSegmentsMembersbsw:SouthAfricaRegionMembersbsw:MarikanaOperationsSegmentMembersbsw:MarketForMineOutputSurfaceSourceMember2023-01-012023-12-310001786909ifrs-full:OperatingSegmentsMembersbsw:SouthAfricaRegionMembersbsw:KroondalSegmentMembersbsw:MarketForMineOutputSurfaceSourceMember2023-01-012023-12-310001786909ifrs-full:OperatingSegmentsMembersbsw:SouthAfricaRegionMembersbsw:PlatinumMileSegmentMembersbsw:MarketForMineOutputSurfaceSourceMember2023-01-012023-12-310001786909ifrs-full:OperatingSegmentsMembersbsw:SouthAfricaRegionMembersbsw:MimosaSegmentMembersbsw:MarketForMineOutputSurfaceSourceMember2023-01-012023-12-310001786909ifrs-full:MaterialReconcilingItemsMembersbsw:SouthAfricaRegionMembersbsw:PlatinumDivisionSegmentMembersbsw:MarketForMineOutputSurfaceSourceMember2023-01-012023-12-310001786909ifrs-full:OperatingSegmentsMembersbsw:SouthAfricaRegionMembersbsw:DriefonteinSegmentMembersbsw:MarketForMineOutputSurfaceSourceMember2023-01-012023-12-310001786909ifrs-full:OperatingSegmentsMembersbsw:SouthAfricaRegionMembersbsw:KloofSegmentMembersbsw:MarketForMineOutputSurfaceSourceMember2023-01-012023-12-310001786909ifrs-full:OperatingSegmentsMembersbsw:SouthAfricaRegionMembersbsw:BeatrixSegmentMembersbsw:MarketForMineOutputSurfaceSourceMember2023-01-012023-12-310001786909ifrs-full:OperatingSegmentsMembersbsw:SouthAfricaRegionMembersbsw:DrdGoldSegmentMembersbsw:MarketForMineOutputSurfaceSourceMember2023-01-012023-12-310001786909ifrs-full:MaterialReconcilingItemsMembersbsw:SouthAfricaRegionMembersbsw:GoldDivisionSegmentMembersbsw:MarketForMineOutputSurfaceSourceMember2023-01-012023-12-310001786909ifrs-full:OperatingSegmentsMembersbsw:SouthAfricaRegionMembersbsw:RustenburgOperationsSegmentMembersbsw:MarketForRecycledProductsMember2023-01-012023-12-310001786909ifrs-full:OperatingSegmentsMembersbsw:SouthAfricaRegionMembersbsw:MarikanaOperationsSegmentMembersbsw:MarketForRecycledProductsMember2023-01-012023-12-310001786909ifrs-full:OperatingSegmentsMembersbsw:SouthAfricaRegionMembersbsw:KroondalSegmentMembersbsw:MarketForRecycledProductsMember2023-01-012023-12-310001786909ifrs-full:OperatingSegmentsMembersbsw:SouthAfricaRegionMembersbsw:PlatinumMileSegmentMembersbsw:MarketForRecycledProductsMember2023-01-012023-12-310001786909ifrs-full:OperatingSegmentsMembersbsw:SouthAfricaRegionMembersbsw:MimosaSegmentMembersbsw:MarketForRecycledProductsMember2023-01-012023-12-310001786909ifrs-full:MaterialReconcilingItemsMembersbsw:SouthAfricaRegionMembersbsw:PlatinumDivisionSegmentMembersbsw:MarketForRecycledProductsMember2023-01-012023-12-310001786909ifrs-full:OperatingSegmentsMembersbsw:SouthAfricaRegionMembersbsw:DriefonteinSegmentMembersbsw:MarketForRecycledProductsMember2023-01-012023-12-310001786909ifrs-full:OperatingSegmentsMembersbsw:SouthAfricaRegionMembersbsw:KloofSegmentMembersbsw:MarketForRecycledProductsMember2023-01-012023-12-310001786909ifrs-full:OperatingSegmentsMembersbsw:SouthAfricaRegionMembersbsw:BeatrixSegmentMembersbsw:MarketForRecycledProductsMember2023-01-012023-12-310001786909ifrs-full:OperatingSegmentsMembersbsw:SouthAfricaRegionMembersbsw:DrdGoldSegmentMembersbsw:MarketForRecycledProductsMember2023-01-012023-12-310001786909ifrs-full:MaterialReconcilingItemsMembersbsw:SouthAfricaRegionMembersbsw:GoldDivisionSegmentMembersbsw:MarketForRecycledProductsMember2023-01-012023-12-310001786909ifrs-full:MaterialReconcilingItemsMembersbsw:SouthAfricaRegionMembersbsw:MarketForMineOutputUndergroundSourceMember2023-01-012023-12-310001786909ifrs-full:MaterialReconcilingItemsMembersbsw:SouthAfricaRegionMembersbsw:MarketForMineOutputSurfaceSourceMember2023-01-012023-12-310001786909ifrs-full:MaterialReconcilingItemsMembersbsw:SouthAfricaRegionMembersbsw:MarketForRecycledProductsMember2023-01-012023-12-310001786909ifrs-full:OperatingSegmentsMembersrt:NorthAmericaMembersbsw:PlatinumDivisionSegmentMember2025-01-012025-12-310001786909ifrs-full:OperatingSegmentsMembersrt:NorthAmericaMembersbsw:UndergroundSegmentMember2025-01-012025-12-310001786909ifrs-full:OperatingSegmentsMembersrt:NorthAmericaMembersbsw:TotalUSRecyclingMember2025-01-012025-12-310001786909ifrs-full:OperatingSegmentsMembersrt:NorthAmericaMembersbsw:ColumbusMember2025-01-012025-12-310001786909ifrs-full:OperatingSegmentsMembersrt:NorthAmericaMembersbsw:PennsylvaniaSiteAndNorthCarolinaSiteMember2025-01-012025-12-310001786909ifrs-full:OperatingSegmentsMembersrt:EuropeMembersbsw:SandouvilleSegmentMember2025-01-012025-12-310001786909ifrs-full:MaterialReconcilingItemsMembersrt:EuropeMember2025-01-012025-12-310001786909ifrs-full:OperatingSegmentsMembercountry:AUsbsw:CenturySegmentMember2025-01-012025-12-310001786909ifrs-full:MaterialReconcilingItemsMembercountry:AU2025-01-012025-12-310001786909ifrs-full:OperatingSegmentsMembersrt:NorthAmericaMembersbsw:PlatinumDivisionSegmentMembersbsw:MarketForMineOutputUndergroundSourceMember2025-01-012025-12-310001786909ifrs-full:OperatingSegmentsMembersrt:NorthAmericaMembersbsw:UndergroundSegmentMembersbsw:MarketForMineOutputUndergroundSourceMember2025-01-012025-12-310001786909ifrs-full:OperatingSegmentsMembersrt:NorthAmericaMembersbsw:TotalUSRecyclingMembersbsw:MarketForMineOutputUndergroundSourceMember2025-01-012025-12-310001786909ifrs-full:OperatingSegmentsMembersrt:NorthAmericaMembersbsw:ColumbusMembersbsw:MarketForMineOutputUndergroundSourceMember2025-01-012025-12-310001786909ifrs-full:OperatingSegmentsMembersrt:NorthAmericaMembersbsw:PennsylvaniaSiteAndNorthCarolinaSiteMembersbsw:MarketForMineOutputUndergroundSourceMember2025-01-012025-12-310001786909ifrs-full:OperatingSegmentsMembersrt:EuropeMembersbsw:SandouvilleSegmentMembersbsw:MarketForMineOutputUndergroundSourceMember2025-01-012025-12-310001786909ifrs-full:MaterialReconcilingItemsMembersrt:EuropeMembersbsw:MarketForMineOutputUndergroundSourceMember2025-01-012025-12-310001786909ifrs-full:OperatingSegmentsMembercountry:AUsbsw:CenturySegmentMembersbsw:MarketForMineOutputUndergroundSourceMember2025-01-012025-12-310001786909ifrs-full:MaterialReconcilingItemsMembercountry:AUsbsw:MarketForMineOutputUndergroundSourceMember2025-01-012025-12-310001786909ifrs-full:OperatingSegmentsMembersrt:NorthAmericaMembersbsw:PlatinumDivisionSegmentMembersbsw:MarketForMineOutputSurfaceSourceMember2025-01-012025-12-310001786909ifrs-full:OperatingSegmentsMembersrt:NorthAmericaMembersbsw:UndergroundSegmentMembersbsw:MarketForMineOutputSurfaceSourceMember2025-01-012025-12-310001786909ifrs-full:OperatingSegmentsMembersrt:NorthAmericaMembersbsw:TotalUSRecyclingMembersbsw:MarketForMineOutputSurfaceSourceMember2025-01-012025-12-310001786909ifrs-full:OperatingSegmentsMembersrt:NorthAmericaMembersbsw:ColumbusMembersbsw:MarketForMineOutputSurfaceSourceMember2025-01-012025-12-310001786909ifrs-full:OperatingSegmentsMembersrt:NorthAmericaMembersbsw:PennsylvaniaSiteAndNorthCarolinaSiteMembersbsw:MarketForMineOutputSurfaceSourceMember2025-01-012025-12-310001786909ifrs-full:OperatingSegmentsMembersrt:EuropeMembersbsw:SandouvilleSegmentMembersbsw:MarketForMineOutputSurfaceSourceMember2025-01-012025-12-310001786909ifrs-full:MaterialReconcilingItemsMembersrt:EuropeMembersbsw:MarketForMineOutputSurfaceSourceMember2025-01-012025-12-310001786909ifrs-full:OperatingSegmentsMembercountry:AUsbsw:CenturySegmentMembersbsw:MarketForMineOutputSurfaceSourceMember2025-01-012025-12-310001786909ifrs-full:MaterialReconcilingItemsMembercountry:AUsbsw:MarketForMineOutputSurfaceSourceMember2025-01-012025-12-310001786909ifrs-full:OperatingSegmentsMembersrt:NorthAmericaMembersbsw:PlatinumDivisionSegmentMembersbsw:MarketForRecycledProductsIncludingProcessingMember2025-01-012025-12-310001786909ifrs-full:OperatingSegmentsMembersrt:NorthAmericaMembersbsw:UndergroundSegmentMembersbsw:MarketForRecycledProductsIncludingProcessingMember2025-01-012025-12-310001786909ifrs-full:OperatingSegmentsMembersrt:NorthAmericaMembersbsw:TotalUSRecyclingMembersbsw:MarketForRecycledProductsIncludingProcessingMember2025-01-012025-12-310001786909ifrs-full:OperatingSegmentsMembersrt:NorthAmericaMembersbsw:ColumbusMembersbsw:MarketForRecycledProductsIncludingProcessingMember2025-01-012025-12-310001786909ifrs-full:OperatingSegmentsMembersrt:NorthAmericaMembersbsw:PennsylvaniaSiteAndNorthCarolinaSiteMembersbsw:MarketForRecycledProductsIncludingProcessingMember2025-01-012025-12-310001786909ifrs-full:OperatingSegmentsMembersrt:EuropeMembersbsw:SandouvilleSegmentMembersbsw:MarketForRecycledProductsIncludingProcessingMember2025-01-012025-12-310001786909ifrs-full:MaterialReconcilingItemsMembersrt:EuropeMembersbsw:MarketForRecycledProductsIncludingProcessingMember2025-01-012025-12-310001786909ifrs-full:OperatingSegmentsMembercountry:AUsbsw:CenturySegmentMembersbsw:MarketForRecycledProductsIncludingProcessingMember2025-01-012025-12-310001786909ifrs-full:MaterialReconcilingItemsMembercountry:AUsbsw:MarketForRecycledProductsIncludingProcessingMember2025-01-012025-12-310001786909srt:NorthAmericaMember2025-01-012025-12-310001786909sbsw:PGMOperationsWorkInProgressMembersrt:NorthAmericaMember2025-01-012025-12-310001786909sbsw:PGMOperationsFinishedGoodsMembersrt:NorthAmericaMember2025-01-012025-12-310001786909ifrs-full:OperatingSegmentsMembersrt:NorthAmericaMembersbsw:PlatinumDivisionSegmentMember2024-01-012024-12-310001786909ifrs-full:OperatingSegmentsMembersrt:NorthAmericaMembersbsw:UndergroundSegmentMember2024-01-012024-12-310001786909ifrs-full:OperatingSegmentsMembersrt:NorthAmericaMembersbsw:TotalUSRecyclingMember2024-01-012024-12-310001786909ifrs-full:OperatingSegmentsMembersrt:NorthAmericaMembersbsw:ColumbusMember2024-01-012024-12-310001786909ifrs-full:OperatingSegmentsMembersrt:NorthAmericaMembersbsw:PennsylvaniaSiteAndNorthCarolinaSiteMember2024-01-012024-12-310001786909ifrs-full:OperatingSegmentsMembersrt:EuropeMembersbsw:SandouvilleSegmentMember2024-01-012024-12-310001786909ifrs-full:MaterialReconcilingItemsMembersrt:EuropeMember2024-01-012024-12-310001786909ifrs-full:OperatingSegmentsMembercountry:AUsbsw:CenturySegmentMember2024-01-012024-12-310001786909ifrs-full:MaterialReconcilingItemsMembercountry:AU2024-01-012024-12-310001786909ifrs-full:OperatingSegmentsMembersrt:NorthAmericaMembersbsw:PlatinumDivisionSegmentMembersbsw:MarketForMineOutputUndergroundSourceMember2024-01-012024-12-310001786909ifrs-full:OperatingSegmentsMembersrt:NorthAmericaMembersbsw:UndergroundSegmentMembersbsw:MarketForMineOutputUndergroundSourceMember2024-01-012024-12-310001786909ifrs-full:OperatingSegmentsMembersrt:NorthAmericaMembersbsw:TotalUSRecyclingMembersbsw:MarketForMineOutputUndergroundSourceMember2024-01-012024-12-310001786909ifrs-full:OperatingSegmentsMembersrt:NorthAmericaMembersbsw:ColumbusMembersbsw:MarketForMineOutputUndergroundSourceMember2024-01-012024-12-310001786909ifrs-full:OperatingSegmentsMembersrt:NorthAmericaMembersbsw:PennsylvaniaSiteAndNorthCarolinaSiteMembersbsw:MarketForMineOutputUndergroundSourceMember2024-01-012024-12-310001786909ifrs-full:OperatingSegmentsMembersrt:EuropeMembersbsw:SandouvilleSegmentMembersbsw:MarketForMineOutputUndergroundSourceMember2024-01-012024-12-310001786909ifrs-full:MaterialReconcilingItemsMembersrt:EuropeMembersbsw:MarketForMineOutputUndergroundSourceMember2024-01-012024-12-310001786909ifrs-full:OperatingSegmentsMembercountry:AUsbsw:CenturySegmentMembersbsw:MarketForMineOutputUndergroundSourceMember2024-01-012024-12-310001786909ifrs-full:MaterialReconcilingItemsMembercountry:AUsbsw:MarketForMineOutputUndergroundSourceMember2024-01-012024-12-310001786909ifrs-full:OperatingSegmentsMembersrt:NorthAmericaMembersbsw:PlatinumDivisionSegmentMembersbsw:MarketForMineOutputSurfaceSourceMember2024-01-012024-12-310001786909ifrs-full:OperatingSegmentsMembersrt:NorthAmericaMembersbsw:UndergroundSegmentMembersbsw:MarketForMineOutputSurfaceSourceMember2024-01-012024-12-310001786909ifrs-full:OperatingSegmentsMembersrt:NorthAmericaMembersbsw:TotalUSRecyclingMembersbsw:MarketForMineOutputSurfaceSourceMember2024-01-012024-12-310001786909ifrs-full:OperatingSegmentsMembersrt:NorthAmericaMembersbsw:ColumbusMembersbsw:MarketForMineOutputSurfaceSourceMember2024-01-012024-12-310001786909ifrs-full:OperatingSegmentsMembersrt:NorthAmericaMembersbsw:PennsylvaniaSiteAndNorthCarolinaSiteMembersbsw:MarketForMineOutputSurfaceSourceMember2024-01-012024-12-310001786909ifrs-full:OperatingSegmentsMembersrt:EuropeMembersbsw:SandouvilleSegmentMembersbsw:MarketForMineOutputSurfaceSourceMember2024-01-012024-12-310001786909ifrs-full:MaterialReconcilingItemsMembersrt:EuropeMembersbsw:MarketForMineOutputSurfaceSourceMember2024-01-012024-12-310001786909ifrs-full:OperatingSegmentsMembercountry:AUsbsw:CenturySegmentMembersbsw:MarketForMineOutputSurfaceSourceMember2024-01-012024-12-310001786909ifrs-full:MaterialReconcilingItemsMembercountry:AUsbsw:MarketForMineOutputSurfaceSourceMember2024-01-012024-12-310001786909ifrs-full:OperatingSegmentsMembersrt:NorthAmericaMembersbsw:PlatinumDivisionSegmentMembersbsw:MarketForRecycledProductsMember2024-01-012024-12-310001786909ifrs-full:OperatingSegmentsMembersrt:NorthAmericaMembersbsw:UndergroundSegmentMembersbsw:MarketForRecycledProductsMember2024-01-012024-12-310001786909ifrs-full:OperatingSegmentsMembersrt:NorthAmericaMembersbsw:TotalUSRecyclingMembersbsw:MarketForRecycledProductsMember2024-01-012024-12-310001786909ifrs-full:OperatingSegmentsMembersrt:NorthAmericaMembersbsw:ColumbusMembersbsw:MarketForRecycledProductsMember2024-01-012024-12-310001786909ifrs-full:OperatingSegmentsMembersrt:NorthAmericaMembersbsw:PennsylvaniaSiteAndNorthCarolinaSiteMembersbsw:MarketForRecycledProductsMember2024-01-012024-12-310001786909ifrs-full:OperatingSegmentsMembersrt:EuropeMembersbsw:SandouvilleSegmentMembersbsw:MarketForRecycledProductsMember2024-01-012024-12-310001786909ifrs-full:MaterialReconcilingItemsMembersrt:EuropeMembersbsw:MarketForRecycledProductsMember2024-01-012024-12-310001786909ifrs-full:OperatingSegmentsMembercountry:AUsbsw:CenturySegmentMembersbsw:MarketForRecycledProductsMember2024-01-012024-12-310001786909ifrs-full:MaterialReconcilingItemsMembercountry:AUsbsw:MarketForRecycledProductsMember2024-01-012024-12-310001786909srt:NorthAmericaMember2024-01-012024-12-310001786909sbsw:PGMOperationsWorkInProgressMembersrt:NorthAmericaMember2024-01-012024-12-310001786909sbsw:PGMOperationsFinishedGoodsMembersrt:NorthAmericaMember2024-01-012024-12-310001786909ifrs-full:OperatingSegmentsMembersrt:NorthAmericaMembersbsw:UndergroundSegmentMember2023-01-012023-12-310001786909ifrs-full:OperatingSegmentsMembersrt:NorthAmericaMembersbsw:ColumbusMember2023-01-012023-12-310001786909ifrs-full:OperatingSegmentsMembersrt:EuropeMembersbsw:SandouvilleSegmentMember2023-01-012023-12-310001786909ifrs-full:MaterialReconcilingItemsMembersrt:EuropeMember2023-01-012023-12-310001786909ifrs-full:OperatingSegmentsMembercountry:AUsbsw:CenturySegmentMember2023-01-012023-12-310001786909ifrs-full:MaterialReconcilingItemsMembercountry:AU2023-01-012023-12-310001786909ifrs-full:OperatingSegmentsMembersrt:NorthAmericaMembersbsw:UndergroundSegmentMembersbsw:MarketForMineOutputUndergroundSourceMember2023-01-012023-12-310001786909ifrs-full:OperatingSegmentsMembersrt:NorthAmericaMembersbsw:ColumbusMembersbsw:MarketForMineOutputUndergroundSourceMember2023-01-012023-12-310001786909ifrs-full:OperatingSegmentsMembersrt:EuropeMembersbsw:SandouvilleSegmentMembersbsw:MarketForMineOutputUndergroundSourceMember2023-01-012023-12-310001786909ifrs-full:MaterialReconcilingItemsMembersrt:EuropeMembersbsw:MarketForMineOutputUndergroundSourceMember2023-01-012023-12-310001786909ifrs-full:OperatingSegmentsMembercountry:AUsbsw:CenturySegmentMembersbsw:MarketForMineOutputUndergroundSourceMember2023-01-012023-12-310001786909ifrs-full:MaterialReconcilingItemsMembercountry:AUsbsw:MarketForMineOutputUndergroundSourceMember2023-01-012023-12-310001786909ifrs-full:OperatingSegmentsMembersrt:NorthAmericaMembersbsw:UndergroundSegmentMembersbsw:MarketForMineOutputSurfaceSourceMember2023-01-012023-12-310001786909ifrs-full:OperatingSegmentsMembersrt:NorthAmericaMembersbsw:ColumbusMembersbsw:MarketForMineOutputSurfaceSourceMember2023-01-012023-12-310001786909ifrs-full:OperatingSegmentsMembersrt:EuropeMembersbsw:SandouvilleSegmentMembersbsw:MarketForMineOutputSurfaceSourceMember2023-01-012023-12-310001786909ifrs-full:MaterialReconcilingItemsMembersrt:EuropeMembersbsw:MarketForMineOutputSurfaceSourceMember2023-01-012023-12-310001786909ifrs-full:OperatingSegmentsMembercountry:AUsbsw:CenturySegmentMembersbsw:MarketForMineOutputSurfaceSourceMember2023-01-012023-12-310001786909ifrs-full:MaterialReconcilingItemsMembercountry:AUsbsw:MarketForMineOutputSurfaceSourceMember2023-01-012023-12-310001786909ifrs-full:OperatingSegmentsMembersrt:NorthAmericaMembersbsw:UndergroundSegmentMembersbsw:MarketForRecycledProductsMember2023-01-012023-12-310001786909ifrs-full:OperatingSegmentsMembersrt:NorthAmericaMembersbsw:ColumbusMembersbsw:MarketForRecycledProductsMember2023-01-012023-12-310001786909ifrs-full:OperatingSegmentsMembersrt:EuropeMembersbsw:SandouvilleSegmentMembersbsw:MarketForRecycledProductsMember2023-01-012023-12-310001786909ifrs-full:MaterialReconcilingItemsMembersrt:EuropeMembersbsw:MarketForRecycledProductsMember2023-01-012023-12-310001786909ifrs-full:OperatingSegmentsMembercountry:AUsbsw:CenturySegmentMembersbsw:MarketForRecycledProductsMember2023-01-012023-12-310001786909ifrs-full:MaterialReconcilingItemsMembercountry:AUsbsw:MarketForRecycledProductsMember2023-01-012023-12-310001786909srt:NorthAmericaMember2023-01-012023-12-310001786909sbsw:PGMOperationsWorkInProgressMembersrt:NorthAmericaMember2023-01-012023-12-310001786909sbsw:PGMOperationsFinishedGoodsMembersrt:NorthAmericaMember2023-01-012023-12-310001786909sbsw:PgmMiningActivitiesMemberifrs-full:BottomOfRangeMember2025-01-012025-12-310001786909sbsw:PgmMiningActivitiesMemberifrs-full:TopOfRangeMember2025-01-012025-12-310001786909sbsw:ZincMiningActivitiesMemberifrs-full:BottomOfRangeMember2025-01-012025-12-310001786909sbsw:ZincMiningActivitiesMemberifrs-full:TopOfRangeMember2025-01-012025-12-310001786909ifrs-full:GoodsOrServicesTransferredAtPointInTimeMembersbsw:GoldMiningActivitiesMember2025-01-012025-12-310001786909ifrs-full:GoodsOrServicesTransferredAtPointInTimeMembersbsw:GoldMiningActivitiesMember2024-01-012024-12-310001786909ifrs-full:GoodsOrServicesTransferredAtPointInTimeMembersbsw:GoldMiningActivitiesMember2023-01-012023-12-310001786909ifrs-full:GoodsOrServicesTransferredAtPointInTimeMembersbsw:PgmMiningActivitiesMember2025-01-012025-12-310001786909ifrs-full:GoodsOrServicesTransferredAtPointInTimeMembersbsw:PgmMiningActivitiesMember2024-01-012024-12-310001786909ifrs-full:GoodsOrServicesTransferredAtPointInTimeMembersbsw:PgmMiningActivitiesMember2023-01-012023-12-310001786909ifrs-full:GoodsOrServicesTransferredAtPointInTimeMembersbsw:NickelMiningActivitiesMember2025-01-012025-12-310001786909ifrs-full:GoodsOrServicesTransferredAtPointInTimeMembersbsw:NickelMiningActivitiesMember2024-01-012024-12-310001786909ifrs-full:GoodsOrServicesTransferredAtPointInTimeMembersbsw:NickelMiningActivitiesMember2023-01-012023-12-310001786909ifrs-full:GoodsOrServicesTransferredAtPointInTimeMembersbsw:ZincMiningActivitiesMember2025-01-012025-12-310001786909ifrs-full:GoodsOrServicesTransferredAtPointInTimeMembersbsw:ZincMiningActivitiesMember2024-01-012024-12-310001786909ifrs-full:GoodsOrServicesTransferredAtPointInTimeMembersbsw:ZincMiningActivitiesMember2023-01-012023-12-310001786909ifrs-full:GoodsOrServicesTransferredAtPointInTimeMembersbsw:GoldTailingsRetreatmentMember2025-01-012025-12-310001786909ifrs-full:GoodsOrServicesTransferredAtPointInTimeMembersbsw:GoldTailingsRetreatmentMember2024-01-012024-12-310001786909ifrs-full:GoodsOrServicesTransferredAtPointInTimeMembersbsw:GoldTailingsRetreatmentMember2023-01-012023-12-310001786909ifrs-full:GoodsOrServicesTransferredAtPointInTimeMembersbsw:EScrapRecyclingActivitiesMember2025-01-012025-12-310001786909ifrs-full:GoodsOrServicesTransferredAtPointInTimeMembersbsw:EScrapRecyclingActivitiesMember2024-01-012024-12-310001786909ifrs-full:GoodsOrServicesTransferredAtPointInTimeMembersbsw:EScrapRecyclingActivitiesMember2023-01-012023-12-310001786909ifrs-full:GoodsOrServicesTransferredAtPointInTimeMembersbsw:RecyclingActivitiesMember2025-01-012025-12-310001786909ifrs-full:GoodsOrServicesTransferredAtPointInTimeMembersbsw:RecyclingActivitiesMember2024-01-012024-12-310001786909ifrs-full:GoodsOrServicesTransferredAtPointInTimeMembersbsw:RecyclingActivitiesMember2023-01-012023-12-310001786909ifrs-full:GoodsOrServicesTransferredOverTimeMembersbsw:StreamMember2025-01-012025-12-310001786909ifrs-full:GoodsOrServicesTransferredOverTimeMembersbsw:StreamMember2024-01-012024-12-310001786909ifrs-full:GoodsOrServicesTransferredOverTimeMembersbsw:StreamMember2023-01-012023-12-310001786909sbsw:PgmMiningActivitiesMember2025-01-012025-12-310001786909sbsw:PgmMiningActivitiesMember2024-01-012024-12-310001786909sbsw:PgmMiningActivitiesMember2023-01-012023-12-310001786909sbsw:ZincMiningActivitiesMember2025-01-012025-12-310001786909sbsw:ZincMiningActivitiesMember2024-01-012024-12-310001786909sbsw:ZincMiningActivitiesMember2023-01-012023-12-310001786909sbsw:SouthAfricaRegionMember2025-01-012025-12-310001786909sbsw:SouthAfricaRegionMember2023-01-012023-12-310001786909country:US2025-01-012025-12-310001786909country:US2024-01-012024-12-310001786909country:US2023-01-012023-12-310001786909srt:EuropeMember2025-01-012025-12-310001786909srt:EuropeMember2024-01-012024-12-310001786909srt:EuropeMember2023-01-012023-12-310001786909country:AU2025-01-012025-12-310001786909country:AU2024-01-012024-12-310001786909country:AU2023-01-012023-12-310001786909sbsw:GoldMiningActivitiesMember2025-01-012025-12-310001786909sbsw:GoldMiningActivitiesMember2024-01-012024-12-310001786909sbsw:GoldMiningActivitiesMember2023-01-012023-12-310001786909sbsw:PlatinumMiningActivitiesMember2025-01-012025-12-310001786909sbsw:PlatinumMiningActivitiesMember2024-01-012024-12-310001786909sbsw:PlatinumMiningActivitiesMember2023-01-012023-12-310001786909sbsw:PalladiumMiningActivitiesMember2025-01-012025-12-310001786909sbsw:PalladiumMiningActivitiesMember2024-01-012024-12-310001786909sbsw:PalladiumMiningActivitiesMember2023-01-012023-12-310001786909sbsw:RhodiumMiningActivitiesMember2025-01-012025-12-310001786909sbsw:RhodiumMiningActivitiesMember2024-01-012024-12-310001786909sbsw:RhodiumMiningActivitiesMember2023-01-012023-12-310001786909sbsw:IridiumMiningActivitiesMember2025-01-012025-12-310001786909sbsw:IridiumMiningActivitiesMember2024-01-012024-12-310001786909sbsw:IridiumMiningActivitiesMember2023-01-012023-12-310001786909sbsw:RutheniumMiningActivitiesMember2025-01-012025-12-310001786909sbsw:RutheniumMiningActivitiesMember2024-01-012024-12-310001786909sbsw:RutheniumMiningActivitiesMember2023-01-012023-12-310001786909sbsw:ChromeMiningActivitiesMember2025-01-012025-12-310001786909sbsw:ChromeMiningActivitiesMember2024-01-012024-12-310001786909sbsw:ChromeMiningActivitiesMember2023-01-012023-12-310001786909sbsw:NickelMiningActivitiesMember2025-01-012025-12-310001786909sbsw:NickelMiningActivitiesMember2024-01-012024-12-310001786909sbsw:NickelMiningActivitiesMember2023-01-012023-12-310001786909sbsw:SilverMiningActivitiesMember2025-01-012025-12-310001786909sbsw:SilverMiningActivitiesMember2024-01-012024-12-310001786909sbsw:SilverMiningActivitiesMember2023-01-012023-12-310001786909sbsw:OtherProductOrServiceMember2025-01-012025-12-310001786909sbsw:OtherProductOrServiceMember2024-01-012024-12-310001786909sbsw:OtherProductOrServiceMember2023-01-012023-12-310001786909sbsw:CustomerAMemberifrs-full:OperatingSegmentsMembersbsw:PlatinumDivisionPennsylvaniaSiteRecyclingAndNorthCarolinaSiteRecyclingMember2025-01-012025-12-310001786909sbsw:CustomerBMemberifrs-full:OperatingSegmentsMembersbsw:PlatinumDivisionPennsylvaniaSiteRecyclingAndNorthCarolinaSiteRecyclingMember2025-01-012025-12-310001786909sbsw:CustomerCMemberifrs-full:OperatingSegmentsMembersbsw:PlatinumDivisionPennsylvaniaSiteRecyclingAndNorthCarolinaSiteRecyclingMember2025-01-012025-12-310001786909sbsw:CustomerAMemberifrs-full:OperatingSegmentsMembersbsw:PlatinumDivisionPennsylvaniaSiteRecyclingAndNorthCarolinaSiteRecyclingMember2024-01-012024-12-310001786909sbsw:CustomerBMemberifrs-full:OperatingSegmentsMembersbsw:PlatinumDivisionPennsylvaniaSiteRecyclingAndNorthCarolinaSiteRecyclingMember2024-01-012024-12-310001786909sbsw:CustomerCMemberifrs-full:OperatingSegmentsMembersbsw:PlatinumDivisionPennsylvaniaSiteRecyclingAndNorthCarolinaSiteRecyclingMember2024-01-012024-12-310001786909sbsw:CustomerAMemberifrs-full:OperatingSegmentsMembersbsw:PlatinumDivisionPennsylvaniaSiteRecyclingAndNorthCarolinaSiteRecyclingMember2023-01-012023-12-310001786909sbsw:CustomerBMemberifrs-full:OperatingSegmentsMembersbsw:PlatinumDivisionPennsylvaniaSiteRecyclingAndNorthCarolinaSiteRecyclingMember2023-01-012023-12-310001786909sbsw:CustomerCMemberifrs-full:OperatingSegmentsMembersbsw:PlatinumDivisionPennsylvaniaSiteRecyclingAndNorthCarolinaSiteRecyclingMember2023-01-012023-12-310001786909sbsw:CustomerAMemberifrs-full:OperatingSegmentsMembersbsw:PlatinumDivisionSegmentMember2025-01-012025-12-310001786909sbsw:CustomerBMemberifrs-full:OperatingSegmentsMembersbsw:PlatinumDivisionSegmentMember2025-01-012025-12-310001786909sbsw:CustomerCMemberifrs-full:OperatingSegmentsMembersbsw:PlatinumDivisionSegmentMember2025-01-012025-12-310001786909sbsw:CustomerAMemberifrs-full:OperatingSegmentsMembersbsw:PlatinumDivisionSegmentMember2024-01-012024-12-310001786909sbsw:CustomerBMemberifrs-full:OperatingSegmentsMembersbsw:PlatinumDivisionSegmentMember2024-01-012024-12-310001786909sbsw:CustomerCMemberifrs-full:OperatingSegmentsMembersbsw:PlatinumDivisionSegmentMember2024-01-012024-12-310001786909sbsw:CustomerAMemberifrs-full:OperatingSegmentsMembersbsw:PlatinumDivisionSegmentMember2023-01-012023-12-310001786909sbsw:CustomerBMemberifrs-full:OperatingSegmentsMembersbsw:PlatinumDivisionSegmentMember2023-01-012023-12-310001786909sbsw:CustomerCMemberifrs-full:OperatingSegmentsMembersbsw:PlatinumDivisionSegmentMember2023-01-012023-12-310001786909sbsw:CustomerAMemberifrs-full:OperatingSegmentsMembersbsw:SouthAfricaRegionMembersbsw:GoldDivisionSegmentMember2025-01-012025-12-310001786909sbsw:CustomerBMemberifrs-full:OperatingSegmentsMembersbsw:SouthAfricaRegionMembersbsw:GoldDivisionSegmentMember2025-01-012025-12-310001786909sbsw:CustomerCMemberifrs-full:OperatingSegmentsMembersbsw:SouthAfricaRegionMembersbsw:GoldDivisionSegmentMember2025-01-012025-12-310001786909sbsw:CustomerAMemberifrs-full:OperatingSegmentsMembersbsw:SouthAfricaRegionMembersbsw:GoldDivisionSegmentMember2024-01-012024-12-310001786909sbsw:CustomerBMemberifrs-full:OperatingSegmentsMembersbsw:SouthAfricaRegionMembersbsw:GoldDivisionSegmentMember2024-01-012024-12-310001786909sbsw:CustomerCMemberifrs-full:OperatingSegmentsMembersbsw:SouthAfricaRegionMembersbsw:GoldDivisionSegmentMember2024-01-012024-12-310001786909sbsw:CustomerAMemberifrs-full:OperatingSegmentsMembersbsw:SouthAfricaRegionMembersbsw:GoldDivisionSegmentMember2023-01-012023-12-310001786909sbsw:CustomerBMemberifrs-full:OperatingSegmentsMembersbsw:SouthAfricaRegionMembersbsw:GoldDivisionSegmentMember2023-01-012023-12-310001786909sbsw:CustomerCMemberifrs-full:OperatingSegmentsMembersbsw:SouthAfricaRegionMembersbsw:GoldDivisionSegmentMember2023-01-012023-12-310001786909ifrs-full:CurrencyRiskMember2025-01-012025-12-310001786909sbsw:MarketForRecycledProductsMember2025-01-012025-12-310001786909sbsw:Section45XCreditRelatedTo2023And2024Member2025-01-012025-12-310001786909sbsw:Section45XCreditRelatedTo2023And2024Member2024-01-012024-12-310001786909sbsw:Section45XCreditRelatedTo2023And2024Member2023-01-012023-12-310001786909sbsw:Section45XCreditRelatedTo2025PrimaryMiningMember2025-01-012025-12-310001786909sbsw:Section45XCreditRelatedTo2025PrimaryMiningMember2024-01-012024-12-310001786909sbsw:Section45XCreditRelatedTo2025PrimaryMiningMember2023-01-012023-12-310001786909sbsw:Section45XCreditRelatedTo2025RecyclingMember2025-01-012025-12-310001786909sbsw:Section45XCreditRelatedTo2025RecyclingMember2024-01-012024-12-310001786909sbsw:Section45XCreditRelatedTo2025RecyclingMember2023-01-012023-12-310001786909sbsw:PGMOperationsWorkInProgressMember2025-01-012025-12-310001786909sbsw:PGMOperationsWorkInProgressMember2024-01-012024-12-310001786909sbsw:PGMOperationsWorkInProgressMember2023-01-012023-12-310001786909sbsw:PGMOperationsFinishedGoodsMember2025-01-012025-12-310001786909sbsw:PGMOperationsFinishedGoodsMember2024-01-012024-12-310001786909sbsw:PGMOperationsFinishedGoodsMember2023-01-012023-12-310001786909sbsw:Section45XCredits2023Member2025-01-012025-12-310001786909sbsw:Section45XCredits2024Member2025-01-012025-12-310001786909sbsw:Section45XCreditRelatedTo2023PrimaryMiningMember2025-01-012025-12-310001786909sbsw:Section45XCreditRelatedTo2023RecyclingMember2025-01-012025-12-310001786909sbsw:Section45XCreditRelatedTo2024PrimaryMiningMember2025-01-012025-12-310001786909sbsw:Section45XCreditRelatedTo2024RecyclingMember2025-01-012025-12-310001786909sbsw:WheatonPreciousMetalsInternationalMemberifrs-full:GoodsOrServicesTransferredOverTimeMember2025-01-012025-12-310001786909sbsw:WheatonPreciousMetalsInternationalMemberifrs-full:GoodsOrServicesTransferredOverTimeMember2024-01-012024-12-310001786909sbsw:WheatonPreciousMetalsInternationalMemberifrs-full:GoodsOrServicesTransferredOverTimeMember2023-01-012023-12-310001786909sbsw:Sibanye2020SharePlanFSUMembersbsw:SouthAfricanParticipantsMember2025-01-012025-12-310001786909sbsw:Sibanye2020SharePlanFSUMembersbsw:UnitedStatesParticipantsMember2025-01-012025-12-310001786909sbsw:Sibanye2020SharePlanFSUMembersbsw:ParticipantsInOtherJuridictionsMember2025-01-012025-12-310001786909sbsw:Sibanye2020SharePlanFSUMember2025-01-012025-12-310001786909sbsw:Sibanye2020SharePlanFSUMembersbsw:FirstTrancheMember2025-01-012025-12-310001786909sbsw:Sibanye2020SharePlanFSUMembersbsw:SecondTrancheMember2025-01-012025-12-310001786909sbsw:Sibanye2020SharePlanCSUMembersbsw:SouthAfricanParticipantsMember2025-01-012025-12-310001786909sbsw:Sibanye2020SharePlanCSUMembersbsw:ParticipantsInOtherJuridictionsMember2025-01-012025-12-310001786909sbsw:Sibanye2020SharePlanCSUMember2025-01-012025-12-310001786909sbsw:Sibanye2020SharePlanCSUMember2025-12-310001786909sbsw:Sibanye2020SharePlanMember2025-01-012025-12-310001786909sbsw:Sibanye2020SharePlanMember2025-12-310001786909sbsw:Sibanye2020SharePlanMembersbsw:TotalShareholderReturnAt0Member2025-12-310001786909sbsw:Sibanye2020SharePlanMembersbsw:TotalShareholderReturnAt10Member2025-12-310001786909sbsw:Sibanye2020SharePlanMembersbsw:TotalShareholderReturnAt20Member2025-12-310001786909sbsw:Sibanye2020SharePlanMembersbsw:TotalShareholderReturnAt30Member2025-12-310001786909sbsw:Sibanye2020SharePlanMembersbsw:TotalShareholderReturnAt40Member2025-12-310001786909sbsw:Sibanye2020SharePlanMembersbsw:TotalShareholderReturnAt50Member2025-12-310001786909sbsw:Sibanye2020SharePlanMembersbsw:TotalShareholderReturnAt60Member2025-12-310001786909sbsw:Sibanye2020SharePlanMembersbsw:TotalShareholderReturnAt70Member2025-12-310001786909sbsw:Sibanye2020SharePlanMembersbsw:TotalShareholderReturnAt80Member2025-12-310001786909sbsw:Sibanye2020SharePlanMembersbsw:TotalShareholderReturnAt90Member2025-12-310001786909sbsw:Sibanye2020SharePlanMembersbsw:TotalShareholderReturnAt100Member2025-12-310001786909sbsw:Sibanye2020SharePlanMembersbsw:ROCEKeMember2025-01-012025-12-310001786909sbsw:Sibanye2020SharePlanMembersbsw:ROCEKeMember2025-12-310001786909sbsw:ROCEKeMembersbsw:Sibanye2020SharePlanMemberifrs-full:TopOfRangeMember2025-12-310001786909sbsw:Sibanye2020SharePlanMembersbsw:ReturnOnCapitalEmployedLessThanCostOfCapitalMember2025-12-310001786909sbsw:Sibanye2020SharePlanMembersbsw:ReturnOnCapitalEmployedAtCostOfCapitalPlus1Member2025-12-310001786909sbsw:Sibanye2020SharePlanMembersbsw:ReturnOnCapitalEmployedAtCostOfCapitalPlus2Member2025-12-310001786909sbsw:Sibanye2020SharePlanMembersbsw:ReturnOnCapitalEmployedAtCostOfCapitalPlus3Member2025-12-310001786909sbsw:Sibanye2020SharePlanMembersbsw:ReturnOnCapitalEmployedAtCostOfCapitalPlus4Member2025-12-310001786909sbsw:Sibanye2020SharePlanMembersbsw:ReturnOnCapitalEmployedAtCostOfCapitalPlus5Member2025-12-310001786909sbsw:Sibanye2020SharePlanMembersbsw:ReturnOnCapitalEmployedAtCostOfCapitalPlus6Member2025-12-310001786909ifrs-full:TopOfRangeMember2025-01-012025-12-310001786909sbsw:TotalShareholderReturnMember2025-01-012025-12-310001786909sbsw:ReturnOnInvestedCapitalROICMember2025-01-012025-12-310001786909sbsw:EnvironmentalSocialAndGovernanceESGMember2025-01-012025-12-310001786909sbsw:SibanyeStillwater2022SharePlanAndMinimumShareholdingRequirementPlanConditionalSharesMember2022-01-012022-12-310001786909sbsw:SibanyeStillwater2022SharePlanAndMinimumShareholdingRequirementPlanConditionalSharesMember2023-01-012023-12-310001786909sbsw:SibanyeStillwater2023SharePlanAndMinimumShareholdingRequirementPlanForfeitableSharesMember2025-01-012025-12-310001786909sbsw:SibanyeStillwater2025SharePlanAndMinimumShareholdingRequirementPlanForfeitableSharesMember2025-01-012025-12-310001786909sbsw:SibanyeStillwaterMinimumShareholdingRequirementPlanMemberifrs-full:BottomOfRangeMember2025-01-012025-12-310001786909sbsw:SibanyeStillwaterMinimumShareholdingRequirementPlanMemberifrs-full:TopOfRangeMember2025-01-012025-12-310001786909sbsw:SibanyeStillwaterMinimumShareholdingRequirementPlanMember2025-01-012025-12-310001786909sbsw:SibanyeStillwater2020SharePlanConditionalSharesMember2022-12-310001786909sbsw:SibanyeStillwater2020SharePlanConditionalSharesMember2023-12-310001786909sbsw:SibanyeStillwater2020SharePlanConditionalSharesMember2024-12-310001786909sbsw:SibanyeStillwater2020SharePlanForfeitableSharesMember2024-12-310001786909sbsw:SibanyeStillwater2020SharePlanForfeitableSharesMember2023-12-310001786909sbsw:SibanyeStillwater2020SharePlanForfeitableSharesMember2022-12-310001786909sbsw:SibanyeStillwater2020SharePlanConditionalSharesMember2023-01-012023-12-310001786909sbsw:SibanyeStillwater2020SharePlanConditionalSharesMember2024-01-012024-12-310001786909sbsw:SibanyeStillwater2020SharePlanConditionalSharesMember2025-01-012025-12-310001786909sbsw:SibanyeStillwater2020SharePlanForfeitableSharesMember2025-01-012025-12-310001786909sbsw:SibanyeStillwater2020SharePlanForfeitableSharesMember2024-01-012024-12-310001786909sbsw:SibanyeStillwater2020SharePlanForfeitableSharesMember2023-01-012023-12-310001786909sbsw:SibanyeStillwater2020SharePlanConditionalSharesMember2025-12-310001786909sbsw:SibanyeStillwater2020SharePlanForfeitableSharesMember2025-12-310001786909sbsw:SibanyeStillwater2021SharePlanConditionalSharesMember2022-12-310001786909sbsw:SibanyeStillwater2021SharePlanConditionalSharesMember2023-12-310001786909sbsw:SibanyeStillwater2021SharePlanConditionalSharesMember2024-12-310001786909sbsw:SibanyeStillwater2021SharePlanForfeitableSharesMember2024-12-310001786909sbsw:SibanyeStillwater2021SharePlanForfeitableSharesMember2023-12-310001786909sbsw:SibanyeStillwater2021SharePlanForfeitableSharesMember2022-12-310001786909sbsw:SibanyeStillwater2021SharePlanConditionalSharesMember2023-01-012023-12-310001786909sbsw:SibanyeStillwater2021SharePlanConditionalSharesMember2024-01-012024-12-310001786909sbsw:SibanyeStillwater2021SharePlanConditionalSharesMember2025-01-012025-12-310001786909sbsw:SibanyeStillwater2021SharePlanForfeitableSharesMember2025-01-012025-12-310001786909sbsw:SibanyeStillwater2021SharePlanForfeitableSharesMember2024-01-012024-12-310001786909sbsw:SibanyeStillwater2021SharePlanForfeitableSharesMember2023-01-012023-12-310001786909sbsw:SibanyeStillwater2021SharePlanConditionalSharesMember2025-12-310001786909sbsw:SibanyeStillwater2021SharePlanForfeitableSharesMember2025-12-310001786909sbsw:SibanyeStillwater2022SharePlanAndMinimumShareholdingRequirementPlanConditionalSharesMember2022-12-310001786909sbsw:SibanyeStillwater2022SharePlanAndMinimumShareholdingRequirementPlanConditionalSharesMember2023-12-310001786909sbsw:SibanyeStillwater2022SharePlanAndMinimumShareholdingRequirementPlanConditionalSharesMember2024-12-310001786909sbsw:SibanyeStillwater2022SharePlanAndMinimumShareholdingRequirementPlanForfeitableSharesMember2024-12-310001786909sbsw:SibanyeStillwater2022SharePlanAndMinimumShareholdingRequirementPlanForfeitableSharesMember2023-12-310001786909sbsw:SibanyeStillwater2022SharePlanAndMinimumShareholdingRequirementPlanForfeitableSharesMember2022-12-310001786909sbsw:SibanyeStillwater2022SharePlanAndMinimumShareholdingRequirementPlanConditionalSharesMember2024-01-012024-12-310001786909sbsw:SibanyeStillwater2022SharePlanAndMinimumShareholdingRequirementPlanConditionalSharesMember2025-01-012025-12-310001786909sbsw:SibanyeStillwater2022SharePlanAndMinimumShareholdingRequirementPlanForfeitableSharesMember2025-01-012025-12-310001786909sbsw:SibanyeStillwater2022SharePlanAndMinimumShareholdingRequirementPlanForfeitableSharesMember2024-01-012024-12-310001786909sbsw:SibanyeStillwater2022SharePlanAndMinimumShareholdingRequirementPlanForfeitableSharesMember2023-01-012023-12-310001786909sbsw:SibanyeStillwater2022SharePlanAndMinimumShareholdingRequirementPlanConditionalSharesMember2025-12-310001786909sbsw:SibanyeStillwater2022SharePlanAndMinimumShareholdingRequirementPlanForfeitableSharesMember2025-12-310001786909sbsw:SibanyeStillwater2023SharePlanAndMinimumShareholdingRequirementPlanConditionalSharesMember2022-12-310001786909sbsw:SibanyeStillwater2023SharePlanAndMinimumShareholdingRequirementPlanConditionalSharesMember2023-12-310001786909sbsw:SibanyeStillwater2023SharePlanAndMinimumShareholdingRequirementPlanConditionalSharesMember2024-12-310001786909sbsw:SibanyeStillwater2023SharePlanAndMinimumShareholdingRequirementPlanForfeitableSharesMember2024-12-310001786909sbsw:SibanyeStillwater2023SharePlanAndMinimumShareholdingRequirementPlanForfeitableSharesMember2023-12-310001786909sbsw:SibanyeStillwater2023SharePlanAndMinimumShareholdingRequirementPlanForfeitableSharesMember2022-12-310001786909sbsw:SibanyeStillwater2023SharePlanAndMinimumShareholdingRequirementPlanConditionalSharesMember2023-01-012023-12-310001786909sbsw:SibanyeStillwater2023SharePlanAndMinimumShareholdingRequirementPlanConditionalSharesMember2024-01-012024-12-310001786909sbsw:SibanyeStillwater2023SharePlanAndMinimumShareholdingRequirementPlanConditionalSharesMember2025-01-012025-12-310001786909sbsw:SibanyeStillwater2023SharePlanAndMinimumShareholdingRequirementPlanForfeitableSharesMember2024-01-012024-12-310001786909sbsw:SibanyeStillwater2023SharePlanAndMinimumShareholdingRequirementPlanForfeitableSharesMember2023-01-012023-12-310001786909sbsw:SibanyeStillwater2023SharePlanAndMinimumShareholdingRequirementPlanConditionalSharesMember2025-12-310001786909sbsw:SibanyeStillwater2023SharePlanAndMinimumShareholdingRequirementPlanForfeitableSharesMember2025-12-310001786909sbsw:SibanyeStillwater2024SharePlanAndMinimumShareholdingRequirementPlanConditionalSharesMember2022-12-310001786909sbsw:SibanyeStillwater2024SharePlanAndMinimumShareholdingRequirementPlanConditionalSharesMember2023-12-310001786909sbsw:SibanyeStillwater2024SharePlanAndMinimumShareholdingRequirementPlanConditionalSharesMember2024-12-310001786909sbsw:SibanyeStillwater2024SharePlanAndMinimumShareholdingRequirementPlanForfeitableSharesMember2024-12-310001786909sbsw:SibanyeStillwater2024SharePlanAndMinimumShareholdingRequirementPlanForfeitableSharesMember2023-12-310001786909sbsw:SibanyeStillwater2024SharePlanAndMinimumShareholdingRequirementPlanForfeitableSharesMember2022-12-310001786909sbsw:SibanyeStillwater2024SharePlanAndMinimumShareholdingRequirementPlanConditionalSharesMember2023-01-012023-12-310001786909sbsw:SibanyeStillwater2024SharePlanAndMinimumShareholdingRequirementPlanConditionalSharesMember2024-01-012024-12-310001786909sbsw:SibanyeStillwater2024SharePlanAndMinimumShareholdingRequirementPlanConditionalSharesMember2025-01-012025-12-310001786909sbsw:SibanyeStillwater2024SharePlanAndMinimumShareholdingRequirementPlanForfeitableSharesMember2025-01-012025-12-310001786909sbsw:SibanyeStillwater2024SharePlanAndMinimumShareholdingRequirementPlanForfeitableSharesMember2024-01-012024-12-310001786909sbsw:SibanyeStillwater2024SharePlanAndMinimumShareholdingRequirementPlanForfeitableSharesMember2023-01-012023-12-310001786909sbsw:SibanyeStillwater2024SharePlanAndMinimumShareholdingRequirementPlanConditionalSharesMember2025-12-310001786909sbsw:SibanyeStillwater2024SharePlanAndMinimumShareholdingRequirementPlanForfeitableSharesMember2025-12-310001786909sbsw:SibanyeStillwater2025SharePlanAndMinimumShareholdingRequirementPlanConditionalSharesMember2022-12-310001786909sbsw:SibanyeStillwater2025SharePlanAndMinimumShareholdingRequirementPlanConditionalSharesMember2023-12-310001786909sbsw:SibanyeStillwater2025SharePlanAndMinimumShareholdingRequirementPlanConditionalSharesMember2024-12-310001786909sbsw:SibanyeStillwater2025SharePlanAndMinimumShareholdingRequirementPlanForfeitableSharesMember2024-12-310001786909sbsw:SibanyeStillwater2025SharePlanAndMinimumShareholdingRequirementPlanForfeitableSharesMember2023-12-310001786909sbsw:SibanyeStillwater2025SharePlanAndMinimumShareholdingRequirementPlanForfeitableSharesMember2022-12-310001786909sbsw:SibanyeStillwater2025SharePlanAndMinimumShareholdingRequirementPlanConditionalSharesMember2023-01-012023-12-310001786909sbsw:SibanyeStillwater2025SharePlanAndMinimumShareholdingRequirementPlanConditionalSharesMember2024-01-012024-12-310001786909sbsw:SibanyeStillwater2025SharePlanAndMinimumShareholdingRequirementPlanConditionalSharesMember2025-01-012025-12-310001786909sbsw:SibanyeStillwater2025SharePlanAndMinimumShareholdingRequirementPlanForfeitableSharesMember2024-01-012024-12-310001786909sbsw:SibanyeStillwater2025SharePlanAndMinimumShareholdingRequirementPlanForfeitableSharesMember2023-01-012023-12-310001786909sbsw:SibanyeStillwater2025SharePlanAndMinimumShareholdingRequirementPlanConditionalSharesMember2025-12-310001786909sbsw:SibanyeStillwater2025SharePlanAndMinimumShareholdingRequirementPlanForfeitableSharesMember2025-12-310001786909sbsw:SibanyeStillwaterMinimumShareholdingRequirementPlanConditionalAndMatchingShareUnitsMemberifrs-full:BottomOfRangeMember2023-01-012023-12-310001786909sbsw:SibanyeStillwaterMinimumShareholdingRequirementPlanConditionalAndMatchingShareUnitsMemberifrs-full:TopOfRangeMember2023-01-012023-12-310001786909sbsw:SibanyeStillwaterMinimumShareholdingRequirementPlanConditionalAndMatchingShareUnitsMemberifrs-full:BottomOfRangeMember2024-01-012024-12-310001786909sbsw:SibanyeStillwaterMinimumShareholdingRequirementPlanConditionalAndMatchingShareUnitsMemberifrs-full:TopOfRangeMember2024-01-012024-12-310001786909sbsw:SibanyeStillwaterMinimumShareholdingRequirementPlanConditionalAndMatchingShareUnitsMemberifrs-full:BottomOfRangeMember2025-01-012025-12-310001786909sbsw:SibanyeStillwaterMinimumShareholdingRequirementPlanConditionalAndMatchingShareUnitsMemberifrs-full:TopOfRangeMember2025-01-012025-12-310001786909sbsw:SibanyeStillwaterMinimumShareholdingRequirementPlanForfeitableShareUnitsMember2025-01-012025-12-310001786909sbsw:SibanyeStillwaterMinimumShareholdingRequirementPlanForfeitableShareUnitsMember2024-01-012024-12-310001786909sbsw:SibanyeStillwaterMinimumShareholdingRequirementPlanForfeitableShareUnitsMember2023-01-012023-12-310001786909sbsw:SibanyeStillwaterMinimumShareholdingRequirementPlanForfeitableShareUnitsMemberifrs-full:BottomOfRangeMember2025-01-012025-12-310001786909sbsw:SibanyeStillwaterMinimumShareholdingRequirementPlanForfeitableShareUnitsMemberifrs-full:TopOfRangeMember2025-01-012025-12-310001786909sbsw:SibanyeStillwaterMinimumShareholdingRequirementPlanForfeitableShareUnitsMemberifrs-full:BottomOfRangeMember2024-01-012024-12-310001786909sbsw:SibanyeStillwaterMinimumShareholdingRequirementPlanForfeitableShareUnitsMemberifrs-full:TopOfRangeMember2024-01-012024-12-310001786909sbsw:SibanyeStillwaterMinimumShareholdingRequirementPlanForfeitableShareUnitsMemberifrs-full:BottomOfRangeMember2023-01-012023-12-310001786909sbsw:SibanyeStillwaterMinimumShareholdingRequirementPlanForfeitableShareUnitsMemberifrs-full:TopOfRangeMember2023-01-012023-12-310001786909sbsw:SibanyeStillwaterMinimumShareholdingRequirementPlanConditionalAndMatchingShareUnitsMember2023-01-012023-12-310001786909sbsw:SibanyeStillwaterMinimumShareholdingRequirementPlanConditionalAndMatchingShareUnitsMember2024-01-012024-12-310001786909sbsw:SibanyeStillwaterMinimumShareholdingRequirementPlanConditionalAndMatchingShareUnitsMember2025-01-012025-12-310001786909sbsw:SibanyeStillwaterMinimumShareholdingRequirementPlanMembersbsw:RichardStewartMember2024-12-310001786909sbsw:SibanyeStillwaterMinimumShareholdingRequirementPlanMembersbsw:RichardStewartMember2025-01-012025-12-310001786909sbsw:SibanyeStillwaterMinimumShareholdingRequirementPlanMembersbsw:RichardStewartMember2025-12-310001786909sbsw:SibanyeStillwaterMinimumShareholdingRequirementPlanMembersbsw:NealFronemanMember2024-12-310001786909sbsw:SibanyeStillwaterMinimumShareholdingRequirementPlanMembersbsw:NealFronemanMember2025-01-012025-12-310001786909sbsw:SibanyeStillwaterMinimumShareholdingRequirementPlanMembersbsw:NealFronemanMember2025-12-310001786909sbsw:SibanyeStillwaterMinimumShareholdingRequirementPlanMembersbsw:CharlKeyterMember2024-12-310001786909sbsw:SibanyeStillwaterMinimumShareholdingRequirementPlanMembersbsw:CharlKeyterMember2025-01-012025-12-310001786909sbsw:SibanyeStillwaterMinimumShareholdingRequirementPlanMembersbsw:CharlKeyterMember2025-12-310001786909sbsw:SibanyeStillwaterMinimumShareholdingRequirementPlanMembersbsw:CharlesCarterMember2024-12-310001786909sbsw:SibanyeStillwaterMinimumShareholdingRequirementPlanMembersbsw:CharlesCarterMember2025-01-012025-12-310001786909sbsw:SibanyeStillwaterMinimumShareholdingRequirementPlanMembersbsw:CharlesCarterMember2025-12-310001786909sbsw:SibanyeStillwaterMinimumShareholdingRequirementPlanMembersbsw:MikaSeitovirtaMember2024-12-310001786909sbsw:SibanyeStillwaterMinimumShareholdingRequirementPlanMembersbsw:MikaSeitovirtaMember2025-01-012025-12-310001786909sbsw:SibanyeStillwaterMinimumShareholdingRequirementPlanMembersbsw:MikaSeitovirtaMember2025-12-310001786909sbsw:SibanyeStillwaterMinimumShareholdingRequirementPlanMembersbsw:ThembaNkosiMember2024-12-310001786909sbsw:SibanyeStillwaterMinimumShareholdingRequirementPlanMembersbsw:ThembaNkosiMember2025-01-012025-12-310001786909sbsw:SibanyeStillwaterMinimumShareholdingRequirementPlanMembersbsw:ThembaNkosiMember2025-12-310001786909sbsw:SibanyeStillwaterMinimumShareholdingRequirementPlanMembersbsw:MelanieNaidooVermaakMember2024-12-310001786909sbsw:SibanyeStillwaterMinimumShareholdingRequirementPlanMembersbsw:MelanieNaidooVermaakMember2025-01-012025-12-310001786909sbsw:SibanyeStillwaterMinimumShareholdingRequirementPlanMembersbsw:MelanieNaidooVermaakMember2025-12-310001786909sbsw:SibanyeStillwaterMinimumShareholdingRequirementPlanMembersbsw:RichardCoxMember2024-12-310001786909sbsw:SibanyeStillwaterMinimumShareholdingRequirementPlanMembersbsw:RichardCoxMember2025-01-012025-12-310001786909sbsw:SibanyeStillwaterMinimumShareholdingRequirementPlanMembersbsw:RichardCoxMember2025-12-310001786909sbsw:SibanyeStillwaterMinimumShareholdingRequirementPlanMembersbsw:LaurentCharbonnierMember2024-12-310001786909sbsw:SibanyeStillwaterMinimumShareholdingRequirementPlanMembersbsw:LaurentCharbonnierMember2025-01-012025-12-310001786909sbsw:SibanyeStillwaterMinimumShareholdingRequirementPlanMembersbsw:LaurentCharbonnierMember2025-12-310001786909sbsw:SibanyeStillwaterMinimumShareholdingRequirementPlanMembersbsw:LeratoLegongMember2024-12-310001786909sbsw:SibanyeStillwaterMinimumShareholdingRequirementPlanMembersbsw:LeratoLegongMember2025-01-012025-12-310001786909sbsw:SibanyeStillwaterMinimumShareholdingRequirementPlanMembersbsw:LeratoLegongMember2025-12-310001786909sbsw:SibanyeStillwaterMinimumShareholdingRequirementPlanMembersbsw:MduBhuloseMember2024-12-310001786909sbsw:SibanyeStillwaterMinimumShareholdingRequirementPlanMembersbsw:MduBhuloseMember2025-01-012025-12-310001786909sbsw:SibanyeStillwaterMinimumShareholdingRequirementPlanMembersbsw:MduBhuloseMember2025-12-310001786909sbsw:SibanyeStillwaterMinimumShareholdingRequirementPlanMembersbsw:RobertVanNiekerkMember2024-12-310001786909sbsw:SibanyeStillwaterMinimumShareholdingRequirementPlanMembersbsw:RobertVanNiekerkMember2025-01-012025-12-310001786909sbsw:SibanyeStillwaterMinimumShareholdingRequirementPlanMembersbsw:RobertVanNiekerkMember2025-12-310001786909sbsw:DRDGoldEquitySettledSchemeMember2025-01-012025-12-310001786909sbsw:TotalShareholderReturnHurdleRateMembersbsw:DRDGoldEquitySettledSchemeMember2025-01-012025-12-310001786909sbsw:TotalShareholderReturnGroupCompaniesMembersbsw:DRDGoldEquitySettledSchemeMember2025-01-012025-12-310001786909sbsw:DRDGoldEquitySettledSchemeMembersbsw:FBandMember2025-01-012025-12-310001786909sbsw:DRDGoldEquitySettledSchemeMembersbsw:EAndDBandsMember2025-01-012025-12-310001786909sbsw:ShareBasedPaymentOnBBBEETransactionMember2025-01-012025-12-310001786909sbsw:ShareBasedPaymentOnBBBEETransactionMembersbsw:SibanyeRustenburgPlatinumMinesProprietaryLimitedSubsidiaryMember2025-01-012025-12-310001786909sbsw:ShareBasedPaymentOnBBBEETransactionMembersbsw:SibanyeRustenburgPlatinumMinesProprietaryLimitedSubsidiaryMember2025-12-310001786909sbsw:SibanyeRustenburgPlatinumMinesProprietaryLimitedSubsidiaryMembersbsw:RustenburgMineCommunityTrustMembersbsw:ShareBasedPaymentOnBBBEETransactionMembersrt:ProFormaMember2025-12-310001786909sbsw:SibanyeRustenburgPlatinumMinesProprietaryLimitedSubsidiaryMembersbsw:RustenburgMineCommunityTrustMembersbsw:ShareBasedPaymentOnBBBEETransactionMembersrt:ProFormaMember2024-12-310001786909sbsw:SibanyeRustenburgPlatinumMinesProprietaryLimitedSubsidiaryMembersbsw:RustenburgMineCommunityTrustMembersbsw:ShareBasedPaymentOnBBBEETransactionMembersrt:ProFormaMember2023-12-310001786909sbsw:SibanyeRustenburgPlatinumMinesProprietaryLimitedSubsidiaryMembersbsw:RustenburgMineEmployeesTrustMembersbsw:ShareBasedPaymentOnBBBEETransactionMembersrt:ProFormaMember2025-12-310001786909sbsw:SibanyeRustenburgPlatinumMinesProprietaryLimitedSubsidiaryMembersbsw:RustenburgMineEmployeesTrustMembersbsw:ShareBasedPaymentOnBBBEETransactionMembersrt:ProFormaMember2024-12-310001786909sbsw:SibanyeRustenburgPlatinumMinesProprietaryLimitedSubsidiaryMembersbsw:RustenburgMineEmployeesTrustMembersbsw:ShareBasedPaymentOnBBBEETransactionMembersrt:ProFormaMember2023-12-310001786909sbsw:PhembaniGroupMembersbsw:MarikanaOperationsSegmentMembersbsw:ShareBasedPaymentOnBBBEETransactionMember2025-01-012025-12-310001786909sbsw:MarikanaShareholdersMembersbsw:MarikanaOperationsSegmentMembersbsw:ShareBasedPaymentOnBBBEETransactionMember2025-01-012025-12-310001786909sbsw:MarikanaOperationsSegmentMembersbsw:ShareBasedPaymentOnBBBEETransactionMembersrt:ProFormaMember2025-12-310001786909sbsw:MarikanaOperationsSegmentMembersbsw:ShareBasedPaymentOnBBBEETransactionMembersrt:ProFormaMember2024-12-310001786909sbsw:MarikanaOperationsSegmentMembersbsw:ShareBasedPaymentOnBBBEETransactionMembersrt:ProFormaMember2023-12-310001786909sbsw:MarikanaOperationsSegmentMembersbsw:ShareBasedPaymentOnBBBEETransactionMember2025-01-012025-12-310001786909sbsw:MarikanaOperationsSegmentMembersbsw:ShareBasedPaymentOnBBBEETransactionMember2024-01-012024-12-310001786909sbsw:MarikanaOperationsSegmentMembersbsw:ShareBasedPaymentOnBBBEETransactionMember2023-01-012023-12-310001786909country:ZAsbsw:MarikanaOperationsSegmentMembersbsw:ShareBasedPaymentOnBBBEETransactionMember2025-12-310001786909country:ZAsbsw:MarikanaOperationsSegmentMembersbsw:ShareBasedPaymentOnBBBEETransactionMember2024-12-310001786909country:ZAsbsw:MarikanaOperationsSegmentMembersbsw:ShareBasedPaymentOnBBBEETransactionMemberifrs-full:BottomOfRangeMember2023-12-310001786909country:ZAsbsw:MarikanaOperationsSegmentMembersbsw:ShareBasedPaymentOnBBBEETransactionMemberifrs-full:TopOfRangeMember2023-12-310001786909country:ZAsbsw:MarikanaOperationsSegmentMembersbsw:ShareBasedPaymentOnBBBEETransactionMember2023-12-310001786909sbsw:MarikanaOperationsSegmentMembersbsw:ShareBasedPaymentOnBBBEETransactionMemberifrs-full:BottomOfRangeMember2025-01-012025-12-310001786909sbsw:MarikanaOperationsSegmentMembersbsw:ShareBasedPaymentOnBBBEETransactionMemberifrs-full:TopOfRangeMember2025-01-012025-12-310001786909sbsw:MarikanaOperationsSegmentMembersbsw:ShareBasedPaymentOnBBBEETransactionMemberifrs-full:BottomOfRangeMember2024-01-012024-12-310001786909sbsw:MarikanaOperationsSegmentMembersbsw:ShareBasedPaymentOnBBBEETransactionMemberifrs-full:TopOfRangeMember2024-01-012024-12-310001786909sbsw:MarikanaOperationsSegmentMembersbsw:ShareBasedPaymentOnBBBEETransactionMemberifrs-full:BottomOfRangeMember2023-01-012023-12-310001786909sbsw:MarikanaOperationsSegmentMembersbsw:ShareBasedPaymentOnBBBEETransactionMemberifrs-full:TopOfRangeMember2023-01-012023-12-310001786909sbsw:KeliberOyMember2025-12-310001786909sbsw:KeliberOyMember2024-12-310001786909sbsw:KeliberOyMember2023-12-310001786909sbsw:ShareBasedPaymentArrangementsOtherThanBeeTransactionMember2025-01-012025-12-310001786909sbsw:ShareBasedPaymentArrangementsOtherThanBeeTransactionMember2024-01-012024-12-310001786909sbsw:ShareBasedPaymentArrangementsOtherThanBeeTransactionMember2023-01-012023-12-310001786909sbsw:RustenburgOperationsSegmentMembersbsw:ShareBasedPaymentOnBBBEETransactionMember2025-12-310001786909sbsw:RustenburgOperationsSegmentMembersbsw:ShareBasedPaymentOnBBBEETransactionMember2024-12-310001786909sbsw:RustenburgOperationsSegmentMembersbsw:ShareBasedPaymentOnBBBEETransactionMember2023-12-310001786909sbsw:MarikanaOperationsSegmentMembersbsw:ShareBasedPaymentOnBBBEETransactionMember2025-12-310001786909sbsw:MarikanaOperationsSegmentMembersbsw:ShareBasedPaymentOnBBBEETransactionMember2024-12-310001786909sbsw:MarikanaOperationsSegmentMembersbsw:ShareBasedPaymentOnBBBEETransactionMember2023-12-310001786909sbsw:ShareBasedPaymentArrangementsOtherThanBeeTransactionMember2025-12-310001786909sbsw:ShareBasedPaymentArrangementsOtherThanBeeTransactionMember2024-12-310001786909sbsw:ShareBasedPaymentArrangementsOtherThanBeeTransactionMember2023-12-310001786909sbsw:SibanyeStillwater2020And2025SharePlanMember2025-01-012025-12-310001786909sbsw:SibanyeStillwater2020And2025SharePlanMember2024-01-012024-12-310001786909sbsw:SibanyeStillwater2020And2025SharePlanMember2023-01-012023-12-310001786909sbsw:RustenburgOperationsSegmentMember2024-01-012024-12-310001786909sbsw:RustenburgOperationsSegmentMember2023-01-012023-12-310001786909sbsw:MarikanaOperationsSegmentMember2024-01-012024-12-310001786909sbsw:MarikanaOperationsSegmentMember2023-01-012023-12-310001786909sbsw:DRDGoldEquitySettledSchemeMember2024-01-012024-12-310001786909sbsw:DRDGoldEquitySettledSchemeMember2023-01-012023-12-310001786909sbsw:DerivativeFinancialInstrumentMemberifrs-full:ForwardContractMembersbsw:GoldMiningActivitiesMember2025-01-012025-12-310001786909sbsw:DerivativeFinancialInstrumentMemberifrs-full:ForwardContractMembersbsw:GoldMiningActivitiesMember2024-01-012024-12-310001786909sbsw:DerivativeFinancialInstrumentMemberifrs-full:ForwardContractMembersbsw:GoldMiningActivitiesMember2023-01-012023-12-310001786909sbsw:DerivativeFinancialInstrumentMemberifrs-full:ForwardContractMembersbsw:PalladiumMiningActivitiesMember2025-01-012025-12-310001786909sbsw:DerivativeFinancialInstrumentMemberifrs-full:ForwardContractMembersbsw:PalladiumMiningActivitiesMember2024-01-012024-12-310001786909sbsw:DerivativeFinancialInstrumentMemberifrs-full:ForwardContractMembersbsw:PalladiumMiningActivitiesMember2023-01-012023-12-310001786909sbsw:DerivativeFinancialInstrumentMemberifrs-full:DerivativesMember2025-01-012025-12-310001786909sbsw:DerivativeFinancialInstrumentMemberifrs-full:DerivativesMember2024-01-012024-12-310001786909sbsw:DerivativeFinancialInstrumentMemberifrs-full:DerivativesMember2023-01-012023-12-310001786909sbsw:ShareBasedPaymentOnBBBEETransactionMember2025-01-012025-12-310001786909sbsw:ShareBasedPaymentOnBBBEETransactionMember2024-01-012024-12-310001786909sbsw:ShareBasedPaymentOnBBBEETransactionMember2023-01-012023-12-310001786909sbsw:CashflowOfDeferredPaymentMember2025-01-012025-12-310001786909sbsw:CashflowOfDeferredPaymentMember2024-01-012024-12-310001786909sbsw:CashflowOfDeferredPaymentMember2023-01-012023-12-310001786909sbsw:DerivativeFinancialInstrumentMemberifrs-full:OptionContractMember2025-01-012025-12-310001786909sbsw:DerivativeFinancialInstrumentMemberifrs-full:OptionContractMember2024-01-012024-12-310001786909sbsw:DerivativeFinancialInstrumentMemberifrs-full:OptionContractMember2023-01-012023-12-310001786909sbsw:CashflowOfBurnstoneDebtInstrumentMember2025-01-012025-12-310001786909sbsw:CashflowOfBurnstoneDebtInstrumentMember2024-01-012024-12-310001786909sbsw:CashflowOfBurnstoneDebtInstrumentMember2023-01-012023-12-310001786909sbsw:CashflowOfTheMarikanaDividendObligationMember2025-01-012025-12-310001786909sbsw:CashflowOfTheMarikanaDividendObligationMember2024-01-012024-12-310001786909sbsw:CashflowOfTheMarikanaDividendObligationMember2023-01-012023-12-310001786909ifrs-full:ContingentConsiderationMember2025-01-012025-12-310001786909ifrs-full:ContingentConsiderationMember2024-01-012024-12-310001786909ifrs-full:ContingentConsiderationMember2023-01-012023-12-310001786909sbsw:KeliberDividendObligationMember2025-01-012025-12-310001786909sbsw:KeliberDividendObligationMember2024-01-012024-12-310001786909sbsw:KeliberDividendObligationMember2023-01-012023-12-310001786909sbsw:OtherInvestmentsIFRSMember2025-01-012025-12-310001786909sbsw:OtherInvestmentsIFRSMember2024-01-012024-12-310001786909sbsw:OtherInvestmentsIFRSMember2023-01-012023-12-310001786909sbsw:OtherInstrumentMemberMember2025-01-012025-12-310001786909sbsw:OtherInstrumentMemberMember2024-01-012024-12-310001786909sbsw:OtherInstrumentMemberMember2023-01-012023-12-310001786909sbsw:GoldMiningActivitiesMember2023-05-030001786909sbsw:GoldMiningActivitiesMember2023-05-032023-05-030001786909sbsw:GoldMiningActivitiesMemberifrs-full:BottomOfRangeMember2023-05-030001786909sbsw:GoldMiningActivitiesMemberifrs-full:TopOfRangeMember2023-05-030001786909sbsw:GoldMiningActivitiesMember2023-11-170001786909sbsw:HedgeAgreementOneMembersbsw:GoldMiningActivitiesMember2023-11-170001786909sbsw:HedgeAgreementTwoMembersbsw:GoldMiningActivitiesMember2023-11-170001786909sbsw:HedgeAgreementOneMembersbsw:GoldMiningActivitiesMember2023-11-172023-11-170001786909sbsw:HedgeAgreementTwoMembersbsw:GoldMiningActivitiesMember2023-11-172023-11-170001786909sbsw:HedgeAgreementTwoMembersbsw:GoldMiningActivitiesMemberifrs-full:BottomOfRangeMember2023-11-170001786909sbsw:HedgeAgreementOneMembersbsw:GoldMiningActivitiesMemberifrs-full:BottomOfRangeMember2023-11-170001786909sbsw:HedgeAgreementOneMembersbsw:GoldMiningActivitiesMemberifrs-full:TopOfRangeMember2023-11-170001786909sbsw:HedgeAgreementTwoMembersbsw:GoldMiningActivitiesMemberifrs-full:TopOfRangeMember2023-11-170001786909sbsw:GoldMiningActivitiesMember2024-11-040001786909sbsw:GoldMiningActivitiesMember2024-11-042024-11-040001786909sbsw:GoldMiningActivitiesMemberifrs-full:BottomOfRangeMember2024-11-040001786909sbsw:GoldMiningActivitiesMemberifrs-full:TopOfRangeMember2024-11-040001786909sbsw:GoldMiningActivitiesMember2024-12-090001786909sbsw:GoldMiningActivitiesMember2024-12-092024-12-090001786909sbsw:GoldMiningActivitiesMemberifrs-full:BottomOfRangeMember2024-12-090001786909sbsw:GoldMiningActivitiesMemberifrs-full:TopOfRangeMember2024-12-090001786909sbsw:ZincMiningActivitiesMember2021-06-150001786909sbsw:ZincMiningActivitiesMember2021-06-152021-06-1500017869092021-06-150001786909sbsw:ZincMiningActivitiesMember2021-11-300001786909sbsw:ZincMiningActivitiesMember2021-11-012021-11-3000017869092021-11-300001786909sbsw:ZincMiningActivitiesMember2024-06-300001786909sbsw:HedgeAgreementOneMembersbsw:ZincMiningActivitiesMember2024-06-300001786909sbsw:HedgeAgreementOneMembersbsw:ZincMiningActivitiesMember2024-06-012024-06-010001786909sbsw:HedgeAgreementOneMembersbsw:ZincMiningActivitiesMemberifrs-full:BottomOfRangeMember2024-06-300001786909sbsw:HedgeAgreementOneMembersbsw:ZincMiningActivitiesMemberifrs-full:TopOfRangeMember2024-06-300001786909sbsw:HedgeAgreementTwoMembersbsw:ZincMiningActivitiesMember2024-06-300001786909sbsw:HedgeAgreementTwoMembersbsw:ZincMiningActivitiesMember2024-06-012024-06-010001786909sbsw:HedgeAgreementTwoMembersbsw:ZincMiningActivitiesMemberifrs-full:BottomOfRangeMember2024-06-300001786909sbsw:HedgeAgreementTwoMembersbsw:ZincMiningActivitiesMemberifrs-full:TopOfRangeMember2024-06-300001786909sbsw:ZincMiningActivitiesMember2024-11-300001786909sbsw:HedgeAgreementOneMembersbsw:ZincMiningActivitiesMember2024-11-300001786909sbsw:HedgeAgreementOneMembersbsw:ZincMiningActivitiesMemberifrs-full:BottomOfRangeMember2024-11-300001786909sbsw:HedgeAgreementOneMembersbsw:ZincMiningActivitiesMemberifrs-full:TopOfRangeMember2024-11-300001786909sbsw:HedgeAgreementTwoMembersbsw:ZincMiningActivitiesMember2024-11-300001786909sbsw:HedgeAgreementTwoMembersbsw:ZincMiningActivitiesMember2024-11-012024-11-300001786909sbsw:HedgeAgreementTwoMembersbsw:ZincMiningActivitiesMemberifrs-full:BottomOfRangeMember2024-11-300001786909sbsw:HedgeAgreementTwoMembersbsw:ZincMiningActivitiesMemberifrs-full:TopOfRangeMember2024-11-300001786909sbsw:HedgeAgreementThreeMembersbsw:ZincMiningActivitiesMember2025-03-310001786909sbsw:HedgeAgreementThreeMembersbsw:ZincMiningActivitiesMember2025-03-012025-03-310001786909sbsw:HedgeAgreementThreeMembersbsw:ZincMiningActivitiesMemberifrs-full:BottomOfRangeMember2025-03-310001786909sbsw:HedgeAgreementThreeMembersbsw:ZincMiningActivitiesMemberifrs-full:TopOfRangeMember2025-03-310001786909sbsw:HedgeAgreementFourMembersbsw:ZincMiningActivitiesMember2025-12-310001786909sbsw:HedgeAgreementFourMembersbsw:ZincMiningActivitiesMember2025-07-012025-12-310001786909sbsw:HedgeAgreementFourMembersbsw:ZincMiningActivitiesMemberifrs-full:BottomOfRangeMember2025-12-310001786909sbsw:HedgeAgreementFourMembersbsw:ZincMiningActivitiesMemberifrs-full:TopOfRangeMember2025-12-310001786909sbsw:HedgeAgreementFiveMembersbsw:ZincMiningActivitiesMember2025-12-310001786909sbsw:HedgeAgreementFiveMembersbsw:ZincMiningActivitiesMember2025-07-012025-12-310001786909sbsw:HedgeAgreementFiveMembersbsw:ZincMiningActivitiesMemberifrs-full:BottomOfRangeMember2025-12-310001786909sbsw:HedgeAgreementFiveMembersbsw:ZincMiningActivitiesMemberifrs-full:TopOfRangeMember2025-12-310001786909sbsw:HedgeAgreementSixMembersbsw:ZincMiningActivitiesMember2025-12-310001786909sbsw:HedgeAgreementSixMembersbsw:ZincMiningActivitiesMember2025-07-012025-12-310001786909sbsw:HedgeAgreementSixMembersbsw:ZincMiningActivitiesMemberifrs-full:BottomOfRangeMember2025-12-310001786909sbsw:HedgeAgreementSixMembersbsw:ZincMiningActivitiesMemberifrs-full:TopOfRangeMember2025-12-310001786909sbsw:HedgeAgreementSevenMembersbsw:ZincMiningActivitiesMember2025-12-310001786909sbsw:HedgeAgreementSevenMembersbsw:ZincMiningActivitiesMember2025-07-012025-12-310001786909sbsw:HedgeAgreementSevenMembersbsw:ZincMiningActivitiesMemberifrs-full:BottomOfRangeMember2025-12-310001786909sbsw:HedgeAgreementSevenMembersbsw:ZincMiningActivitiesMemberifrs-full:TopOfRangeMember2025-12-310001786909sbsw:CookeSegmentMember2024-01-012024-12-310001786909sbsw:CookeSegmentMember2023-01-012023-12-310001786909sbsw:BurnstoneMember2025-01-012025-12-310001786909sbsw:BurnstoneMember2024-01-012024-12-310001786909sbsw:SandouvilleMember2025-01-012025-12-310001786909sbsw:KloofSegmentMember2024-01-012024-12-310001786909sbsw:KloofSegmentMember2023-01-012023-12-310001786909sbsw:GoldDivisionSegmentMember2025-01-012025-12-310001786909sbsw:GoldDivisionSegmentMember2024-01-012024-12-310001786909sbsw:GoldDivisionSegmentMember2023-01-012023-12-310001786909sbsw:PlatinumDivisionSegmentMember2025-01-012025-12-310001786909sbsw:PlatinumDivisionSegmentMember2024-01-012024-12-310001786909sbsw:PlatinumDivisionSegmentMember2023-01-012023-12-310001786909sbsw:StillwaterMember2024-01-012024-12-310001786909sbsw:BurnstoneBusinessCombinationMember2024-01-012024-12-310001786909ifrs-full:RightofuseAssetsMember2025-01-012025-12-310001786909ifrs-full:RightofuseAssetsMember2024-01-012024-12-310001786909ifrs-full:RightofuseAssetsMember2023-01-012023-12-310001786909ifrs-full:InvestmentsAccountedForUsingEquityMethodMember2025-01-012025-12-310001786909ifrs-full:InvestmentsAccountedForUsingEquityMethodMember2024-01-012024-12-310001786909ifrs-full:InvestmentsAccountedForUsingEquityMethodMember2023-01-012023-12-310001786909sbsw:MimosaMember2025-01-012025-06-300001786909sbsw:MimosaMember2025-06-300001786909ifrs-full:MiningAssetsMembersbsw:MimosaMember2025-01-012025-06-300001786909sbsw:KloofSegmentMember2025-01-012025-12-310001786909sbsw:KeliberOyMember2025-07-012025-12-310001786909sbsw:KeliberOyMember2025-01-012025-06-300001786909sbsw:USPGMOperationsSegmentMember2025-01-012025-06-300001786909sbsw:BeatrixSegmentMember2025-01-012025-12-310001786909sbsw:DriefonteinSegmentMember2025-01-012025-12-310001786909sbsw:BurnstoneAssetsMember2025-01-012025-12-310001786909ifrs-full:MiningAssetsMembersbsw:USPGMOperationsSegmentMember2025-01-012025-12-310001786909ifrs-full:MiningAssetsMembersbsw:KeliberOyMember2025-01-012025-12-310001786909ifrs-full:MiningAssetsMembersbsw:KloofAssetsMember2025-01-012025-12-310001786909ifrs-full:MiningAssetsMembersbsw:OtherAssets1Member2025-01-012025-12-310001786909ifrs-full:MiningAssetsMember2025-01-012025-12-310001786909ifrs-full:LandMembersbsw:USPGMOperationsSegmentMember2025-01-012025-12-310001786909ifrs-full:LandMembersbsw:KeliberOyMember2025-01-012025-12-310001786909ifrs-full:LandMembersbsw:KloofAssetsMember2025-01-012025-12-310001786909ifrs-full:LandMembersbsw:OtherAssets1Member2025-01-012025-12-310001786909ifrs-full:LandMember2025-01-012025-12-310001786909sbsw:USPGMOperationsSegmentMember2025-01-012025-12-310001786909sbsw:KeliberOyMember2025-01-012025-12-310001786909sbsw:KloofAssetsMember2025-01-012025-12-310001786909sbsw:OtherAssets1Member2025-01-012025-12-310001786909ifrs-full:MiningAssetsMembersbsw:BeatrixSegmentMember2025-01-012025-12-310001786909ifrs-full:MiningAssetsMembersbsw:DriefonteinSegmentMember2025-01-012025-12-310001786909ifrs-full:MiningAssetsMembersbsw:BurnstoneAssetsMember2025-01-012025-12-310001786909ifrs-full:LandMembersbsw:BeatrixSegmentMember2025-01-012025-12-310001786909ifrs-full:LandMembersbsw:DriefonteinSegmentMember2025-01-012025-12-310001786909ifrs-full:LandMembersbsw:BurnstoneAssetsMember2025-01-012025-12-310001786909sbsw:USPGMOperationsSegmentMember2025-06-300001786909sbsw:KloofSegmentMember2025-12-310001786909sbsw:BeatrixSegmentMember2025-12-310001786909sbsw:DriefonteinSegmentMember2025-12-310001786909sbsw:BurnstoneAssetsMember2025-12-310001786909sbsw:KeliberOyMember2025-06-300001786909sbsw:KeliberOyMember2025-12-310001786909ifrs-full:MiningAssetsMembersbsw:USPGMOperationsSegmentMember2024-07-012024-12-310001786909ifrs-full:MiningAssetsMembersbsw:USPGMOperationsSegmentMember2024-01-012024-06-300001786909sbsw:SandouvilleAssetsMember2024-07-012024-12-310001786909sbsw:SandouvilleAssetsMember2025-01-012025-06-300001786909sbsw:USPGMOperationsSegmentMemberifrs-full:NoncurrentAssetsHeldForSaleMemberifrs-full:MiningAssetsMember2024-07-012024-12-310001786909sbsw:MarikanaAssetsMember2025-01-012025-06-300001786909sbsw:KlipfonteinAssetsMember2025-01-012025-06-300001786909sbsw:USPGMOperationsSegmentMember2024-01-012024-12-310001786909sbsw:OtherAssets1Member2024-01-012024-12-310001786909sbsw:USPGMOperationsSegmentMember2024-06-300001786909sbsw:USPGMOperationsSegmentMember2024-12-310001786909ifrs-full:MiningAssetsMembersbsw:USPGMOperationsSegmentMember2024-01-012024-12-310001786909ifrs-full:MiningAssetsMembersbsw:USPGMOperationsSegmentMember2023-01-012023-12-310001786909ifrs-full:MiningAssetsMembersbsw:SandouvilleAssetsMember2023-01-012023-12-310001786909ifrs-full:MiningAssetsMembersbsw:CenturyAssetsMember2023-01-012023-12-310001786909ifrs-full:MiningAssetsMembersbsw:BurnstoneAssetsMember2023-01-012023-12-310001786909ifrs-full:MiningAssetsMembersbsw:KloofAssetsMember2023-01-012023-12-310001786909ifrs-full:MiningAssetsMembersbsw:OtherAssets1Member2023-01-012023-12-310001786909ifrs-full:MiningAssetsMember2023-01-012023-12-310001786909ifrs-full:LandMembersbsw:USPGMOperationsSegmentMember2023-01-012023-12-310001786909ifrs-full:LandMembersbsw:SandouvilleAssetsMember2023-01-012023-12-310001786909ifrs-full:LandMembersbsw:CenturyAssetsMember2023-01-012023-12-310001786909ifrs-full:LandMembersbsw:BurnstoneAssetsMember2023-01-012023-12-310001786909ifrs-full:LandMembersbsw:KloofAssetsMember2023-01-012023-12-310001786909ifrs-full:LandMembersbsw:OtherAssets1Member2023-01-012023-12-310001786909ifrs-full:LandMember2023-01-012023-12-310001786909ifrs-full:TangibleExplorationAndEvaluationAssetsMembersbsw:USPGMOperationsSegmentMember2023-01-012023-12-310001786909ifrs-full:TangibleExplorationAndEvaluationAssetsMembersbsw:SandouvilleAssetsMember2023-01-012023-12-310001786909ifrs-full:TangibleExplorationAndEvaluationAssetsMembersbsw:CenturyAssetsMember2023-01-012023-12-310001786909ifrs-full:TangibleExplorationAndEvaluationAssetsMembersbsw:BurnstoneAssetsMember2023-01-012023-12-310001786909ifrs-full:TangibleExplorationAndEvaluationAssetsMembersbsw:KloofAssetsMember2023-01-012023-12-310001786909ifrs-full:TangibleExplorationAndEvaluationAssetsMembersbsw:OtherAssets1Member2023-01-012023-12-310001786909ifrs-full:TangibleExplorationAndEvaluationAssetsMember2023-01-012023-12-310001786909sbsw:USPGMOperationsSegmentMember2023-01-012023-12-310001786909sbsw:SandouvilleAssetsMember2023-01-012023-12-310001786909sbsw:CenturyAssetsMember2023-01-012023-12-310001786909sbsw:BurnstoneAssetsMember2023-01-012023-12-310001786909sbsw:KloofAssetsMember2023-01-012023-12-310001786909sbsw:OtherAssets1Member2023-01-012023-12-310001786909sbsw:USPGMOperationsSegmentMember2023-12-310001786909sbsw:SandouvilleAssetsMember2023-12-310001786909sbsw:CenturyAssetsMember2023-12-310001786909sbsw:BurnstoneAssetsMember2023-12-310001786909sbsw:MimosaMember2023-01-012023-12-310001786909sbsw:MimosaMember2023-12-310001786909ifrs-full:MiningAssetsMembersbsw:MimosaMember2023-01-012023-12-310001786909srt:MaximumMember2025-01-012025-12-310001786909ifrs-full:CountryOfDomicileMember2025-01-012025-12-310001786909ifrs-full:CountryOfDomicileMember2024-01-012024-12-310001786909ifrs-full:CountryOfDomicileMember2023-01-012023-12-310001786909sbsw:StillwaterMember2025-12-310001786909sbsw:KeliberOyMember2025-12-310001786909sbsw:SandouvilleMember2025-12-310001786909sbsw:BurnstoneMember2025-12-310001786909sbsw:CookeSegmentMember2025-12-310001786909sbsw:USPGMOperationsMember2025-12-310001786909sbsw:CookeAcquisitionMember2025-12-310001786909sbsw:SandouvilleSegmentMember2024-12-310001786909sbsw:CenturySegmentMember2024-12-310001786909sbsw:BurnstoneBusinessCombinationMember2024-12-310001786909sbsw:CookeAcquisitionMember2024-12-310001786909sbsw:SibanyeGoldLimitedMember2024-12-310001786909ifrs-full:MiningAssetsMember2025-12-310001786909ifrs-full:MiningAssetsMember2024-12-310001786909ifrs-full:MiningAssetsMember2023-12-310001786909sbsw:EnvironmentalRehabilitationObligationFundsMember2025-12-310001786909sbsw:EnvironmentalRehabilitationObligationFundsMember2024-12-310001786909sbsw:EnvironmentalRehabilitationObligationFundsMember2023-12-310001786909sbsw:US500MillionConvertibleBondDue2028Member2025-12-310001786909sbsw:US500MillionConvertibleBondDue2028Member2024-12-310001786909sbsw:US500MillionConvertibleBondDue2028Member2023-12-310001786909ifrs-full:OtherTemporaryDifferencesMember2025-12-310001786909ifrs-full:OtherTemporaryDifferencesMember2024-12-310001786909ifrs-full:OtherTemporaryDifferencesMember2023-12-310001786909sbsw:OccupationalHealthcareObligationMember2025-12-310001786909sbsw:OccupationalHealthcareObligationMember2024-12-310001786909sbsw:OccupationalHealthcareObligationMember2023-12-310001786909sbsw:OtherPayablesAndProvisionsMember2025-12-310001786909sbsw:OtherPayablesAndProvisionsMember2024-12-310001786909sbsw:OtherPayablesAndProvisionsMember2023-12-310001786909sbsw:DerivativeFinancialInstrumentMember2025-12-310001786909sbsw:DerivativeFinancialInstrumentMember2024-12-310001786909sbsw:DerivativeFinancialInstrumentMember2023-12-310001786909ifrs-full:AllowanceForCreditLossesMember2025-12-310001786909ifrs-full:AllowanceForCreditLossesMember2024-12-310001786909ifrs-full:AllowanceForCreditLossesMember2023-12-310001786909sbsw:TaxLossesAndUnredeemedCapitalExpenditureMember2025-12-310001786909sbsw:TaxLossesAndUnredeemedCapitalExpenditureMember2024-12-310001786909sbsw:TaxLossesAndUnredeemedCapitalExpenditureMember2023-12-310001786909sbsw:ShareBasedPaymentObligationMember2025-12-310001786909sbsw:ShareBasedPaymentObligationMember2024-12-310001786909sbsw:ShareBasedPaymentObligationMember2023-12-310001786909ifrs-full:BottomOfRangeMember2025-01-012025-12-310001786909ifrs-full:VehiclesMember2025-01-012025-12-310001786909ifrs-full:ComputerEquipmentMemberifrs-full:BottomOfRangeMember2025-01-012025-12-310001786909ifrs-full:ComputerEquipmentMemberifrs-full:TopOfRangeMember2025-01-012025-12-310001786909ifrs-full:OfficeEquipmentMemberifrs-full:BottomOfRangeMember2025-01-012025-12-310001786909ifrs-full:OfficeEquipmentMemberifrs-full:TopOfRangeMember2025-01-012025-12-310001786909ifrs-full:BuildingsMemberifrs-full:BottomOfRangeMember2025-01-012025-12-310001786909ifrs-full:BuildingsMemberifrs-full:TopOfRangeMember2025-01-012025-12-310001786909ifrs-full:GrossCarryingAmountMember2024-12-310001786909ifrs-full:MiningAssetsMemberifrs-full:GrossCarryingAmountMember2024-12-310001786909ifrs-full:LandMemberifrs-full:GrossCarryingAmountMember2024-12-310001786909ifrs-full:TangibleExplorationAndEvaluationAssetsMemberifrs-full:GrossCarryingAmountMember2024-12-310001786909ifrs-full:GrossCarryingAmountMember2025-01-012025-12-310001786909ifrs-full:MiningAssetsMemberifrs-full:GrossCarryingAmountMember2025-01-012025-12-310001786909ifrs-full:LandMemberifrs-full:GrossCarryingAmountMember2025-01-012025-12-310001786909ifrs-full:TangibleExplorationAndEvaluationAssetsMemberifrs-full:GrossCarryingAmountMember2025-01-012025-12-310001786909ifrs-full:GrossCarryingAmountMember2025-12-310001786909ifrs-full:MiningAssetsMemberifrs-full:GrossCarryingAmountMember2025-12-310001786909ifrs-full:LandMemberifrs-full:GrossCarryingAmountMember2025-12-310001786909ifrs-full:TangibleExplorationAndEvaluationAssetsMemberifrs-full:GrossCarryingAmountMember2025-12-310001786909ifrs-full:AccumulatedDepreciationAmortisationAndImpairmentMember2024-12-310001786909ifrs-full:MiningAssetsMemberifrs-full:AccumulatedDepreciationAmortisationAndImpairmentMember2024-12-310001786909ifrs-full:LandMemberifrs-full:AccumulatedDepreciationAmortisationAndImpairmentMember2024-12-310001786909ifrs-full:TangibleExplorationAndEvaluationAssetsMemberifrs-full:AccumulatedDepreciationAmortisationAndImpairmentMember2024-12-310001786909ifrs-full:AccumulatedDepreciationAmortisationAndImpairmentMember2025-01-012025-12-310001786909ifrs-full:MiningAssetsMemberifrs-full:AccumulatedDepreciationAmortisationAndImpairmentMember2025-01-012025-12-310001786909ifrs-full:LandMemberifrs-full:AccumulatedDepreciationAmortisationAndImpairmentMember2025-01-012025-12-310001786909ifrs-full:TangibleExplorationAndEvaluationAssetsMemberifrs-full:AccumulatedDepreciationAmortisationAndImpairmentMember2025-01-012025-12-310001786909ifrs-full:AccumulatedDepreciationAmortisationAndImpairmentMember2025-12-310001786909ifrs-full:MiningAssetsMemberifrs-full:AccumulatedDepreciationAmortisationAndImpairmentMember2025-12-310001786909ifrs-full:LandMemberifrs-full:AccumulatedDepreciationAmortisationAndImpairmentMember2025-12-310001786909ifrs-full:TangibleExplorationAndEvaluationAssetsMemberifrs-full:AccumulatedDepreciationAmortisationAndImpairmentMember2025-12-310001786909ifrs-full:MiningAssetsMember2025-12-310001786909ifrs-full:LandMember2025-12-310001786909ifrs-full:TangibleExplorationAndEvaluationAssetsMember2025-12-310001786909ifrs-full:GrossCarryingAmountMember2023-12-310001786909ifrs-full:MiningAssetsMemberifrs-full:GrossCarryingAmountMember2023-12-310001786909ifrs-full:LandMemberifrs-full:GrossCarryingAmountMember2023-12-310001786909ifrs-full:TangibleExplorationAndEvaluationAssetsMemberifrs-full:GrossCarryingAmountMember2023-12-310001786909ifrs-full:GrossCarryingAmountMember2024-01-012024-12-310001786909ifrs-full:MiningAssetsMemberifrs-full:GrossCarryingAmountMember2024-01-012024-12-310001786909ifrs-full:LandMemberifrs-full:GrossCarryingAmountMember2024-01-012024-12-310001786909ifrs-full:TangibleExplorationAndEvaluationAssetsMemberifrs-full:GrossCarryingAmountMember2024-01-012024-12-310001786909ifrs-full:AccumulatedDepreciationAmortisationAndImpairmentMember2023-12-310001786909ifrs-full:MiningAssetsMemberifrs-full:AccumulatedDepreciationAmortisationAndImpairmentMember2023-12-310001786909ifrs-full:LandMemberifrs-full:AccumulatedDepreciationAmortisationAndImpairmentMember2023-12-310001786909ifrs-full:TangibleExplorationAndEvaluationAssetsMemberifrs-full:AccumulatedDepreciationAmortisationAndImpairmentMember2023-12-310001786909ifrs-full:AccumulatedDepreciationAmortisationAndImpairmentMember2024-01-012024-12-310001786909ifrs-full:MiningAssetsMemberifrs-full:AccumulatedDepreciationAmortisationAndImpairmentMember2024-01-012024-12-310001786909ifrs-full:LandMemberifrs-full:AccumulatedDepreciationAmortisationAndImpairmentMember2024-01-012024-12-310001786909ifrs-full:TangibleExplorationAndEvaluationAssetsMemberifrs-full:AccumulatedDepreciationAmortisationAndImpairmentMember2024-01-012024-12-310001786909ifrs-full:MiningAssetsMember2024-12-310001786909ifrs-full:LandMember2024-12-310001786909ifrs-full:TangibleExplorationAndEvaluationAssetsMember2024-12-310001786909ifrs-full:GrossCarryingAmountMember2022-12-310001786909ifrs-full:MiningAssetsMemberifrs-full:GrossCarryingAmountMember2022-12-310001786909ifrs-full:LandMemberifrs-full:GrossCarryingAmountMember2022-12-310001786909ifrs-full:TangibleExplorationAndEvaluationAssetsMemberifrs-full:GrossCarryingAmountMember2022-12-310001786909ifrs-full:GrossCarryingAmountMember2023-01-012023-12-310001786909ifrs-full:MiningAssetsMemberifrs-full:GrossCarryingAmountMember2023-01-012023-12-310001786909ifrs-full:LandMemberifrs-full:GrossCarryingAmountMember2023-01-012023-12-310001786909ifrs-full:TangibleExplorationAndEvaluationAssetsMemberifrs-full:GrossCarryingAmountMember2023-01-012023-12-310001786909ifrs-full:AccumulatedDepreciationAmortisationAndImpairmentMember2022-12-310001786909ifrs-full:MiningAssetsMemberifrs-full:AccumulatedDepreciationAmortisationAndImpairmentMember2022-12-310001786909ifrs-full:LandMemberifrs-full:AccumulatedDepreciationAmortisationAndImpairmentMember2022-12-310001786909ifrs-full:TangibleExplorationAndEvaluationAssetsMemberifrs-full:AccumulatedDepreciationAmortisationAndImpairmentMember2022-12-310001786909ifrs-full:AccumulatedDepreciationAmortisationAndImpairmentMember2023-01-012023-12-310001786909ifrs-full:MiningAssetsMemberifrs-full:AccumulatedDepreciationAmortisationAndImpairmentMember2023-01-012023-12-310001786909ifrs-full:LandMemberifrs-full:AccumulatedDepreciationAmortisationAndImpairmentMember2023-01-012023-12-310001786909ifrs-full:TangibleExplorationAndEvaluationAssetsMemberifrs-full:AccumulatedDepreciationAmortisationAndImpairmentMember2023-01-012023-12-310001786909ifrs-full:MiningAssetsMember2023-12-310001786909ifrs-full:LandMember2023-12-310001786909ifrs-full:TangibleExplorationAndEvaluationAssetsMember2023-12-310001786909sbsw:MetallixGroupMember2025-09-042025-12-310001786909sbsw:MetallixGroupMember2025-01-012025-12-310001786909sbsw:MetallixGroupMember2025-09-042025-09-040001786909sbsw:ReldanGroupMember2025-01-012025-06-300001786909sbsw:InitialPaymentMembersbsw:ReldanGroupMember2025-03-310001786909sbsw:FinalPaymentMembersbsw:ReldanGroupMember2025-03-310001786909sbsw:ReldanGroupMember2025-03-310001786909sbsw:InitialPaymentMembersbsw:ReldanGroupMember2025-03-312025-03-310001786909sbsw:FinalPaymentMembersbsw:ReldanGroupMember2025-03-312025-03-310001786909sbsw:ReldanGroupMember2025-03-312025-03-310001786909sbsw:ReldanGroupMember2024-01-012024-12-310001786909sbsw:ReldanGroupMember2025-01-012025-03-310001786909sbsw:ReldanGroupMemberifrs-full:BottomOfRangeMember2024-01-012024-12-310001786909sbsw:ReldanGroupMemberifrs-full:TopOfRangeMember2024-01-012024-12-310001786909sbsw:ReldanGroupMember2025-12-310001786909sbsw:ReldanGroupMember2024-12-310001786909srt:MinimumMembersbsw:VendorRelationshipsMember2025-01-012025-12-310001786909srt:MaximumMembersbsw:VendorRelationshipsMember2025-01-012025-12-310001786909ifrs-full:BrandNamesMember2025-01-012025-12-310001786909ifrs-full:ComputerSoftwareMember2025-01-012025-12-310001786909sbsw:SfaOxfordLimitedMember2019-12-310001786909sbsw:StillwaterMembersbsw:SfaOxfordLimitedMember2019-12-310001786909sbsw:RustenburgOperationsSegmentMembersbsw:SfaOxfordLimitedMember2019-12-310001786909sbsw:KroondalSegmentMembersbsw:SfaOxfordLimitedMember2019-12-310001786909sbsw:StillwaterMembersbsw:SfaOxfordLimitedMember2023-01-012023-12-310001786909sbsw:SfaOxfordLimitedMember2024-12-310001786909sbsw:QiniseleResourcesMember2020-01-012020-12-310001786909sbsw:CookeAcquisitionMember2020-01-012020-12-310001786909sbsw:AquariusAcquisitionMember2025-12-310001786909sbsw:KroondalSegmentMembersbsw:AquariusAcquisitionMember2025-01-012025-12-310001786909sbsw:RustenburgOperationsSegmentMembersbsw:AquariusAcquisitionMember2025-01-012025-12-310001786909sbsw:AquariusAcquisitionMember2025-01-012025-12-310001786909sbsw:StillwaterMiningCompanyMember2017-05-040001786909sbsw:StillwaterMiningCompanyMember2023-01-012023-12-310001786909sbsw:DrdgoldLimitedMember2025-12-310001786909sbsw:DrdgoldLimitedMember2025-01-012025-12-310001786909sbsw:SandouvilleMember2022-02-040001786909sbsw:ManufacturerRelationshipsMember2025-12-310001786909sbsw:ManufacturerRelationshipsMember2024-12-310001786909sbsw:ManufacturerRelationshipsMember2025-01-012025-12-310001786909sbsw:VendorRelationshipsMember2025-12-310001786909sbsw:GoldDivisionSegmentMember2025-12-310001786909sbsw:GoldDivisionSegmentMember2024-12-310001786909sbsw:GoldDivisionSegmentMember2023-12-310001786909sbsw:PlatinumDivisionSegmentMember2025-12-310001786909sbsw:PlatinumDivisionSegmentMember2024-12-310001786909sbsw:PlatinumDivisionSegmentMember2023-12-310001786909sbsw:SandouvilleSegmentMember2023-12-310001786909sbsw:CenturySegmentMember2023-12-310001786909sbsw:PennsylvaniaSiteAndNorthCarolinaSiteMember2025-12-310001786909sbsw:PennsylvaniaSiteAndNorthCarolinaSiteMember2024-12-310001786909ifrs-full:CountryOfDomicileMembersbsw:GoldDivisionSegmentMemberifrs-full:BottomOfRangeMember2025-12-310001786909ifrs-full:CountryOfDomicileMembersbsw:GoldDivisionSegmentMemberifrs-full:TopOfRangeMember2025-12-310001786909ifrs-full:CountryOfDomicileMembersbsw:GoldDivisionSegmentMemberifrs-full:BottomOfRangeMember2024-12-310001786909ifrs-full:CountryOfDomicileMembersbsw:GoldDivisionSegmentMemberifrs-full:TopOfRangeMember2024-12-310001786909ifrs-full:CountryOfDomicileMembersbsw:GoldDivisionSegmentMemberifrs-full:BottomOfRangeMember2023-12-310001786909ifrs-full:CountryOfDomicileMembersbsw:GoldDivisionSegmentMemberifrs-full:TopOfRangeMember2023-12-310001786909ifrs-full:CountryOfDomicileMembersbsw:PlatinumDivisionSegmentMemberifrs-full:BottomOfRangeMember2025-12-310001786909ifrs-full:CountryOfDomicileMembersbsw:PlatinumDivisionSegmentMemberifrs-full:TopOfRangeMember2025-12-310001786909ifrs-full:CountryOfDomicileMembersbsw:PlatinumDivisionSegmentMemberifrs-full:BottomOfRangeMember2024-12-310001786909ifrs-full:CountryOfDomicileMembersbsw:PlatinumDivisionSegmentMemberifrs-full:TopOfRangeMember2024-12-310001786909ifrs-full:CountryOfDomicileMembersbsw:PlatinumDivisionSegmentMemberifrs-full:BottomOfRangeMember2023-12-310001786909ifrs-full:CountryOfDomicileMembersbsw:PlatinumDivisionSegmentMemberifrs-full:TopOfRangeMember2023-12-310001786909sbsw:PlatinumDivisionSegmentMembercountry:US2025-12-310001786909sbsw:PlatinumDivisionSegmentMembercountry:US2024-12-310001786909sbsw:PlatinumDivisionSegmentMembercountry:US2023-12-310001786909sbsw:PennsylvaniaSiteAndNorthCarolinaSiteMembercountry:US2025-12-310001786909sbsw:PennsylvaniaSiteAndNorthCarolinaSiteMembercountry:US2024-12-310001786909sbsw:SandouvilleSegmentMembersrt:EuropeMember2023-12-310001786909sbsw:CenturySegmentMembercountry:AU2023-12-310001786909sbsw:BurnstoneDebtMemberifrs-full:CountryOfDomicileMembersbsw:GoldDivisionSegmentMember2025-12-310001786909sbsw:BurnstoneDebtMemberifrs-full:CountryOfDomicileMembersbsw:GoldDivisionSegmentMember2024-12-310001786909sbsw:BurnstoneDebtMemberifrs-full:CountryOfDomicileMembersbsw:GoldDivisionSegmentMember2023-12-310001786909sbsw:PlatinumDivisionSegmentMemberifrs-full:CountryOfDomicileMember2025-12-310001786909sbsw:PlatinumDivisionSegmentMemberifrs-full:CountryOfDomicileMember2024-12-310001786909sbsw:PlatinumDivisionSegmentMemberifrs-full:CountryOfDomicileMember2023-12-310001786909ifrs-full:MiningAssetsMembersbsw:GoldDivisionSegmentMemberifrs-full:BottomOfRangeMember2025-01-012025-12-310001786909ifrs-full:MiningAssetsMembersbsw:GoldDivisionSegmentMemberifrs-full:TopOfRangeMember2025-01-012025-12-310001786909ifrs-full:MiningAssetsMembersbsw:GoldDivisionSegmentMemberifrs-full:BottomOfRangeMember2024-01-012024-12-310001786909ifrs-full:MiningAssetsMembersbsw:GoldDivisionSegmentMemberifrs-full:TopOfRangeMember2024-01-012024-12-310001786909ifrs-full:MiningAssetsMembersbsw:GoldDivisionSegmentMemberifrs-full:BottomOfRangeMember2023-01-012023-12-310001786909ifrs-full:MiningAssetsMembersbsw:GoldDivisionSegmentMemberifrs-full:TopOfRangeMember2023-01-012023-12-310001786909ifrs-full:MiningAssetsMembersbsw:PlatinumDivisionSegmentMemberifrs-full:BottomOfRangeMember2025-01-012025-12-310001786909ifrs-full:MiningAssetsMembersbsw:PlatinumDivisionSegmentMemberifrs-full:TopOfRangeMember2025-01-012025-12-310001786909ifrs-full:MiningAssetsMembersbsw:PlatinumDivisionSegmentMemberifrs-full:BottomOfRangeMember2024-01-012024-12-310001786909ifrs-full:MiningAssetsMembersbsw:PlatinumDivisionSegmentMemberifrs-full:TopOfRangeMember2024-01-012024-12-310001786909ifrs-full:MiningAssetsMembersbsw:PlatinumDivisionSegmentMemberifrs-full:BottomOfRangeMember2023-01-012023-12-310001786909ifrs-full:MiningAssetsMembersbsw:PlatinumDivisionSegmentMemberifrs-full:TopOfRangeMember2023-01-012023-12-310001786909ifrs-full:MiningAssetsMembersbsw:SandouvilleSegmentMember2023-01-012023-12-310001786909ifrs-full:MiningAssetsMembersbsw:CenturySegmentMember2023-01-012023-12-310001786909ifrs-full:MiningAssetsMembersbsw:KeliberOyMember2025-01-012025-12-310001786909ifrs-full:MiningAssetsMembersbsw:KeliberOyMember2024-01-012024-12-310001786909ifrs-full:MiningAssetsMembersbsw:KeliberOyMember2023-01-012023-12-310001786909sbsw:BurnstoneDebtMember2025-12-310001786909sbsw:BurnstoneDebtMember2024-12-310001786909sbsw:BurnstoneDebtMember2023-12-310001786909sbsw:BurnstoneDebtMemberifrs-full:MiningAssetsMembersbsw:GoldDivisionSegmentMember2025-01-012025-12-310001786909sbsw:BurnstoneDebtMemberifrs-full:MiningAssetsMembersbsw:GoldDivisionSegmentMember2024-01-012024-12-310001786909sbsw:BurnstoneDebtMemberifrs-full:MiningAssetsMembersbsw:GoldDivisionSegmentMember2023-01-012023-12-310001786909sbsw:PlatinumDivisionSegmentMembersbsw:MimosaMember2024-12-310001786909sbsw:PlatinumDivisionSegmentMembersbsw:MimosaMember2023-12-310001786909ifrs-full:MiningAssetsMembersbsw:BurnstoneBusinessCombinationMember2025-12-310001786909ifrs-full:MiningAssetsMembersbsw:BurnstoneBusinessCombinationMember2024-12-310001786909ifrs-full:MiningAssetsMembersbsw:BurnstoneBusinessCombinationMember2023-12-310001786909ifrs-full:MiningAssetsMembersbsw:MimosaMember2024-12-310001786909ifrs-full:MiningAssetsMembersbsw:MimosaMember2023-12-310001786909sbsw:RandRefineryMember2025-12-310001786909sbsw:RandRefineryMember2024-12-310001786909sbsw:RandRefineryMember2023-12-310001786909sbsw:MimosaMember2025-12-310001786909sbsw:MimosaMember2024-12-310001786909sbsw:PeregrineMetalsLtd.Member2025-12-310001786909sbsw:PeregrineMetalsLtd.Member2024-12-310001786909sbsw:PeregrineMetalsLtd.Member2023-12-310001786909ifrs-full:AggregatedIndividuallyImmaterialAssociatesMember2025-12-310001786909ifrs-full:AggregatedIndividuallyImmaterialAssociatesMember2024-12-310001786909ifrs-full:AggregatedIndividuallyImmaterialAssociatesMember2023-12-310001786909sbsw:GlintIncorporatedMember2025-12-310001786909sbsw:GlintIncorporatedMember2024-12-310001786909sbsw:GlintIncorporatedMember2023-12-310001786909sbsw:MexicanAndIndianInvestmentsMember2025-12-310001786909sbsw:MexicanAndIndianInvestmentsMember2024-12-310001786909sbsw:RandRefineryMember2025-01-012025-12-310001786909sbsw:RandRefineryMember2022-12-310001786909sbsw:RandRefineryMember2024-01-012024-12-310001786909sbsw:RandRefineryMember2023-01-012023-12-310001786909sbsw:RandRefineryMemberifrs-full:SeparateMember2025-01-012025-12-310001786909sbsw:RandRefineryMemberifrs-full:SeparateMember2024-01-012024-12-310001786909sbsw:RandRefineryMemberifrs-full:SeparateMember2023-01-012023-12-310001786909sbsw:RandRefineryMemberifrs-full:SeparateMember2025-12-310001786909sbsw:RandRefineryMemberifrs-full:SeparateMember2024-12-310001786909sbsw:RandRefineryMemberifrs-full:SeparateMember2023-12-310001786909sbsw:RandRefineryMember2024-12-012024-12-310001786909sbsw:RandRefineryMember2023-12-012023-12-310001786909sbsw:RandRefineryMember2022-12-012022-12-310001786909sbsw:MimosaMember2025-01-012025-12-310001786909sbsw:MimosaMember2022-12-310001786909sbsw:MimosaMember2024-01-012024-12-310001786909sbsw:MimosaMemberifrs-full:SeparateMember2025-01-012025-12-310001786909sbsw:MimosaMemberifrs-full:SeparateMember2024-01-012024-12-310001786909sbsw:MimosaMemberifrs-full:SeparateMember2023-01-012023-12-310001786909sbsw:MimosaMemberifrs-full:SeparateMember2025-12-310001786909sbsw:MimosaMemberifrs-full:SeparateMember2024-12-310001786909sbsw:MimosaMemberifrs-full:SeparateMember2023-12-310001786909sbsw:AldebaranResourcesInc.Membersbsw:PeregrineMetalsLtd.Member2018-06-292018-06-290001786909sbsw:PeregrineMetalsLtd.Member2018-06-292018-06-290001786909sbsw:AldebaranResourcesInc.Membersbsw:PeregrineMetalsLtd.Member2018-10-252018-10-250001786909sbsw:AldebaranResourcesInc.Member2018-10-250001786909sbsw:PeregrineMetalsLtd.Member2018-10-252018-10-250001786909sbsw:AldebaranResourcesInc.Membersbsw:PeregrineMetalsLtd.Member2023-08-142023-08-140001786909sbsw:PeregrineMetalsLtd.Membersbsw:NutonHoldingsLimitedMembersrt:ScenarioForecastMember2024-11-072024-11-070001786909sbsw:PeregrineMetalsLtd.Member2024-01-012024-12-310001786909sbsw:PeregrineMetalsLtd.Member2023-01-012023-12-310001786909sbsw:PeregrineMetalsLtd.Member2022-12-310001786909sbsw:PeregrineMetalsLtd.Memberifrs-full:SeparateMember2025-12-310001786909sbsw:PeregrineMetalsLtd.Memberifrs-full:SeparateMember2024-12-310001786909sbsw:PeregrineMetalsLtd.Memberifrs-full:SeparateMember2023-12-310001786909sbsw:NewCenturyResourcesLimitedMember2025-01-012025-12-310001786909sbsw:NewCenturyResourcesLimitedMember2024-01-012024-12-310001786909sbsw:NewCenturyResourcesLimitedMember2023-01-012023-12-310001786909sbsw:GlintIncorporatedMember2025-01-012025-12-310001786909sbsw:GlintIncorporatedMember2024-01-012024-12-310001786909sbsw:GlintIncorporatedMember2023-01-012023-12-310001786909sbsw:RandMutualAssuranceInvestmentMemberifrs-full:InvestmentsInEquityInstrumentsMeasuredAtFairValueThroughOtherComprehensiveIncomeMemberifrs-full:EquityInvestmentsMember2025-12-310001786909sbsw:RandMutualAssuranceInvestmentMemberifrs-full:InvestmentsInEquityInstrumentsMeasuredAtFairValueThroughOtherComprehensiveIncomeMemberifrs-full:EquityInvestmentsMember2024-12-310001786909sbsw:RandMutualAssuranceInvestmentMemberifrs-full:InvestmentsInEquityInstrumentsMeasuredAtFairValueThroughOtherComprehensiveIncomeMemberifrs-full:EquityInvestmentsMember2023-12-310001786909sbsw:FuruyaMetalsInvestmentMemberifrs-full:InvestmentsInEquityInstrumentsMeasuredAtFairValueThroughOtherComprehensiveIncomeMemberifrs-full:EquityInvestmentsMember2025-12-310001786909sbsw:FuruyaMetalsInvestmentMemberifrs-full:InvestmentsInEquityInstrumentsMeasuredAtFairValueThroughOtherComprehensiveIncomeMemberifrs-full:EquityInvestmentsMember2024-12-310001786909sbsw:FuruyaMetalsInvestmentMemberifrs-full:InvestmentsInEquityInstrumentsMeasuredAtFairValueThroughOtherComprehensiveIncomeMemberifrs-full:EquityInvestmentsMember2023-12-310001786909sbsw:AldebaranResourcesInc.Memberifrs-full:InvestmentsInEquityInstrumentsMeasuredAtFairValueThroughOtherComprehensiveIncomeMemberifrs-full:EquityInvestmentsMember2025-12-310001786909sbsw:AldebaranResourcesInc.Memberifrs-full:InvestmentsInEquityInstrumentsMeasuredAtFairValueThroughOtherComprehensiveIncomeMemberifrs-full:EquityInvestmentsMember2024-12-310001786909sbsw:AldebaranResourcesInc.Memberifrs-full:InvestmentsInEquityInstrumentsMeasuredAtFairValueThroughOtherComprehensiveIncomeMemberifrs-full:EquityInvestmentsMember2023-12-310001786909sbsw:GenerationMiningInvestmentMemberifrs-full:InvestmentsInEquityInstrumentsMeasuredAtFairValueThroughOtherComprehensiveIncomeMemberifrs-full:EquityInvestmentsMember2025-12-310001786909sbsw:GenerationMiningInvestmentMemberifrs-full:InvestmentsInEquityInstrumentsMeasuredAtFairValueThroughOtherComprehensiveIncomeMemberifrs-full:EquityInvestmentsMember2024-12-310001786909sbsw:GenerationMiningInvestmentMemberifrs-full:InvestmentsInEquityInstrumentsMeasuredAtFairValueThroughOtherComprehensiveIncomeMemberifrs-full:EquityInvestmentsMember2023-12-310001786909sbsw:IoneerLimitedMemberifrs-full:InvestmentsInEquityInstrumentsMeasuredAtFairValueThroughOtherComprehensiveIncomeMemberifrs-full:EquityInvestmentsMember2025-12-310001786909sbsw:IoneerLimitedMemberifrs-full:InvestmentsInEquityInstrumentsMeasuredAtFairValueThroughOtherComprehensiveIncomeMemberifrs-full:EquityInvestmentsMember2024-12-310001786909sbsw:IoneerLimitedMemberifrs-full:InvestmentsInEquityInstrumentsMeasuredAtFairValueThroughOtherComprehensiveIncomeMemberifrs-full:EquityInvestmentsMember2023-12-310001786909sbsw:OtherInvestmentsInEquityInstrumentsMeasuredAtFairValueThroughOtherComprehensiveIncomeMemberifrs-full:InvestmentsInEquityInstrumentsMeasuredAtFairValueThroughOtherComprehensiveIncomeMemberifrs-full:EquityInvestmentsMember2025-12-310001786909sbsw:OtherInvestmentsInEquityInstrumentsMeasuredAtFairValueThroughOtherComprehensiveIncomeMemberifrs-full:InvestmentsInEquityInstrumentsMeasuredAtFairValueThroughOtherComprehensiveIncomeMemberifrs-full:EquityInvestmentsMember2024-12-310001786909sbsw:OtherInvestmentsInEquityInstrumentsMeasuredAtFairValueThroughOtherComprehensiveIncomeMemberifrs-full:InvestmentsInEquityInstrumentsMeasuredAtFairValueThroughOtherComprehensiveIncomeMemberifrs-full:EquityInvestmentsMember2023-12-310001786909sbsw:VerkorSAMemberifrs-full:FinancialAssetsAtFairValueThroughProfitOrLossMandatorilyMeasuredAtFairValueCategoryMember2025-12-310001786909sbsw:VerkorSAMemberifrs-full:FinancialAssetsAtFairValueThroughProfitOrLossMandatorilyMeasuredAtFairValueCategoryMember2024-12-310001786909sbsw:VerkorSAMemberifrs-full:FinancialAssetsAtFairValueThroughProfitOrLossMandatorilyMeasuredAtFairValueCategoryMember2023-12-310001786909sbsw:EnHyWhereMemberifrs-full:FinancialAssetsAtFairValueThroughProfitOrLossMandatorilyMeasuredAtFairValueCategoryMember2025-12-310001786909sbsw:EnHyWhereMemberifrs-full:FinancialAssetsAtFairValueThroughProfitOrLossMandatorilyMeasuredAtFairValueCategoryMember2024-12-310001786909sbsw:EnHyWhereMemberifrs-full:FinancialAssetsAtFairValueThroughProfitOrLossMandatorilyMeasuredAtFairValueCategoryMember2023-12-310001786909sbsw:OtherInvestmentsIFRSMemberifrs-full:FinancialAssetsAtFairValueThroughProfitOrLossMandatorilyMeasuredAtFairValueCategoryMember2025-12-310001786909sbsw:OtherInvestmentsIFRSMemberifrs-full:FinancialAssetsAtFairValueThroughProfitOrLossMandatorilyMeasuredAtFairValueCategoryMember2024-12-310001786909sbsw:OtherInvestmentsIFRSMemberifrs-full:FinancialAssetsAtFairValueThroughProfitOrLossMandatorilyMeasuredAtFairValueCategoryMember2023-12-310001786909ifrs-full:FinancialAssetsAtAmortisedCostCategoryMember2025-12-310001786909ifrs-full:FinancialAssetsAtAmortisedCostCategoryMember2024-12-310001786909ifrs-full:FinancialAssetsAtAmortisedCostCategoryMember2023-12-310001786909sbsw:FuruyaMetalsInvestmentMemberifrs-full:InvestmentsInEquityInstrumentsMeasuredAtFairValueThroughOtherComprehensiveIncomeMemberifrs-full:EquityInvestmentsMember2025-01-012025-12-310001786909sbsw:AldebaranResourcesInc.Memberifrs-full:InvestmentsInEquityInstrumentsMeasuredAtFairValueThroughOtherComprehensiveIncomeMemberifrs-full:EquityInvestmentsMember2025-01-012025-12-310001786909ifrs-full:MajorOrdinaryShareTransactionsMembersbsw:AldebaranResourcesInc.Memberifrs-full:InvestmentsInEquityInstrumentsMeasuredAtFairValueThroughOtherComprehensiveIncomeMemberifrs-full:EquityInvestmentsMember2026-01-012026-04-240001786909sbsw:GenerationMiningInvestmentMemberifrs-full:InvestmentsInEquityInstrumentsMeasuredAtFairValueThroughOtherComprehensiveIncomeMemberifrs-full:EquityInvestmentsMember2025-01-012025-12-310001786909ifrs-full:MajorOrdinaryShareTransactionsMembersbsw:GenerationMiningInvestmentMemberifrs-full:InvestmentsInEquityInstrumentsMeasuredAtFairValueThroughOtherComprehensiveIncomeMemberifrs-full:EquityInvestmentsMember2026-01-012026-04-240001786909sbsw:IoneerLimitedMember2025-12-310001786909sbsw:VerkorSAMemberifrs-full:FinancialAssetsAtFairValueThroughProfitOrLossMandatorilyMeasuredAtFairValueCategoryMember2022-03-220001786909sbsw:VerkorSAMemberifrs-full:FinancialAssetsAtFairValueThroughProfitOrLossMandatorilyMeasuredAtFairValueCategoryMember2023-09-300001786909sbsw:VerkorSAMemberifrs-full:FinancialAssetsAtFairValueThroughProfitOrLossMandatorilyMeasuredAtFairValueCategoryMember2025-01-012025-12-310001786909sbsw:VerkorSAMemberifrs-full:FinancialAssetsAtFairValueThroughProfitOrLossMandatorilyMeasuredAtFairValueCategoryMember2024-01-012024-12-310001786909sbsw:VerkorSAMemberifrs-full:FinancialAssetsAtFairValueThroughProfitOrLossMandatorilyMeasuredAtFairValueCategoryMember2023-01-012023-12-310001786909sbsw:EnvironmentalRehabilitationObligationFundsMember2025-01-012025-12-310001786909sbsw:EnvironmentalRehabilitationObligationFundsMember2024-01-012024-12-310001786909sbsw:EnvironmentalRehabilitationObligationFundsMember2023-01-012023-12-310001786909ifrs-full:FinancialAssetsAtFairValueThroughProfitOrLossCategoryMember2025-12-310001786909ifrs-full:FinancialAssetsAtFairValueThroughProfitOrLossCategoryMember2024-12-310001786909ifrs-full:FinancialAssetsAtFairValueThroughProfitOrLossCategoryMember2023-12-310001786909sbsw:KroondalOperationMember2025-12-310001786909sbsw:KroondalOperationMember2024-12-310001786909sbsw:KroondalOperationMember2023-12-310001786909sbsw:PandoraAcquisitionByLonminMember2025-12-310001786909sbsw:PandoraAcquisitionByLonminMember2024-12-310001786909sbsw:PandoraAcquisitionByLonminMember2023-12-310001786909sbsw:MarikanaOperationsSegmentMember2025-12-310001786909sbsw:MarikanaOperationsSegmentMember2024-12-310001786909sbsw:MarikanaOperationsSegmentMember2023-12-310001786909sbsw:KeliberOperationsSegmentMember2025-12-310001786909sbsw:KeliberOperationsSegmentMember2024-12-310001786909sbsw:KeliberOperationsSegmentMember2023-12-310001786909sbsw:RustenburgOperationsSegmentMembersbsw:KroondalMineMember2023-11-010001786909sbsw:ContingentConsiderationRelatedToDeliveryOfAgreedOuncesMembersbsw:RustenburgOperationsSegmentMembersbsw:KroondalMineMember2023-11-010001786909sbsw:KroondalMineMemberifrs-full:ContingentConsiderationMember2025-01-012025-12-310001786909sbsw:SibanyeRustenburgPlatinumMinesProprietaryLimitedSubsidiaryMembersbsw:ContingentConsiderationRelatedToAAPReceivablePortionMember2023-11-010001786909sbsw:KroondalMineMemberifrs-full:ContingentConsiderationMember2024-12-310001786909sbsw:KroondalMineMemberifrs-full:ContingentConsiderationMember2023-12-310001786909sbsw:KroondalMineMemberifrs-full:ContingentConsiderationMember2022-12-310001786909sbsw:KroondalMineMemberifrs-full:ContingentConsiderationMember2025-12-310001786909sbsw:KroondalMineMemberifrs-full:ContingentConsiderationMember2024-01-012024-12-310001786909sbsw:KroondalMineMemberifrs-full:ContingentConsiderationMember2023-01-012023-12-310001786909sbsw:PandoraAcquisitionByLonminMember2017-12-310001786909sbsw:PandoraAcquisitionByLonminMember2023-01-012023-12-310001786909ifrs-full:ContingentConsiderationMember2023-12-310001786909sbsw:PandoraAcquisitionByLonminMemberifrs-full:ContingentConsiderationMember2024-02-012024-02-010001786909sbsw:PandoraAcquisitionByLonminMemberifrs-full:ContingentConsiderationMember2024-12-310001786909sbsw:PandoraAcquisitionByLonminMemberifrs-full:ContingentConsiderationMember2023-12-310001786909sbsw:PandoraAcquisitionByLonminMemberifrs-full:ContingentConsiderationMember2022-12-310001786909sbsw:PandoraAcquisitionByLonminMemberifrs-full:ContingentConsiderationMember2025-01-012025-12-310001786909sbsw:PandoraAcquisitionByLonminMemberifrs-full:ContingentConsiderationMember2024-01-012024-12-310001786909sbsw:PandoraAcquisitionByLonminMemberifrs-full:ContingentConsiderationMember2023-01-012023-12-310001786909sbsw:PandoraAcquisitionByLonminMemberifrs-full:ContingentConsiderationMember2025-12-310001786909country:ZAsbsw:EasternPlatinumPtyLtdMember2025-12-310001786909country:ZAsbsw:WesternPlatinumPtyLtdMember2025-12-310001786909sbsw:MarikanaOperationsSegmentMember2022-12-310001786909sbsw:KeliberOyMember2023-04-252023-04-250001786909sbsw:KeliberOyMember2023-04-250001786909sbsw:KeliberOyMember2025-01-012025-12-310001786909sbsw:KeliberOyMember2024-01-012024-12-310001786909sbsw:KeliberOyMember2023-01-012023-12-310001786909sbsw:KeliberOyMember2025-12-310001786909sbsw:KeliberOyMember2024-12-310001786909sbsw:KeliberOyMember2023-12-310001786909ifrs-full:MiningAssetsMembersbsw:KeliberOyMember2025-01-012025-12-310001786909ifrs-full:MiningAssetsMembersbsw:KeliberOyMember2024-01-012024-12-310001786909ifrs-full:MiningAssetsMembersbsw:KeliberOyMember2023-01-012023-12-310001786909sbsw:KeliberOyMember2022-12-310001786909sbsw:ReldanGroupMember2023-12-310001786909sbsw:ReldanGroupMember2022-12-310001786909sbsw:ReldanGroupMember2025-01-012025-12-310001786909sbsw:ReldanGroupMember2023-01-012023-12-310001786909sbsw:RustenburgOperationsAcquisitionMember2025-01-012025-12-310001786909sbsw:RustenburgOperationsAcquisitionMember2024-01-012024-12-310001786909sbsw:RustenburgOperationsAcquisitionMember2023-01-012023-12-310001786909sbsw:PandoraAcquisitionByLonminMember2025-01-012025-12-310001786909sbsw:PandoraAcquisitionByLonminMember2024-01-012024-12-310001786909sbsw:KroondalMineMember2025-01-012025-12-310001786909sbsw:KroondalMineMember2024-01-012024-12-310001786909sbsw:KroondalMineMember2023-01-012023-12-310001786909sbsw:MarikanaOperationsSegmentMemberifrs-full:NotMeasuredAtFairValueInStatementOfFinancialPositionButForWhichFairValueIsDisclosedMember2025-12-310001786909sbsw:MarikanaOperationsSegmentMemberifrs-full:NotMeasuredAtFairValueInStatementOfFinancialPositionButForWhichFairValueIsDisclosedMember2024-12-310001786909sbsw:MarikanaOperationsSegmentMemberifrs-full:NotMeasuredAtFairValueInStatementOfFinancialPositionButForWhichFairValueIsDisclosedMember2023-12-310001786909sbsw:KeliberOyMemberifrs-full:NotMeasuredAtFairValueInStatementOfFinancialPositionButForWhichFairValueIsDisclosedMember2024-12-310001786909sbsw:KeliberOyMemberifrs-full:NotMeasuredAtFairValueInStatementOfFinancialPositionButForWhichFairValueIsDisclosedMember2023-12-310001786909sbsw:A4EBasketPriceMembersbsw:DividendObligationMemberifrs-full:CommodityPriceRiskMember2025-01-012025-12-310001786909sbsw:A4EBasketPriceMembersbsw:DividendObligationMemberifrs-full:CommodityPriceRiskMember2024-01-012024-12-310001786909sbsw:DividendObligationMemberifrs-full:CommodityPriceRiskMember2023-01-012023-12-310001786909sbsw:LithiumHydroxidePriceMembersbsw:DividendObligationMemberifrs-full:CommodityPriceRiskMember2024-01-012024-12-310001786909sbsw:LithiumHydroxidePriceMembersbsw:DividendObligationMemberifrs-full:CommodityPriceRiskMember2023-01-012023-12-310001786909sbsw:PgmMiningActivitiesMember2025-12-310001786909sbsw:PgmMiningActivitiesMember2024-12-310001786909sbsw:PgmMiningActivitiesMember2023-12-310001786909sbsw:GoldMiningActivitiesMember2025-12-310001786909sbsw:GoldMiningActivitiesMember2024-12-310001786909sbsw:GoldMiningActivitiesMember2023-12-310001786909sbsw:BatteryMetalsActivitiesMember2025-12-310001786909sbsw:BatteryMetalsActivitiesMember2024-12-310001786909sbsw:BatteryMetalsActivitiesMember2023-12-310001786909sbsw:ZincMiningActivitiesMember2025-12-310001786909sbsw:ZincMiningActivitiesMember2024-12-310001786909sbsw:ZincMiningActivitiesMember2023-12-310001786909sbsw:PgmMiningActivitiesWorkInProcessMember2025-01-012025-12-310001786909sbsw:PgmMiningActivitiesWorkInProcessMember2024-01-012024-12-310001786909sbsw:PgmMiningActivitiesWorkInProcessMember2023-01-012023-12-310001786909sbsw:PgmMiningActivitiesFinishedGoodsMember2025-01-012025-12-310001786909sbsw:PgmMiningActivitiesFinishedGoodsMember2024-01-012024-12-310001786909sbsw:PgmMiningActivitiesFinishedGoodsMember2023-01-012023-12-310001786909sbsw:PgmConcentrateMember2025-12-310001786909sbsw:PgmConcentrateMember2024-12-310001786909sbsw:PgmConcentrateMember2023-12-310001786909sbsw:PgmOtherMember2025-12-310001786909sbsw:PgmOtherMember2024-12-310001786909sbsw:PgmOtherMember2023-12-310001786909sbsw:EScrapRecyclingActivitiesMember2025-12-310001786909sbsw:EScrapRecyclingActivitiesMember2024-12-310001786909sbsw:EScrapRecyclingActivitiesMember2023-12-310001786909sbsw:OtherThanGoldAndPgmMiningActivitiesMember2025-12-310001786909sbsw:OtherThanGoldAndPgmMiningActivitiesMember2024-12-310001786909sbsw:OtherThanGoldAndPgmMiningActivitiesMember2023-12-310001786909sbsw:DrdgoldLimitedMember2024-12-310001786909sbsw:DrdgoldLimitedMember2023-12-310001786909ifrs-full:FinancialInstrumentsCreditimpairedMembersbsw:OtherThanGoldAndPgmMiningActivitiesMember2024-12-310001786909ifrs-full:FinancialInstrumentsCreditimpairedMembersbsw:OtherThanGoldAndPgmMiningActivitiesMember2023-12-310001786909ifrs-full:FinancialInstrumentsCreditimpairedMembersbsw:OtherThanGoldAndPgmMiningActivitiesMember2022-12-310001786909ifrs-full:FinancialInstrumentsCreditimpairedMembersbsw:OtherThanGoldAndPgmMiningActivitiesMember2025-01-012025-12-310001786909ifrs-full:FinancialInstrumentsCreditimpairedMembersbsw:OtherThanGoldAndPgmMiningActivitiesMember2024-01-012024-12-310001786909ifrs-full:FinancialInstrumentsCreditimpairedMembersbsw:OtherThanGoldAndPgmMiningActivitiesMember2023-01-012023-12-310001786909ifrs-full:FinancialInstrumentsCreditimpairedMembersbsw:OtherThanGoldAndPgmMiningActivitiesMember2025-12-310001786909sbsw:BlueRidgePlatinumPtyLtdMemberifrs-full:FinancialInstrumentsCreditimpairedMembersbsw:OtherThanGoldAndPgmMiningActivitiesMember2025-01-012025-12-310001786909ifrs-full:CommodityPriceRiskMembersbsw:PgmConcentrateMember2025-01-012025-12-310001786909ifrs-full:CurrencyRiskMemberifrs-full:TradeReceivablesMember2025-01-012025-12-310001786909ifrs-full:CurrencyRiskMemberifrs-full:TradeReceivablesMember2025-12-310001786909ifrs-full:NoncontrollingInterestsMembersbsw:DrdgoldLimitedMember2025-12-310001786909ifrs-full:NoncontrollingInterestsMembersbsw:DrdgoldLimitedMember2024-12-310001786909ifrs-full:NoncontrollingInterestsMembersbsw:DrdgoldLimitedMember2023-12-310001786909ifrs-full:NoncontrollingInterestsMembersbsw:KeliberOyMember2025-12-310001786909ifrs-full:NoncontrollingInterestsMembersbsw:KeliberOyMember2024-12-310001786909ifrs-full:NoncontrollingInterestsMembersbsw:KeliberOyMember2023-12-310001786909ifrs-full:NoncontrollingInterestsMembersbsw:GTSMSubsidiaryMember2025-12-310001786909ifrs-full:NoncontrollingInterestsMembersbsw:GTSMSubsidiaryMember2024-12-310001786909ifrs-full:NoncontrollingInterestsMembersbsw:GTSMSubsidiaryMember2023-12-310001786909ifrs-full:OperatingSegmentsMembersbsw:DrdgoldLimitedMember2025-01-012025-12-310001786909ifrs-full:OperatingSegmentsMembersbsw:DrdgoldLimitedMember2024-01-012024-12-310001786909ifrs-full:OperatingSegmentsMembersbsw:DrdgoldLimitedMember2023-01-012023-12-310001786909ifrs-full:NoncontrollingInterestsMemberifrs-full:OperatingSegmentsMembersbsw:DrdgoldLimitedMember2025-01-012025-12-310001786909ifrs-full:NoncontrollingInterestsMemberifrs-full:OperatingSegmentsMembersbsw:DrdgoldLimitedMember2024-01-012024-12-310001786909ifrs-full:NoncontrollingInterestsMemberifrs-full:OperatingSegmentsMembersbsw:DrdgoldLimitedMember2023-01-012023-12-310001786909ifrs-full:NoncontrollingInterestsMemberifrs-full:OperatingSegmentsMembersbsw:DrdgoldLimitedMember2025-12-310001786909ifrs-full:NoncontrollingInterestsMemberifrs-full:OperatingSegmentsMembersbsw:DrdgoldLimitedMember2024-12-310001786909ifrs-full:NoncontrollingInterestsMemberifrs-full:OperatingSegmentsMembersbsw:DrdgoldLimitedMember2023-12-310001786909ifrs-full:OperatingSegmentsMembersbsw:KeliberOyMember2025-01-012025-12-310001786909ifrs-full:OperatingSegmentsMembersbsw:KeliberOyMember2024-01-012024-12-310001786909ifrs-full:OperatingSegmentsMembersbsw:KeliberOyMember2023-01-012023-12-310001786909ifrs-full:NoncontrollingInterestsMemberifrs-full:OperatingSegmentsMembersbsw:KeliberOyMember2025-01-012025-12-310001786909ifrs-full:NoncontrollingInterestsMemberifrs-full:OperatingSegmentsMembersbsw:KeliberOyMember2024-01-012024-12-310001786909ifrs-full:NoncontrollingInterestsMemberifrs-full:OperatingSegmentsMembersbsw:KeliberOyMember2023-01-012023-12-310001786909ifrs-full:NoncontrollingInterestsMemberifrs-full:OperatingSegmentsMembersbsw:KeliberOyMember2025-12-310001786909ifrs-full:NoncontrollingInterestsMemberifrs-full:OperatingSegmentsMembersbsw:KeliberOyMember2024-12-310001786909ifrs-full:NoncontrollingInterestsMemberifrs-full:OperatingSegmentsMembersbsw:KeliberOyMember2023-12-310001786909sbsw:DrdgoldLimitedMember2020-01-100001786909sbsw:DrdgoldLimitedMember2024-01-012024-12-310001786909sbsw:DrdgoldLimitedMember2023-01-012023-12-310001786909sbsw:FinnishMineralGroupMembersbsw:KeliberOyMember2023-04-242023-04-240001786909sbsw:FinnishMineralGroupMembersbsw:KeliberOyMember2023-04-252023-04-250001786909sbsw:KeliberOyMembersbsw:FinnishMineralGroupMember2023-04-252023-04-250001786909sbsw:KeliberOyMember2023-04-252023-04-250001786909sbsw:MinorityShareholdersMembersbsw:KeliberOyMember2023-01-012023-12-310001786909sbsw:MinorityShareholdersMembersbsw:KeliberOyMember2023-04-252023-04-250001786909sbsw:KeliberOyMember2023-06-012023-06-300001786909sbsw:KeliberOyMember2023-06-012023-12-310001786909srt:ConsolidationEliminationsMembersbsw:KeliberOyMember2023-01-012023-12-310001786909sbsw:KeliberOyMember2023-04-250001786909sbsw:NewCenturyResourcesLimitedMember2023-05-100001786909sbsw:NewCenturyResourcesLimitedMember2023-12-310001786909ifrs-full:RetainedEarningsMembersbsw:NewCenturyResourcesLimitedMember2024-01-012024-12-310001786909ifrs-full:ReserveOfExchangeDifferencesOnTranslationMembersbsw:NewCenturyResourcesLimitedMember2024-01-012024-12-310001786909sbsw:US1BillionRevolvingCreditFacilityMember2023-04-060001786909sbsw:US1BillionRevolvingCreditFacilityMember2025-12-310001786909sbsw:US1BillionRevolvingCreditFacilityMember2024-12-310001786909sbsw:US1BillionRevolvingCreditFacilityMember2023-12-310001786909sbsw:R5.5BillionRevolvingCreditFacilityMember2019-10-250001786909sbsw:R5.5BillionRevolvingCreditFacilityMember2025-12-310001786909sbsw:R5.5BillionRevolvingCreditFacilityMember2024-12-310001786909sbsw:R5.5BillionRevolvingCreditFacilityMember2023-12-310001786909sbsw:R6.5BillionRevolvingCreditFacilityMember2024-12-060001786909sbsw:R6.5BillionRevolvingCreditFacilityMember2025-12-310001786909sbsw:R6.5BillionRevolvingCreditFacilityMember2024-12-310001786909sbsw:R6.5BillionRevolvingCreditFacilityMember2023-12-310001786909sbsw:US675MillionSeniorNotesDue2026AndUS525MillionSeniorNotesDue2029Member2025-12-310001786909sbsw:US675MillionSeniorNotesDue2026AndUS525MillionSeniorNotesDue2029Member2024-12-310001786909sbsw:US675MillionSeniorNotesDue2026AndUS525MillionSeniorNotesDue2029Member2023-12-310001786909sbsw:US500MillionConvertibleBondDue2028Member2025-12-310001786909sbsw:US500MillionConvertibleBondDue2028Member2024-12-310001786909sbsw:US500MillionConvertibleBondDue2028Member2023-12-310001786909sbsw:KeliberLoanFacilitiesMember2025-12-310001786909sbsw:KeliberLoanFacilitiesMember2024-12-310001786909sbsw:KeliberLoanFacilitiesMember2023-12-310001786909sbsw:OtherBorrowingsMember2025-12-310001786909sbsw:OtherBorrowingsMember2024-12-310001786909sbsw:OtherBorrowingsMember2023-12-310001786909sbsw:FrancoNevadaContractLiabilityMember2025-12-310001786909sbsw:FrancoNevadaContractLiabilityMember2024-12-310001786909sbsw:FrancoNevadaContractLiabilityMember2023-12-310001786909sbsw:ConvertibleDebenturesMember2025-12-310001786909sbsw:ConvertibleDebenturesMember2024-12-310001786909sbsw:ConvertibleDebenturesMember2023-12-310001786909sbsw:US500MillionConvertibleBondDue2028DerivativeElementMember2023-01-012023-12-310001786909sbsw:US600MillionRevolvingCreditFacilityMember2023-04-060001786909sbsw:US1BillionRevolvingCreditFacilityMembersbsw:NetDebtToEbitdaLessThanMinimumThresholdMembersbsw:SecuredOvernightFinancingRateSOFRMember2023-04-060001786909srt:MinimumMembersbsw:US1BillionRevolvingCreditFacilityMember2023-04-062023-04-060001786909sbsw:US1BillionRevolvingCreditFacilityMembersbsw:NetDebtToEbitdaBetweenMinimumThresholdAndMidrangeMembersbsw:SecuredOvernightFinancingRateSOFRMember2023-04-060001786909srt:MedianMembersbsw:US1BillionRevolvingCreditFacilityMember2023-04-062023-04-060001786909sbsw:US1BillionRevolvingCreditFacilityMembersbsw:NetDebtToEbitdaBetweenMidrangeAndMaximumThresholdMembersbsw:SecuredOvernightFinancingRateSOFRMember2023-04-060001786909srt:MaximumMembersbsw:US1BillionRevolvingCreditFacilityMember2023-04-062023-04-060001786909sbsw:US1BillionRevolvingCreditFacilityMembersbsw:NetDebtToEbitdaAboveMaximumThresholdMembersbsw:SecuredOvernightFinancingRateSOFRMember2023-04-060001786909sbsw:US1BillionRevolvingCreditFacilityMember2023-04-062023-04-060001786909sbsw:US1BillionRevolvingCreditFacilityMember2022-12-310001786909sbsw:US1BillionRevolvingCreditFacilityMember2025-01-012025-12-310001786909sbsw:US1BillionRevolvingCreditFacilityMember2024-01-012024-12-310001786909sbsw:US1BillionRevolvingCreditFacilityMember2023-01-012023-12-310001786909sbsw:R6.5BillionRevolvingCreditFacilityMember2024-08-160001786909sbsw:R5.5BillionRevolvingCreditFacilityMembersbsw:JohannesburgInterbankAverageRateJIBARMemberifrs-full:BottomOfRangeMember2019-10-250001786909sbsw:R5.5BillionRevolvingCreditFacilityMember2019-10-252019-10-250001786909sbsw:R5.5BillionRevolvingCreditFacilityMembersbsw:JohannesburgInterbankAverageRateJIBARMemberifrs-full:TopOfRangeMember2019-10-250001786909sbsw:R5.5BillionRevolvingCreditFacilityMember2022-12-310001786909sbsw:R5.5BillionRevolvingCreditFacilityMember2025-01-012025-12-310001786909sbsw:R5.5BillionRevolvingCreditFacilityMember2024-01-012024-12-310001786909sbsw:R5.5BillionRevolvingCreditFacilityMember2023-01-012023-12-310001786909sbsw:R6.0BillionRevolvingCreditFacilityMember2024-08-160001786909sbsw:R500MillionRevolvingCreditFacilityMember2024-12-060001786909sbsw:R6.5BillionRevolvingCreditFacilityMembersbsw:NetDebtToEbitdaLessThanMinimumThresholdMembersbsw:JohannesburgInterbankAverageRateJIBARMember2024-12-060001786909srt:MinimumMembersbsw:R6.5BillionRevolvingCreditFacilityMember2024-12-062024-12-060001786909sbsw:R6.5BillionRevolvingCreditFacilityMembersbsw:NetDebtToEbitdaBetweenMinimumThresholdAndMidrangeMembersbsw:JohannesburgInterbankAverageRateJIBARMember2024-12-060001786909srt:MedianMembersbsw:R6.5BillionRevolvingCreditFacilityMember2024-12-062024-12-060001786909sbsw:R6.5BillionRevolvingCreditFacilityMembersbsw:NetDebtToEbitdaBetweenMidrangeAndMaximumThresholdMembersbsw:JohannesburgInterbankAverageRateJIBARMember2024-12-060001786909srt:MaximumMembersbsw:R6.5BillionRevolvingCreditFacilityMember2024-12-062024-12-060001786909sbsw:R6.5BillionRevolvingCreditFacilityMembersbsw:NetDebtToEbitdaAboveMaximumThresholdMembersbsw:JohannesburgInterbankAverageRateJIBARMember2024-12-060001786909sbsw:R6.5BillionRevolvingCreditFacilityMember2024-12-062024-12-060001786909sbsw:R6.5BillionRevolvingCreditFacilityMember2022-12-310001786909sbsw:R6.5BillionRevolvingCreditFacilityMember2025-01-012025-12-310001786909sbsw:R6.5BillionRevolvingCreditFacilityMember2024-01-012024-12-310001786909sbsw:R6.5BillionRevolvingCreditFacilityMember2023-01-012023-12-310001786909sbsw:US675MillionSeniorNotesDue2026Member2021-11-160001786909sbsw:US525MillionSeniorNotesDue2029Member2021-11-160001786909sbsw:US675MillionSeniorNotesDue2026Member2021-11-162021-11-160001786909sbsw:US525MillionSeniorNotesDue2029Member2021-11-162021-11-160001786909sbsw:US675MillionSeniorNotesDue2026AndUS525MillionSeniorNotesDue2029Member2022-12-310001786909sbsw:US675MillionSeniorNotesDue2026AndUS525MillionSeniorNotesDue2029Member2025-01-012025-12-310001786909sbsw:US675MillionSeniorNotesDue2026AndUS525MillionSeniorNotesDue2029Member2024-01-012024-12-310001786909sbsw:US675MillionSeniorNotesDue2026AndUS525MillionSeniorNotesDue2029Member2023-01-012023-12-310001786909sbsw:US500MillionConvertibleBondDue2028Member2025-01-012025-12-310001786909sbsw:US500MillionConvertibleBondDue2028DerivativeElementMember2025-01-012025-12-310001786909sbsw:US500MillionConvertibleBondDue2028DerivativeElementMember2023-11-212023-11-210001786909sbsw:US500MillionConvertibleBondDue2028DerivativeElementMember2023-11-210001786909sbsw:US500MillionConvertibleBondDue2028Member2022-12-310001786909sbsw:US500MillionConvertibleBondDue2028Member2024-01-012024-12-310001786909sbsw:US500MillionConvertibleBondDue2028Member2023-01-012023-12-310001786909sbsw:US500MillionConvertibleBondDue2028DerivativeElementMember2024-12-310001786909sbsw:US500MillionConvertibleBondDue2028DerivativeElementMember2023-12-310001786909sbsw:US500MillionConvertibleBondDue2028DerivativeElementMember2022-12-310001786909sbsw:US500MillionConvertibleBondDue2028DerivativeElementMember2024-01-012024-12-310001786909sbsw:US500MillionConvertibleBondDue2028DerivativeElementMember2023-01-012023-12-310001786909sbsw:US500MillionConvertibleBondDue2028DerivativeElementMember2025-12-310001786909sbsw:BurnstoneDebtMember2014-07-010001786909sbsw:A1US0.2MillionMember2014-07-010001786909sbsw:A2US7.8MillionMember2014-07-010001786909sbsw:A3US51.0MillionMember2014-07-010001786909sbsw:A4US119.1MillionMember2014-07-010001786909sbsw:A3US51.0MillionAndA4Us119.1MillionMember2017-07-010001786909sbsw:A2US7.8MillionMember2017-07-012017-07-010001786909sbsw:A3US51.0MillionAndA4Us119.1MillionMember2017-07-012017-07-010001786909sbsw:BurnstoneDebtMember2017-07-012017-07-010001786909sbsw:BurnstoneDebtMember2022-12-310001786909sbsw:BurnstoneDebtMember2025-01-012025-12-310001786909sbsw:BurnstoneDebtMember2024-01-012024-12-310001786909sbsw:BurnstoneDebtMember2023-01-012023-12-310001786909sbsw:A2US7.8MillionMember2025-12-310001786909sbsw:A3US51.0MillionAndA4Us119.1MillionMember2025-12-310001786909sbsw:ExportCreditAgencyFacilityMember2025-12-310001786909sbsw:EuropeanInvestmentBankFacilityMember2025-12-310001786909sbsw:SyndicatedCommercialBankFacilityMember2025-12-310001786909sbsw:EuroInterbankOfferedRateEURIBORMembersbsw:ExportCreditAgencyFacilityMember2025-12-310001786909sbsw:ExportCreditAgencyFacilityMember2025-01-012025-12-310001786909sbsw:EuroInterbankOfferedRateEURIBORMembersbsw:EuropeanInvestmentBankFacilityMember2025-12-310001786909sbsw:EuropeanInvestmentBankFacilityMember2025-01-012025-12-310001786909sbsw:SyndicatedCommercialBankFacilityMembersbsw:EuroInterbankOfferedRateEURIBORMemberifrs-full:BottomOfRangeMember2025-12-310001786909srt:MinimumMembersbsw:KeliberLoanFacilitiesMember2025-01-012025-12-310001786909sbsw:SyndicatedCommercialBankFacilityMembersbsw:MidRangeMember2025-12-310001786909srt:MaximumMembersbsw:KeliberLoanFacilitiesMember2025-01-012025-12-310001786909sbsw:SyndicatedCommercialBankFacilityMemberifrs-full:TopOfRangeMember2025-12-310001786909sbsw:SyndicatedCommercialBankFacilityMember2025-01-012025-12-310001786909sbsw:KeliberLoanFacilitiesMember2022-12-310001786909sbsw:KeliberLoanFacilitiesMember2025-01-012025-12-310001786909sbsw:KeliberLoanFacilitiesMember2024-01-012024-12-310001786909sbsw:KeliberLoanFacilitiesMember2023-01-012023-12-310001786909sbsw:OtherBorrowingsMember2022-12-310001786909sbsw:OtherBorrowingsMember2025-01-012025-12-310001786909sbsw:OtherBorrowingsMember2024-01-012024-12-310001786909sbsw:OtherBorrowingsMember2023-01-012023-12-310001786909sbsw:US675MillionSeniorNotesDue2026AndUS525MillionSeniorNotesDue2029Memberifrs-full:NotMeasuredAtFairValueInStatementOfFinancialPositionButForWhichFairValueIsDisclosedMember2025-12-310001786909ifrs-full:Level1OfFairValueHierarchyMembersbsw:US675MillionSeniorNotesDue2026AndUS525MillionSeniorNotesDue2029Member2025-12-310001786909ifrs-full:Level2OfFairValueHierarchyMembersbsw:US675MillionSeniorNotesDue2026AndUS525MillionSeniorNotesDue2029Member2025-12-310001786909ifrs-full:Level3OfFairValueHierarchyMembersbsw:US675MillionSeniorNotesDue2026AndUS525MillionSeniorNotesDue2029Member2025-12-310001786909sbsw:BurnstoneDebtMemberifrs-full:NotMeasuredAtFairValueInStatementOfFinancialPositionButForWhichFairValueIsDisclosedMember2025-12-310001786909ifrs-full:Level1OfFairValueHierarchyMembersbsw:BurnstoneDebtMember2025-12-310001786909ifrs-full:Level2OfFairValueHierarchyMembersbsw:BurnstoneDebtMember2025-12-310001786909ifrs-full:Level3OfFairValueHierarchyMembersbsw:BurnstoneDebtMember2025-12-310001786909sbsw:US500MillionConvertibleBondDue2028Memberifrs-full:NotMeasuredAtFairValueInStatementOfFinancialPositionButForWhichFairValueIsDisclosedMember2025-12-310001786909ifrs-full:Level1OfFairValueHierarchyMembersbsw:US500MillionConvertibleBondDue2028Member2025-12-310001786909ifrs-full:Level2OfFairValueHierarchyMembersbsw:US500MillionConvertibleBondDue2028Member2025-12-310001786909ifrs-full:Level3OfFairValueHierarchyMembersbsw:US500MillionConvertibleBondDue2028Member2025-12-310001786909ifrs-full:NotMeasuredAtFairValueInStatementOfFinancialPositionButForWhichFairValueIsDisclosedMember2025-12-310001786909ifrs-full:Level1OfFairValueHierarchyMember2025-12-310001786909ifrs-full:Level2OfFairValueHierarchyMember2025-12-310001786909ifrs-full:Level3OfFairValueHierarchyMember2025-12-310001786909sbsw:US675MillionSeniorNotesDue2026AndUS525MillionSeniorNotesDue2029Memberifrs-full:NotMeasuredAtFairValueInStatementOfFinancialPositionButForWhichFairValueIsDisclosedMember2024-12-310001786909ifrs-full:Level1OfFairValueHierarchyMembersbsw:US675MillionSeniorNotesDue2026AndUS525MillionSeniorNotesDue2029Member2024-12-310001786909ifrs-full:Level2OfFairValueHierarchyMembersbsw:US675MillionSeniorNotesDue2026AndUS525MillionSeniorNotesDue2029Member2024-12-310001786909ifrs-full:Level3OfFairValueHierarchyMembersbsw:US675MillionSeniorNotesDue2026AndUS525MillionSeniorNotesDue2029Member2024-12-310001786909sbsw:BurnstoneDebtMemberifrs-full:NotMeasuredAtFairValueInStatementOfFinancialPositionButForWhichFairValueIsDisclosedMember2024-12-310001786909ifrs-full:Level1OfFairValueHierarchyMembersbsw:BurnstoneDebtMember2024-12-310001786909ifrs-full:Level2OfFairValueHierarchyMembersbsw:BurnstoneDebtMember2024-12-310001786909ifrs-full:Level3OfFairValueHierarchyMembersbsw:BurnstoneDebtMember2024-12-310001786909sbsw:US500MillionConvertibleBondDue2028Memberifrs-full:NotMeasuredAtFairValueInStatementOfFinancialPositionButForWhichFairValueIsDisclosedMember2024-12-310001786909ifrs-full:Level1OfFairValueHierarchyMembersbsw:US500MillionConvertibleBondDue2028Member2024-12-310001786909ifrs-full:Level2OfFairValueHierarchyMembersbsw:US500MillionConvertibleBondDue2028Member2024-12-310001786909ifrs-full:Level3OfFairValueHierarchyMembersbsw:US500MillionConvertibleBondDue2028Member2024-12-310001786909ifrs-full:NotMeasuredAtFairValueInStatementOfFinancialPositionButForWhichFairValueIsDisclosedMember2024-12-310001786909ifrs-full:Level1OfFairValueHierarchyMember2024-12-310001786909ifrs-full:Level2OfFairValueHierarchyMember2024-12-310001786909ifrs-full:Level3OfFairValueHierarchyMember2024-12-310001786909sbsw:US675MillionSeniorNotesDue2026AndUS525MillionSeniorNotesDue2029Memberifrs-full:NotMeasuredAtFairValueInStatementOfFinancialPositionButForWhichFairValueIsDisclosedMember2023-12-310001786909ifrs-full:Level1OfFairValueHierarchyMembersbsw:US675MillionSeniorNotesDue2026AndUS525MillionSeniorNotesDue2029Member2023-12-310001786909ifrs-full:Level2OfFairValueHierarchyMembersbsw:US675MillionSeniorNotesDue2026AndUS525MillionSeniorNotesDue2029Member2023-12-310001786909ifrs-full:Level3OfFairValueHierarchyMembersbsw:US675MillionSeniorNotesDue2026AndUS525MillionSeniorNotesDue2029Member2023-12-310001786909sbsw:BurnstoneDebtMemberifrs-full:NotMeasuredAtFairValueInStatementOfFinancialPositionButForWhichFairValueIsDisclosedMember2023-12-310001786909ifrs-full:Level1OfFairValueHierarchyMembersbsw:BurnstoneDebtMember2023-12-310001786909ifrs-full:Level2OfFairValueHierarchyMembersbsw:BurnstoneDebtMember2023-12-310001786909ifrs-full:Level3OfFairValueHierarchyMembersbsw:BurnstoneDebtMember2023-12-310001786909sbsw:US500MillionConvertibleBondDue2028Memberifrs-full:NotMeasuredAtFairValueInStatementOfFinancialPositionButForWhichFairValueIsDisclosedMember2023-12-310001786909ifrs-full:Level1OfFairValueHierarchyMembersbsw:US500MillionConvertibleBondDue2028Member2023-12-310001786909ifrs-full:Level2OfFairValueHierarchyMembersbsw:US500MillionConvertibleBondDue2028Member2023-12-310001786909ifrs-full:Level3OfFairValueHierarchyMembersbsw:US500MillionConvertibleBondDue2028Member2023-12-310001786909ifrs-full:NotMeasuredAtFairValueInStatementOfFinancialPositionButForWhichFairValueIsDisclosedMember2023-12-310001786909ifrs-full:Level1OfFairValueHierarchyMember2023-12-310001786909ifrs-full:Level2OfFairValueHierarchyMember2023-12-310001786909ifrs-full:Level3OfFairValueHierarchyMember2023-12-310001786909sbsw:US500MillionConvertibleBondDue2028Memberifrs-full:FinancialAssetsAtAmortisedCostCategoryMemberifrs-full:Level2OfFairValueHierarchyMember2025-12-310001786909sbsw:US500MillionConvertibleBondDue2028Memberifrs-full:FinancialAssetsAtAmortisedCostCategoryMemberifrs-full:Level2OfFairValueHierarchyMember2024-12-310001786909ifrs-full:CurrencyRiskMember2025-12-310001786909ifrs-full:CurrencyRiskMember2024-12-310001786909ifrs-full:CurrencyRiskMember2023-12-310001786909ifrs-full:CurrencyRiskMember2024-01-012024-12-310001786909ifrs-full:CurrencyRiskMember2023-01-012023-12-310001786909ifrs-full:InterestRateRiskMember2025-12-310001786909ifrs-full:InterestRateRiskMember2024-12-310001786909ifrs-full:InterestRateRiskMember2023-12-310001786909ifrs-full:InterestRateRiskMemberifrs-full:BottomOfRangeMember2025-01-012025-12-310001786909ifrs-full:InterestRateRiskMemberifrs-full:TopOfRangeMember2025-01-012025-12-310001786909sbsw:JohannesburgInterbankAverageRateJIBARMemberifrs-full:InterestRateRiskMember2025-01-012025-12-310001786909sbsw:TermSecuredOvernightFinancingRateSOFRMemberifrs-full:InterestRateRiskMember2025-01-012025-12-310001786909sbsw:EuroInterbankOfferedRateEURIBORMemberifrs-full:InterestRateRiskMember2025-01-012025-12-310001786909ifrs-full:InterestRateRiskMember2025-01-012025-12-310001786909sbsw:JohannesburgInterbankAverageRateJIBARMemberifrs-full:InterestRateRiskMember2024-01-012024-12-310001786909sbsw:TermSecuredOvernightFinancingRateSOFRMemberifrs-full:InterestRateRiskMember2024-01-012024-12-310001786909sbsw:EuroInterbankOfferedRateEURIBORMemberifrs-full:InterestRateRiskMember2024-01-012024-12-310001786909ifrs-full:InterestRateRiskMember2024-01-012024-12-310001786909sbsw:JohannesburgInterbankAverageRateJIBARMemberifrs-full:InterestRateRiskMember2023-01-012023-12-310001786909sbsw:LondonInterbankOfferedRateMemberifrs-full:InterestRateRiskMember2023-01-012023-12-310001786909ifrs-full:InterestRateRiskMember2023-01-012023-12-310001786909sbsw:JohannesburgInterbankAverageRateJIBARMember2025-01-012025-12-310001786909sbsw:JohannesburgInterbankAverageRateJIBARMember2024-01-012024-12-310001786909sbsw:JohannesburgInterbankAverageRateJIBARMember2023-01-012023-12-310001786909sbsw:TermSecuredOvernightFinancingRateSOFRMember2025-01-012025-12-310001786909sbsw:TermSecuredOvernightFinancingRateSOFRMember2024-01-012024-12-310001786909sbsw:TermSecuredOvernightFinancingRateSOFRMember2023-01-012023-12-310001786909sbsw:LondonInterbankOfferedRateMember2025-01-012025-12-310001786909sbsw:LondonInterbankOfferedRateMember2024-01-012024-12-310001786909sbsw:LondonInterbankOfferedRateMember2023-01-012023-12-310001786909sbsw:EuroInterbankOfferedRateEURIBORMember2025-01-012025-12-310001786909sbsw:EuroInterbankOfferedRateEURIBORMember2024-01-012024-12-310001786909sbsw:EuroInterbankOfferedRateEURIBORMember2023-01-012023-12-310001786909ifrs-full:NotLaterThanOneYearMember2025-12-310001786909ifrs-full:NotLaterThanOneYearMember2024-12-310001786909ifrs-full:NotLaterThanOneYearMember2023-12-310001786909ifrs-full:LaterThanOneYearAndNotLaterThanTwoYearsMember2025-12-310001786909ifrs-full:LaterThanOneYearAndNotLaterThanTwoYearsMember2024-12-310001786909ifrs-full:LaterThanOneYearAndNotLaterThanTwoYearsMember2023-12-310001786909ifrs-full:LaterThanTwoYearsAndNotLaterThanThreeYearsMember2025-12-310001786909ifrs-full:LaterThanTwoYearsAndNotLaterThanThreeYearsMember2024-12-310001786909ifrs-full:LaterThanTwoYearsAndNotLaterThanThreeYearsMember2023-12-310001786909ifrs-full:LaterThanThreeYearsMember2025-12-310001786909ifrs-full:LaterThanThreeYearsMember2024-12-310001786909ifrs-full:LaterThanThreeYearsMember2023-12-3100017869092023-11-012023-11-010001786909ifrs-full:LaterThanOneYearAndNotLaterThanFiveYearsMember2025-12-310001786909ifrs-full:LaterThanFiveYearsMember2025-12-310001786909ifrs-full:LaterThanOneYearAndNotLaterThanFiveYearsMember2024-12-310001786909ifrs-full:LaterThanFiveYearsMember2024-12-310001786909ifrs-full:LaterThanOneYearAndNotLaterThanFiveYearsMember2023-12-310001786909ifrs-full:LaterThanFiveYearsMember2023-12-310001786909sbsw:GoldDivisionSegmentMembercountry:ZA2025-01-012025-12-310001786909country:ZAsbsw:GoldDivisionSegmentMemberifrs-full:BottomOfRangeMember2025-01-012025-12-310001786909country:ZAsbsw:GoldDivisionSegmentMemberifrs-full:TopOfRangeMember2025-01-012025-12-310001786909sbsw:PlatinumDivisionSegmentMembercountry:ZA2025-01-012025-12-310001786909country:ZAsbsw:PlatinumDivisionSegmentMemberifrs-full:BottomOfRangeMember2025-01-012025-12-310001786909country:ZAsbsw:PlatinumDivisionSegmentMemberifrs-full:TopOfRangeMember2025-01-012025-12-310001786909sbsw:PlatinumDivisionSegmentMembersrt:NorthAmericaMember2025-01-012025-12-310001786909srt:NorthAmericaMembersbsw:PlatinumDivisionSegmentMemberifrs-full:BottomOfRangeMember2025-01-012025-12-310001786909srt:NorthAmericaMembersbsw:PlatinumDivisionSegmentMemberifrs-full:TopOfRangeMember2025-01-012025-12-310001786909srt:EuropeMemberifrs-full:BottomOfRangeMember2025-01-012025-12-310001786909srt:EuropeMemberifrs-full:TopOfRangeMember2025-01-012025-12-310001786909country:AUifrs-full:BottomOfRangeMember2025-01-012025-12-310001786909country:AUifrs-full:TopOfRangeMember2025-01-012025-12-310001786909sbsw:GoldDivisionSegmentMembercountry:ZA2024-01-012024-12-310001786909country:ZAsbsw:GoldDivisionSegmentMemberifrs-full:BottomOfRangeMember2024-01-012024-12-310001786909country:ZAsbsw:GoldDivisionSegmentMemberifrs-full:TopOfRangeMember2024-01-012024-12-310001786909sbsw:PlatinumDivisionSegmentMembercountry:ZA2024-01-012024-12-310001786909country:ZAsbsw:PlatinumDivisionSegmentMemberifrs-full:BottomOfRangeMember2024-01-012024-12-310001786909country:ZAsbsw:PlatinumDivisionSegmentMemberifrs-full:TopOfRangeMember2024-01-012024-12-310001786909sbsw:PlatinumDivisionSegmentMembersrt:NorthAmericaMember2024-01-012024-12-310001786909srt:NorthAmericaMembersbsw:PlatinumDivisionSegmentMemberifrs-full:BottomOfRangeMember2024-01-012024-12-310001786909srt:NorthAmericaMembersbsw:PlatinumDivisionSegmentMemberifrs-full:TopOfRangeMember2024-01-012024-12-310001786909srt:EuropeMemberifrs-full:BottomOfRangeMember2024-01-012024-12-310001786909srt:EuropeMemberifrs-full:TopOfRangeMember2024-01-012024-12-310001786909country:AUifrs-full:BottomOfRangeMember2024-01-012024-12-310001786909country:AUifrs-full:TopOfRangeMember2024-01-012024-12-310001786909sbsw:GoldDivisionSegmentMembercountry:ZA2023-01-012023-12-310001786909country:ZAsbsw:GoldDivisionSegmentMemberifrs-full:BottomOfRangeMember2023-01-012023-12-310001786909country:ZAsbsw:GoldDivisionSegmentMemberifrs-full:TopOfRangeMember2023-01-012023-12-310001786909sbsw:PlatinumDivisionSegmentMembercountry:ZA2023-01-012023-12-310001786909country:ZAsbsw:PlatinumDivisionSegmentMemberifrs-full:BottomOfRangeMember2023-01-012023-12-310001786909country:ZAsbsw:PlatinumDivisionSegmentMemberifrs-full:TopOfRangeMember2023-01-012023-12-310001786909sbsw:PlatinumDivisionSegmentMembersrt:NorthAmericaMember2023-01-012023-12-310001786909srt:NorthAmericaMembersbsw:PlatinumDivisionSegmentMemberifrs-full:BottomOfRangeMember2023-01-012023-12-310001786909srt:NorthAmericaMembersbsw:PlatinumDivisionSegmentMemberifrs-full:TopOfRangeMember2023-01-012023-12-310001786909ifrs-full:DiscountRateMeasurementInputMemberifrs-full:ProvisionForDecommissioningRestorationAndRehabilitationCostsMember2025-12-310001786909ifrs-full:DiscountRateMeasurementInputMemberifrs-full:ProvisionForDecommissioningRestorationAndRehabilitationCostsMember2025-01-012025-12-310001786909ifrs-full:ActuarialAssumptionOfExpectedRatesOfInflationMemberifrs-full:ProvisionForDecommissioningRestorationAndRehabilitationCostsMember2025-12-310001786909ifrs-full:ActuarialAssumptionOfExpectedRatesOfInflationMemberifrs-full:ProvisionForDecommissioningRestorationAndRehabilitationCostsMember2025-01-012025-12-310001786909sbsw:DiscountPeriodMeasurementInputMemberifrs-full:ProvisionForDecommissioningRestorationAndRehabilitationCostsMember2025-01-012025-12-310001786909ifrs-full:OnerousContractsProvisionMember2025-01-012025-12-310001786909ifrs-full:OnerousContractsProvisionMember2024-01-012024-12-310001786909ifrs-full:OnerousContractsProvisionMember2023-01-012023-12-310001786909ifrs-full:LegalProceedingsProvisionMember2025-01-012025-12-310001786909ifrs-full:LegalProceedingsProvisionMember2024-01-012024-12-310001786909ifrs-full:LegalProceedingsProvisionMember2023-01-012023-12-310001786909ifrs-full:OnerousContractsProvisionMember2023-12-310001786909sbsw:SupplyContractMember2025-01-012025-12-310001786909sbsw:SupplyContractMember2024-01-012024-12-310001786909sbsw:SandouvilleSegmentMember2025-12-310001786909sbsw:AppianCapitalLegalSettlementMember2025-01-012025-12-310001786909sbsw:AppianCapitalLegalSettlementMember2025-12-092025-12-090001786909ifrs-full:LegalProceedingsProvisionMember2025-12-310001786909ifrs-full:LegalProceedingsProvisionMember2024-12-310001786909ifrs-full:LegalProceedingsProvisionMember2023-12-3100017869092018-05-032018-05-0300017869092019-07-262019-07-2600017869092019-12-192019-12-190001786909sbsw:WheatonPreciousMetalsInternationalMemberifrs-full:BottomOfRangeMember2025-12-310001786909sbsw:WheatonPreciousMetalsInternationalMemberifrs-full:TopOfRangeMember2025-12-310001786909sbsw:WheatonPreciousMetalsInternationalMember2025-01-012025-12-310001786909sbsw:WheatonPreciousMetalsInternationalMembersbsw:PlatinumMiningActivitiesMember2025-01-012025-12-310001786909sbsw:WheatonPreciousMetalsInternationalMembersbsw:LowestRangeOfProductDeliveryMembersbsw:PlatinumMiningActivitiesMember2025-01-012025-12-310001786909sbsw:WheatonPreciousMetalsInternationalMembersbsw:MiddleRangeOfProductDeliveryMembersbsw:PlatinumMiningActivitiesMember2025-01-012025-12-310001786909sbsw:WheatonPreciousMetalsInternationalMembersbsw:HighRangeOfProductDeliveryMembersbsw:PlatinumMiningActivitiesMember2025-01-012025-12-310001786909sbsw:WheatonPreciousMetalsInternationalMembersbsw:MiddleRangeOfProductDeliveryMembersbsw:PlatinumMiningActivitiesMemberifrs-full:BottomOfRangeMember2025-01-012025-12-310001786909sbsw:WheatonPreciousMetalsInternationalMembersbsw:HighRangeOfProductDeliveryMembersbsw:PlatinumMiningActivitiesMemberifrs-full:BottomOfRangeMember2025-01-012025-12-310001786909sbsw:WheatonPreciousMetalsInternationalMembersbsw:GoldMiningActivitiesMember2025-01-012025-12-310001786909sbsw:AdvanceNotFullyUtilisedMembersbsw:WheatonPreciousMetalsInternationalMember2025-01-012025-12-310001786909sbsw:AdvanceFullyUtilisedMembersbsw:WheatonPreciousMetalsInternationalMember2025-01-012025-12-310001786909sbsw:FrancoNevadaMember2025-12-310001786909sbsw:MarikanaMembersbsw:FrancoNevadaMember2025-01-012025-12-310001786909sbsw:RutenburgMembersbsw:FrancoNevadaMember2025-01-012025-12-310001786909sbsw:FrancoNevadaMembersbsw:PlatinumMiningActivitiesMember2025-01-012025-12-310001786909sbsw:FrancoNevadaMembersbsw:LowestRangeOfProductDeliveryMembersbsw:PlatinumMiningActivitiesMember2025-01-012025-12-310001786909sbsw:FrancoNevadaMembersbsw:HighRangeOfProductDeliveryMembersbsw:PlatinumMiningActivitiesMember2025-01-012025-12-310001786909sbsw:FrancoNevadaMembersbsw:GoldMiningActivitiesMember2025-01-012025-12-310001786909sbsw:FrancoNevadaMembersbsw:LowestRangeOfProductDeliveryMembersbsw:GoldMiningActivitiesMember2025-01-012025-12-310001786909sbsw:FrancoNevadaMembersbsw:LowestRangeOfProductDeliveryMembersbsw:GoldMiningActivitiesMemberifrs-full:BottomOfRangeMember2025-01-012025-12-310001786909sbsw:FrancoNevadaMembersbsw:HighRangeOfProductDeliveryMembersbsw:GoldMiningActivitiesMember2025-01-012025-12-310001786909sbsw:FrancoNevadaMembersbsw:HighRangeOfProductDeliveryMembersbsw:GoldMiningActivitiesMemberifrs-full:BottomOfRangeMember2025-01-012025-12-310001786909sbsw:FrancoNevadaMember2025-01-012025-12-310001786909sbsw:FrancoNevadaMember2024-12-190001786909sbsw:WheatonPreciousMetalsInternationalMember2018-07-012018-07-310001786909sbsw:FrancoNevadaMember2025-02-282025-02-280001786909sbsw:GoldMiningActivitiesMember2024-08-212024-08-210001786909srt:MaximumMembersbsw:GoldMiningActivitiesMember2024-08-210001786909srt:MinimumMembersbsw:GoldMiningActivitiesMember2024-08-210001786909sbsw:ChromeMiningActivitiesMember2024-12-012024-12-010001786909srt:MinimumMembersbsw:ChromeMiningActivitiesMember2024-12-012024-12-010001786909srt:MaximumMembersbsw:ChromeMiningActivitiesMember2024-12-012024-12-010001786909sbsw:WheatonPreciousMetalsInternationalMember2025-12-310001786909sbsw:WheatonPreciousMetalsInternationalMember2024-12-310001786909sbsw:WheatonPreciousMetalsInternationalMember2023-12-310001786909sbsw:FrancoNevadaMember2024-12-310001786909sbsw:FrancoNevadaMember2023-12-310001786909sbsw:ChromeMiningActivitiesMember2025-12-310001786909sbsw:ChromeMiningActivitiesMember2024-12-310001786909sbsw:ChromeMiningActivitiesMember2023-12-310001786909sbsw:NewCenturyResourcesLimitedMember2025-12-310001786909sbsw:NewCenturyResourcesLimitedMember2024-12-310001786909sbsw:NewCenturyResourcesLimitedMember2023-12-310001786909sbsw:NewCenturyResourcesLimitedMember2025-01-012025-12-310001786909sbsw:NewCenturyResourcesLimitedMember2024-01-012024-12-310001786909sbsw:NewCenturyResourcesLimitedMember2023-01-012023-12-310001786909sbsw:WheatonPreciousMetalsInternationalMember2024-01-012024-12-310001786909sbsw:WheatonPreciousMetalsInternationalMember2023-01-012023-12-3100017869092023-11-012023-12-310001786909sbsw:OtherInvestmentsIFRSMember2025-12-310001786909ifrs-full:Level1OfFairValueHierarchyMembersbsw:EnvironmentalRehabilitationObligationFundsMember2025-12-310001786909ifrs-full:Level2OfFairValueHierarchyMembersbsw:EnvironmentalRehabilitationObligationFundsMember2025-12-310001786909ifrs-full:Level3OfFairValueHierarchyMembersbsw:EnvironmentalRehabilitationObligationFundsMember2025-12-310001786909ifrs-full:Level1OfFairValueHierarchyMembersbsw:EnvironmentalRehabilitationObligationFundsMember2024-12-310001786909ifrs-full:Level2OfFairValueHierarchyMembersbsw:EnvironmentalRehabilitationObligationFundsMember2024-12-310001786909ifrs-full:Level3OfFairValueHierarchyMembersbsw:EnvironmentalRehabilitationObligationFundsMember2024-12-310001786909ifrs-full:Level1OfFairValueHierarchyMembersbsw:EnvironmentalRehabilitationObligationFundsMember2023-12-310001786909ifrs-full:Level2OfFairValueHierarchyMembersbsw:EnvironmentalRehabilitationObligationFundsMember2023-12-310001786909ifrs-full:Level3OfFairValueHierarchyMembersbsw:EnvironmentalRehabilitationObligationFundsMember2023-12-310001786909ifrs-full:Level1OfFairValueHierarchyMembersbsw:TradeReceivablesPlatinumSalesMember2025-12-310001786909ifrs-full:Level2OfFairValueHierarchyMembersbsw:TradeReceivablesPlatinumSalesMember2025-12-310001786909ifrs-full:Level3OfFairValueHierarchyMembersbsw:TradeReceivablesPlatinumSalesMember2025-12-310001786909ifrs-full:Level1OfFairValueHierarchyMembersbsw:TradeReceivablesPlatinumSalesMember2024-12-310001786909ifrs-full:Level2OfFairValueHierarchyMembersbsw:TradeReceivablesPlatinumSalesMember2024-12-310001786909ifrs-full:Level3OfFairValueHierarchyMembersbsw:TradeReceivablesPlatinumSalesMember2024-12-310001786909ifrs-full:Level1OfFairValueHierarchyMembersbsw:TradeReceivablesPlatinumSalesMember2023-12-310001786909ifrs-full:Level2OfFairValueHierarchyMembersbsw:TradeReceivablesPlatinumSalesMember2023-12-310001786909ifrs-full:Level3OfFairValueHierarchyMembersbsw:TradeReceivablesPlatinumSalesMember2023-12-310001786909ifrs-full:Level1OfFairValueHierarchyMembersbsw:TradeReceivablesZincSalesMember2025-12-310001786909ifrs-full:Level2OfFairValueHierarchyMembersbsw:TradeReceivablesZincSalesMember2025-12-310001786909ifrs-full:Level3OfFairValueHierarchyMembersbsw:TradeReceivablesZincSalesMember2025-12-310001786909ifrs-full:Level1OfFairValueHierarchyMembersbsw:TradeReceivablesZincSalesMember2024-12-310001786909ifrs-full:Level2OfFairValueHierarchyMembersbsw:TradeReceivablesZincSalesMember2024-12-310001786909ifrs-full:Level3OfFairValueHierarchyMembersbsw:TradeReceivablesZincSalesMember2024-12-310001786909ifrs-full:Level1OfFairValueHierarchyMembersbsw:TradeReceivablesZincSalesMember2023-12-310001786909ifrs-full:Level2OfFairValueHierarchyMembersbsw:TradeReceivablesZincSalesMember2023-12-310001786909ifrs-full:Level3OfFairValueHierarchyMembersbsw:TradeReceivablesZincSalesMember2023-12-310001786909ifrs-full:Level1OfFairValueHierarchyMembersbsw:OtherInvestmentsIFRSMember2025-12-310001786909ifrs-full:Level2OfFairValueHierarchyMembersbsw:OtherInvestmentsIFRSMember2025-12-310001786909ifrs-full:Level3OfFairValueHierarchyMembersbsw:OtherInvestmentsIFRSMember2025-12-310001786909ifrs-full:Level1OfFairValueHierarchyMembersbsw:OtherInvestmentsIFRSMember2024-12-310001786909ifrs-full:Level2OfFairValueHierarchyMembersbsw:OtherInvestmentsIFRSMember2024-12-310001786909ifrs-full:Level3OfFairValueHierarchyMembersbsw:OtherInvestmentsIFRSMember2024-12-310001786909ifrs-full:Level1OfFairValueHierarchyMembersbsw:OtherInvestmentsIFRSMember2023-12-310001786909ifrs-full:Level2OfFairValueHierarchyMembersbsw:OtherInvestmentsIFRSMember2023-12-310001786909ifrs-full:Level3OfFairValueHierarchyMembersbsw:OtherInvestmentsIFRSMember2023-12-310001786909ifrs-full:Level1OfFairValueHierarchyMemberifrs-full:DerivativesMember2025-12-310001786909ifrs-full:Level2OfFairValueHierarchyMemberifrs-full:DerivativesMember2025-12-310001786909ifrs-full:Level3OfFairValueHierarchyMemberifrs-full:DerivativesMember2025-12-310001786909ifrs-full:Level1OfFairValueHierarchyMemberifrs-full:DerivativesMember2024-12-310001786909ifrs-full:Level2OfFairValueHierarchyMemberifrs-full:DerivativesMember2024-12-310001786909ifrs-full:Level3OfFairValueHierarchyMemberifrs-full:DerivativesMember2024-12-310001786909ifrs-full:Level1OfFairValueHierarchyMemberifrs-full:DerivativesMember2023-12-310001786909ifrs-full:Level2OfFairValueHierarchyMemberifrs-full:DerivativesMember2023-12-310001786909ifrs-full:Level3OfFairValueHierarchyMemberifrs-full:DerivativesMember2023-12-310001786909ifrs-full:Level1OfFairValueHierarchyMembersbsw:GoldHedgeContractsMember2025-12-310001786909ifrs-full:Level2OfFairValueHierarchyMembersbsw:GoldHedgeContractsMember2025-12-310001786909ifrs-full:Level3OfFairValueHierarchyMembersbsw:GoldHedgeContractsMember2025-12-310001786909ifrs-full:Level1OfFairValueHierarchyMembersbsw:GoldHedgeContractsMember2024-12-310001786909ifrs-full:Level2OfFairValueHierarchyMembersbsw:GoldHedgeContractsMember2024-12-310001786909ifrs-full:Level3OfFairValueHierarchyMembersbsw:GoldHedgeContractsMember2024-12-310001786909ifrs-full:Level1OfFairValueHierarchyMembersbsw:GoldHedgeContractsMember2023-12-310001786909ifrs-full:Level2OfFairValueHierarchyMembersbsw:GoldHedgeContractsMember2023-12-310001786909ifrs-full:Level3OfFairValueHierarchyMembersbsw:GoldHedgeContractsMember2023-12-310001786909ifrs-full:Level1OfFairValueHierarchyMembersbsw:ZincHedgeContractsMember2025-12-310001786909ifrs-full:Level2OfFairValueHierarchyMembersbsw:ZincHedgeContractsMember2025-12-310001786909ifrs-full:Level3OfFairValueHierarchyMembersbsw:ZincHedgeContractsMember2025-12-310001786909ifrs-full:Level1OfFairValueHierarchyMembersbsw:ZincHedgeContractsMember2024-12-310001786909ifrs-full:Level2OfFairValueHierarchyMembersbsw:ZincHedgeContractsMember2024-12-310001786909ifrs-full:Level3OfFairValueHierarchyMembersbsw:ZincHedgeContractsMember2024-12-310001786909ifrs-full:Level1OfFairValueHierarchyMembersbsw:ZincHedgeContractsMember2023-12-310001786909ifrs-full:Level2OfFairValueHierarchyMembersbsw:ZincHedgeContractsMember2023-12-310001786909ifrs-full:Level3OfFairValueHierarchyMembersbsw:ZincHedgeContractsMember2023-12-310001786909ifrs-full:Level1OfFairValueHierarchyMembersbsw:OtherHedgeContractsMember2025-12-310001786909ifrs-full:Level2OfFairValueHierarchyMembersbsw:OtherHedgeContractsMember2025-12-310001786909ifrs-full:Level3OfFairValueHierarchyMembersbsw:OtherHedgeContractsMember2025-12-310001786909ifrs-full:Level1OfFairValueHierarchyMembersbsw:OtherHedgeContractsMember2024-12-310001786909ifrs-full:Level2OfFairValueHierarchyMembersbsw:OtherHedgeContractsMember2024-12-310001786909ifrs-full:Level3OfFairValueHierarchyMembersbsw:OtherHedgeContractsMember2024-12-310001786909ifrs-full:Level1OfFairValueHierarchyMembersbsw:OtherHedgeContractsMember2023-12-310001786909ifrs-full:Level2OfFairValueHierarchyMembersbsw:OtherHedgeContractsMember2023-12-310001786909ifrs-full:Level3OfFairValueHierarchyMembersbsw:OtherHedgeContractsMember2023-12-310001786909ifrs-full:Level1OfFairValueHierarchyMembersbsw:MetalsBorrowingLiabilityMember2025-12-310001786909ifrs-full:Level2OfFairValueHierarchyMembersbsw:MetalsBorrowingLiabilityMember2025-12-310001786909ifrs-full:Level3OfFairValueHierarchyMembersbsw:MetalsBorrowingLiabilityMember2025-12-310001786909ifrs-full:Level1OfFairValueHierarchyMembersbsw:MetalsBorrowingLiabilityMember2024-12-310001786909ifrs-full:Level2OfFairValueHierarchyMembersbsw:MetalsBorrowingLiabilityMember2024-12-310001786909ifrs-full:Level3OfFairValueHierarchyMembersbsw:MetalsBorrowingLiabilityMember2024-12-310001786909ifrs-full:Level1OfFairValueHierarchyMembersbsw:MetalsBorrowingLiabilityMember2023-12-310001786909ifrs-full:Level2OfFairValueHierarchyMembersbsw:MetalsBorrowingLiabilityMember2023-12-310001786909ifrs-full:Level3OfFairValueHierarchyMembersbsw:MetalsBorrowingLiabilityMember2023-12-310001786909ifrs-full:Level1OfFairValueHierarchyMemberifrs-full:ContingentConsiderationMember2025-12-310001786909ifrs-full:Level2OfFairValueHierarchyMemberifrs-full:ContingentConsiderationMember2025-12-310001786909ifrs-full:Level3OfFairValueHierarchyMemberifrs-full:ContingentConsiderationMember2025-12-310001786909ifrs-full:Level1OfFairValueHierarchyMemberifrs-full:ContingentConsiderationMember2024-12-310001786909ifrs-full:Level2OfFairValueHierarchyMemberifrs-full:ContingentConsiderationMember2024-12-310001786909ifrs-full:Level3OfFairValueHierarchyMemberifrs-full:ContingentConsiderationMember2024-12-310001786909ifrs-full:Level1OfFairValueHierarchyMemberifrs-full:ContingentConsiderationMember2023-12-310001786909ifrs-full:Level2OfFairValueHierarchyMemberifrs-full:ContingentConsiderationMember2023-12-310001786909ifrs-full:Level3OfFairValueHierarchyMemberifrs-full:ContingentConsiderationMember2023-12-310001786909sbsw:CapitalPortionOfBorrowingsMember2025-12-310001786909ifrs-full:NotLaterThanOneYearMembersbsw:CapitalPortionOfBorrowingsMember2025-12-310001786909ifrs-full:LaterThanOneYearAndNotLaterThanTwoYearsMembersbsw:CapitalPortionOfBorrowingsMember2025-12-310001786909ifrs-full:LaterThanTwoYearsAndNotLaterThanThreeYearsMembersbsw:CapitalPortionOfBorrowingsMember2025-12-310001786909ifrs-full:LaterThanThreeYearsAndNotLaterThanFiveYearsMembersbsw:CapitalPortionOfBorrowingsMember2025-12-310001786909ifrs-full:LaterThanFiveYearsMembersbsw:CapitalPortionOfBorrowingsMember2025-12-310001786909ifrs-full:LaterThanThreeYearsAndNotLaterThanFiveYearsMember2025-12-310001786909sbsw:R6.5BillionRevolvingCreditFacilityMembersbsw:CapitalPortionOfBorrowingsMember2025-12-310001786909sbsw:R6.5BillionRevolvingCreditFacilityMemberifrs-full:NotLaterThanOneYearMembersbsw:CapitalPortionOfBorrowingsMember2025-12-310001786909sbsw:R6.5BillionRevolvingCreditFacilityMemberifrs-full:LaterThanOneYearAndNotLaterThanTwoYearsMembersbsw:CapitalPortionOfBorrowingsMember2025-12-310001786909sbsw:R6.5BillionRevolvingCreditFacilityMemberifrs-full:LaterThanTwoYearsAndNotLaterThanThreeYearsMembersbsw:CapitalPortionOfBorrowingsMember2025-12-310001786909sbsw:R6.5BillionRevolvingCreditFacilityMemberifrs-full:LaterThanThreeYearsAndNotLaterThanFiveYearsMembersbsw:CapitalPortionOfBorrowingsMember2025-12-310001786909sbsw:R6.5BillionRevolvingCreditFacilityMemberifrs-full:LaterThanFiveYearsMembersbsw:CapitalPortionOfBorrowingsMember2025-12-310001786909sbsw:US500MillionConvertibleBondDue2028Membersbsw:CapitalPortionOfBorrowingsMember2025-12-310001786909sbsw:US500MillionConvertibleBondDue2028Memberifrs-full:NotLaterThanOneYearMembersbsw:CapitalPortionOfBorrowingsMember2025-12-310001786909sbsw:US500MillionConvertibleBondDue2028Memberifrs-full:LaterThanOneYearAndNotLaterThanTwoYearsMembersbsw:CapitalPortionOfBorrowingsMember2025-12-310001786909sbsw:US500MillionConvertibleBondDue2028Memberifrs-full:LaterThanTwoYearsAndNotLaterThanThreeYearsMembersbsw:CapitalPortionOfBorrowingsMember2025-12-310001786909sbsw:US500MillionConvertibleBondDue2028Memberifrs-full:LaterThanThreeYearsAndNotLaterThanFiveYearsMembersbsw:CapitalPortionOfBorrowingsMember2025-12-310001786909sbsw:US500MillionConvertibleBondDue2028Memberifrs-full:LaterThanFiveYearsMembersbsw:CapitalPortionOfBorrowingsMember2025-12-310001786909sbsw:US675MillionSeniorNotesDue2026AndUS525MillionSeniorNotesDue2029Membersbsw:CapitalPortionOfBorrowingsMember2025-12-310001786909sbsw:US675MillionSeniorNotesDue2026AndUS525MillionSeniorNotesDue2029Memberifrs-full:NotLaterThanOneYearMembersbsw:CapitalPortionOfBorrowingsMember2025-12-310001786909sbsw:US675MillionSeniorNotesDue2026AndUS525MillionSeniorNotesDue2029Memberifrs-full:LaterThanOneYearAndNotLaterThanTwoYearsMembersbsw:CapitalPortionOfBorrowingsMember2025-12-310001786909sbsw:US675MillionSeniorNotesDue2026AndUS525MillionSeniorNotesDue2029Memberifrs-full:LaterThanTwoYearsAndNotLaterThanThreeYearsMembersbsw:CapitalPortionOfBorrowingsMember2025-12-310001786909sbsw:US675MillionSeniorNotesDue2026AndUS525MillionSeniorNotesDue2029Memberifrs-full:LaterThanThreeYearsAndNotLaterThanFiveYearsMembersbsw:CapitalPortionOfBorrowingsMember2025-12-310001786909sbsw:US675MillionSeniorNotesDue2026AndUS525MillionSeniorNotesDue2029Memberifrs-full:LaterThanFiveYearsMembersbsw:CapitalPortionOfBorrowingsMember2025-12-310001786909sbsw:BurnstoneDebtMembersbsw:CapitalPortionOfBorrowingsMember2025-12-310001786909sbsw:BurnstoneDebtMemberifrs-full:NotLaterThanOneYearMembersbsw:CapitalPortionOfBorrowingsMember2025-12-310001786909sbsw:BurnstoneDebtMemberifrs-full:LaterThanOneYearAndNotLaterThanTwoYearsMembersbsw:CapitalPortionOfBorrowingsMember2025-12-310001786909sbsw:BurnstoneDebtMemberifrs-full:LaterThanTwoYearsAndNotLaterThanThreeYearsMembersbsw:CapitalPortionOfBorrowingsMember2025-12-310001786909sbsw:BurnstoneDebtMemberifrs-full:LaterThanThreeYearsAndNotLaterThanFiveYearsMembersbsw:CapitalPortionOfBorrowingsMember2025-12-310001786909sbsw:BurnstoneDebtMemberifrs-full:LaterThanFiveYearsMembersbsw:CapitalPortionOfBorrowingsMember2025-12-310001786909sbsw:KeliberLoanFacilitiesMembersbsw:CapitalPortionOfBorrowingsMember2025-12-310001786909sbsw:KeliberLoanFacilitiesMemberifrs-full:NotLaterThanOneYearMembersbsw:CapitalPortionOfBorrowingsMember2025-12-310001786909sbsw:KeliberLoanFacilitiesMemberifrs-full:LaterThanOneYearAndNotLaterThanTwoYearsMembersbsw:CapitalPortionOfBorrowingsMember2025-12-310001786909sbsw:KeliberLoanFacilitiesMemberifrs-full:LaterThanTwoYearsAndNotLaterThanThreeYearsMembersbsw:CapitalPortionOfBorrowingsMember2025-12-310001786909sbsw:KeliberLoanFacilitiesMemberifrs-full:LaterThanThreeYearsAndNotLaterThanFiveYearsMembersbsw:CapitalPortionOfBorrowingsMember2025-12-310001786909sbsw:KeliberLoanFacilitiesMemberifrs-full:LaterThanFiveYearsMembersbsw:CapitalPortionOfBorrowingsMember2025-12-310001786909sbsw:OtherBorrowingsMembersbsw:CapitalPortionOfBorrowingsMember2025-12-310001786909sbsw:OtherBorrowingsMemberifrs-full:NotLaterThanOneYearMembersbsw:CapitalPortionOfBorrowingsMember2025-12-310001786909sbsw:OtherBorrowingsMemberifrs-full:LaterThanOneYearAndNotLaterThanTwoYearsMembersbsw:CapitalPortionOfBorrowingsMember2025-12-310001786909sbsw:OtherBorrowingsMemberifrs-full:LaterThanTwoYearsAndNotLaterThanThreeYearsMembersbsw:CapitalPortionOfBorrowingsMember2025-12-310001786909sbsw:OtherBorrowingsMemberifrs-full:LaterThanThreeYearsAndNotLaterThanFiveYearsMembersbsw:CapitalPortionOfBorrowingsMember2025-12-310001786909sbsw:OtherBorrowingsMemberifrs-full:LaterThanFiveYearsMembersbsw:CapitalPortionOfBorrowingsMember2025-12-310001786909sbsw:FrancoNevadaContractLiabilityMembersbsw:CapitalPortionOfBorrowingsMember2025-12-310001786909sbsw:FrancoNevadaContractLiabilityMemberifrs-full:NotLaterThanOneYearMembersbsw:CapitalPortionOfBorrowingsMember2025-12-310001786909sbsw:FrancoNevadaContractLiabilityMemberifrs-full:LaterThanOneYearAndNotLaterThanTwoYearsMembersbsw:CapitalPortionOfBorrowingsMember2025-12-310001786909sbsw:FrancoNevadaContractLiabilityMemberifrs-full:LaterThanTwoYearsAndNotLaterThanThreeYearsMembersbsw:CapitalPortionOfBorrowingsMember2025-12-310001786909sbsw:FrancoNevadaContractLiabilityMemberifrs-full:LaterThanThreeYearsAndNotLaterThanFiveYearsMembersbsw:CapitalPortionOfBorrowingsMember2025-12-310001786909sbsw:FrancoNevadaContractLiabilityMemberifrs-full:LaterThanFiveYearsMembersbsw:CapitalPortionOfBorrowingsMember2025-12-310001786909sbsw:InterestPortionOfBorrowingsMember2025-12-310001786909ifrs-full:NotLaterThanOneYearMembersbsw:InterestPortionOfBorrowingsMember2025-12-310001786909ifrs-full:LaterThanOneYearAndNotLaterThanTwoYearsMembersbsw:InterestPortionOfBorrowingsMember2025-12-310001786909ifrs-full:LaterThanTwoYearsAndNotLaterThanThreeYearsMembersbsw:InterestPortionOfBorrowingsMember2025-12-310001786909ifrs-full:LaterThanThreeYearsAndNotLaterThanFiveYearsMembersbsw:InterestPortionOfBorrowingsMember2025-12-310001786909ifrs-full:LaterThanFiveYearsMembersbsw:InterestPortionOfBorrowingsMember2025-12-310001786909sbsw:CapitalPortionOfBorrowingsMember2024-12-310001786909ifrs-full:NotLaterThanOneYearMembersbsw:CapitalPortionOfBorrowingsMember2024-12-310001786909ifrs-full:LaterThanOneYearAndNotLaterThanTwoYearsMembersbsw:CapitalPortionOfBorrowingsMember2024-12-310001786909ifrs-full:LaterThanTwoYearsAndNotLaterThanThreeYearsMembersbsw:CapitalPortionOfBorrowingsMember2024-12-310001786909ifrs-full:LaterThanThreeYearsAndNotLaterThanFiveYearsMembersbsw:CapitalPortionOfBorrowingsMember2024-12-310001786909ifrs-full:LaterThanFiveYearsMembersbsw:CapitalPortionOfBorrowingsMember2024-12-310001786909ifrs-full:LaterThanThreeYearsAndNotLaterThanFiveYearsMember2024-12-310001786909sbsw:R6.5BillionRevolvingCreditFacilityMembersbsw:CapitalPortionOfBorrowingsMember2024-12-310001786909sbsw:R6.5BillionRevolvingCreditFacilityMemberifrs-full:NotLaterThanOneYearMembersbsw:CapitalPortionOfBorrowingsMember2024-12-310001786909sbsw:R6.5BillionRevolvingCreditFacilityMemberifrs-full:LaterThanOneYearAndNotLaterThanTwoYearsMembersbsw:CapitalPortionOfBorrowingsMember2024-12-310001786909sbsw:R6.5BillionRevolvingCreditFacilityMemberifrs-full:LaterThanTwoYearsAndNotLaterThanThreeYearsMembersbsw:CapitalPortionOfBorrowingsMember2024-12-310001786909sbsw:R6.5BillionRevolvingCreditFacilityMemberifrs-full:LaterThanThreeYearsAndNotLaterThanFiveYearsMembersbsw:CapitalPortionOfBorrowingsMember2024-12-310001786909sbsw:R6.5BillionRevolvingCreditFacilityMemberifrs-full:LaterThanFiveYearsMembersbsw:CapitalPortionOfBorrowingsMember2024-12-310001786909sbsw:US500MillionConvertibleBondDue2028Membersbsw:CapitalPortionOfBorrowingsMember2024-12-310001786909sbsw:US500MillionConvertibleBondDue2028Memberifrs-full:NotLaterThanOneYearMembersbsw:CapitalPortionOfBorrowingsMember2024-12-310001786909sbsw:US500MillionConvertibleBondDue2028Memberifrs-full:LaterThanOneYearAndNotLaterThanTwoYearsMembersbsw:CapitalPortionOfBorrowingsMember2024-12-310001786909sbsw:US500MillionConvertibleBondDue2028Memberifrs-full:LaterThanTwoYearsAndNotLaterThanThreeYearsMembersbsw:CapitalPortionOfBorrowingsMember2024-12-310001786909sbsw:US500MillionConvertibleBondDue2028Memberifrs-full:LaterThanThreeYearsAndNotLaterThanFiveYearsMembersbsw:CapitalPortionOfBorrowingsMember2024-12-310001786909sbsw:US500MillionConvertibleBondDue2028Memberifrs-full:LaterThanFiveYearsMembersbsw:CapitalPortionOfBorrowingsMember2024-12-310001786909sbsw:US675MillionSeniorNotesDue2026AndUS525MillionSeniorNotesDue2029Membersbsw:CapitalPortionOfBorrowingsMember2024-12-310001786909sbsw:US675MillionSeniorNotesDue2026AndUS525MillionSeniorNotesDue2029Memberifrs-full:NotLaterThanOneYearMembersbsw:CapitalPortionOfBorrowingsMember2024-12-310001786909sbsw:US675MillionSeniorNotesDue2026AndUS525MillionSeniorNotesDue2029Memberifrs-full:LaterThanOneYearAndNotLaterThanTwoYearsMembersbsw:CapitalPortionOfBorrowingsMember2024-12-310001786909sbsw:US675MillionSeniorNotesDue2026AndUS525MillionSeniorNotesDue2029Memberifrs-full:LaterThanTwoYearsAndNotLaterThanThreeYearsMembersbsw:CapitalPortionOfBorrowingsMember2024-12-310001786909sbsw:US675MillionSeniorNotesDue2026AndUS525MillionSeniorNotesDue2029Memberifrs-full:LaterThanThreeYearsAndNotLaterThanFiveYearsMembersbsw:CapitalPortionOfBorrowingsMember2024-12-310001786909sbsw:US675MillionSeniorNotesDue2026AndUS525MillionSeniorNotesDue2029Memberifrs-full:LaterThanFiveYearsMembersbsw:CapitalPortionOfBorrowingsMember2024-12-310001786909sbsw:BurnstoneDebtMembersbsw:CapitalPortionOfBorrowingsMember2024-12-310001786909sbsw:BurnstoneDebtMemberifrs-full:NotLaterThanOneYearMembersbsw:CapitalPortionOfBorrowingsMember2024-12-310001786909sbsw:BurnstoneDebtMemberifrs-full:LaterThanOneYearAndNotLaterThanTwoYearsMembersbsw:CapitalPortionOfBorrowingsMember2024-12-310001786909sbsw:BurnstoneDebtMemberifrs-full:LaterThanTwoYearsAndNotLaterThanThreeYearsMembersbsw:CapitalPortionOfBorrowingsMember2024-12-310001786909sbsw:BurnstoneDebtMemberifrs-full:LaterThanThreeYearsAndNotLaterThanFiveYearsMembersbsw:CapitalPortionOfBorrowingsMember2024-12-310001786909sbsw:BurnstoneDebtMemberifrs-full:LaterThanFiveYearsMembersbsw:CapitalPortionOfBorrowingsMember2024-12-310001786909sbsw:KeliberLoanFacilitiesMembersbsw:CapitalPortionOfBorrowingsMember2024-12-310001786909sbsw:KeliberLoanFacilitiesMemberifrs-full:NotLaterThanOneYearMembersbsw:CapitalPortionOfBorrowingsMember2024-12-310001786909sbsw:KeliberLoanFacilitiesMemberifrs-full:LaterThanOneYearAndNotLaterThanTwoYearsMembersbsw:CapitalPortionOfBorrowingsMember2024-12-310001786909sbsw:KeliberLoanFacilitiesMemberifrs-full:LaterThanTwoYearsAndNotLaterThanThreeYearsMembersbsw:CapitalPortionOfBorrowingsMember2024-12-310001786909sbsw:KeliberLoanFacilitiesMemberifrs-full:LaterThanThreeYearsAndNotLaterThanFiveYearsMembersbsw:CapitalPortionOfBorrowingsMember2024-12-310001786909sbsw:KeliberLoanFacilitiesMemberifrs-full:LaterThanFiveYearsMembersbsw:CapitalPortionOfBorrowingsMember2024-12-310001786909sbsw:OtherBorrowingsMembersbsw:CapitalPortionOfBorrowingsMember2024-12-310001786909sbsw:OtherBorrowingsMemberifrs-full:NotLaterThanOneYearMembersbsw:CapitalPortionOfBorrowingsMember2024-12-310001786909sbsw:OtherBorrowingsMemberifrs-full:LaterThanOneYearAndNotLaterThanTwoYearsMembersbsw:CapitalPortionOfBorrowingsMember2024-12-310001786909sbsw:OtherBorrowingsMemberifrs-full:LaterThanTwoYearsAndNotLaterThanThreeYearsMembersbsw:CapitalPortionOfBorrowingsMember2024-12-310001786909sbsw:OtherBorrowingsMemberifrs-full:LaterThanThreeYearsAndNotLaterThanFiveYearsMembersbsw:CapitalPortionOfBorrowingsMember2024-12-310001786909sbsw:OtherBorrowingsMemberifrs-full:LaterThanFiveYearsMembersbsw:CapitalPortionOfBorrowingsMember2024-12-310001786909sbsw:FrancoNevadaContractLiabilityMembersbsw:CapitalPortionOfBorrowingsMember2024-12-310001786909sbsw:FrancoNevadaContractLiabilityMemberifrs-full:NotLaterThanOneYearMembersbsw:CapitalPortionOfBorrowingsMember2024-12-310001786909sbsw:FrancoNevadaContractLiabilityMemberifrs-full:LaterThanOneYearAndNotLaterThanTwoYearsMembersbsw:CapitalPortionOfBorrowingsMember2024-12-310001786909sbsw:FrancoNevadaContractLiabilityMemberifrs-full:LaterThanTwoYearsAndNotLaterThanThreeYearsMembersbsw:CapitalPortionOfBorrowingsMember2024-12-310001786909sbsw:FrancoNevadaContractLiabilityMemberifrs-full:LaterThanThreeYearsAndNotLaterThanFiveYearsMembersbsw:CapitalPortionOfBorrowingsMember2024-12-310001786909sbsw:FrancoNevadaContractLiabilityMemberifrs-full:LaterThanFiveYearsMembersbsw:CapitalPortionOfBorrowingsMember2024-12-310001786909sbsw:InterestPortionOfBorrowingsMember2024-12-310001786909ifrs-full:NotLaterThanOneYearMembersbsw:InterestPortionOfBorrowingsMember2024-12-310001786909ifrs-full:LaterThanOneYearAndNotLaterThanTwoYearsMembersbsw:InterestPortionOfBorrowingsMember2024-12-310001786909ifrs-full:LaterThanTwoYearsAndNotLaterThanThreeYearsMembersbsw:InterestPortionOfBorrowingsMember2024-12-310001786909ifrs-full:LaterThanThreeYearsAndNotLaterThanFiveYearsMembersbsw:InterestPortionOfBorrowingsMember2024-12-310001786909ifrs-full:LaterThanFiveYearsMembersbsw:InterestPortionOfBorrowingsMember2024-12-310001786909sbsw:CapitalPortionOfBorrowingsMember2023-12-310001786909ifrs-full:NotLaterThanOneYearMembersbsw:CapitalPortionOfBorrowingsMember2023-12-310001786909ifrs-full:LaterThanOneYearAndNotLaterThanTwoYearsMembersbsw:CapitalPortionOfBorrowingsMember2023-12-310001786909ifrs-full:LaterThanTwoYearsAndNotLaterThanThreeYearsMembersbsw:CapitalPortionOfBorrowingsMember2023-12-310001786909ifrs-full:LaterThanThreeYearsAndNotLaterThanFiveYearsMembersbsw:CapitalPortionOfBorrowingsMember2023-12-310001786909ifrs-full:LaterThanFiveYearsMembersbsw:CapitalPortionOfBorrowingsMember2023-12-310001786909ifrs-full:LaterThanThreeYearsAndNotLaterThanFiveYearsMember2023-12-310001786909sbsw:R5.5BillionRevolvingCreditFacilityMembersbsw:CapitalPortionOfBorrowingsMember2023-12-310001786909sbsw:R5.5BillionRevolvingCreditFacilityMemberifrs-full:NotLaterThanOneYearMembersbsw:CapitalPortionOfBorrowingsMember2023-12-310001786909sbsw:R5.5BillionRevolvingCreditFacilityMemberifrs-full:LaterThanOneYearAndNotLaterThanTwoYearsMembersbsw:CapitalPortionOfBorrowingsMember2023-12-310001786909sbsw:R5.5BillionRevolvingCreditFacilityMemberifrs-full:LaterThanTwoYearsAndNotLaterThanThreeYearsMembersbsw:CapitalPortionOfBorrowingsMember2023-12-310001786909sbsw:R5.5BillionRevolvingCreditFacilityMemberifrs-full:LaterThanThreeYearsAndNotLaterThanFiveYearsMembersbsw:CapitalPortionOfBorrowingsMember2023-12-310001786909sbsw:R5.5BillionRevolvingCreditFacilityMemberifrs-full:LaterThanFiveYearsMembersbsw:CapitalPortionOfBorrowingsMember2023-12-310001786909sbsw:US500MillionConvertibleBondDue2028Membersbsw:CapitalPortionOfBorrowingsMember2023-12-310001786909sbsw:US500MillionConvertibleBondDue2028Memberifrs-full:NotLaterThanOneYearMembersbsw:CapitalPortionOfBorrowingsMember2023-12-310001786909sbsw:US500MillionConvertibleBondDue2028Memberifrs-full:LaterThanOneYearAndNotLaterThanTwoYearsMembersbsw:CapitalPortionOfBorrowingsMember2023-12-310001786909sbsw:US500MillionConvertibleBondDue2028Memberifrs-full:LaterThanTwoYearsAndNotLaterThanThreeYearsMembersbsw:CapitalPortionOfBorrowingsMember2023-12-310001786909sbsw:US500MillionConvertibleBondDue2028Memberifrs-full:LaterThanThreeYearsAndNotLaterThanFiveYearsMembersbsw:CapitalPortionOfBorrowingsMember2023-12-310001786909sbsw:US500MillionConvertibleBondDue2028Memberifrs-full:LaterThanFiveYearsMembersbsw:CapitalPortionOfBorrowingsMember2023-12-310001786909sbsw:US675MillionSeniorNotesDue2026AndUS525MillionSeniorNotesDue2029Membersbsw:CapitalPortionOfBorrowingsMember2023-12-310001786909sbsw:US675MillionSeniorNotesDue2026AndUS525MillionSeniorNotesDue2029Memberifrs-full:NotLaterThanOneYearMembersbsw:CapitalPortionOfBorrowingsMember2023-12-310001786909sbsw:US675MillionSeniorNotesDue2026AndUS525MillionSeniorNotesDue2029Memberifrs-full:LaterThanOneYearAndNotLaterThanTwoYearsMembersbsw:CapitalPortionOfBorrowingsMember2023-12-310001786909sbsw:US675MillionSeniorNotesDue2026AndUS525MillionSeniorNotesDue2029Memberifrs-full:LaterThanTwoYearsAndNotLaterThanThreeYearsMembersbsw:CapitalPortionOfBorrowingsMember2023-12-310001786909sbsw:US675MillionSeniorNotesDue2026AndUS525MillionSeniorNotesDue2029Memberifrs-full:LaterThanThreeYearsAndNotLaterThanFiveYearsMembersbsw:CapitalPortionOfBorrowingsMember2023-12-310001786909sbsw:US675MillionSeniorNotesDue2026AndUS525MillionSeniorNotesDue2029Memberifrs-full:LaterThanFiveYearsMembersbsw:CapitalPortionOfBorrowingsMember2023-12-310001786909sbsw:BurnstoneDebtMembersbsw:CapitalPortionOfBorrowingsMember2023-12-310001786909sbsw:BurnstoneDebtMemberifrs-full:NotLaterThanOneYearMembersbsw:CapitalPortionOfBorrowingsMember2023-12-310001786909sbsw:BurnstoneDebtMemberifrs-full:LaterThanOneYearAndNotLaterThanTwoYearsMembersbsw:CapitalPortionOfBorrowingsMember2023-12-310001786909sbsw:BurnstoneDebtMemberifrs-full:LaterThanTwoYearsAndNotLaterThanThreeYearsMembersbsw:CapitalPortionOfBorrowingsMember2023-12-310001786909sbsw:BurnstoneDebtMemberifrs-full:LaterThanThreeYearsAndNotLaterThanFiveYearsMembersbsw:CapitalPortionOfBorrowingsMember2023-12-310001786909sbsw:BurnstoneDebtMemberifrs-full:LaterThanFiveYearsMembersbsw:CapitalPortionOfBorrowingsMember2023-12-310001786909sbsw:OtherBorrowingsMembersbsw:CapitalPortionOfBorrowingsMember2023-12-310001786909sbsw:OtherBorrowingsMemberifrs-full:NotLaterThanOneYearMembersbsw:CapitalPortionOfBorrowingsMember2023-12-310001786909sbsw:OtherBorrowingsMemberifrs-full:LaterThanOneYearAndNotLaterThanTwoYearsMembersbsw:CapitalPortionOfBorrowingsMember2023-12-310001786909sbsw:OtherBorrowingsMemberifrs-full:LaterThanTwoYearsAndNotLaterThanThreeYearsMembersbsw:CapitalPortionOfBorrowingsMember2023-12-310001786909sbsw:OtherBorrowingsMemberifrs-full:LaterThanThreeYearsAndNotLaterThanFiveYearsMembersbsw:CapitalPortionOfBorrowingsMember2023-12-310001786909sbsw:OtherBorrowingsMemberifrs-full:LaterThanFiveYearsMembersbsw:CapitalPortionOfBorrowingsMember2023-12-310001786909sbsw:FrancoNevadaContractLiabilityMembersbsw:CapitalPortionOfBorrowingsMember2023-12-310001786909sbsw:FrancoNevadaContractLiabilityMemberifrs-full:NotLaterThanOneYearMembersbsw:CapitalPortionOfBorrowingsMember2023-12-310001786909sbsw:FrancoNevadaContractLiabilityMemberifrs-full:LaterThanOneYearAndNotLaterThanTwoYearsMembersbsw:CapitalPortionOfBorrowingsMember2023-12-310001786909sbsw:FrancoNevadaContractLiabilityMemberifrs-full:LaterThanTwoYearsAndNotLaterThanThreeYearsMembersbsw:CapitalPortionOfBorrowingsMember2023-12-310001786909sbsw:FrancoNevadaContractLiabilityMemberifrs-full:LaterThanThreeYearsAndNotLaterThanFiveYearsMembersbsw:CapitalPortionOfBorrowingsMember2023-12-310001786909sbsw:FrancoNevadaContractLiabilityMemberifrs-full:LaterThanFiveYearsMembersbsw:CapitalPortionOfBorrowingsMember2023-12-310001786909sbsw:ConvertibleDebenturesMembersbsw:CapitalPortionOfBorrowingsMember2023-12-310001786909sbsw:ConvertibleDebenturesMemberifrs-full:NotLaterThanOneYearMembersbsw:CapitalPortionOfBorrowingsMember2023-12-310001786909sbsw:ConvertibleDebenturesMemberifrs-full:LaterThanOneYearAndNotLaterThanTwoYearsMembersbsw:CapitalPortionOfBorrowingsMember2023-12-310001786909sbsw:ConvertibleDebenturesMemberifrs-full:LaterThanTwoYearsAndNotLaterThanThreeYearsMembersbsw:CapitalPortionOfBorrowingsMember2023-12-310001786909sbsw:ConvertibleDebenturesMemberifrs-full:LaterThanThreeYearsAndNotLaterThanFiveYearsMembersbsw:CapitalPortionOfBorrowingsMember2023-12-310001786909sbsw:ConvertibleDebenturesMemberifrs-full:LaterThanFiveYearsMembersbsw:CapitalPortionOfBorrowingsMember2023-12-310001786909sbsw:InterestPortionOfBorrowingsMember2023-12-310001786909ifrs-full:NotLaterThanOneYearMembersbsw:InterestPortionOfBorrowingsMember2023-12-310001786909ifrs-full:LaterThanOneYearAndNotLaterThanTwoYearsMembersbsw:InterestPortionOfBorrowingsMember2023-12-310001786909ifrs-full:LaterThanTwoYearsAndNotLaterThanThreeYearsMembersbsw:InterestPortionOfBorrowingsMember2023-12-310001786909ifrs-full:LaterThanThreeYearsAndNotLaterThanFiveYearsMembersbsw:InterestPortionOfBorrowingsMember2023-12-310001786909ifrs-full:LaterThanFiveYearsMembersbsw:InterestPortionOfBorrowingsMember2023-12-310001786909srt:ScenarioForecastMember2025-07-012025-12-310001786909srt:ScenarioForecastMember2026-01-012026-12-310001786909srt:MaximumMembersrt:ScenarioForecastMember2025-07-012025-12-310001786909srt:MaximumMembersrt:ScenarioForecastMember2026-01-012026-12-310001786909sbsw:A2026NotesDueNovember2026Member2025-12-310001786909sbsw:HedgingInstrument1Memberifrs-full:CommodityPriceRiskMemberifrs-full:NotLaterThanOneYearMembersbsw:ZincMiningActivitiesMember2025-12-310001786909ifrs-full:CommodityPriceRiskMembersbsw:HedgingInstrument1Memberifrs-full:NotLaterThanOneYearMembersbsw:ZincMiningActivitiesMemberifrs-full:BottomOfRangeMember2025-12-310001786909ifrs-full:CommodityPriceRiskMembersbsw:HedgingInstrument1Memberifrs-full:NotLaterThanOneYearMembersbsw:ZincMiningActivitiesMemberifrs-full:TopOfRangeMember2025-12-310001786909sbsw:HedgingInstrument2Memberifrs-full:CommodityPriceRiskMemberifrs-full:NotLaterThanOneYearMembersbsw:ZincMiningActivitiesMember2025-12-310001786909ifrs-full:CommodityPriceRiskMembersbsw:HedgingInstrument2Memberifrs-full:NotLaterThanOneYearMembersbsw:ZincMiningActivitiesMemberifrs-full:BottomOfRangeMember2025-12-310001786909ifrs-full:CommodityPriceRiskMembersbsw:HedgingInstrument2Memberifrs-full:NotLaterThanOneYearMembersbsw:ZincMiningActivitiesMemberifrs-full:TopOfRangeMember2025-12-310001786909sbsw:HedgingInstrument3Memberifrs-full:CommodityPriceRiskMemberifrs-full:NotLaterThanOneYearMembersbsw:ZincMiningActivitiesMember2025-12-310001786909ifrs-full:CommodityPriceRiskMembersbsw:HedgingInstrument3Memberifrs-full:NotLaterThanOneYearMembersbsw:ZincMiningActivitiesMemberifrs-full:BottomOfRangeMember2025-12-310001786909ifrs-full:CommodityPriceRiskMembersbsw:HedgingInstrument3Memberifrs-full:NotLaterThanOneYearMembersbsw:ZincMiningActivitiesMemberifrs-full:TopOfRangeMember2025-12-310001786909sbsw:HedgingInstrument4Memberifrs-full:CommodityPriceRiskMemberifrs-full:NotLaterThanOneYearMembersbsw:ZincMiningActivitiesMember2025-12-310001786909ifrs-full:CommodityPriceRiskMembersbsw:HedgingInstrument4Memberifrs-full:NotLaterThanOneYearMembersbsw:ZincMiningActivitiesMemberifrs-full:BottomOfRangeMember2025-12-310001786909ifrs-full:CommodityPriceRiskMembersbsw:HedgingInstrument4Memberifrs-full:NotLaterThanOneYearMembersbsw:ZincMiningActivitiesMemberifrs-full:TopOfRangeMember2025-12-310001786909ifrs-full:CommodityPriceRiskMemberifrs-full:NotLaterThanOneYearMembersbsw:GoldMiningActivitiesMember2025-12-310001786909ifrs-full:CommodityPriceRiskMemberifrs-full:NotLaterThanOneYearMembersbsw:SilverMiningActivitiesMember2025-12-310001786909ifrs-full:CommodityPriceRiskMemberifrs-full:NotLaterThanOneYearMembersbsw:PlatinumMiningActivitiesMember2025-12-310001786909ifrs-full:CommodityPriceRiskMemberifrs-full:NotLaterThanOneYearMembersbsw:PaladiumMiningActivitiesMember2025-12-310001786909sbsw:KloofSegmentMember2025-12-310001786909sbsw:KloofSegmentMember2024-12-310001786909sbsw:KloofSegmentMember2023-12-310001786909sbsw:DriefonteinSegmentMember2025-12-310001786909sbsw:DriefonteinSegmentMember2024-12-310001786909sbsw:DriefonteinSegmentMember2023-12-310001786909sbsw:BeatrixSegmentMember2025-12-310001786909sbsw:BeatrixSegmentMember2024-12-310001786909sbsw:BeatrixSegmentMember2023-12-310001786909sbsw:SibanyeGoldPtyLtdMember2025-12-310001786909sbsw:SibanyeGoldPtyLtdMember2024-12-310001786909sbsw:SibanyeGoldPtyLtdMember2023-12-310001786909sbsw:CookeSegmentMember2024-12-310001786909sbsw:CookeSegmentMember2023-12-310001786909sbsw:BurnstoneBusinessCombinationMember2025-12-310001786909sbsw:BurnstoneBusinessCombinationMember2023-12-310001786909sbsw:KroondalSegmentMember2025-12-310001786909sbsw:KroondalSegmentMember2024-12-310001786909sbsw:KroondalSegmentMember2023-12-310001786909sbsw:PlatinumMileSegmentMember2025-12-310001786909sbsw:PlatinumMileSegmentMember2024-12-310001786909sbsw:PlatinumMileSegmentMember2023-12-310001786909sbsw:RustenburgOperationsSegmentMember2025-12-310001786909sbsw:RustenburgOperationsSegmentMember2024-12-310001786909sbsw:RustenburgOperationsSegmentMember2023-12-310001786909ifrs-full:AllOtherSegmentsMember2025-12-310001786909ifrs-full:AllOtherSegmentsMember2024-12-310001786909ifrs-full:AllOtherSegmentsMember2023-12-310001786909sbsw:DrdGoldSegmentMember2025-12-310001786909sbsw:DrdGoldSegmentMember2024-12-310001786909sbsw:DrdGoldSegmentMember2023-12-310001786909sbsw:InsuredEntitiesMember2025-12-310001786909sbsw:ReldanMexicoMember2024-12-310001786909sbsw:ReldanMexicoMember2025-01-012025-12-310001786909sbsw:ReldanMexicoMember2024-01-012024-12-310001786909sbsw:NealFronemanMember2025-01-012025-12-310001786909sbsw:NealFronemanMember2024-01-012024-12-310001786909sbsw:NealFronemanMember2023-01-012023-12-310001786909sbsw:RichardStewartMember2025-01-012025-12-310001786909sbsw:RichardStewartMember2024-01-012024-12-310001786909sbsw:RichardStewartMember2023-01-012023-12-310001786909sbsw:CharlKeyterMember2025-01-012025-12-310001786909sbsw:CharlKeyterMember2024-01-012024-12-310001786909sbsw:CharlKeyterMember2023-01-012023-12-310001786909sbsw:DawieMostertMember2025-01-012025-12-310001786909sbsw:DawieMostertMember2024-01-012024-12-310001786909sbsw:DawieMostertMember2023-01-012023-12-310001786909sbsw:ThembaNkosiMember2025-01-012025-12-310001786909sbsw:ThembaNkosiMember2024-01-012024-12-310001786909sbsw:ThembaNkosiMember2023-01-012023-12-310001786909sbsw:RobertVanNiekerkMember2025-01-012025-12-310001786909sbsw:RobertVanNiekerkMember2024-01-012024-12-310001786909sbsw:RobertVanNiekerkMember2023-01-012023-12-310001786909sbsw:LaurentCharbonnierMember2025-01-012025-12-310001786909sbsw:LaurentCharbonnierMember2024-01-012024-12-310001786909sbsw:LaurentCharbonnierMember2023-01-012023-12-310001786909sbsw:LeratoLegongMember2025-01-012025-12-310001786909sbsw:LeratoLegongMember2024-01-012024-12-310001786909sbsw:LeratoLegongMember2023-01-012023-12-310001786909sbsw:MikaSeitovirtaMember2025-01-012025-12-310001786909sbsw:MikaSeitovirtaMember2024-01-012024-12-310001786909sbsw:MikaSeitovirtaMember2023-01-012023-12-310001786909sbsw:CharlesCarterMember2025-01-012025-12-310001786909sbsw:CharlesCarterMember2024-01-012024-12-310001786909sbsw:CharlesCarterMember2023-01-012023-12-310001786909sbsw:MelanieNaidooVermaakMember2025-01-012025-12-310001786909sbsw:MelanieNaidooVermaakMember2024-01-012024-12-310001786909sbsw:MelanieNaidooVermaakMember2023-01-012023-12-310001786909sbsw:RichardCoxMember2025-01-012025-12-310001786909sbsw:RichardCoxMember2024-01-012024-12-310001786909sbsw:RichardCoxMember2023-01-012023-12-310001786909sbsw:MduBhuloseMember2025-01-012025-12-310001786909sbsw:MduBhuloseMember2024-01-012024-12-310001786909sbsw:MduBhuloseMember2023-01-012023-12-310001786909ifrs-full:KeyManagementPersonnelOfEntityOrParentMember2025-01-012025-12-310001786909ifrs-full:KeyManagementPersonnelOfEntityOrParentMember2024-01-012024-12-310001786909ifrs-full:KeyManagementPersonnelOfEntityOrParentMember2023-01-012023-12-310001786909sbsw:TimCummingMember2025-01-012025-12-310001786909sbsw:TimCummingMember2024-01-012024-12-310001786909sbsw:TimCummingMember2023-01-012023-12-310001786909sbsw:SavannahDansonMember2025-01-012025-12-310001786909sbsw:SavannahDansonMember2024-01-012024-12-310001786909sbsw:SavannahDansonMember2023-01-012023-12-310001786909sbsw:HarryKenyonSlaneyMember2025-01-012025-12-310001786909sbsw:HarryKenyonSlaneyMember2024-01-012024-12-310001786909sbsw:HarryKenyonSlaneyMember2023-01-012023-12-310001786909sbsw:RichardMenellMember2025-01-012025-12-310001786909sbsw:RichardMenellMember2024-01-012024-12-310001786909sbsw:RichardMenellMember2023-01-012023-12-310001786909sbsw:NkosemntuNikaMember2025-01-012025-12-310001786909sbsw:NkosemntuNikaMember2024-01-012024-12-310001786909sbsw:NkosemntuNikaMember2023-01-012023-12-310001786909sbsw:KeithRaynerMember2025-01-012025-12-310001786909sbsw:KeithRaynerMember2024-01-012024-12-310001786909sbsw:KeithRaynerMember2023-01-012023-12-310001786909sbsw:SusanVanDerMerweMember2025-01-012025-12-310001786909sbsw:SusanVanDerMerweMember2024-01-012024-12-310001786909sbsw:SusanVanDerMerweMember2023-01-012023-12-310001786909sbsw:JeremiahVilakaziMember2025-01-012025-12-310001786909sbsw:JeremiahVilakaziMember2024-01-012024-12-310001786909sbsw:JeremiahVilakaziMember2023-01-012023-12-310001786909sbsw:VincentMaphaiMember2025-01-012025-12-310001786909sbsw:VincentMaphaiMember2024-01-012024-12-310001786909sbsw:VincentMaphaiMember2023-01-012023-12-310001786909sbsw:ElaineDorwardKingMember2025-01-012025-12-310001786909sbsw:ElaineDorwardKingMember2024-01-012024-12-310001786909sbsw:ElaineDorwardKingMember2023-01-012023-12-310001786909sbsw:SindiswaZilwaMember2025-01-012025-12-310001786909sbsw:SindiswaZilwaMember2024-01-012024-12-310001786909sbsw:SindiswaZilwaMember2023-01-012023-12-310001786909sbsw:PhilipeBoisseauMember2025-01-012025-12-310001786909sbsw:PhilipeBoisseauMember2024-01-012024-12-310001786909sbsw:PhilipeBoisseauMember2023-01-012023-12-310001786909sbsw:PeterHancockMember2025-01-012025-12-310001786909sbsw:PeterHancockMember2024-01-012024-12-310001786909sbsw:PeterHancockMember2023-01-012023-12-310001786909sbsw:TerenceNombembeMember2025-01-012025-12-310001786909sbsw:TerenceNombembeMember2024-01-012024-12-310001786909sbsw:TerenceNombembeMember2023-01-012023-12-310001786909sbsw:LindiweMthimunyeMember2025-01-012025-12-310001786909sbsw:LindiweMthimunyeMember2024-01-012024-12-310001786909sbsw:LindiweMthimunyeMember2023-01-012023-12-310001786909sbsw:NonExecutiveDirectorsMember2025-01-012025-12-310001786909sbsw:NonExecutiveDirectorsMember2024-01-012024-12-310001786909sbsw:NonExecutiveDirectorsMember2023-01-012023-12-310001786909sbsw:NealFronemanMember2025-12-310001786909sbsw:NealFronemanMember2024-12-310001786909sbsw:NealFronemanMember2023-12-310001786909sbsw:RichardStewartMember2025-12-310001786909sbsw:RichardStewartMember2024-12-310001786909sbsw:RichardStewartMember2023-12-310001786909sbsw:CharlKeyterMember2025-12-310001786909sbsw:CharlKeyterMember2024-12-310001786909sbsw:CharlKeyterMember2023-12-310001786909sbsw:TimCummingMember2025-12-310001786909sbsw:TimCummingMember2024-12-310001786909sbsw:TimCummingMember2023-12-310001786909sbsw:RichardMenellMember2025-12-310001786909sbsw:RichardMenellMember2024-12-310001786909sbsw:RichardMenellMember2023-12-310001786909sbsw:KeithRaynerMember2025-12-310001786909sbsw:KeithRaynerMember2024-12-310001786909sbsw:KeithRaynerMember2023-12-310001786909sbsw:SusanVanDerMerweMember2025-12-310001786909sbsw:SusanVanDerMerweMember2024-12-310001786909sbsw:SusanVanDerMerweMember2023-12-310001786909sbsw:JeremiahVilakaziMember2025-12-310001786909sbsw:JeremiahVilakaziMember2024-12-310001786909sbsw:JeremiahVilakaziMember2023-12-310001786909sbsw:VincentMaphaiMember2025-12-310001786909sbsw:VincentMaphaiMember2024-12-310001786909sbsw:VincentMaphaiMember2023-12-310001786909sbsw:SavannahDansonMember2025-12-310001786909sbsw:SavannahDansonMember2024-12-310001786909sbsw:SavannahDansonMember2023-12-310001786909sbsw:HarryKenyonSlaneyMember2025-12-310001786909sbsw:HarryKenyonSlaneyMember2024-12-310001786909sbsw:HarryKenyonSlaneyMember2023-12-310001786909sbsw:DirectorsMember2025-12-310001786909sbsw:DirectorsMember2024-12-310001786909sbsw:DirectorsMember2023-12-310001786909sbsw:DawieMostertMember2025-12-310001786909sbsw:DawieMostertMember2024-12-310001786909sbsw:DawieMostertMember2023-12-310001786909sbsw:ThembaNkosiMember2025-12-310001786909sbsw:ThembaNkosiMember2024-12-310001786909sbsw:ThembaNkosiMember2023-12-310001786909sbsw:RobertVanNiekerkMember2025-12-310001786909sbsw:RobertVanNiekerkMember2024-12-310001786909sbsw:RobertVanNiekerkMember2023-12-310001786909sbsw:LaurentCharbonnierMember2025-12-310001786909sbsw:LaurentCharbonnierMember2024-12-310001786909sbsw:LaurentCharbonnierMember2023-12-310001786909sbsw:CharlesCarterMember2025-12-310001786909sbsw:CharlesCarterMember2024-12-310001786909sbsw:CharlesCarterMember2023-12-310001786909sbsw:MelanieNaidooVermaakMember2025-12-310001786909sbsw:MelanieNaidooVermaakMember2024-12-310001786909sbsw:MelanieNaidooVermaakMember2023-12-310001786909ifrs-full:MajorOrdinaryShareTransactionsMembersbsw:CharlKeyterMember2026-04-240001786909ifrs-full:MajorOrdinaryShareTransactionsMembersbsw:RichardMenellMember2026-04-240001786909ifrs-full:MajorOrdinaryShareTransactionsMembersbsw:CharlesCarterMember2026-04-24
|
As filed with the Securities and Exchange Commission on 24 April 2026 |
UNITED STATES
SECURITIES AND EXCHANGE COMMISSION
Washington, D.C. 20549
| | | | | | | | | |
| | |
(Mark One) ☐ REGISTRATION STATEMENT PURSUANT TO SECTION 12(b) OR 12(g) OF THE SECURITIES EXCHANGE ACT OF 1934 or ☒ ANNUAL REPORT PURSUANT TO SECTION 13 OR 15(d) OF THE SECURITIES EXCHANGE ACT OF 1934 For the fiscal year ended 31 December 2025 or ☐ TRANSITION REPORT PURSUANT TO SECTION 13 OR 15(d) OF THE SECURITIES EXCHANGE ACT OF 1934 or ☐ SHELL COMPANY REPORT PURSUANT TO SECTION 13 OR 15(d) OF THE SECURITIES EXCHANGE ACT OF 1934 Date of event requiring this shell company report For the transition period from to Commission file number: 333-234096 |
| Sibanye Stillwater Limited | |
| (Exact name of registrant as specified in its charter) | |
Republic of South Africa
(Jurisdiction of incorporation or organization)
Constantia Office Park
Bridgeview House, Building 11, Ground Floor
Cnr 14th Avenue & Hendrik Potgieter Road
Weltevreden Park, 1709
South Africa
011-27-11-278-9600
(Address of principal executive offices)
with copies to:
Charl Keyter
Chief Financial Officer
Sibanye Stillwater Limited
Tel: 011-27-11-278-9700
Constantia Office Park
Bridgeview House, Building 11, Ground Floor
Cnr 14th Avenue & Hendrik Potgieter Road
Weltevreden Park, 1709
South Africa
Igor Rogovoy
Linklaters LLP
Tel: 011-44-20-7456-3660
20 Ropemaker Street
London EC2Y 9AR
United Kingdom
(Name, Telephone, E-mail and/or Facsimile number and Address of Company Contact Person)
Securities registered or to be registered pursuant to Section 12(b) of the Act
| | | | | | | | | | |
| | Name of Each Exchange on Which Registered |
American Depositary Shares, each representing four ordinary shares | | |
Ordinary shares of no par value each | | |
* Not for trading, but only in connection with the registration of the American Depositary Shares pursuant to the requirements of the Securities and Exchange Commission. |
| Securities registered or to be registered pursuant to Section 12(g) of the Act None (Title of Class) Securities for which there is a reporting obligation pursuant to Section 15(d) of the Act None (Title of Class) Indicate the number of outstanding shares of each of the issuer’s classes of capital or common stock as of the close of the period covered by the Annual Report 2,830,567,264 ordinary shares of no par value | | |
| | |
Indicate by check mark if the registrant is a well-known seasoned issuer, as defined in Rule 405 of the Securities Act: Yes ☒ No ☐
If this report is an annual or transition report, indicate by check mark if the registrant is not required to file reports pursuant to Section 13 or 15(d) of the Securities Exchange Act of
1934. Yes ☐ No ☒
Note – Checking the box above will not relieve any registrant required to file reports pursuant to Section 13 or 15(d) of the Securities Exchange Act of 1934 from their obligations
under those Sections.
Indicate by check mark whether the registrant (1) has filed all reports required to be filed by Section 13 or 15(d) of the Securities Exchange Act of 1934 during the preceding 12
months (or for such shorter period that the registrant was required to file such reports), and (2) has been subject to such filing requirements for the past 90 days. Yes ☒ No ☐
Indicate by check mark whether the registrant has submitted electronically every Interactive Data File required to be submitted pursuant to Rule 405 of Regulation S-T (§232.405 of
this chapter) during the preceding 12 months (or for such shorter period that the registrant was required to submit such files). Yes ☒ No ☐
Indicate by check mark whether the registrant is a large accelerated filer, an accelerated filer, a non-accelerated filer, or an emerging growth company. See definition of “large
accelerated filer,” “accelerated filer,” and “emerging growth company” in Rule 12b-2 of the Exchange Act.
Large accelerated filer ☒ Accelerated filer ☐ Non-accelerated filer ☐ Emerging growth company ☐
If an emerging growth company that prepares its financial statements in accordance with U.S. GAAP, indicate by check mark if the registrant has elected not to use the extended
transition period for complying with any new or revised financial accounting standards† provided pursuant to Section 13(a) of the Exchange Act. ☐
† The term “new or revised financial accounting standard” refers to any update issued by the Financial Accounting Standards Board to its Accounting Standards Codification after
April 5, 2012.
Indicate by check mark whether the registrant has filed a report on and attestation to its management’s assessment of the effectiveness of its internal control over financial reporting
under Section 404(b) of the Sarbanes-Oxley Act (15 U.S.C. 7262(b)) by the registered public accounting firm that prepared or issued its audit report. ☒
If securities are registered pursuant to Section 12(b) of the Act, indicate by check mark whether the financial statements of the registrant included in the filing reflect the correction
of an error to previously issued financial statements. ☒
Indicate by check mark whether any of those error corrections are restatements that required a recovery analysis of incentive-based compensation received by any of the
registrant’s executive officers during the relevant recovery period pursuant to §240.10D-1(b). ☐
Indicate by check mark which basis of accounting the registrant has used to prepare the financial statements included in this filing:
U.S. GAAP ☐ International Financial Reporting Standards as issued by the International Accounting Standards Board ☒ Other ☐
If “Other” has been checked in response to the previous question, indicate by check mark which financial statement item the registrant has elected to follow: Item 17 ☐ Item 18 ☐
If this is an annual report, indicate by check mark whether the registrant is a shell company (as defined in Rule 12b-2 of the Exchange Act). Yes ☐ No ☒
(APPLICABLE ONLY TO ISSUERS INVOLVED IN BANKRUPTCY PROCEEDINGS DURING THE PAST FIVE YEARS)
Indicate by check mark whether the registrant has filed all documents and reports required to be filed by Sections 12, 13 or 15(d) of the Securities Exchange Act of 1934 subsequent
to the distribution of securities under a plan confirmed by a court. Yes ☐ No ☐
FORM 20-F CROSS REFERENCE GUIDE
| | | | | | |
| | | | Location in this document | | |
| | Identity of directors, senior management and advisers | | | | |
| | Offer statistics and expected timetable | | | | |
| | | | | | |
| | | | | | |
| | (2)Capitalisation and indebtedness | | | | |
| | (c)Reasons for the offer and use of proceeds | | | | |
| | | | Additional information—Risk factors | | |
| | Information on the Company | | | | |
| | (1)History and development of the Company | | Additional information—Memorandum of incorporation—General | | |
| | | | Annual Financial Report—Administration and Corporate Information | | |
| | | | Integrated Report—About Sibanye-Stillwater and our leadership—Chairman and Chief Executive Officer’s review | | |
| | | | Integrated Report—Performance and strategy—Maintaining a profitable business and optimising capital allocation—Chief Financial Officer’s report | | |
| | | | Integrated Report—Performance and strategy—Chief Financial Officer’s report—Maintaining a profitable business and optimising capital allocation —Summary of the annual financial statements—Capital expenditure | | |
| | | | Integrated Report—Chairman and Chief Executive Officer's review— Operating context and our refreshed strategy | | |
| | | | Annual Financial Report—Overview—Management’s discussion and analysis of the financial statements—Factors affecting Sibanye-Stillwater’s performance—Capital expenditure | | |
| | | | Annual Financial Report—Overview—Management’s discussion and analysis of the financial statements—Liquidity and capital resources | | |
| | | | Annual Financial Report—Consolidated financial statements—Notes to the consolidated financial statements—Note 16: Acquisitions | | |
| | | | Integrated Report—Performance and strategy—How we create value: Our business model | | |
| | | | Presentation of Financial and Other Information—Significant capital expenditures and divestitures | | |
| | | | Annual Financial Report—Overview—Management’s discussion and analysis of the financial statements—Ability to generate and obtain adequate cash to meet its funding requirements | | |
| | | | Annual Financial Report—Shareholder information | | |
| | | | Additional information—Documents on display | | |
| | | | Annual Financial Report—Overview—Management’s discussion and analysis of the financial statements | | |
| | | | Integrated Report—About Sibanye-Stillwater and our leadership—About Sibanye-Stillwater | | |
| | | | Annual Financial Report—Four-year financial performance | | |
| | | | Integrated Report—Performance and strategy—Maintaining a profitable business and optimising capital allocation—Chief Financial Officer’s report— 2025 – A brief overview | | |
| | | | Integrated Report—Performance and strategy—How we create value: Our business model | | |
| | | | | | |
| | | | Integrated Report—Performance and strategy—Maintaining a profitable business and optimising capital allocation—Chief Financial Officer’s report— Focus areas – 2026—Metal prices | | |
| | | | Integrated Reports—About Sibanye-Stillwater and our leadership— Chairman's and Chief Executive Officer's review—Mineral resources and | | |
| | | | Annual Financial Report—Overview—Management’s discussion and analysis of the financial statements—Factors affecting Sibanye-Stillwater’s performance—Commodity prices | | |
| | | | Annual Financial Report—Overview—Management’s discussion and analysis of the financial statements—Introduction | | |
| | | | Integrated Report—About Sibanye-Stillwater and our leadership— Chairman’s and Chief Executive Officer’s review | | |
| | | | Additional Information—Environmental and regulatory matters | | |
| | | | Additional information—Refining and marketing | | |
| | | | Integrated Report—About Sibanye-Stillwater and our leadership— Chairman's and Chief Executive Officer's review—Operational and | | |
| | | | Integrated Report—About Sibanye-Stillwater and our leadership—Corporate governance—Ethical leadership and compliance | | |
| | (3)Organisational structure | | Annual Financial Report—Consolidated financial statements—Notes to the consolidated financial statements—Note 1.3: Consolidation | | |
| | (4)Property, plant and equipment | | Integrated Report—About Sibanye-Stillwater and our leadership— Chairman's and Chief Executive Officer's review—Shared value to all | | |
| | | | Additional Information—Environmental and regulatory matters | | |
| | | | Annual Financial Report—Consolidated financial statements—Notes to the consolidated financial statements—Note 14: Property, plant and equipment | | |
| | | | Mineral Resources and Reserves Report—Our business—Group summary of mining properties—Encumbrances | | |
| | Summary Disclosure (Item 1304) | | Mineral Resources and Reserves Report—Our business—Introduction | | |
| | | | Mineral Resources and Reserves Report—Our business—Group summary of mining properties | | |
| | Individual Property Disclosure (Item 1304) | | Mineral Resources and Mineral Reserves Report—Americas—PGM Operations—Stillwater and East Boulder | | |
| | | | Mineral Resources and Mineral Reserves Report—Southern Africa—PGM Operations—Marikana | | |
| | | | Mineral Resources and Mineral Reserves Report—Southern Africa—PGM Operations—Rustenburg | | |
| | | | Mineral Resources and Mineral Reserves Report—Southern Africa—Gold Operations—Kloof | | |
| | | | Mineral Resources and Mineral Reserves Report—Southern Africa—Gold Operations—Drienfontein | | |
| | | | Mineral Resources and Mineral Reserves Report—Europe—Battery Metals Development—Lithium—Keliber | | |
| | Internal Controls Disclosure (Item 1305) | | Mineral Resources and Reserves Report—Our business—Corporate Governance and Regulatory Compliance | | |
| | | | Mineral Resources and Reserves Report—Americas—PGM Operations— Internal Controls (QA/QC) | | |
| | | | Mineral Resources and Reserves Report—Southern Africa—PGM Operations —Internal Controls (QA/QC) | | |
| | | | Mineral Resources and Reserves Report—Southern Africa—Gold Operations —Overview—Internal Controls (QA/QC) | | |
| | | | | | |
| | | | Mineral Resources and Mineral Reserves Report—Europe—Battery Metals Development—Internal Controls (QA/QC) | | |
| | Unresolved staff comments | | | | |
| | Operating and financial review and prospects | | | | |
| | | | Annual Financial Report—Consolidated financial statements—Consolidated income statement | | |
| | | | Annual Financial Report—Consolidated financial statements—Consolidated statement of financial position | | |
| | | | Annual Financial Report—Consolidated financial statements—Consolidated statement of cash flows | | |
| | | | Annual Financial Report—Overview—Management’s discussion and analysis of the financial statements—Factors affecting Sibanye Stillwater's performance | | |
| | | | Annual Financial Report—Consolidated financial statements—Notes to the consolidated financial statements—Note 1.2: Basis of preparation— Significant accounting judgements and estimates | | |
| | | | Annual Financial Report—Consolidated financial statements—Notes to the consolidated financial statements—Note 27: Borrowings and derivative financial instrument | | |
| | | | Annual Financial Report—Consolidated financial statements—Notes to the consolidated financial statements—Note 27: Borrowings and derivative financial instrument—Note 27.9: Fair value of financial instruments and risk management | | |
| | | | Integrated Report—Performance and strategy—Chief Financial Officer's report—Financial result | | |
| | | | Additional Information—Environmental and regulatory matters | | |
| | (2)Liquidity and capital resources | | Annual Financial Report—Overview—Management’s discussion and analysis of the financial statements—Liquidity and capital resources | | |
| | | | Annual Financial Report—Overview—Management’s discussion and analysis of the financial statements—Statement of financial position | | |
| | | | Annual Financial Report—Overview—Management’s discussion and analysis of the financial statements—Ability to generate and obtain adequate cash to meet its funding requirements | | |
| | | | Annual Financial Report—Consolidated financial statements—Notes to the consolidated financial statements—Note 27: Borrowings and derivative financial instrument | | |
| | | | Annual Financial Report—Consolidated financial statements—Notes to the consolidated financial statements—Note 36: Commitments | | |
| | | | Annual Financial Report—Consolidated financial statements—Notes to the consolidated financial statements—Note 29: Environmental rehabilitation | | |
| | (3)Research and development, patents and licences, etc. | | Integrated Report—Context, risk and opportunities—Unpacking the top 10 group strategic risks | | |
| | | | Annual Financial Report—Overview—Management’s discussion and analysis of the financial statements—Factors affecting Sibanye Stillwater's performance | | |
| | (5)Critical accounting estimates | | Annual Financial Report—Consolidated financial statements—Notes to the consolidated financial statements—Note 1: Accounting policies | | |
| | | | Annual Financial Report—Consolidated financial statements—Notes to the consolidated financial statements—Note 1.2: Basis of preparation— Significant accounting judgements and estimates | | |
| | | | | | |
| | | | Annual Financial Report—Consolidated financial statements—Notes to the consolidated financial statements—Note 3: Revenue—Significant accounting judgements and estimates | | |
| | | | Annual Financial Report—Consolidated financial statements—Notes to the consolidated financial statements—Note 3: Revenue—Accounting policy | | |
| | Directors, senior management and employees | | | | |
| | (1)Directors and senior management | | Integrated Report—About Sibanye-Stillwater and our leadership—About our board | | |
| | | | Additional Information—Directors and executive management | | |
| | | | Annual Financial Report—Consolidated financial statements—Notes to the consolidated financial statements—Note 37: Related-party transactions | | |
| | | | Annual Financial Report—Consolidated financial statements—Notes to the consolidated financial statements—Note 6: Share-based payments | | |
| | | | Integrated Report—Remuneration: Performance and Strategy— Remuneration report, Part 3: Implementation report—Executive directors' and prescribed officers' single figure of remuneration | | |
| | | | Integrated Report—Remuneration: Performance and Strategy— Remuneration report, Part 3: Implementation report—Non-executive director | | |
| | | | Annual Financial Report—Consolidated financial statements—Notes to the consolidated financial statements—Note 38: Directors' and prescribed officers' remuneration | | |
| | | | Integrated Report—Governance—Corporate governance—Functional governance areas | | |
| | | | Integrated Report——Governance—Corporate governance— Independence, tenure, diversity and inclusivity | | |
| | | | Integrated Report—Remuneration: Performance and Strategy— Remuneration report, Part 2: Remuneration policy—Executive director | | |
| | | | Integrated Report—About Sibanye-Stillwater and our leadership—About our board | | |
| | | | Integrated Report—Ancillary Information—Detail on board committees | | |
| | | | Integrated Report—Context, risk and opportunities—Employees and organised labour | | |
| | | | Integrated Report—Ancillary Information—Four-year statistical review— Sustainability statistics | | |
| | | | Additional information—Memorandum of incorporation—Voting rights | | |
| | | | Annual Financial Report—Consolidated financial statements—Notes to the consolidated financial statements—Note 6: Share-based payments | | |
| | | | Annual Financial Report—Consolidated financial statements—Notes to the consolidated financial statements—Note 37: Related-party transactions | | |
| | Major Shareholders and Related Party Transactions | | | | |
| | | | Additional information—Material contracts—US holders | | |
| | | | Additional information—Memorandum of incorporation—Voting rights | | |
| | | | Annual Financial Report—Shareholder information | | |
| | | | Integrated Report—Ancillary information—Shareholder information | | |
| | (2)Related party transactions | | Annual Financial Report—Consolidated financial statements—Notes to the consolidated financial statements—Note 37: Related-party transactions | | |
| | | | Additional information—Refining and marketing | | |
| | | | | | |
| | | | Annual Financial Report—Consolidated financial statements—Notes to the consolidated financial statements—Note 38: Directors' and prescribed officers' remuneration | | |
| | (3)Interests of experts and counsel | | | | |
| | | | | | |
| | (1)Consolidated statements and other financial information | | Annual Financial Report—Overview—Management’s discussion and analysis of the financial statements | | |
| | | | Annual Financial Report—Consolidated financial statements—Consolidated income statement | | |
| | | | Annual Financial Report—Consolidated financial statements—Consolidated statement of financial position | | |
| | | | Annual Financial Report—Consolidated financial statements—Notes to the consolidated financial statements—Note 13: Dividends | | |
| | | | Annual Financial Report—Directors’ report—Litigation | | |
| | | | Annual Financial Report—Consolidated financial statements—Notes to the consolidated financial statements | | |
| | | | Annual Financial Report—Report of independent registered public accounting firm | | |
| | | | Additional information—Dividend policy and dividend distribution | | |
| | | | Annual Financial Report—Consolidated financial statements—Notes to the consolidated financial statements—Note 39: Events after reporting date | | |
| | | | | | |
| | | | Additional information—The listing | | |
| | | | | | |
| | | | Additional information—The listing | | |
| | | | | | |
| | | | | | |
| | | | | | |
| | | | | | |
| | | | | | |
| | (2)Memorandum and articles of association | | Additional information—Memorandum of incorporation | | |
| | | | Additional information—Taxation—South African exchange control limitations affecting security holders | | |
| | | | Additional information—Material contracts | | |
| | | | Additional information—Taxation—South African exchange control limitations affecting security holders | | |
| | | | Additional information—Environmental and regulatory matters—Exchange controls | | |
| | | | Additional information—Taxation | | |
| | (6)Dividends and paying agents | | | | |
| | | | | | |
| | | | Additional information—Documents on display | | |
| | (9)Subsidiary information | | | | |
| | (j)Annual Report to Security Holders | | | | |
| | | | | | |
| | Quantitative and qualitative disclosures about market risk | | Annual Financial Report—Consolidated financial statements—Notes to the consolidated financial statements—Note 35.2: Risk management activities | | |
| | Description of securities other than equity securities | | | | |
| | | | | | |
| | | | | | |
| | | | | | |
| | (4)American depositary shares | | Additional information—Material contracts—Deposit agreement | | |
| | Defaults, dividend arrearages and delinquencies | | | | |
| | Material modifications to the rights of security holders and use of proceeds | | | | |
| | | | Additional information—Item 15: Controls and procedures | | |
| | | | Additional information—Item 15: Controls and procedures—Management's report on internal control over financial reporting | | |
| | | | Additional information—Item 15: Controls and procedures—Changes in internal control over financial reporting | | |
| | | | Annual Financial Report—Report of independent registered public accounting firm | | |
| | Audit Committee financial expert | | Additional information—Directors and executive management—Terence Nombembe | | |
| | | | Integrated Report—Governance—Corporate governance | | |
| | | | Integrated Report—Governance—Corporate governance—Ethical leadership and compliance | | |
| | Principal accountant fees and services | | Annual Financial Report—Auditor independence and fees | | |
| | Exemptions from the listing standards for audit committees | | | | |
| | Purchase of equity securities by the issuer and affiliated purchasers | | | | |
| | Change in registrant’s certifying accountant | | | | |
| | | | Additional information—JSE corporate governance practices compared with NYSE Listing Standards | | |
| | | | Additional information—Environmental and regulatory matters—Health and safety | | |
| | Disclosure regarding foreign jurisdictions that prevent inspections | | | | |
| | | | Additional Information—Sibanye-Stillwater Information and Securities Transactions Policy | | |
| | | | Integrated Report—Ancillary Information—2026: Planned areas of focus for the combined Audit and Risk Committee | | |
| | | | Additional Information—Risk Factors | | |
| | | | Additional Information—Cybersecurity | | |
| | | | | | |
| | | | Annual Financial Report—Report of independent registered public accounting firm (PCAOB ID: 1368) | | |
| | | | Annual Financial Report—Consolidated financial statements—Notes to the consolidated financial statements | | |
| | | | | | |
PRESENTATION OF FINANCIAL AND OTHER INFORMATION
Historical Consolidated Financial Statements
Sibanye-Stillwater is a multinational mining and metals processing Group with a diverse portfolio of mining and processing operations, projects
and investments across five continents. The Group is one of the foremost global recyclers of a suite of metals and also has interests in leading
mine tailings retreatment operations (secondary mining).
Sibanye-Stillwater is one of the world’s largest primary producers of platinum, palladium, and rhodium and is a top tier gold producer. It also
produces and refines iridium and ruthenium, nickel, chrome, copper and cobalt. The Group has also diversified into battery metals mining and
processing and has increased its presence in the circular economy by growing its recycling and tailings reprocessing exposure globally. The
books of account of Sibanye-Stillwater are maintained in South African Rand and Sibanye-Stillwater’s annual financial statements are prepared
in accordance with International Financial Reporting Standards, as issued by the International Accounting Standards Board (IASB), hereafter
referred to as IFRS Accounting Standards, as prescribed by law. These annual financial statements are distributed to shareholders and are
submitted to the Johannesburg Stock Exchange (JSE) and the New York Stock Exchange (NYSE).
The consolidated annual financial statements of Sibanye-Stillwater as at and for the fiscal years ended 31 December 2025, 2024 and 2023 (the
Consolidated Financial Statements) have been prepared under the historical cost convention, except for certain financial assets and financial
liabilities (including derivative financial instruments), which are measured at fair value through profit or loss or through other comprehensive
income.
Non-IFRS Measures
The financial information in this annual report includes certain measures that are not defined by IFRS Accounting Standards, including "adjusted
EBITDA”, “notional free cash flow”, “All-in sustaining costs”, “All-in sustaining cost per kilogram and ounce (or per tonne)”, “All-in costs”, “All-in
cost per kilogram and ounce (or per tonne)”, “headline earnings”, “headline earnings per share”, “diluted headline earnings per share”,
“interest coverage ratio”, “net debt/(cash)”, “net debt/(cash) to adjusted EBITDA (ratio)”, “normalised earnings”, and “operating costs”. These
measures are not measures of financial performance or cash flows under IFRS Accounting Standards and may not be comparable to similarly
titled measures of other companies. See pages AFR-39 to AFR-40 for more information on, including reconciliations of, the non-IFRS figures
presented by Sibanye-Stillwater. Sibanye-Stillwater also presents FTSE Russell green revenue factor, which is not calculated in accordance with
IFRS Accounting Standards.See page IR-4 for more information on this metric.
Conversion Rates
Certain information in this annual report presented in Rand has been translated into US dollars. Unless otherwise stated, the conversion rate for
these translations in the consolidated statement of financial position is R16.57/US$1.00, which was the closing rate on 31 December 2025 and the
conversion rate for translation in the consolidated income statement, consolidated statement of cash flows and for operating cost, average
basket price (2E,3E,4E), gold price, All-in-sustaining cost and All-in-cost is R17.88/US$1.00, which was the average rate for the fiscal year ended 31
December 2025. By including the US dollar equivalents, Sibanye-Stillwater is not representing that the Rand amounts actually represent the US
dollar amounts shown or that these amounts could be converted into US dollars at the rates indicated.
Significant capital expenditures and divestitures
Future-Facing Metals Projects
Since 2022 the Group has continued its expansion into the future-facing metals and recycling space with a number of strategic acquisitions and
investments in the United States and Europe. The transactions completed during the last three financial years are summarised below:
*Keliber: Following on from its initial investment in the Keliber lithium project in 2021, between 2022 and 2023, Sibanye-Stillwater has
completed several transactions to augment its ownership in the project. In 2022, Sibanye-Stillwater increased its total shareholding in
Keliber to 85.9% at a total cost of EUR338 million. In 2023 the Finnish Minerals Group increased its holding in Keliber from 14% to 20% by
subscribing for EUR53.9 million of a EUR104 million rights issue. The Group's portion of the subscription (through wholly-owned subsidiary,
Keliber Lithium Proprietary Limited) amounted to EUR50.2 million. In addition to the rights issue, other minority shareholders in Keliber
(which held 0.79% of the total Keliber shareholding) for which the Group previously recognised an accelerated put option liability at 31
December 2022, received and accepted voluntary offers at the same share price (EUR157.28 per share) as the voluntary offer that
concluded in 2022. A total payment of EUR5.2 million was made by the Group to all the shareholders who accepted the voluntary
offers during June 2023. Following these transactions, the Finnish Minerals Group holds 20% in Keliber, the Group retained 79.82%, while
other minority shareholders hold the balance of the shares in Keliber. See – Annual Financial Report – Consolidated financial
statements – Notes to the consolidated financial statements – Note 1.3: Consolidation and Note 26.1: Subsequent NCI transactions.
*Century: In February 2023, Sibanye-Stillwater obtained a controlling shareholding of 50.15% in New Century Resources Limited
(Century), an Australian tailings reprocessing business, following acquisition of an initial 19.9% stake in 2021, and further on-market
purchase of shares for a cash consideration of AUS$46 million. Subsequent to obtaining control, through on-and off-market trades for a
cash consideration of AUS$74 million, the Group obtained a 100% interest in Century by 10 May 2023. See – Annual Financial Report –
Consolidated financial statements – Notes to the consolidated financial statements – Note 1.3: Consolidation. In November 2023, the
Group exercised its option, obtained through the acquisition of Century, to acquire 100% of the Mt Lyell Copper mine in Tasmania,
Australia for a cash consideration of US$10 million. See – Annual Financial Report – Consolidated financial statements – Notes to the
consolidated financial statements – Note 1.1: Reporting entity and Annual Financial Report – Consolidated financial statements –
Notes to the consolidated financial statements – Note 1.3: Consolidation.
*Reldan: On 15 March 2024, the Group completed the acquisition of the Reldan Group of Companies (Reldan), a Pennsylvania-based
recycling group which reprocesses various waste streams, for a final cash purchase consideration of US$160.9 million. See – Annual
Financial Report – Consolidated financial statements – Notes to the consolidated financial statements – Note 16.2: Reldan business
combination (revised).
*Metallix: In September 2025, the Group concluded the acquisition of Metallix Refining (Metallix), which operates two processing and
recycling operations in Greenville, North Carolina and produces recycled precious metals, including gold, silver and platinum group
metals, primarily from industrial waste streams, for a cash purchase consideration of US$129 million. See – Annual Financial Report –
Consolidated financial statements – Notes to the consolidated financial statements – Note 16.1: Metallix Refining (Metallix) business
combination.
Scope 1, 2 and 3 GHG Emissions Data
This annual report also contains data on Sibanye-Stillwater’s Scope 1, 2 and 3 greenhouse gas emissions. Data for Scope 1 and 2 emissions relate
to Sibanye-Stillwater’s own activities and supplied heat, power, and cooling which are measured using data from its own systems and
independently assured. Scope 3 emissions relate to other organisations’ emissions and are therefore subject to a range of uncertainties and
challenges. At present Scope 3 data is not yet consistently available in many value chains and is calculated, collected, or estimated in different
ways. Sibanye-Stillwater’s Scope 3 emissions data is aligned to the requirements of the GHG protocol (GHG Protocol), developed by the World
Resources Institute (WRI) and the World Business Council for Sustainable Development (WBCSD). As value chain emissions data advances over
time, Sibanye-Stillwater expects to improve the quality of its Scope 3 data and data reporting.
Market Information
This annual report includes industry data about Sibanye-Stillwater’s markets obtained from industry surveys, industry publications, market
research and other publicly available third-party information. Industry surveys and industry publications generally state that the information they
contain has been obtained from sources believed to be reliable but that the accuracy and completeness of such information is not
guaranteed. Sibanye-Stillwater and its advisers have not independently verified this data.
In addition, in many cases, statements in this annual report regarding the gold, PGM, lithium and other mining and metals industries, and
Sibanye-Stillwater’s position in these industries have been made based on internal surveys, industry forecasts, market research, as well as
Sibanye-Stillwater’s own experiences. While these statements are believed by Sibanye-Stillwater to be reliable, they have not been
independently verified.
Mineral Resources and Mineral Reserves Estimations
The financial and technical assumptions underlying the Mineral Resources and Mineral Reserves estimations contained in this report and in the
Technical Report Summaries included as exhibits in this report are current as at 31 December 2025, the period covered by each of the
respective reports. Such assumptions rely on various factors that may change after the reporting period, including as a result of operational
reviews which Sibanye-Stillwater undertakes from time to time and when necessary. Accordingly, the Mineral Reserves and Mineral Resources
estimations contained in this report and in the Technical Report Summaries included as exhibits in this report may be materially impacted by,
among other things, changes to the underlying financial and technical assumptions in the future. In the event there is a material change to the
Technical Report Summaries included as exhibits in this report, updated Technical Report Summaries will be filed by Sibanye-Stillwater with the
Securities and Exchange Commission pursuant to the requirements of subpart 1302 of Regulation S-K under the US Securities Act.
Websites
References in this document to information on websites (and/or social media sites) are included as an aid to their location and such information
is not incorporated in, and does not form part of, this annual report.
FORWARD-LOOKING STATEMENTS
This annual report contains forward-looking statements within the meaning of the “safe harbour” provisions of the United States Private Securities
Litigation Reform Act of 1995 with respect to our financial condition, results of operations, business strategies, operating efficiencies, competitive
position, growth opportunities for existing services, plans and objectives of management, markets for stock and other matters.
These forward-looking statements, including, among others, those relating to our future business prospects, revenues and income, ESG change-
related targets and metrics, the potential benefits of past and future acquisitions (including statements regarding growth, cost savings, benefits
from and access to international financing and financial re-ratings), gold, PGM, and lithium pricing expectations, levels of output, supply and
demand, information relating to Sibanye-Stillwater’s new or ongoing development projects, any proposed, anticipated or planned expansions
into the battery metals or adjacent sectors and estimations or expectations of enterprise value, adjusted EBITDA and net asset values wherever
they may occur in this annual report and the exhibits to this annual report, are necessarily estimates reflecting the best judgment of our senior
management and involve a number of risks and uncertainties that could cause actual results to differ materially from those suggested by the
forward-looking statements. As a consequence, these forward-looking statements should be considered in light of various important factors,
including those set forth in this annual report. All statements other than statements of historical facts included in this report may be forward-
looking statements. Forward-looking statements also often use words such as “will”, “would”, “could”, “aim”, "anticipates”, “believes”, “goal”,
“may”, “target”, “vision”, “forecast”, “potential”, “estimate”, “expect” and words of similar meaning. By their nature, forward-looking statements
involve risk and uncertainty because they relate to future events and circumstances and should be considered in light of various important
factors, including those set forth in this disclaimer. Readers are cautioned not to place undue reliance on such statements. Important factors
that could cause actual results to differ materially from estimates or projections contained in the forward-looking statements include, without
limitation:
*Sibanye-Stillwater’s future financial position, plans, strategies, objectives, capital expenditures, projected costs and anticipated cost
savings, financing plans, debt position and ability to reduce debt leverage
*economic, business, political and social conditions in South Africa, Zimbabwe, the United States, Europe, Australia and elsewhere
*plans and objectives of management for future operations
*Sibanye-Stillwater’s ability to obtain the benefits of any streaming arrangements or pipeline financing
*the ability of Sibanye-Stillwater to comply with loan and other covenants and restrictions and difficulties in obtaining additional
financing or refinancing
*Sibanye-Stillwater’s ability to service its bond instruments
*changes in assumptions underlying Sibanye-Stillwater’s estimation of its Mineral Resources and Mineral Reserves
*any failure of a tailings storage facility
*the ability to achieve anticipated efficiencies and other cost savings in connection with, and the ability to successfully integrate, past,
ongoing and future acquisitions, as well as at existing operations
*the success of Sibanye-Stillwater’s business strategy and exploration and development activities
*the ability of Sibanye-Stillwater to complete any ongoing or future acquisitions
*the ability of Sibanye-Stillwater to comply with requirements that it operate in ways that provide progressive benefits to affected
communities
*changes and volatility in the market price of gold, silver, PGMs, battery metals (e.g. lithium, copper and zinc) and the cost of power,
petroleum fuels, and oil, among other commodities and supply requirements
*the occurrence of hazards associated with underground and surface mining
*any downgrade of South Africa’s credit rating or the credit rating of Sibanye-Stillwater
*a challenge regarding the title to any of Sibanye-Stillwater’s properties by claimants to land under restitution and other legislation
*Sibanye-Stillwater’s ability to implement its strategy and any changes thereto
*the outcome of legal challenges to the Group’s mining or other land use rights
*the occurrence of labour disputes, disruptions and industrial actions
*the availability, terms and deployment of capital or credit
*changes in the imposition of industry standards, regulatory costs and relevant government regulations, particularly environmental,
sustainability, tax, health and safety regulations and new legislation affecting water, mining, mineral rights and business ownership,
including any interpretation thereof which may be subject to dispute
*the outcome and consequence of any potential or pending litigation or regulatory proceedings, including in relation to any
environmental, health or safety issues
*failure to meet ethical standards, including actual or alleged instances of fraud, bribery or corruption
*the effect of climate change or other extreme weather events on Sibanye-Stillwater’s business
*the concentration of all final refining activity and a large portion of Sibanye-Stillwater’s PGM sales from mine production in the United
States with one entity
*the identification of a material weakness in disclosure and internal controls over financial reporting
*the effect of protectionist measures such as tariffs
*the effect of US tax credits on Sibanye-Stillwater and its subsidiaries
*the effect of adverse changes in tax laws, regulations and interpretations or challenges to Sibanye-Stillwater’s tax positions
*the effect of South African Exchange Control Regulations on Sibanye-Stillwater’s financial flexibility
*operating in new geographies and regulatory environments where Sibanye-Stillwater has no previous experience
*power disruptions, constraints and cost increases
*supply chain disruptions and shortages and increases in the price of production inputs
*the regional concentration of Sibanye-Stillwater’s operations
*fluctuations in exchange rates, currency devaluations, inflation and other macro-economic monetary policies
*the occurrence of temporary stoppages or precautionary suspension of operations at its mines for safety or environmental incidents
(including natural disasters) and unplanned maintenance
*Sibanye-Stillwater’s ability to hire and retain senior management and employees with sufficient technical and/or production skills
across its global operations necessary to meet its labour recruitment and retention goals, as well as its ability to achieve sufficient
representation of historically disadvantaged South Africans in its management positions
*failure of Sibanye-Stillwater’s information technology, communications and systems, the impact of cybersecurity incidents or breaches
*the adequacy of Sibanye-Stillwater’s insurance coverage
*social unrest, sickness or natural or man-made disaster in surrounding mining communities, including informal settlements in the vicinity
of some of Sibanye-Stillwater’s South African-based operations
*the impact of contagious diseases, including global pandemics
The foregoing factors and others described under Additional information—Risk Factors should not be construed as exhaustive. There may be
other factors that are unknown to us that may cause our actual results to differ materially from the forward-looking statements. Moreover, new
risk factors emerge from time to time and it is not possible for us to predict all such risk factors. We may not be able to assess the extent to which
any factor, or combination of factors, may cause actual results to differ materially from those contained in any forward-looking statements.
Given these risks and uncertainties, you should not place undue reliance on forward-looking statements as a prediction of actual results.
These forward-looking statements speak only as of the date they are made. We undertake no obligation and do not intend to update publicly
or release any revisions to these forward-looking statements to reflect events or circumstances after the date of this annual report or to reflect
the occurrence of unanticipated events, except as may be required by law.
DEFINED TERMS AND CONVENTIONS
In this annual report, all references to “we”, “us” and “our” refer to the Sibanye-Stillwater and the Group, as applicable.
In this annual report, all references to “fiscal 2026” and “2026” are to the fiscal year ending 31 December 2026, and “fiscal 2025” and “2025” are
to the fiscal year ended 31 December 2025, “fiscal 2024” and “2024” are to the fiscal year ended 31 December 2024, and all references to
“fiscal 2023” and “2023” are to the fiscal year ended 31 December 2023.
In this annual report, all references to "limited assurance" refers to limited assurance in accordance with the International Standards on
Assurance Engagements (ISAE) 3000 (revised), issued by the International Auditing and Assurance Standards Board. The work performed for
limited assurance is substantially less than the work performed for a reasonable assurance opinion, such as that provided for financial
statements.
In this annual report, all references to “Argentina” are to the Republic of Argentina, all references to “Australia” are to the Commonwealth of
Australia, all references to “Canada” are to the Dominion of Canada, all references to “Finland” are to the Republic of Finland, all references to
“France” are to the French Republic, all references to “South Africa” and "SA" are to the Republic of South Africa, all references to the “United
Kingdom” and “UK” are to the United Kingdom of Great Britain and Northern Ireland, all references to the “United States” and “US” are to the
United States of America, its territories and possessions and any state of the United States and the District of Columbia and all references to
“Zimbabwe” are to the Republic of Zimbabwe.
In this annual report, production and figures are provided for platinum group metals, which are referred to as “PGM” collectively.
In this annual report, gold and PGM production figures are provided in kilograms, which are referred to as “kg”, or in troy ounces, which are
referred as “ounces” or “oz”, or in kilo troy ounces, which are referred to as “kilo ounces” or “koz”. Mineral resource, mineral reserve and mined
ore grades are provided in grams per metric tonne for precious metals, which are referred to as “grams per tonne” or “g/t”, or percentage in
case of base metals, which is referred to as "%". All references to “tonnes” or “t” in this annual report are to metric tonnes, and all references to
“tpm” are to tonnes per month and “ktpm” are to thousand tonnes per month.
In this annual report, nickel metal and nickel salts production figures are provided in tonnes, which are referred to as “tNi”, or “tonnes”.
In this annual report, zinc metal production figures are provided in thousand tonnes, which are referred to as “ktZn”.
In this annual report, copper metal volume sold is provided in pounds, which are referred to as “Lbs”. Silver and other volumes (rhodium,
ruthenium and iridium) sold is provided in troy ounces, which are referred to as “ounces” or “oz”.
In this annual report, all references to “km” are to kilometres, “km2” are to square kilometres, “m” are to meters, and “cm” are to centimetres. All
references to “ha” are to hectares.
In this annual report, all references to “W” are to watts, which is a unit of power used to quantify the rate of energy and is defined as 1 joule per
second, and all references to “kW” are to kilowatts, which is a measure of one thousand watts of power.
In this annual report, “R”, “Rand” and “rand” refer to the South African Rand and “Rand cents” and “SA cents” refers to subunits of the South
African Rand, “$”, “US$”, “US dollars” and “dollars” refer to United States dollars and “US cents” refers to subunits of the US dollar, “£”, “GBP” and
“pounds sterling” refer to British pounds and “pence” refers to the subunits of the British pound, “€” and “EUR” refer to Euros, “CAD$” refers to
Canadian dollars and “AUS$” refers to Australian dollars.
This annual report contains references to the “total recordable injury frequency rate” (TRIFR), “serious injury frequency rate” (SIFR) and “lost time
injury frequency rate” (LITFR). TRIFR includes the total number of fatalities, lost time injuries, medically treated injuries and restricted work injuries
per million man hours. SIFR include the total number of serious injuries per million man hours. LITFR includes the total number of lost time injuries
per million man hours.
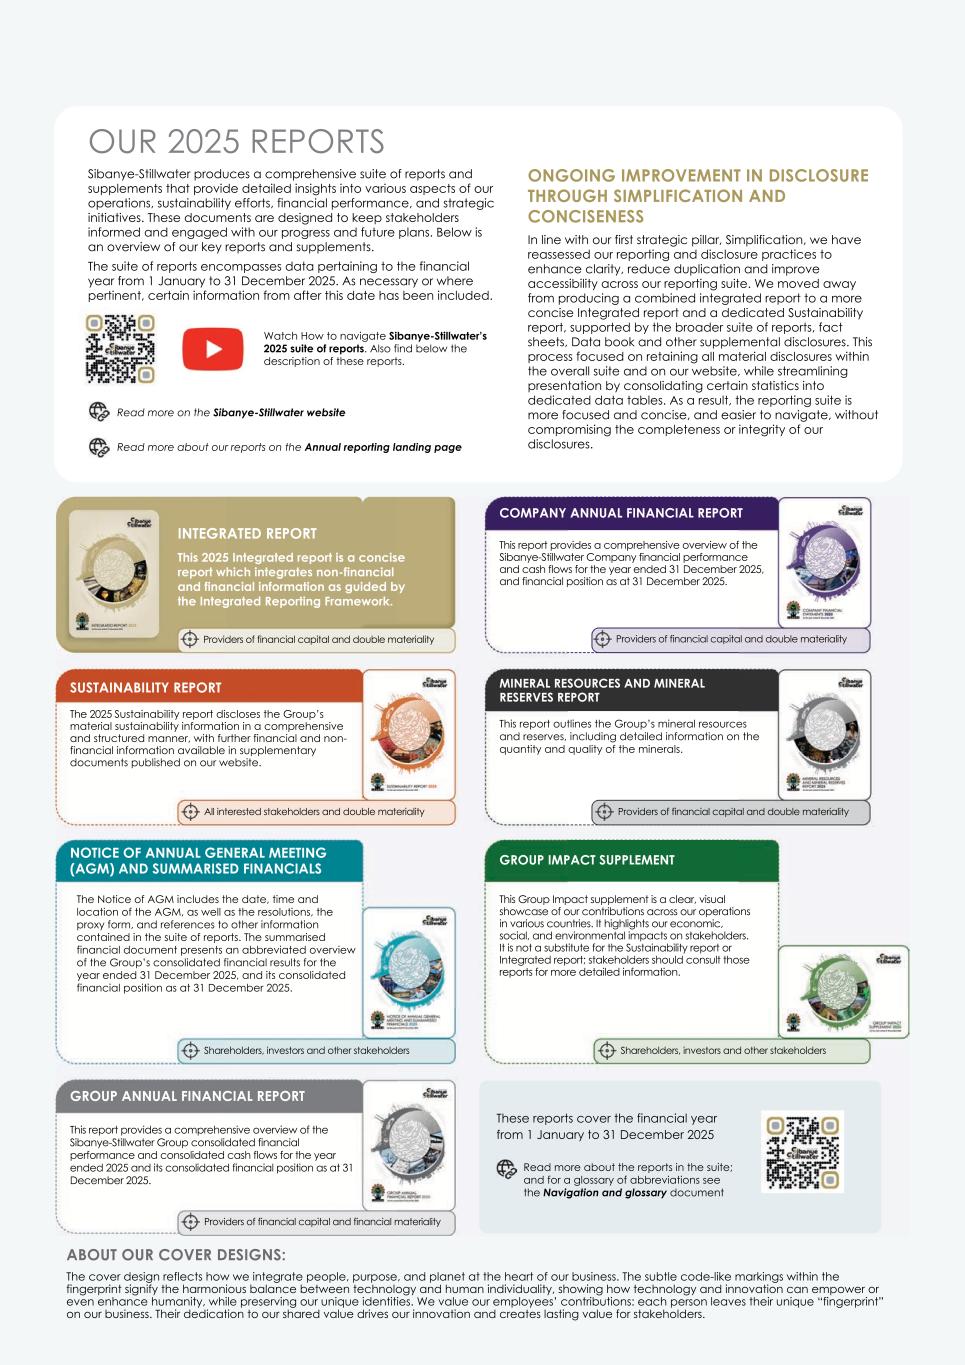
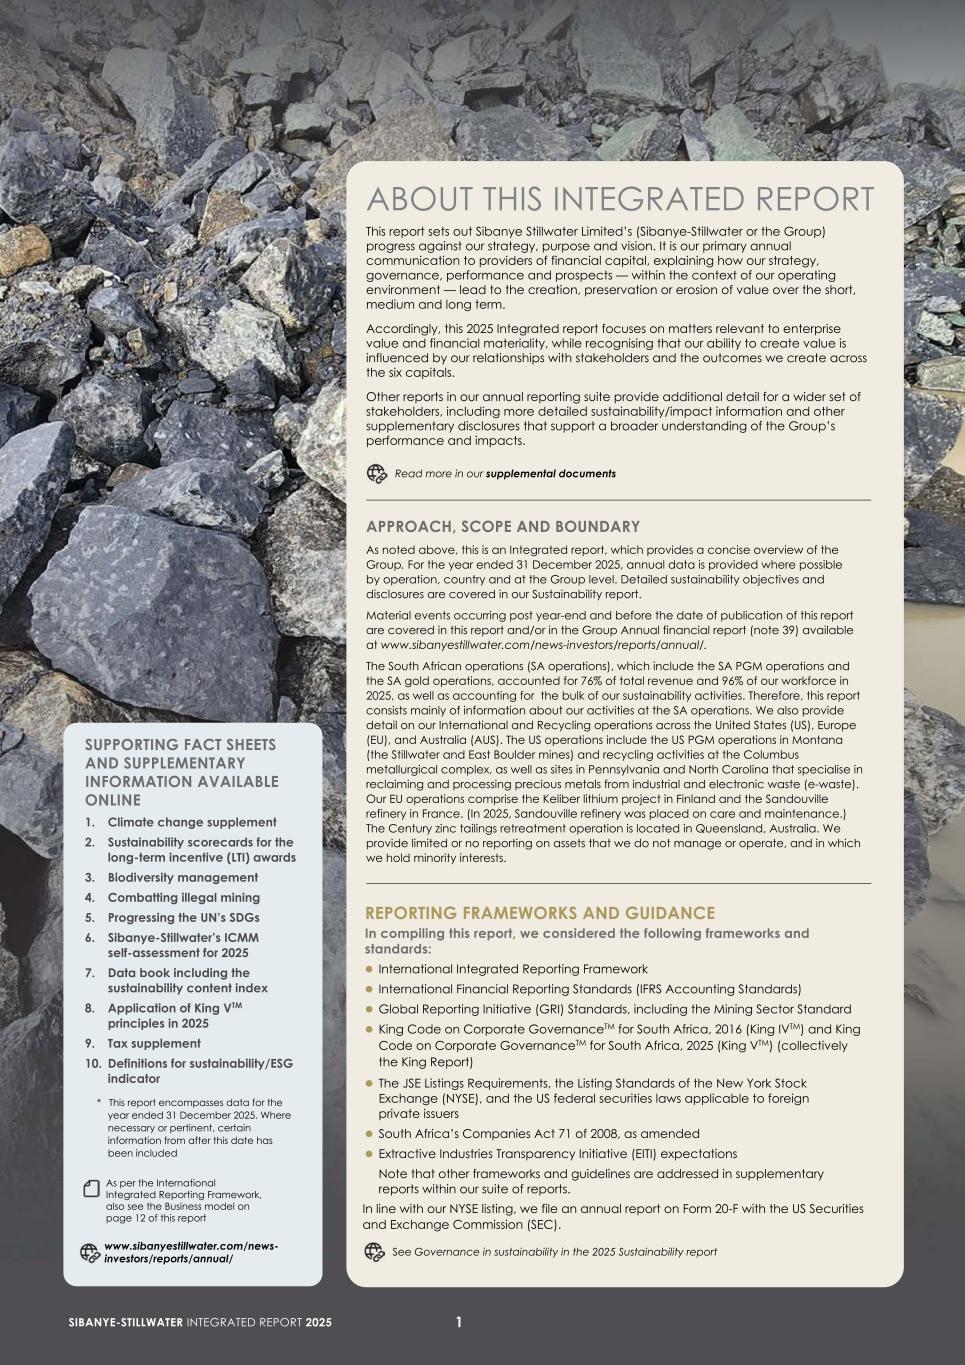
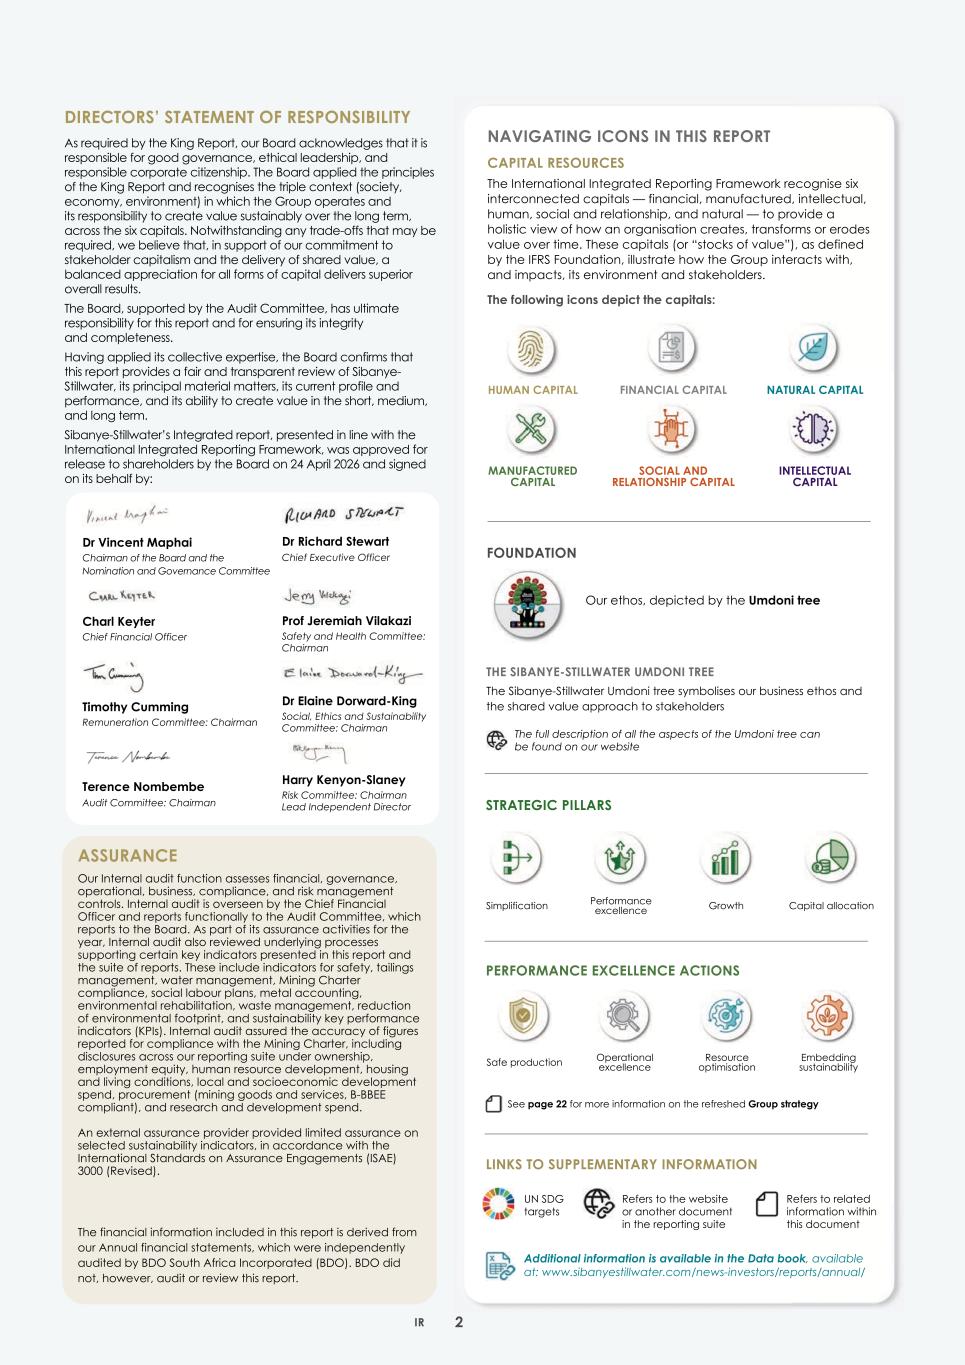
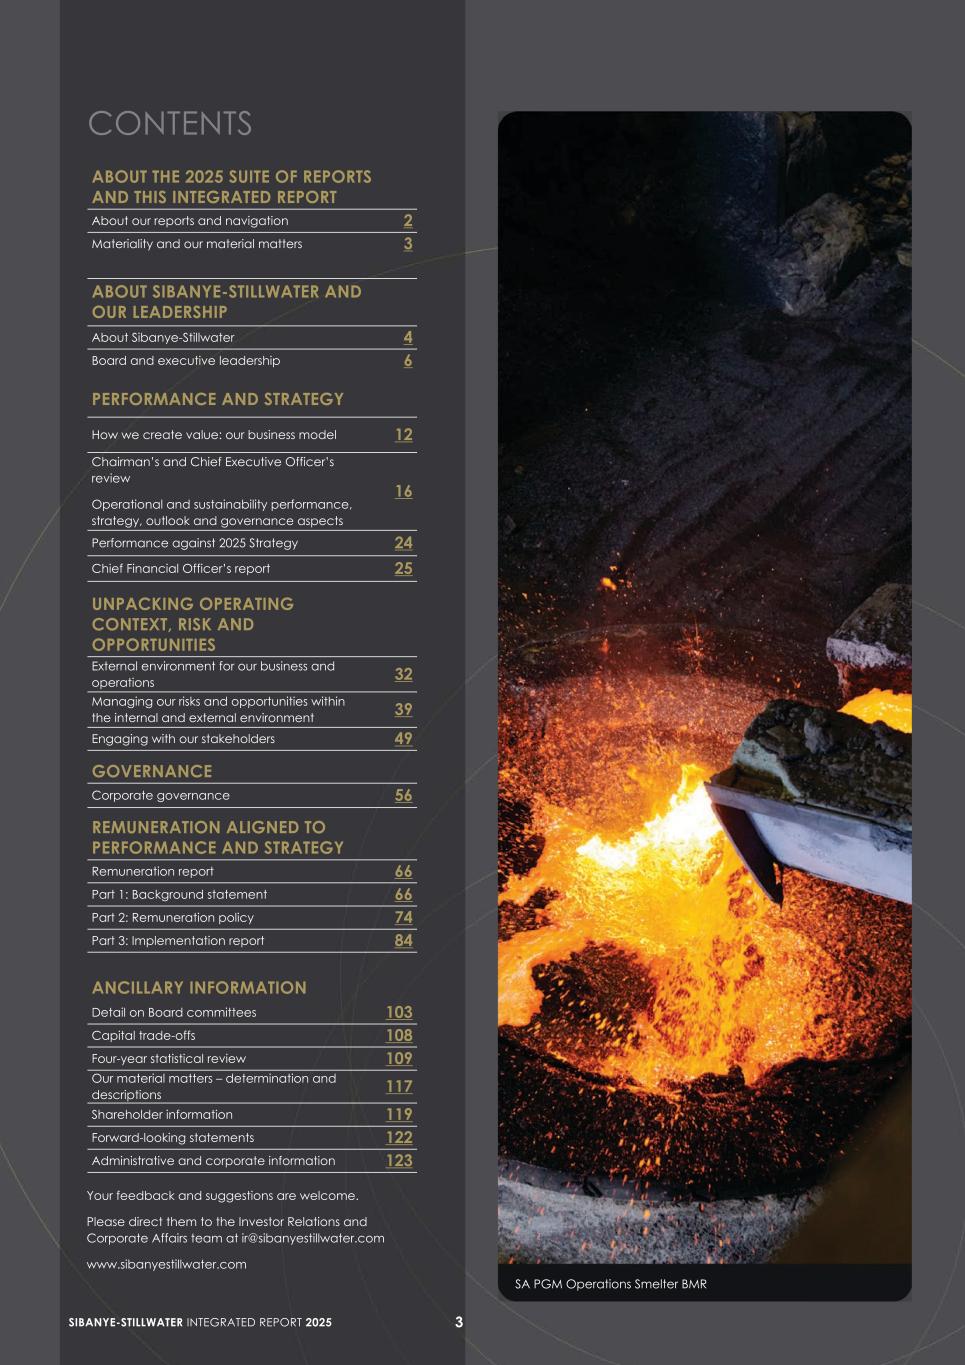
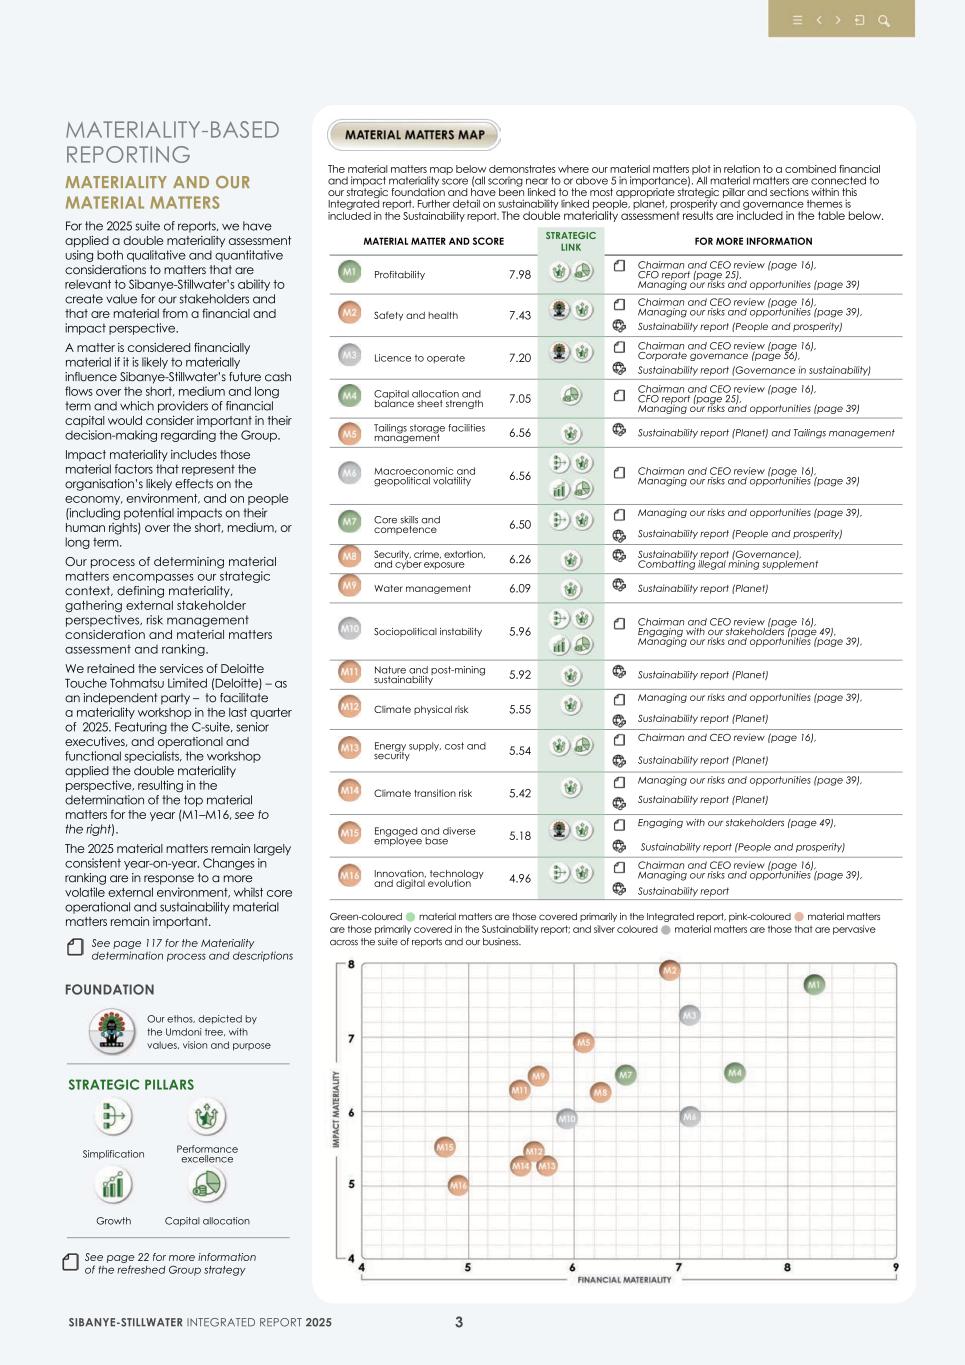
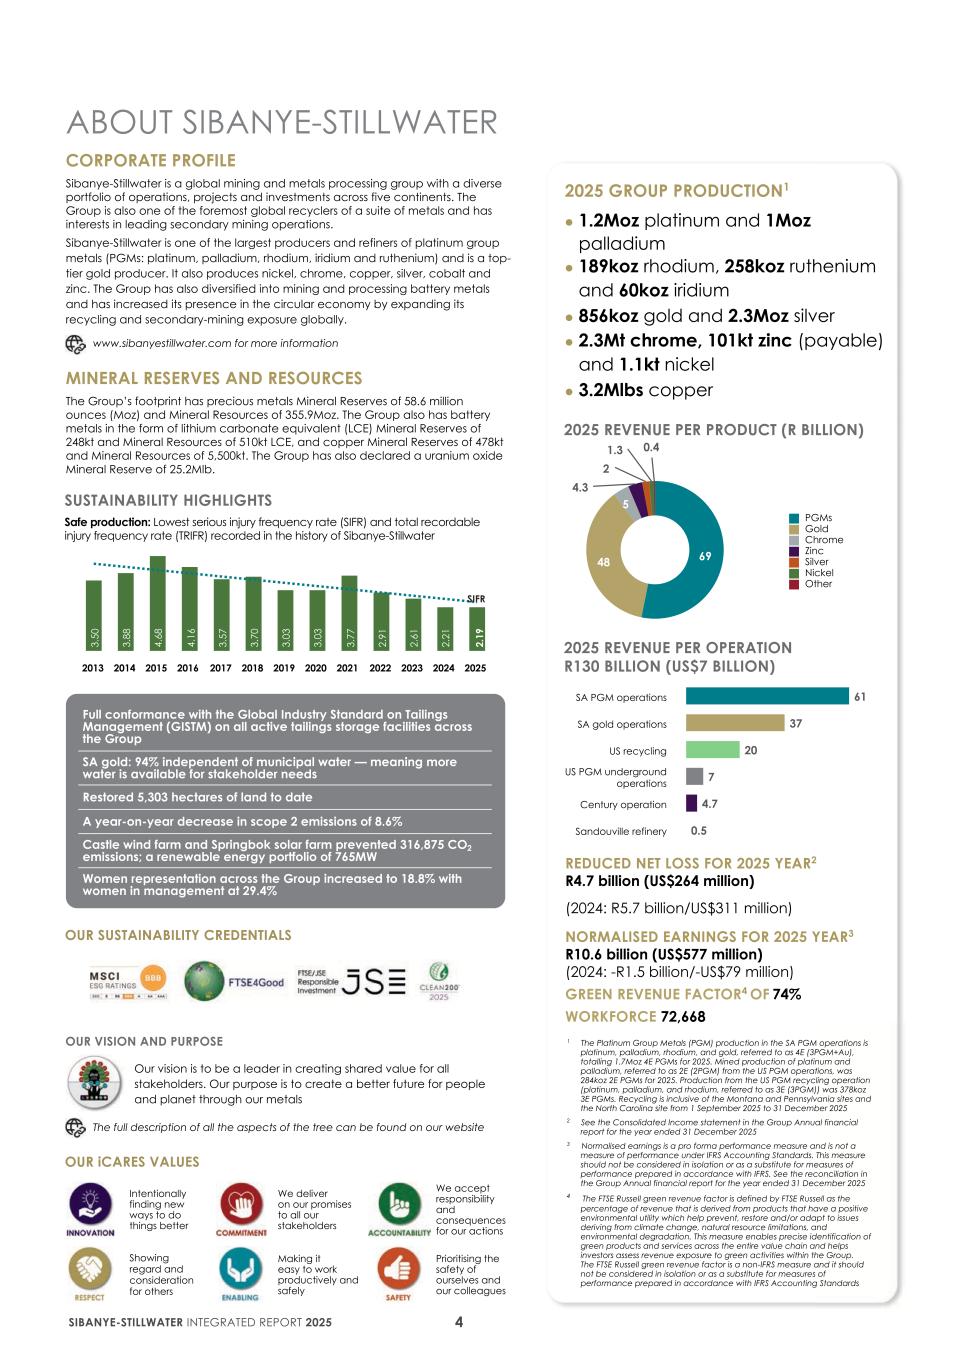
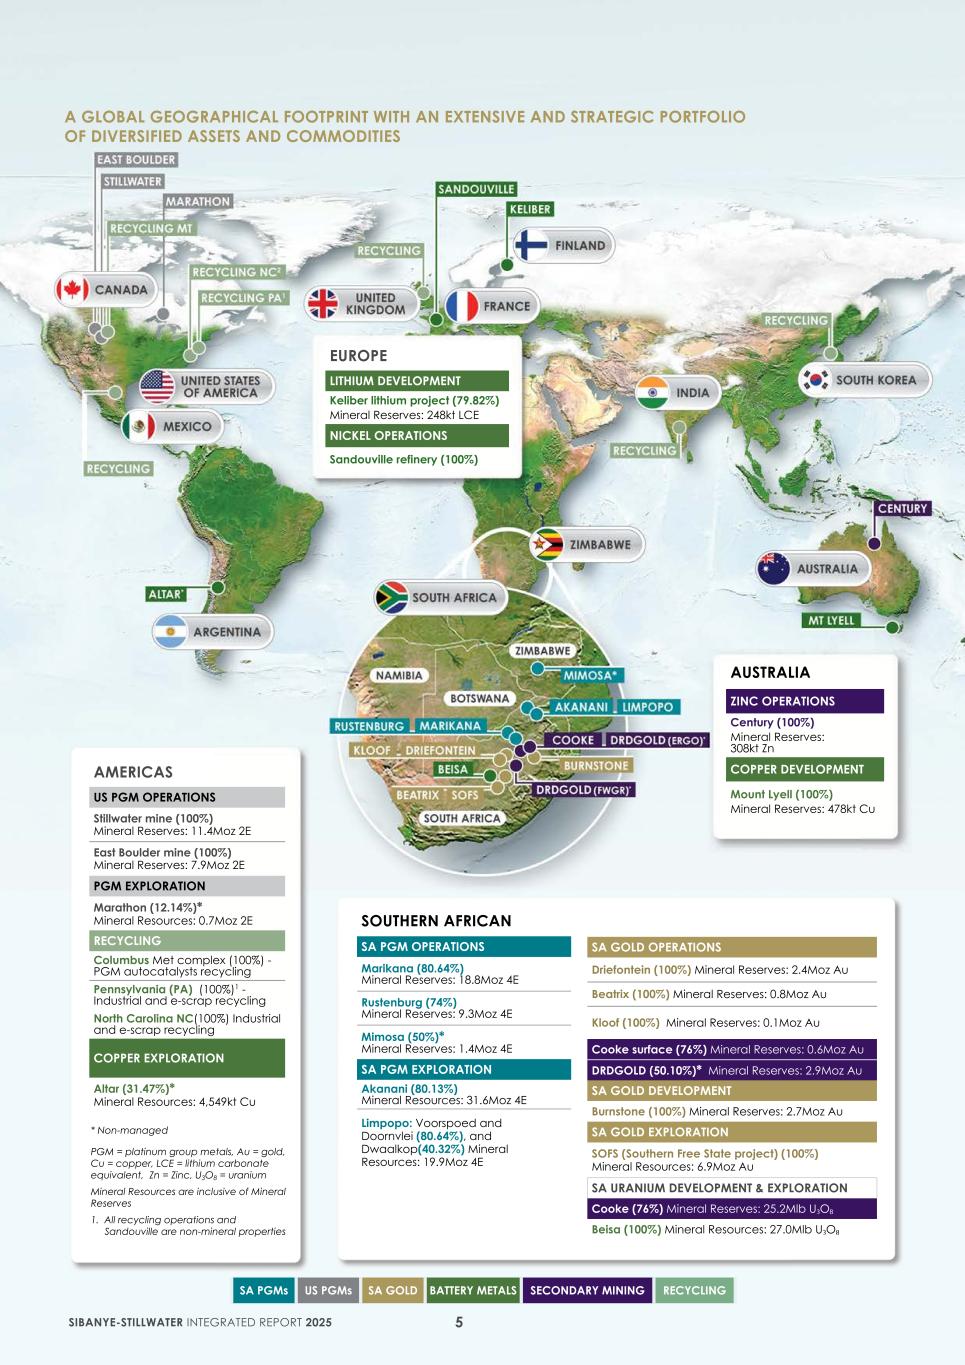
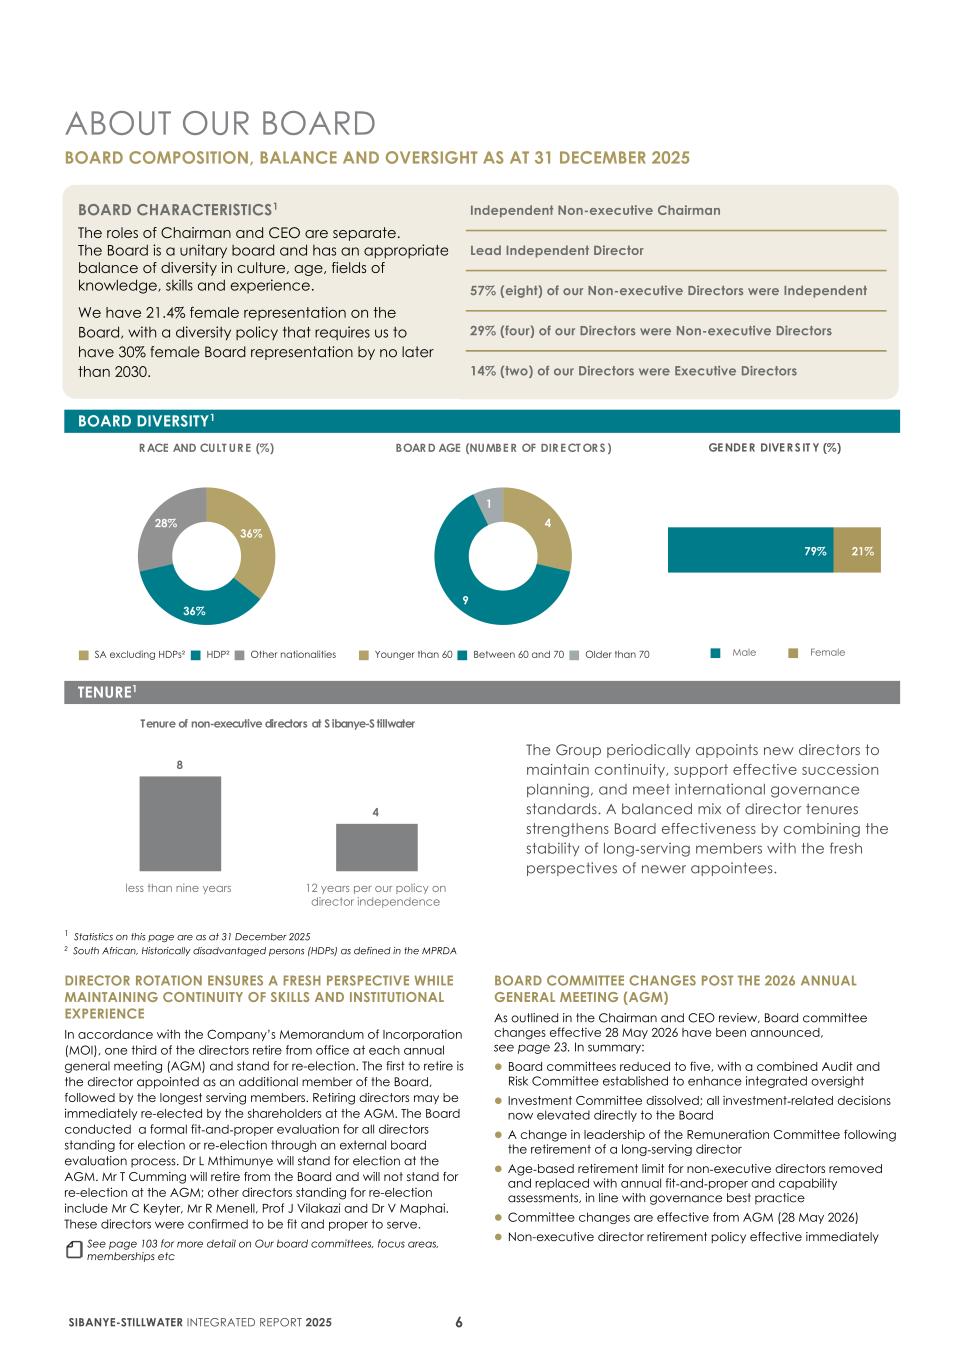
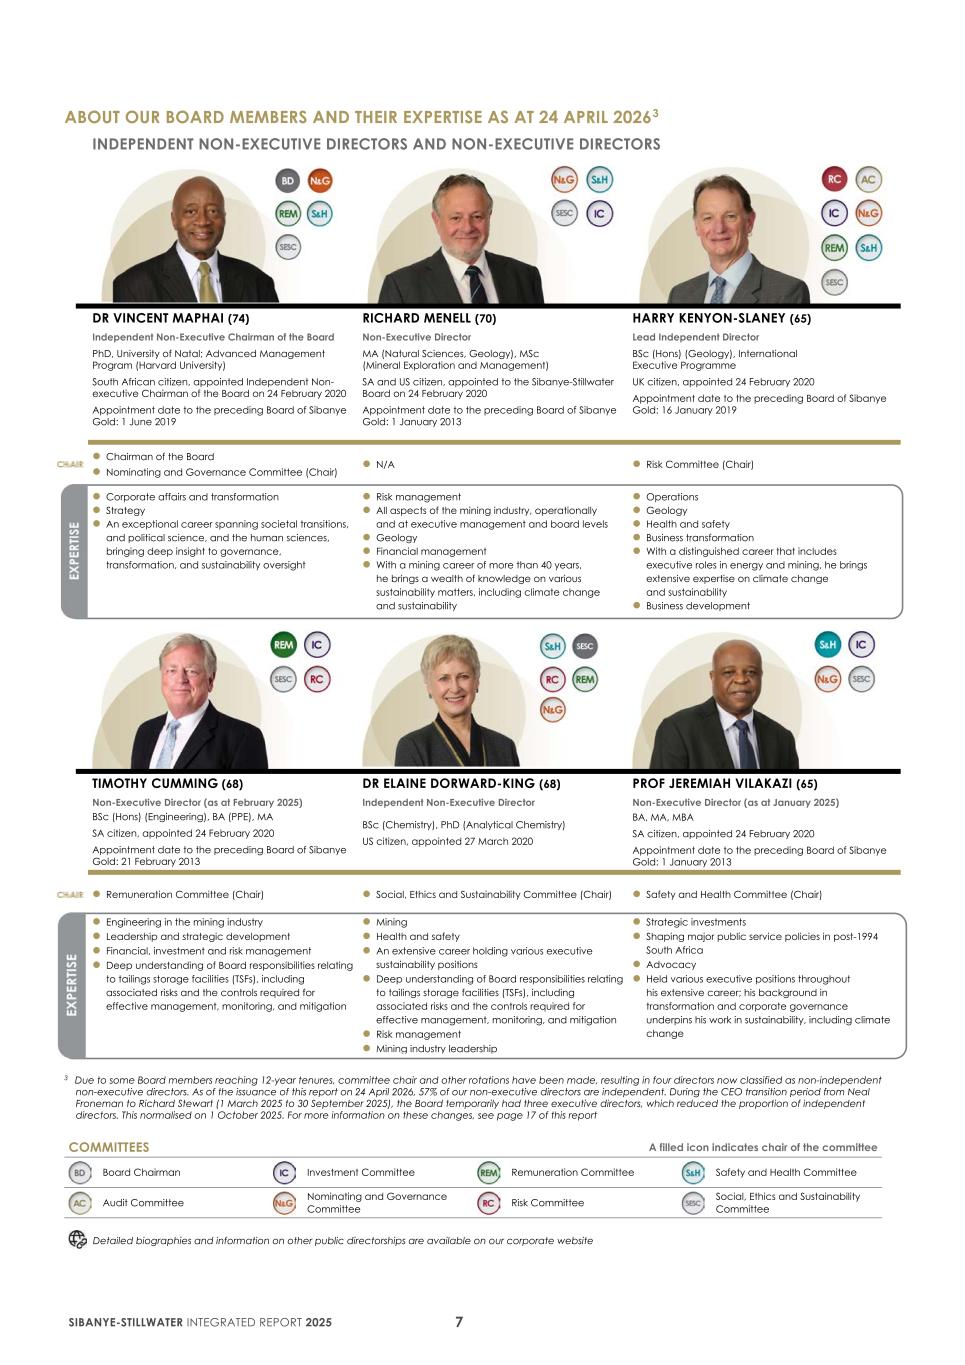
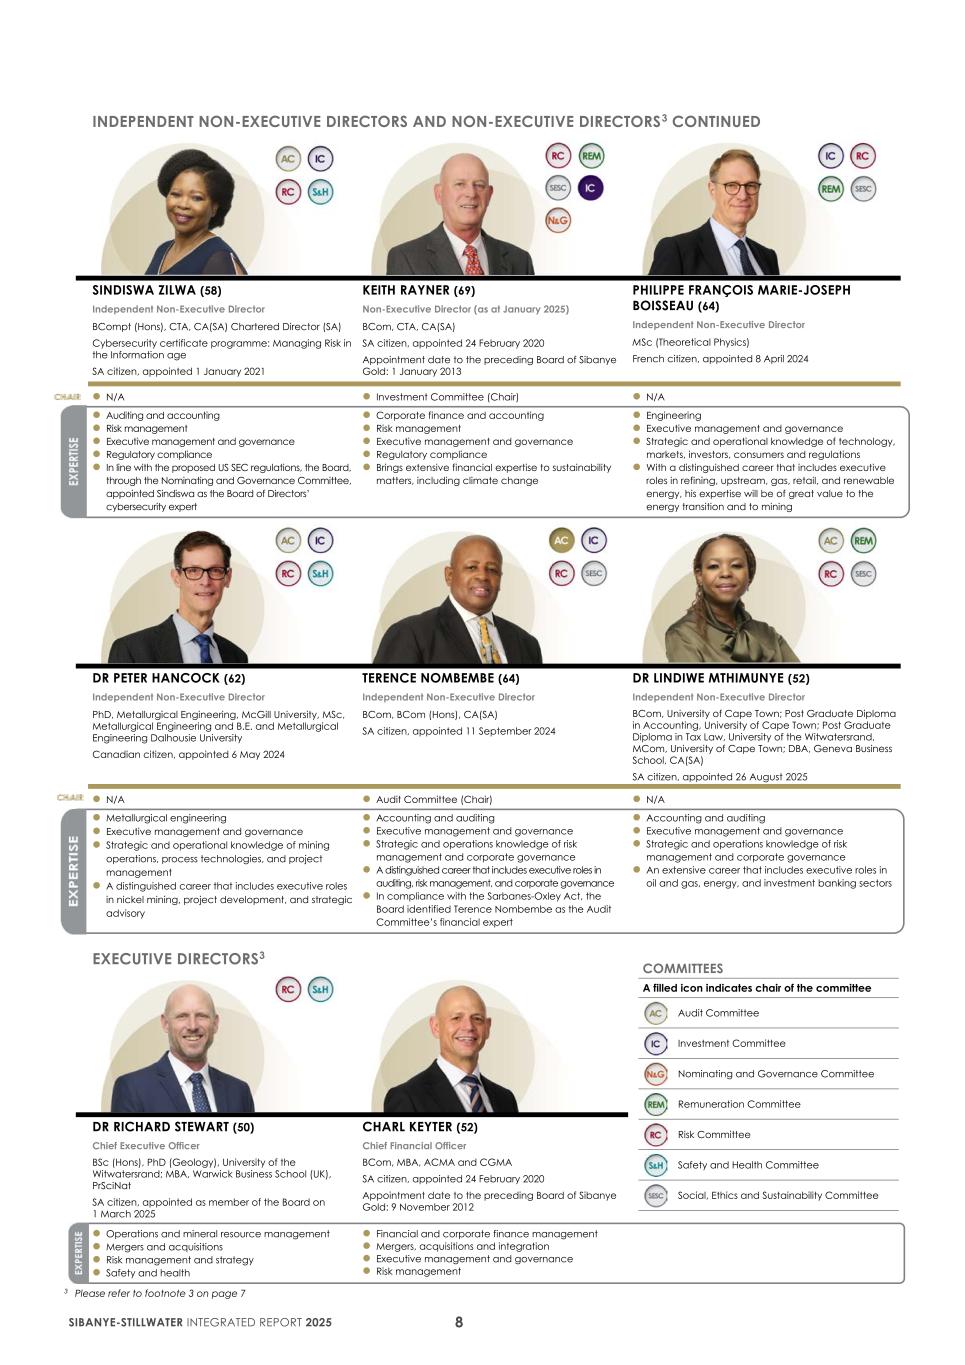


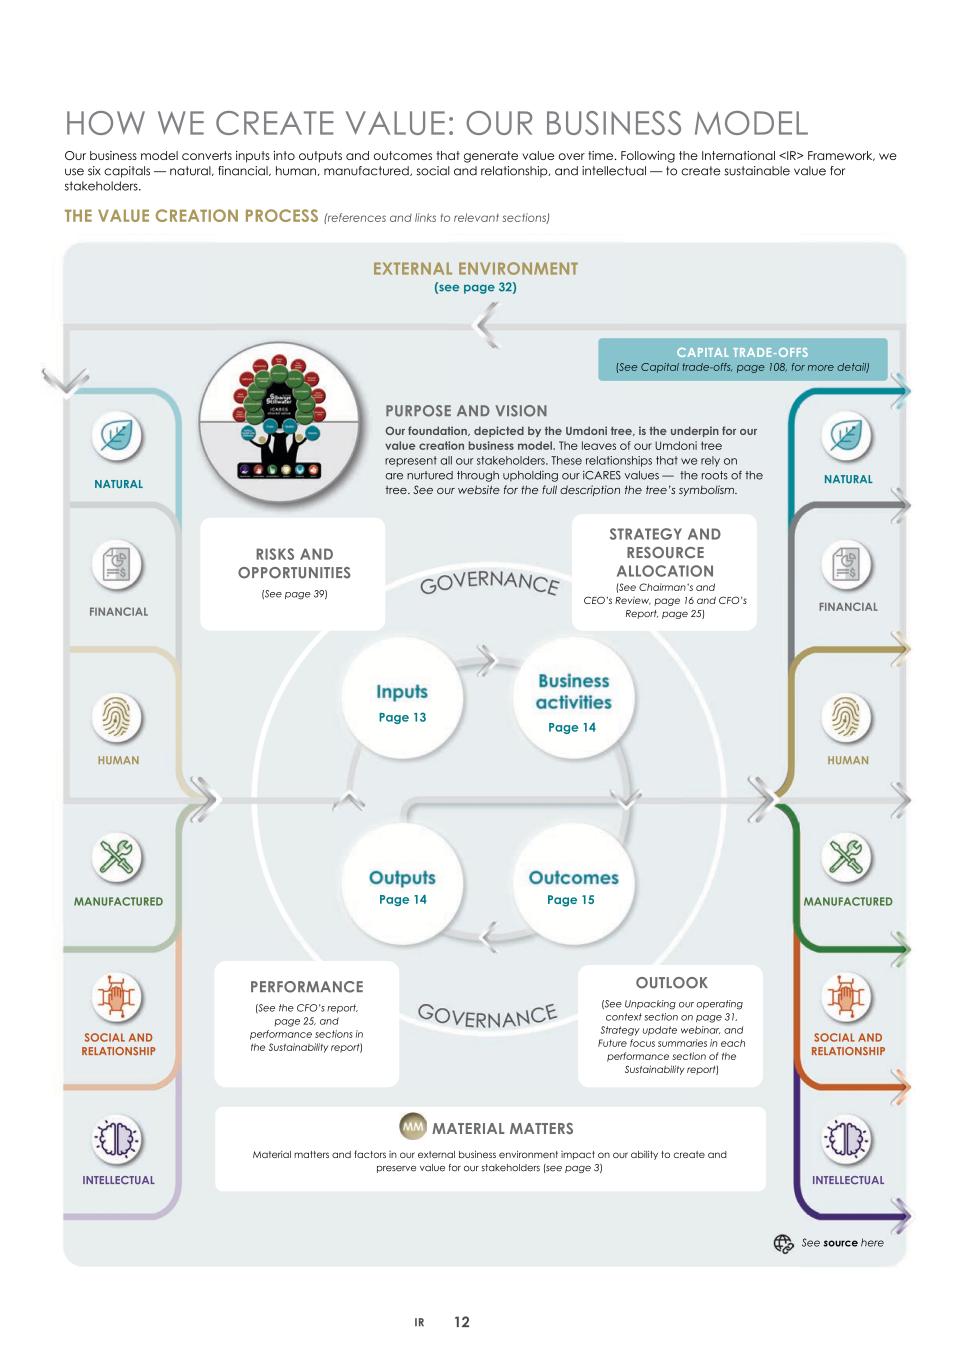
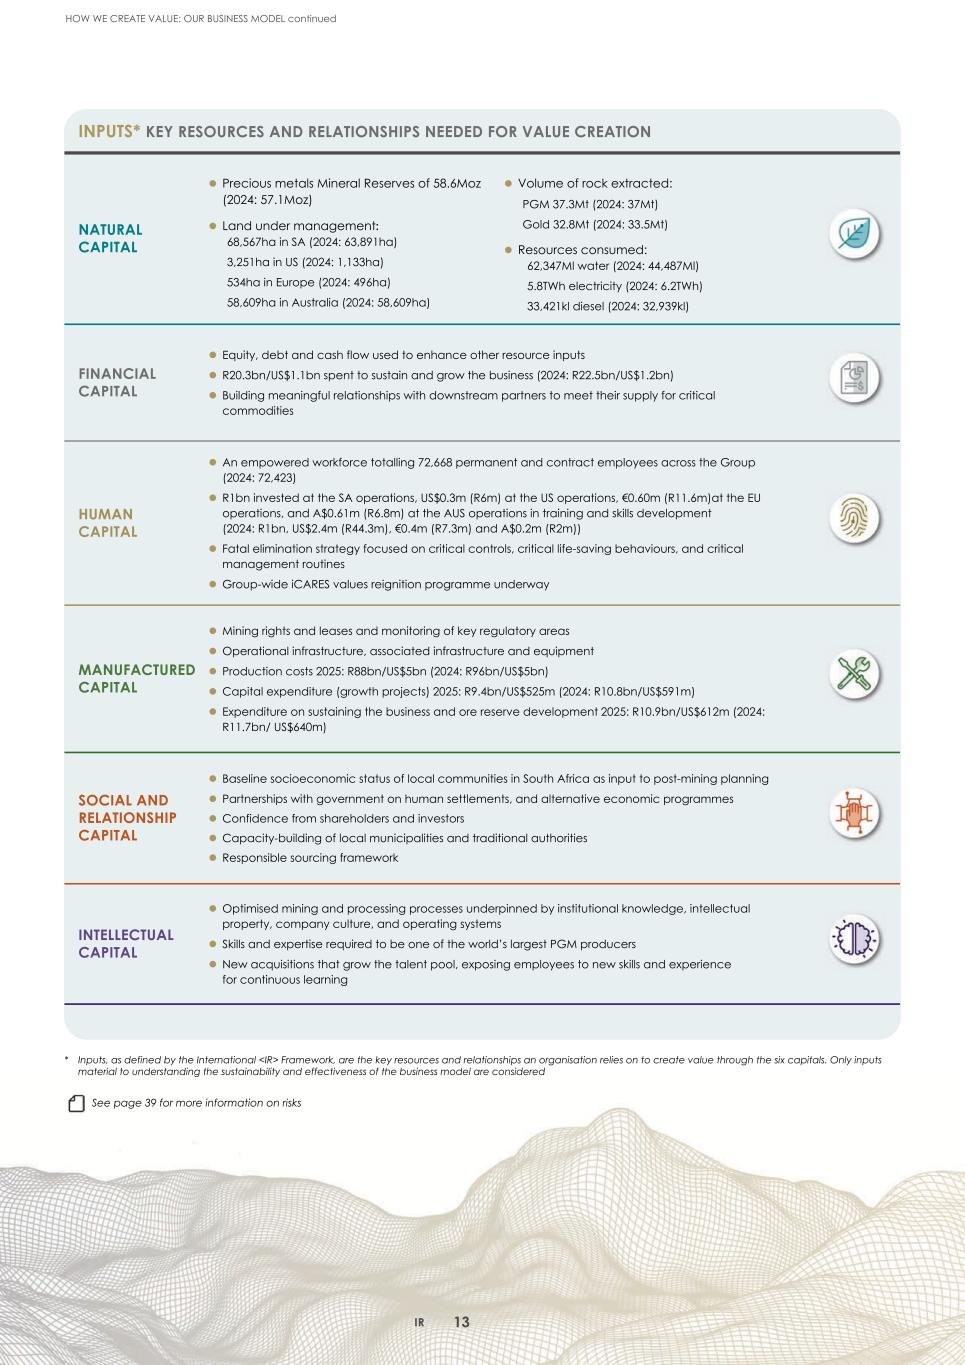
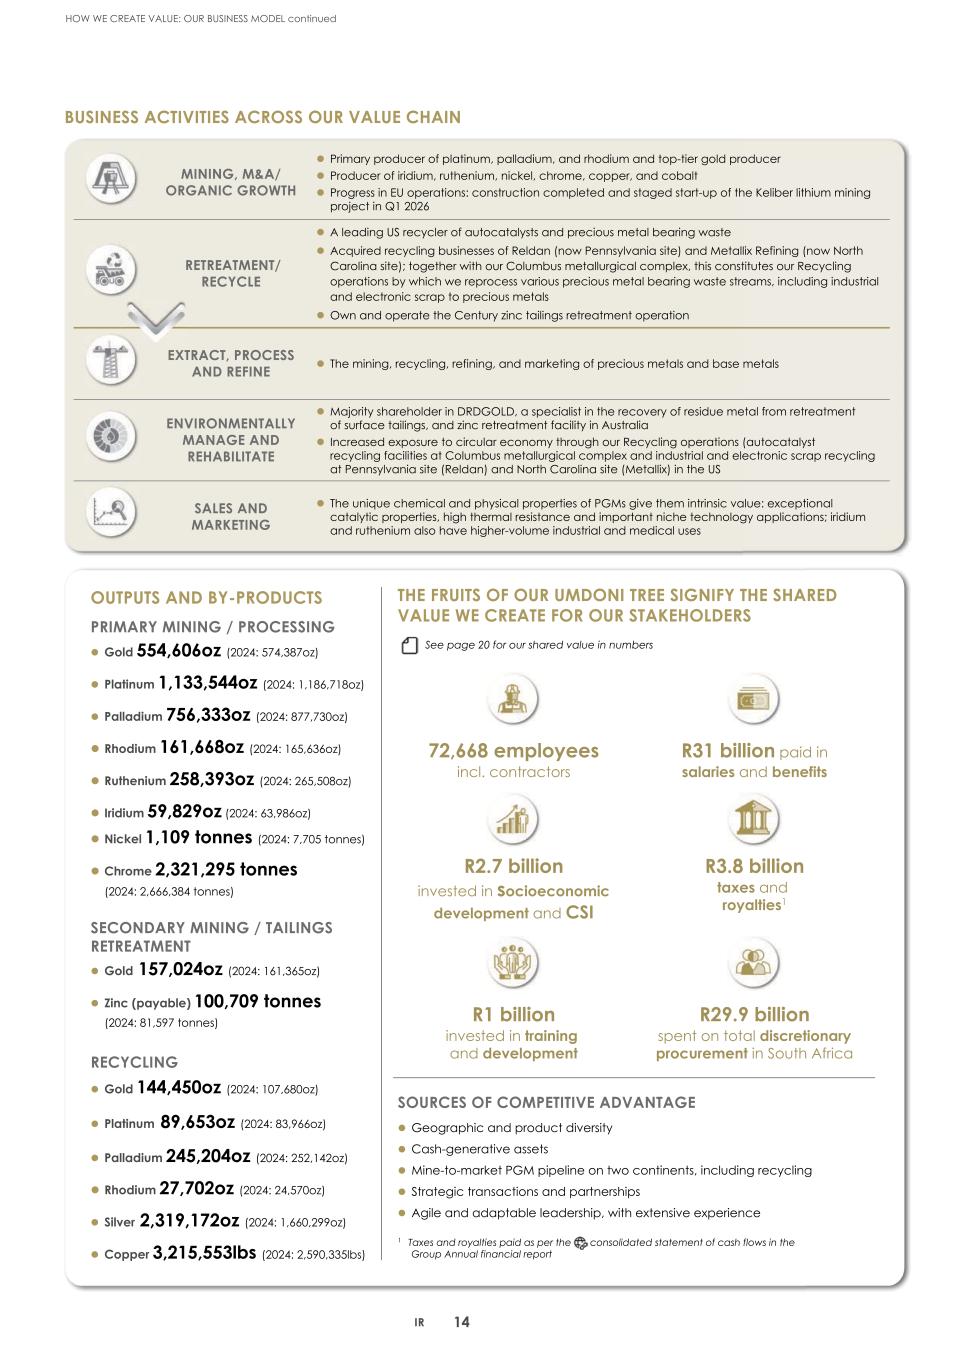
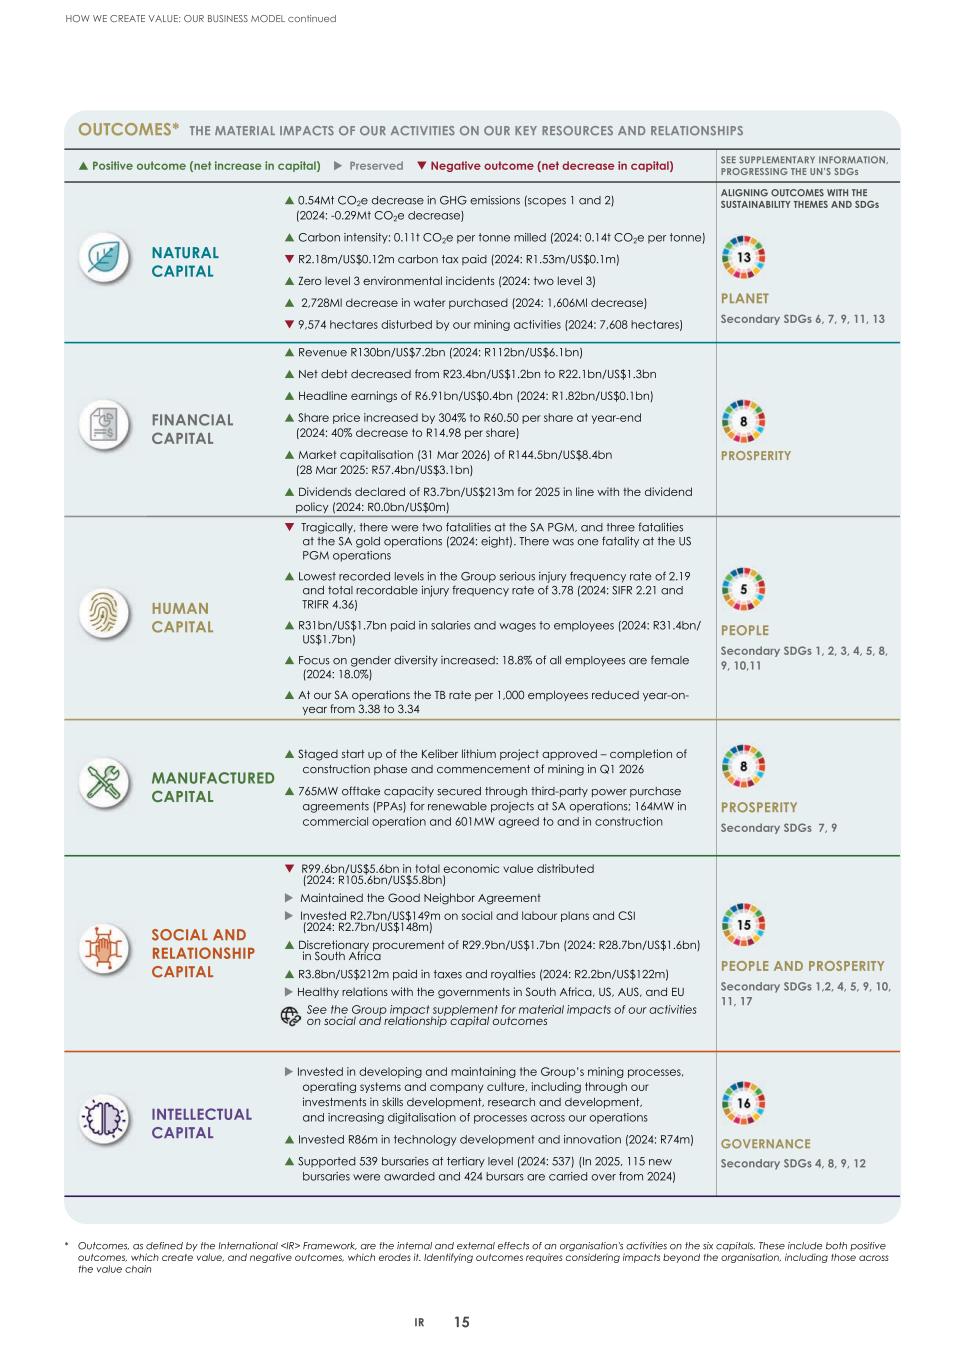

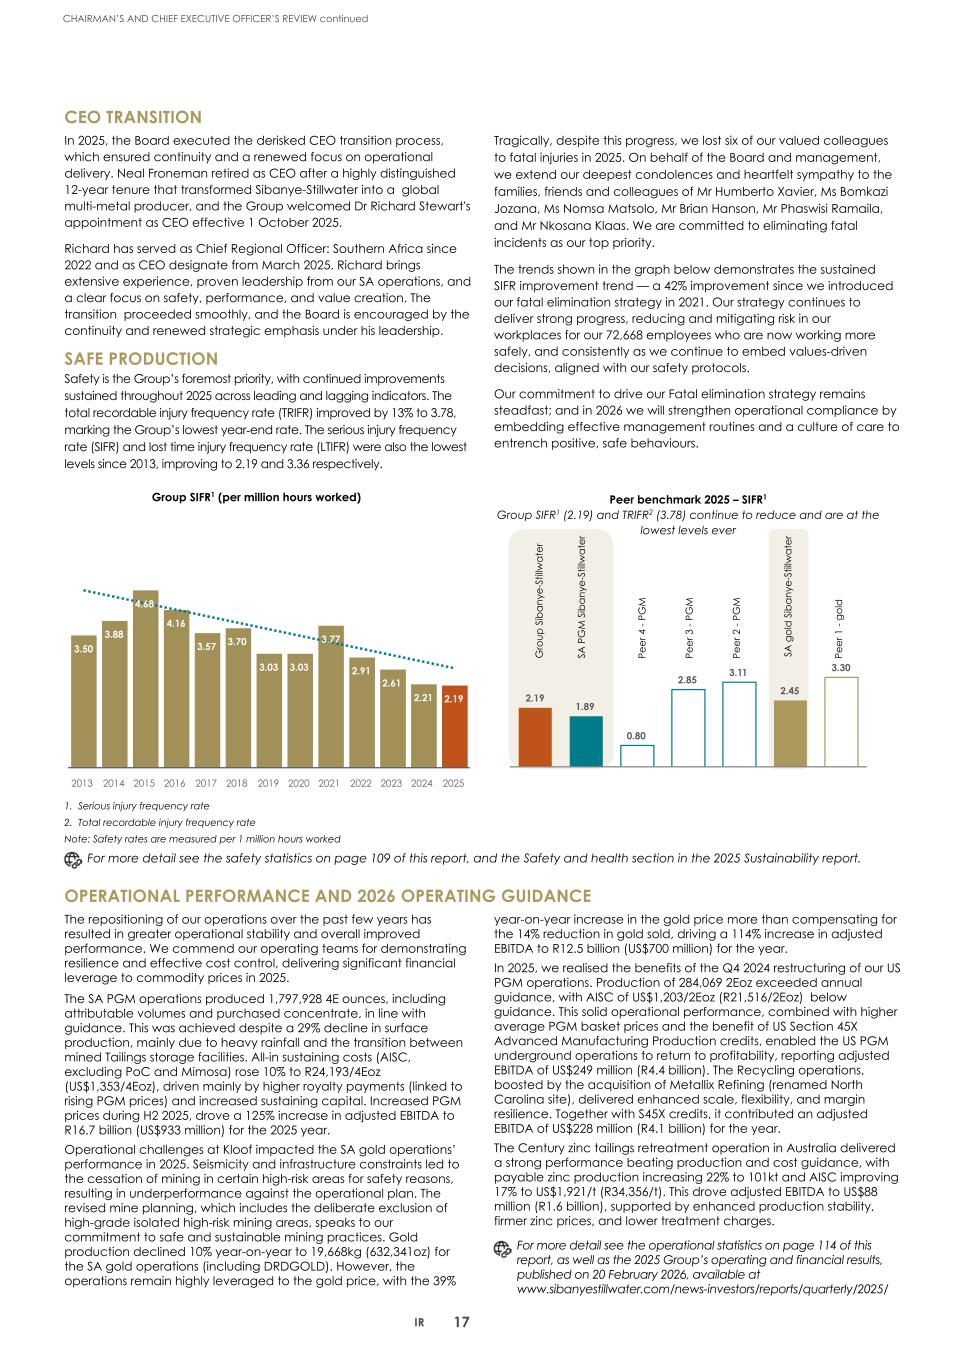
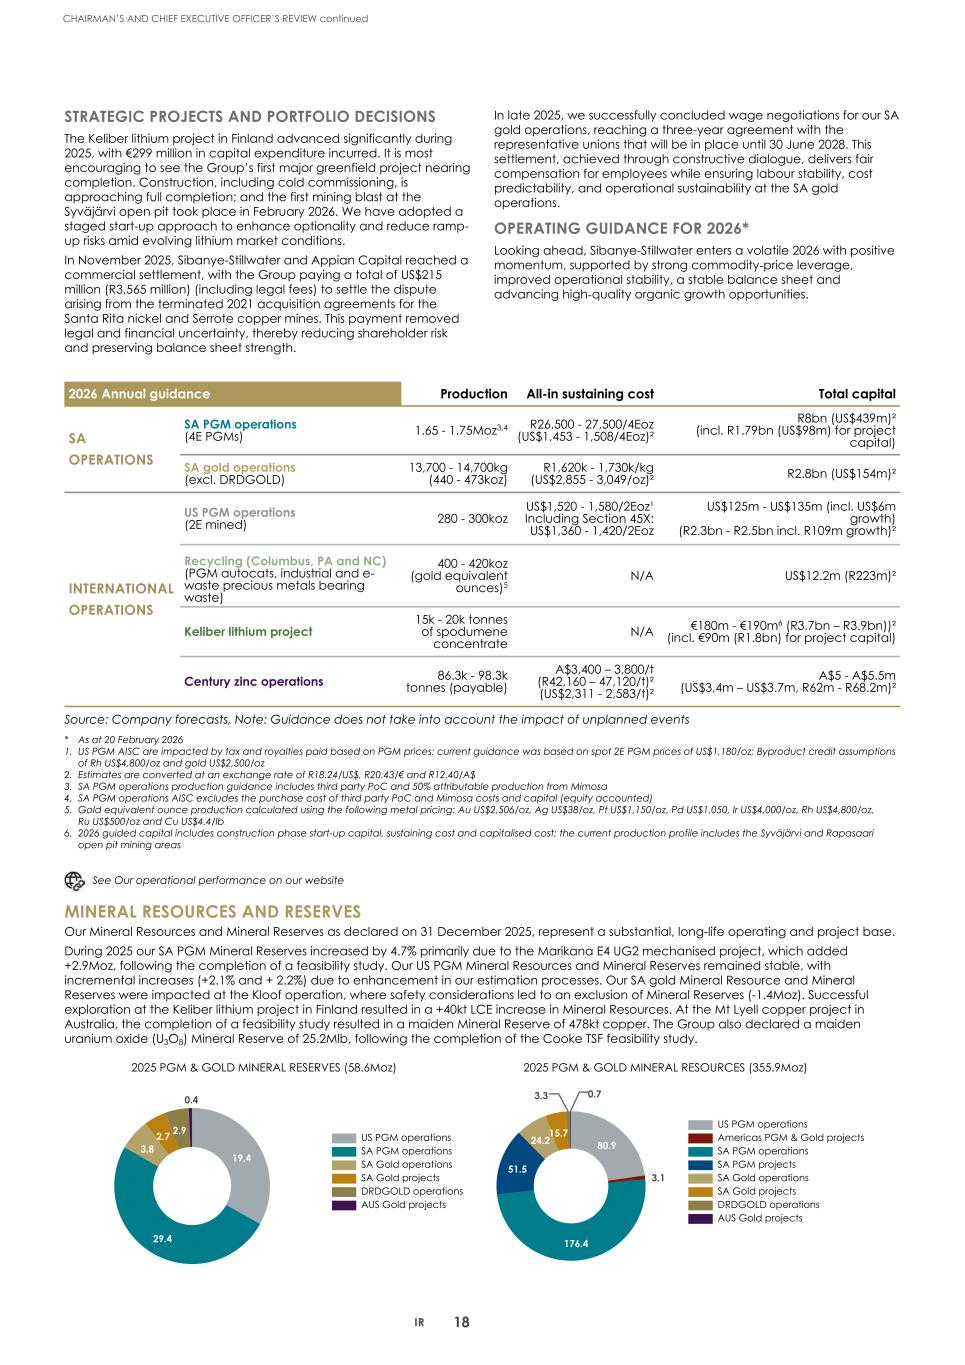
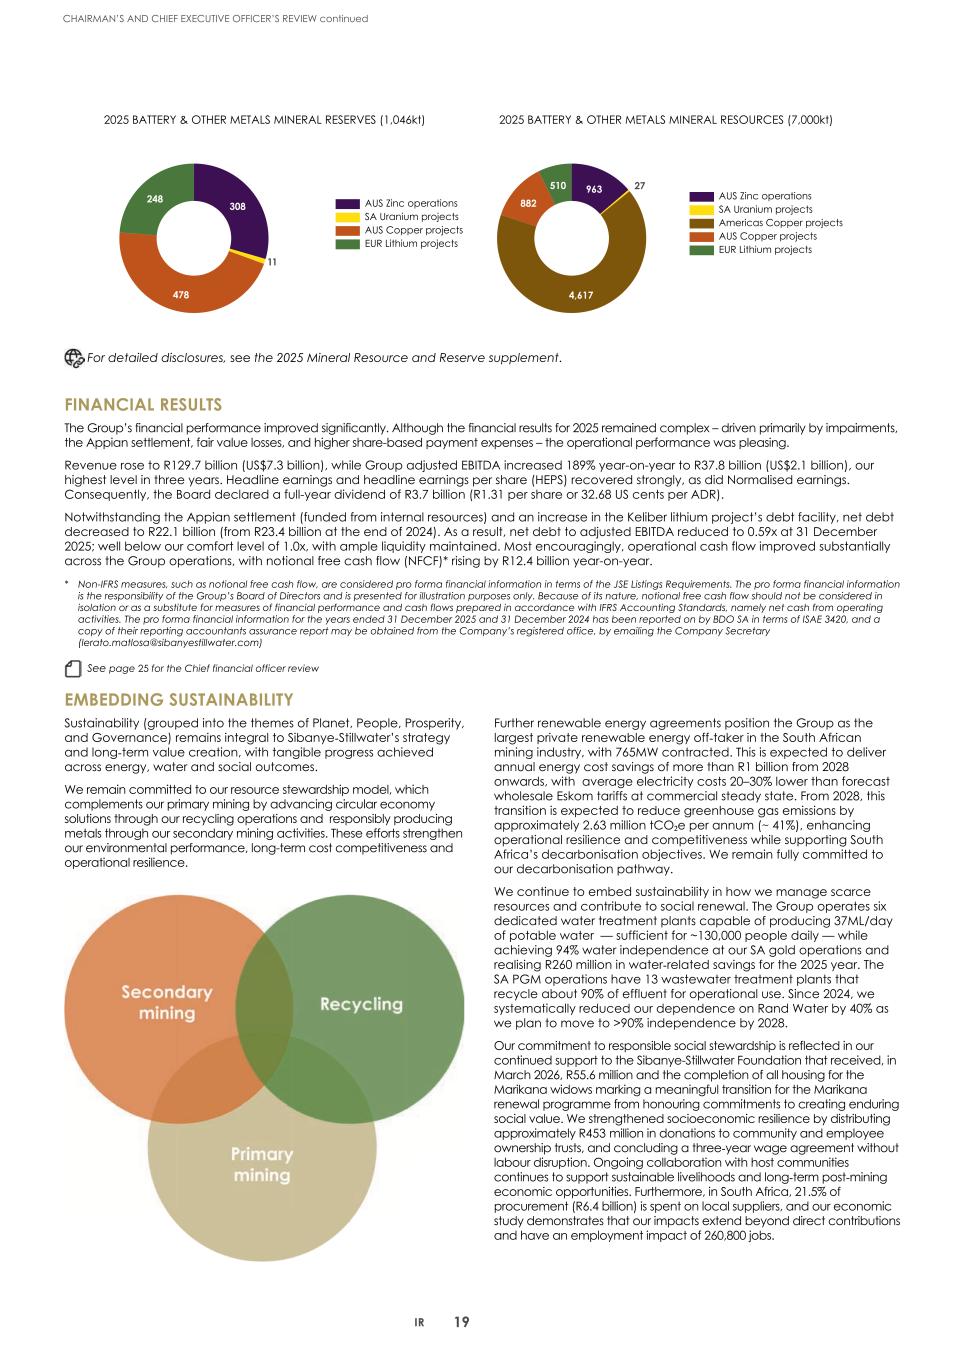
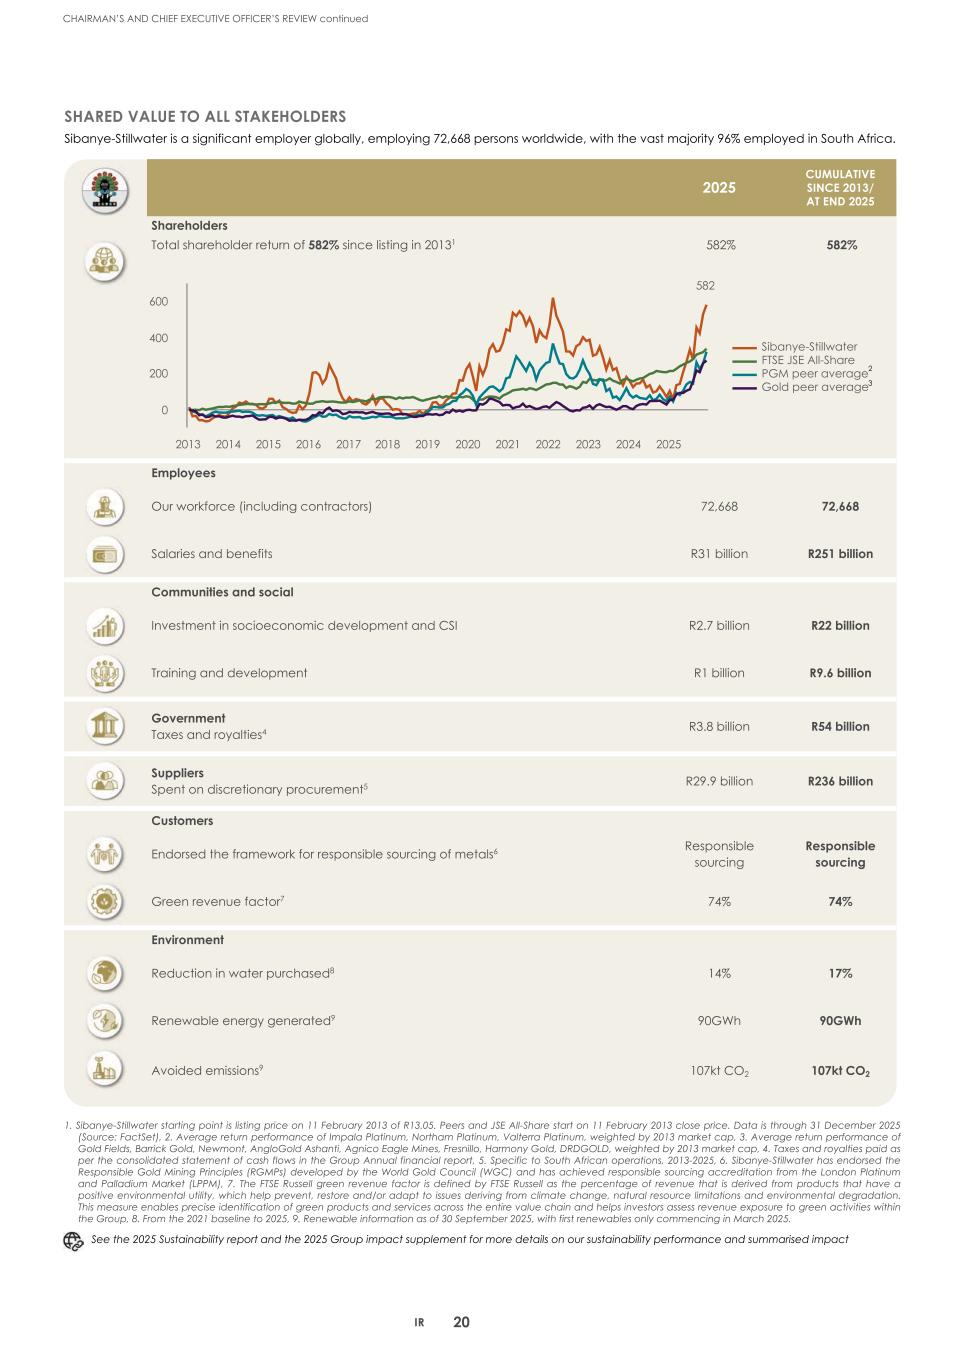
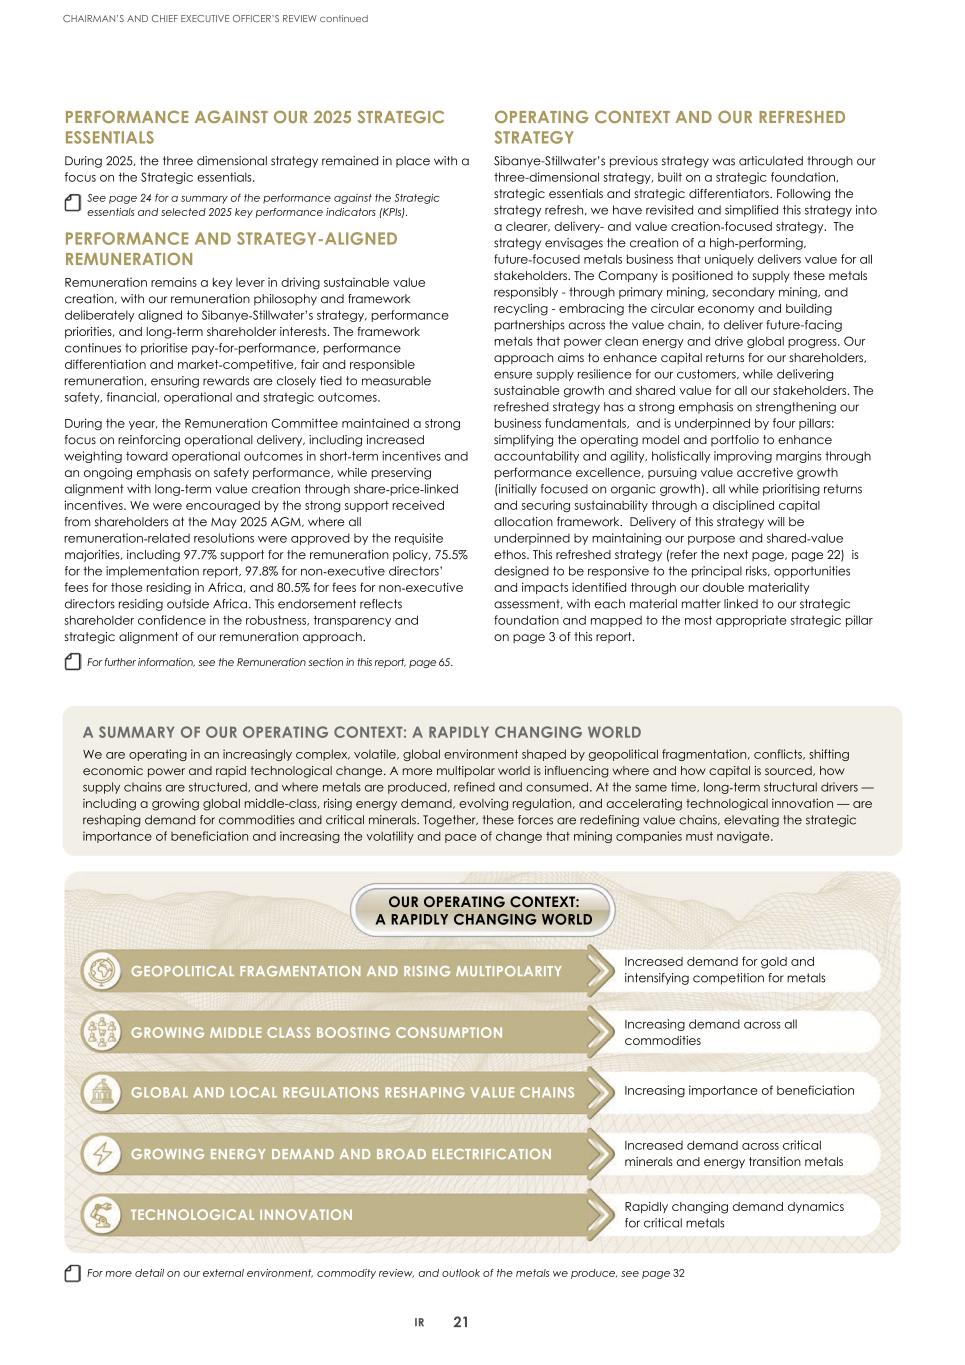
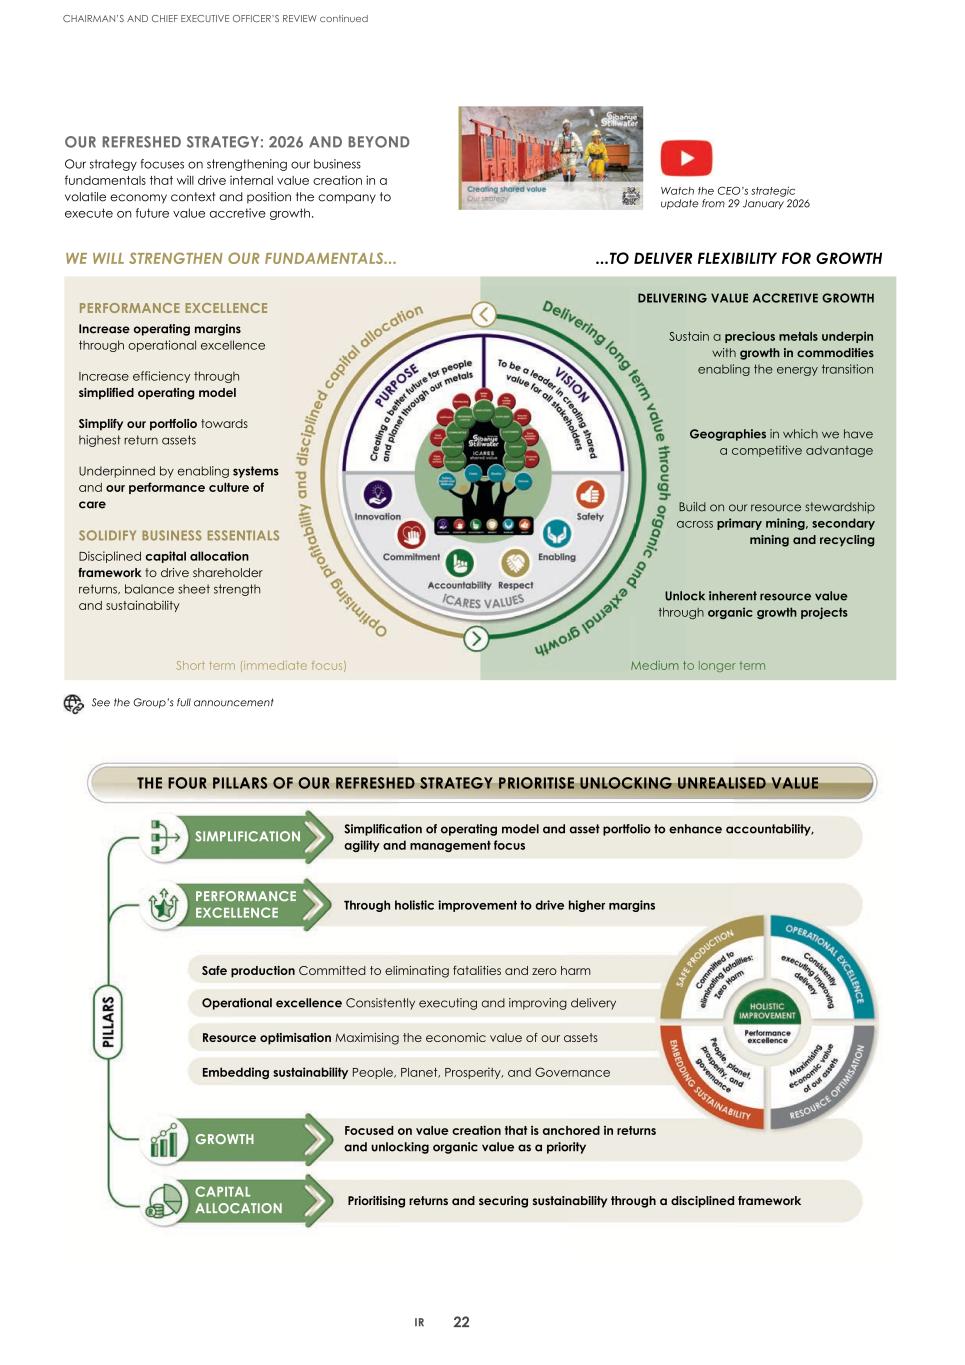
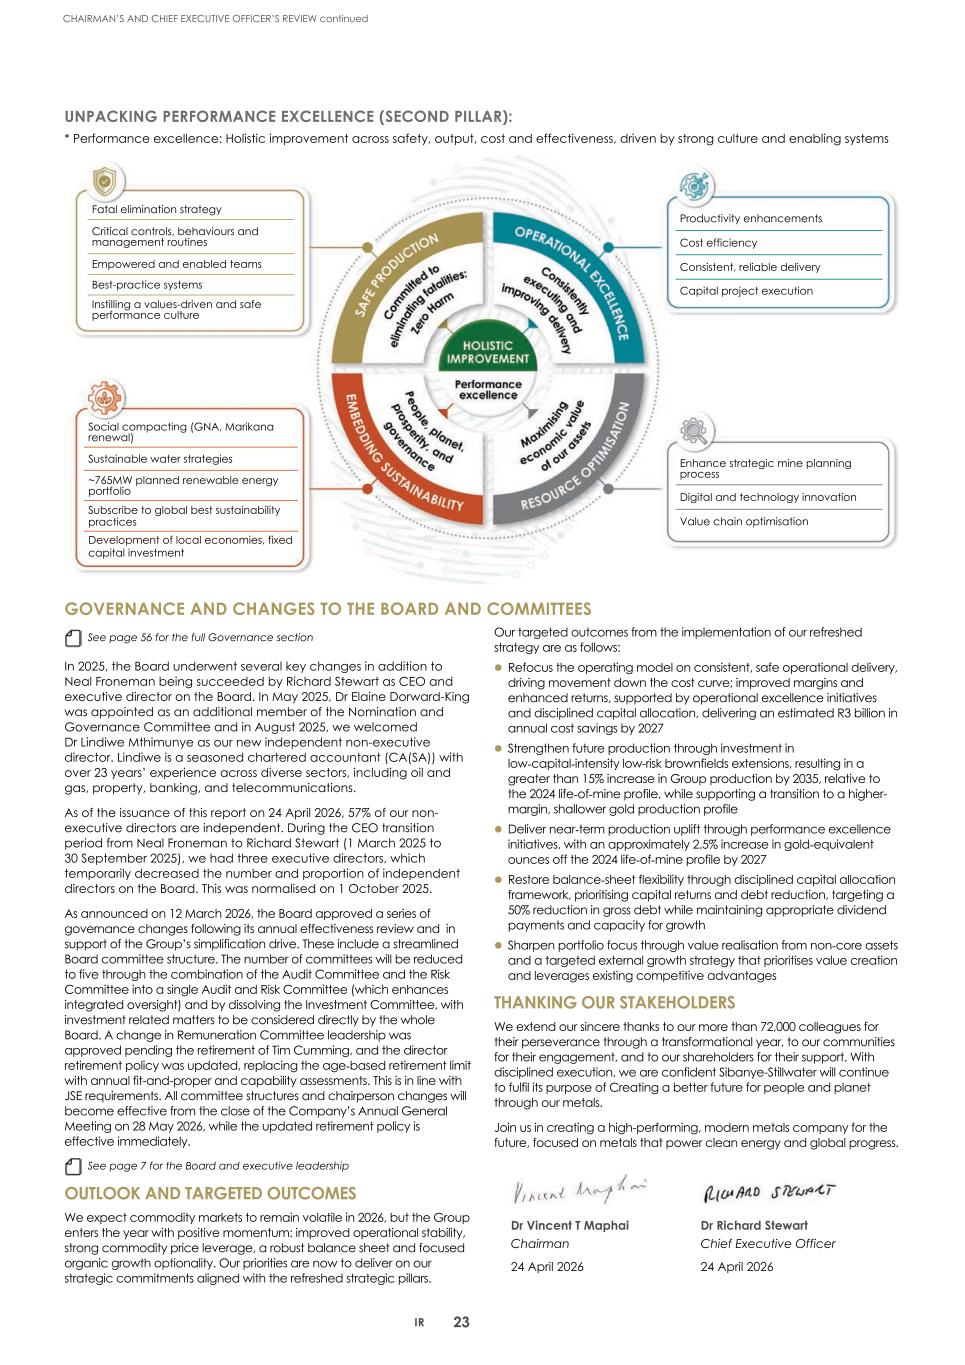
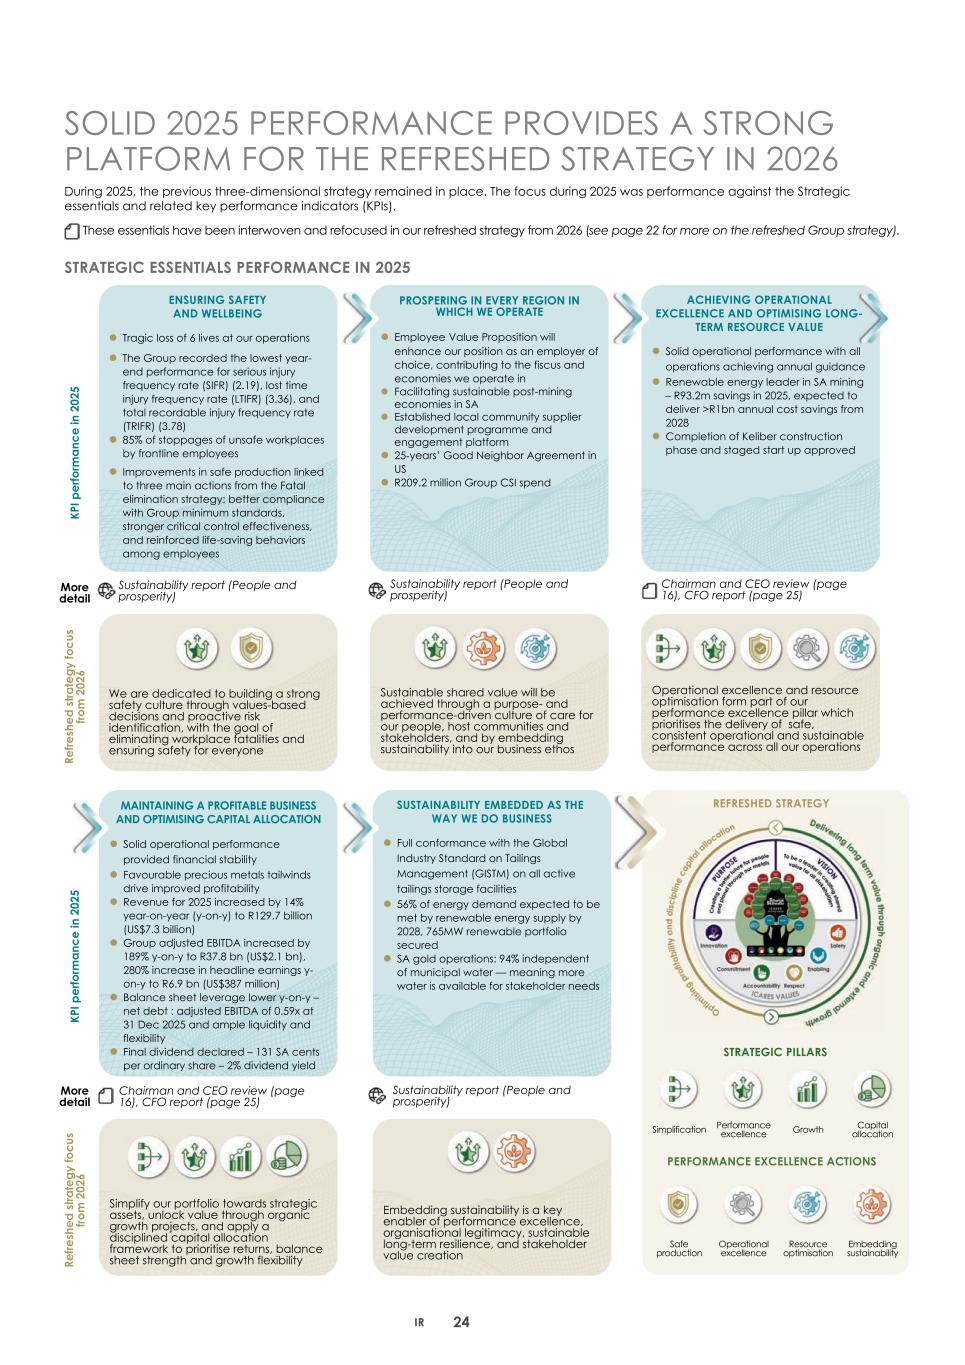

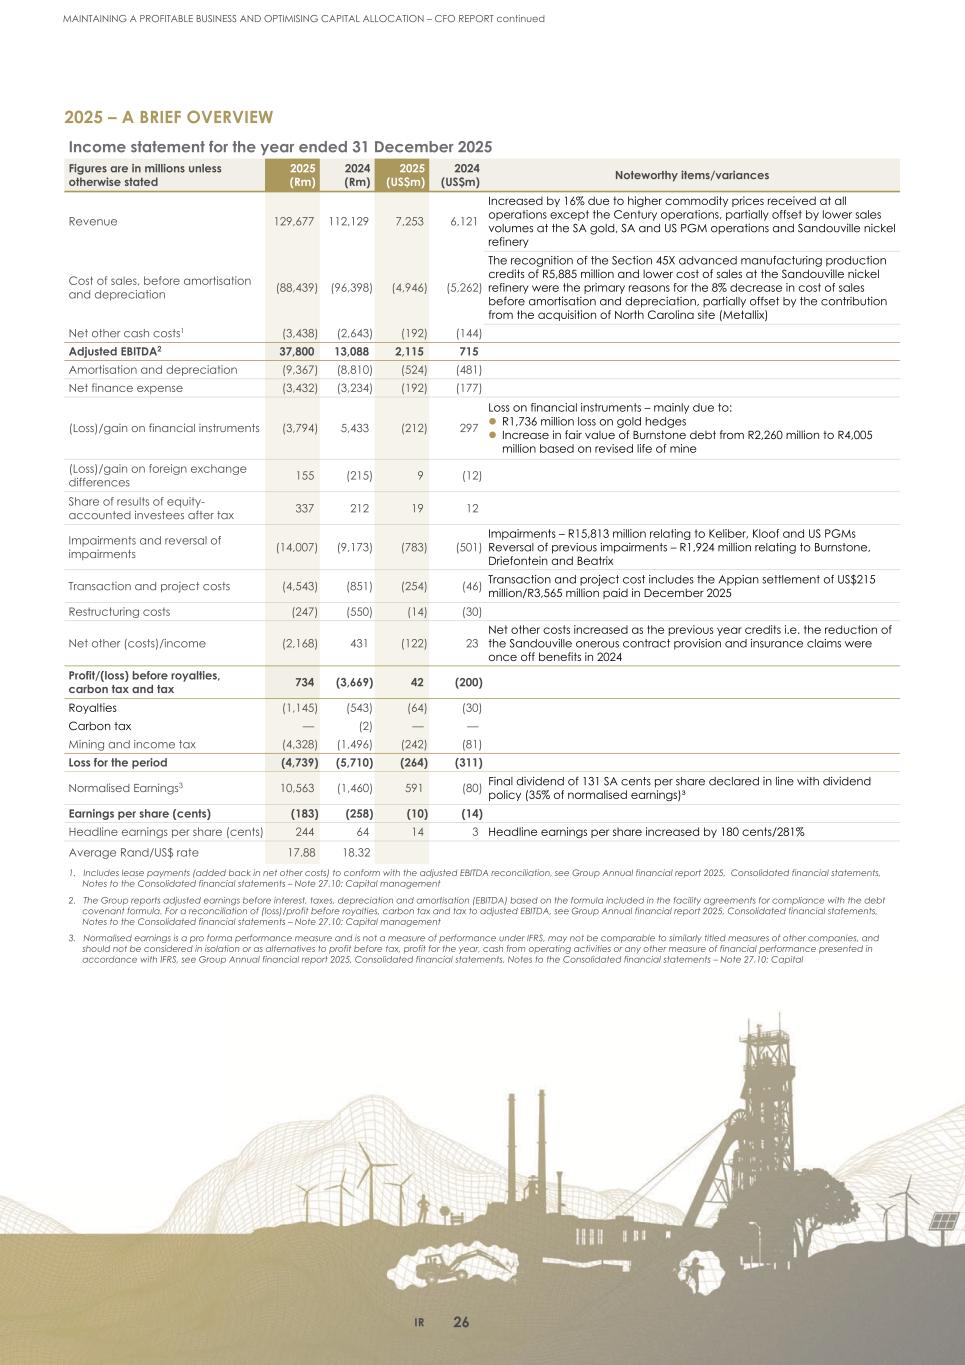
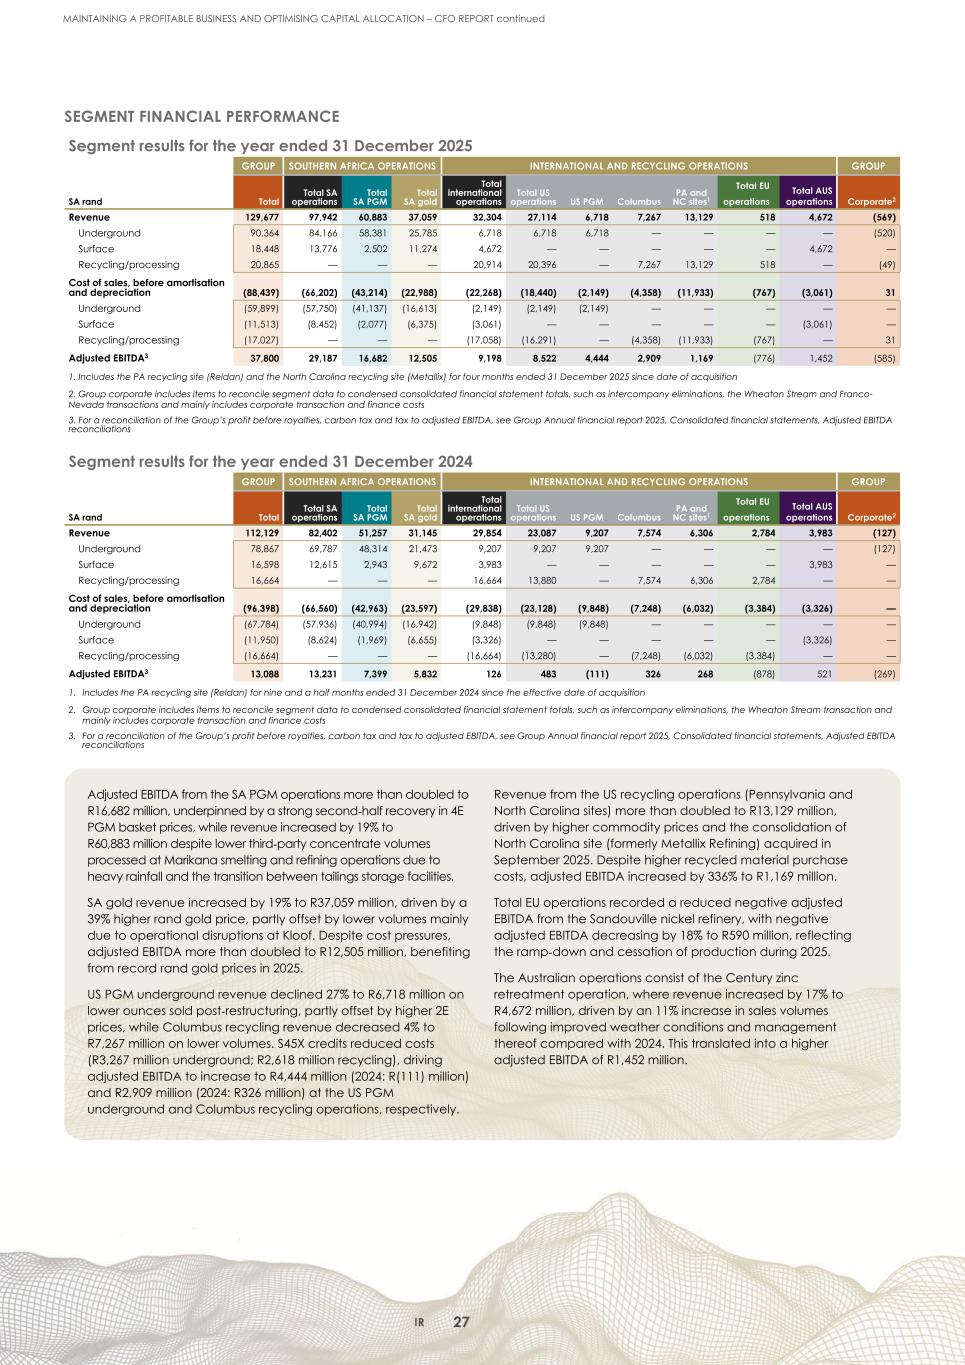
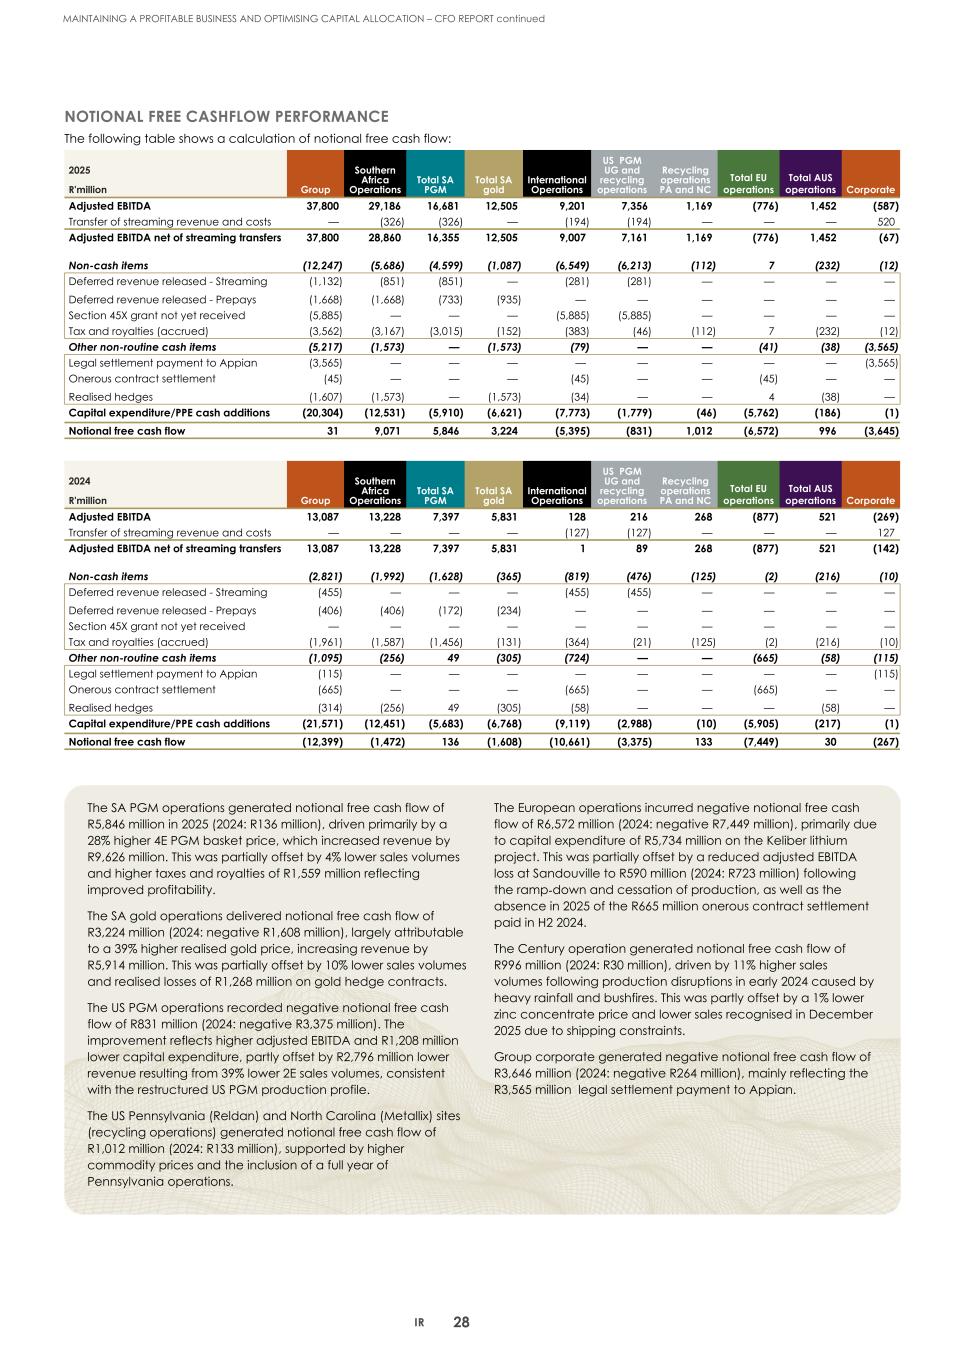
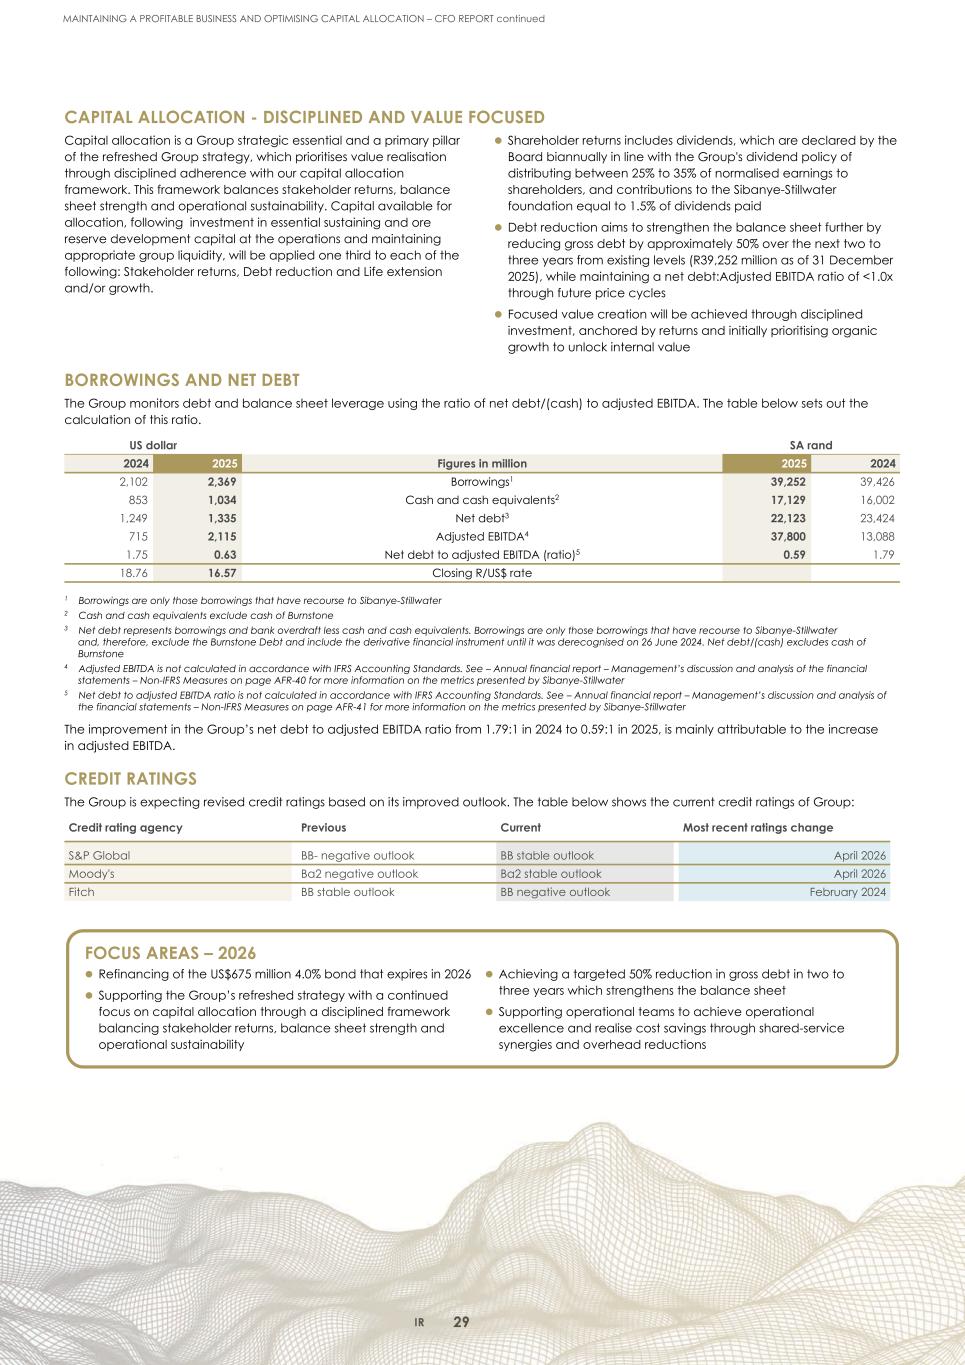

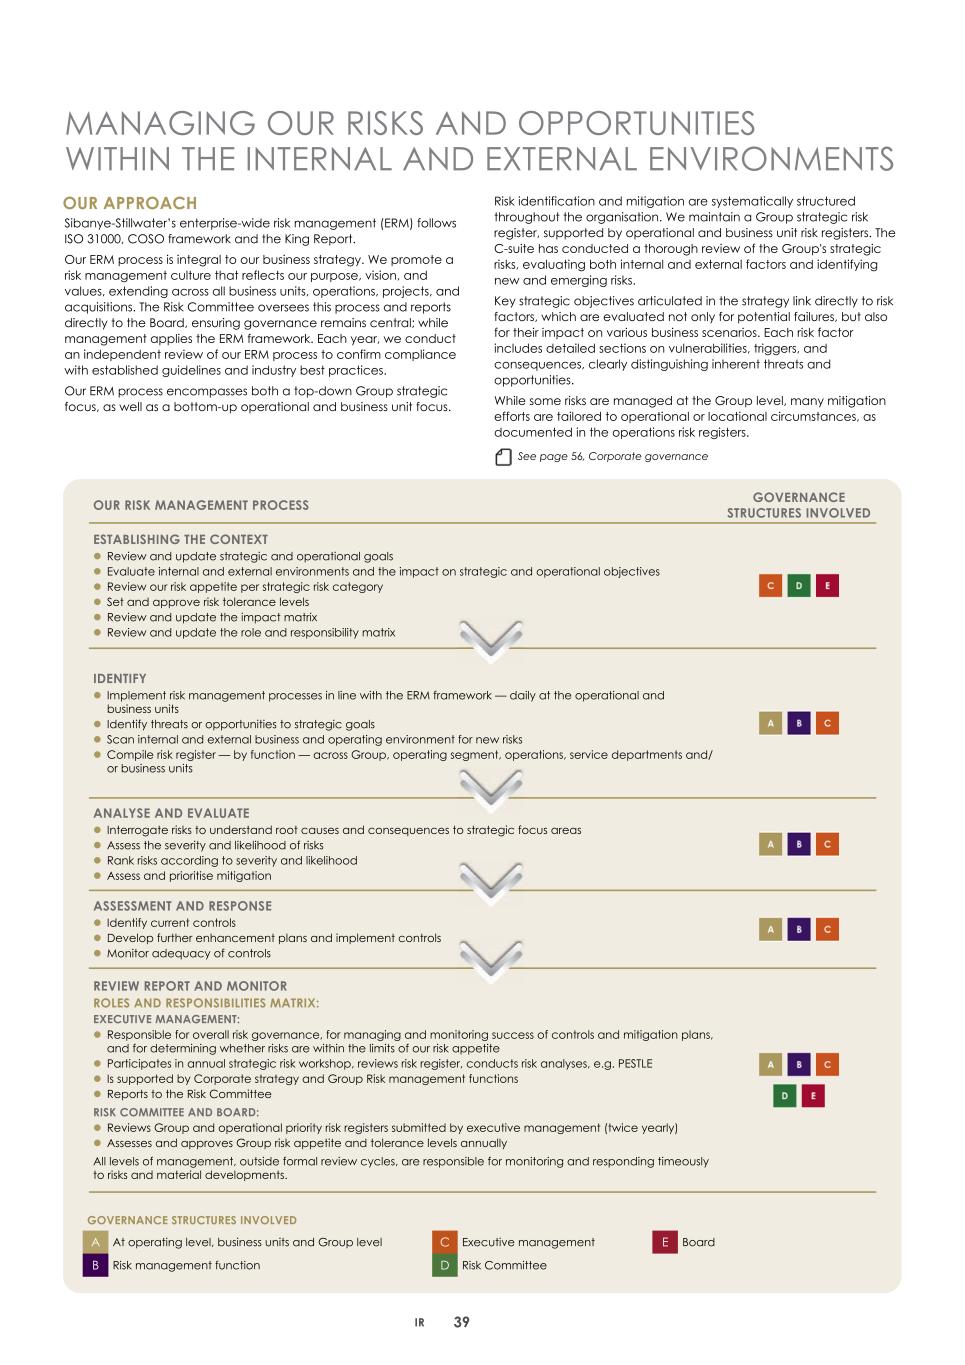
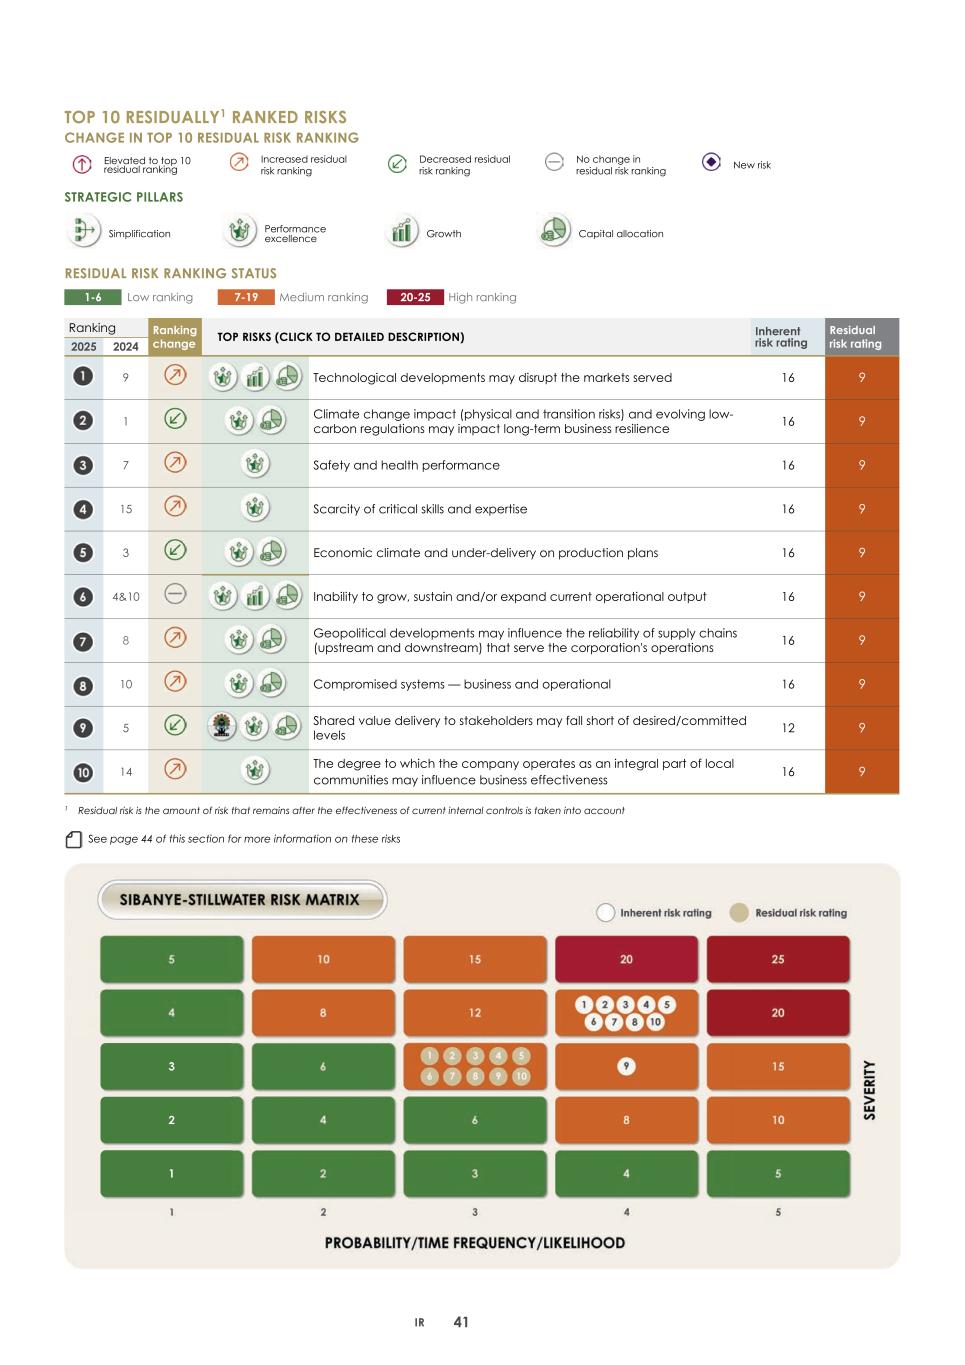
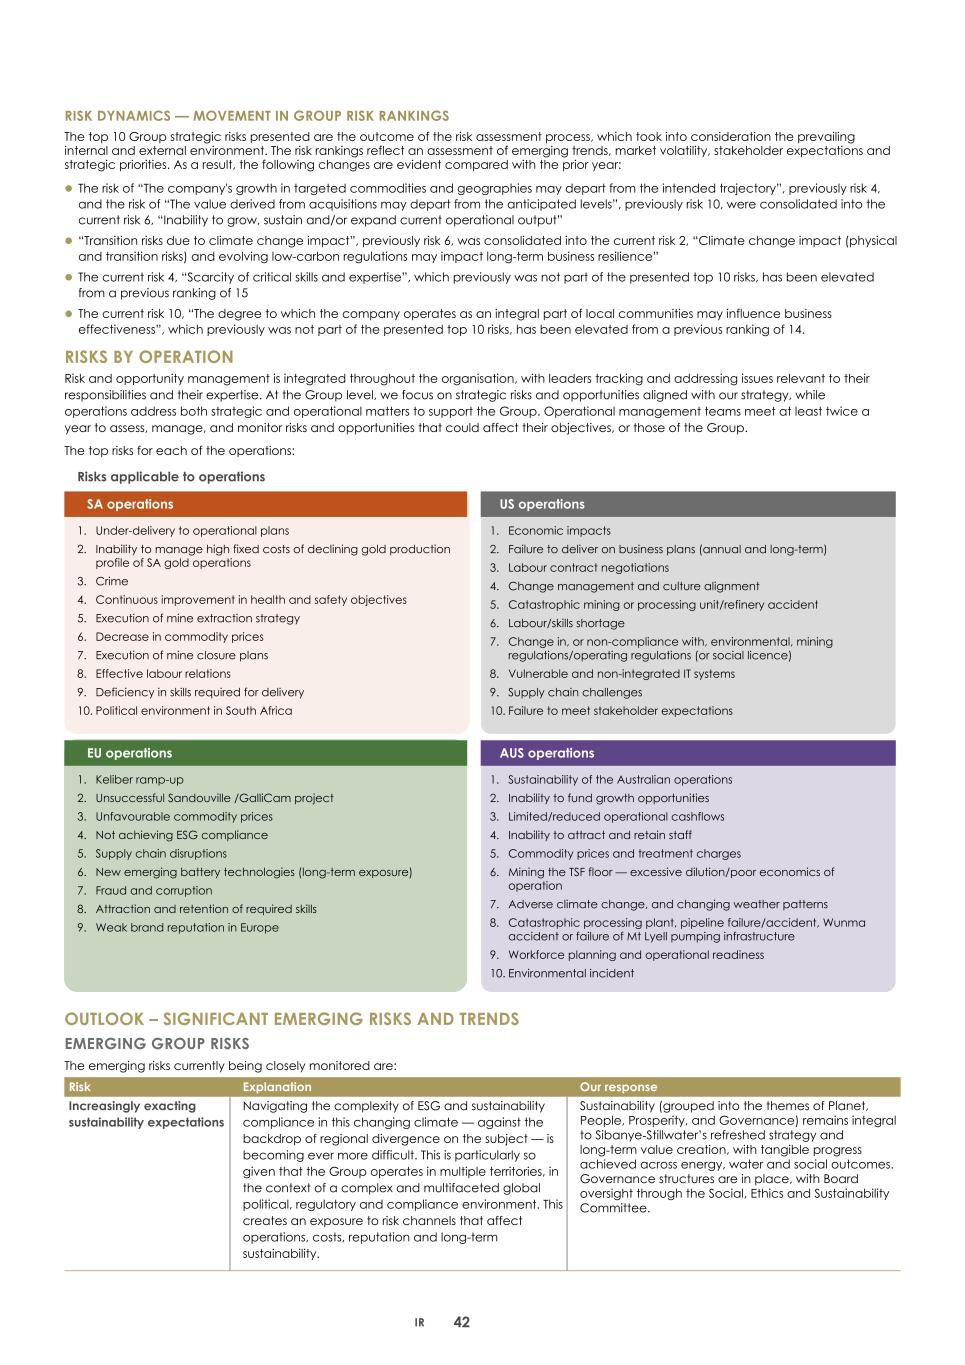
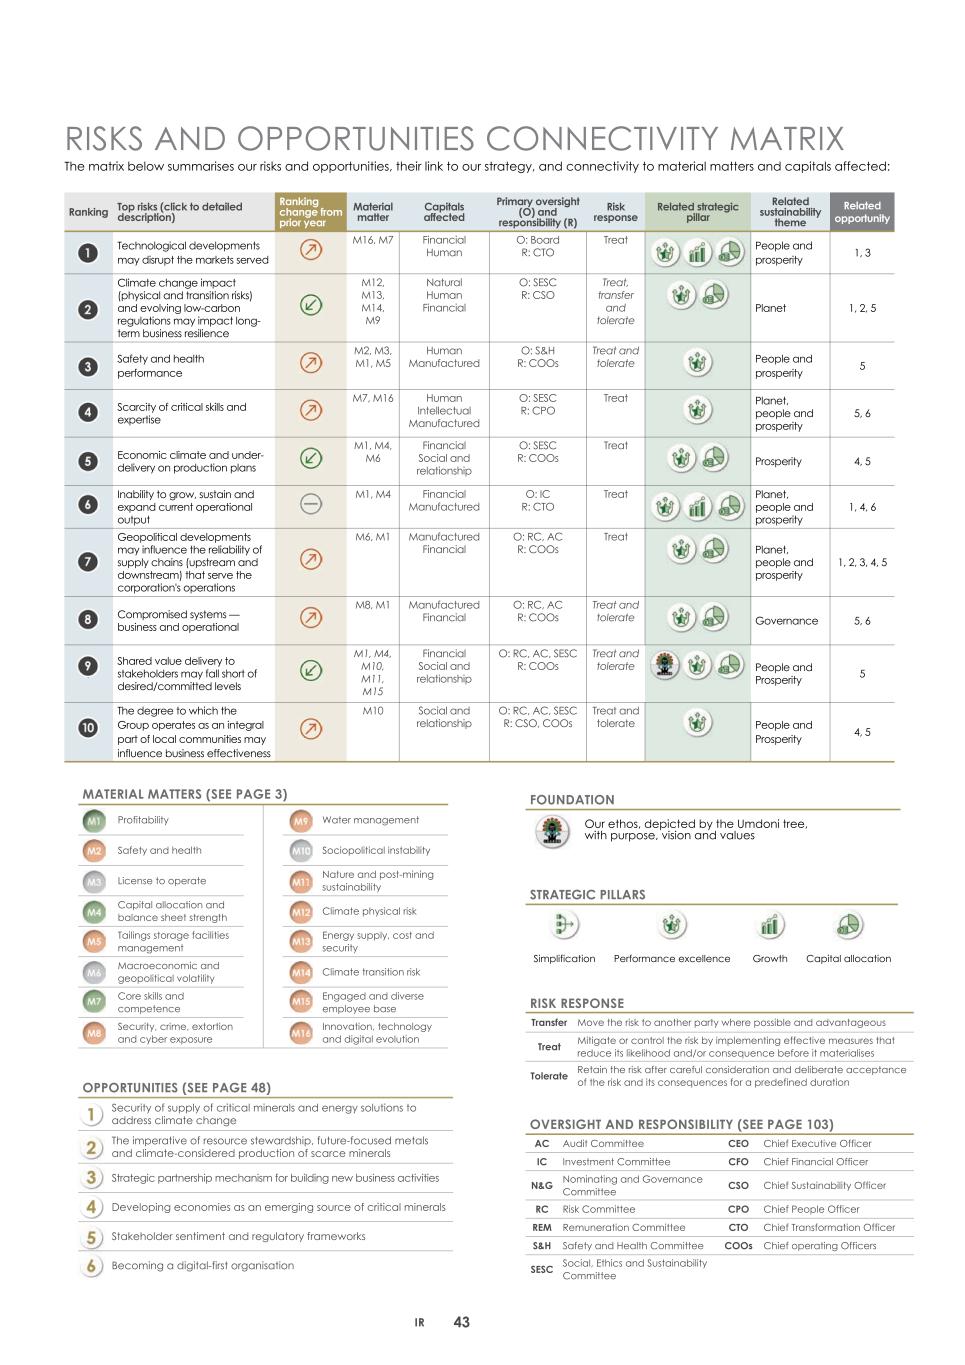
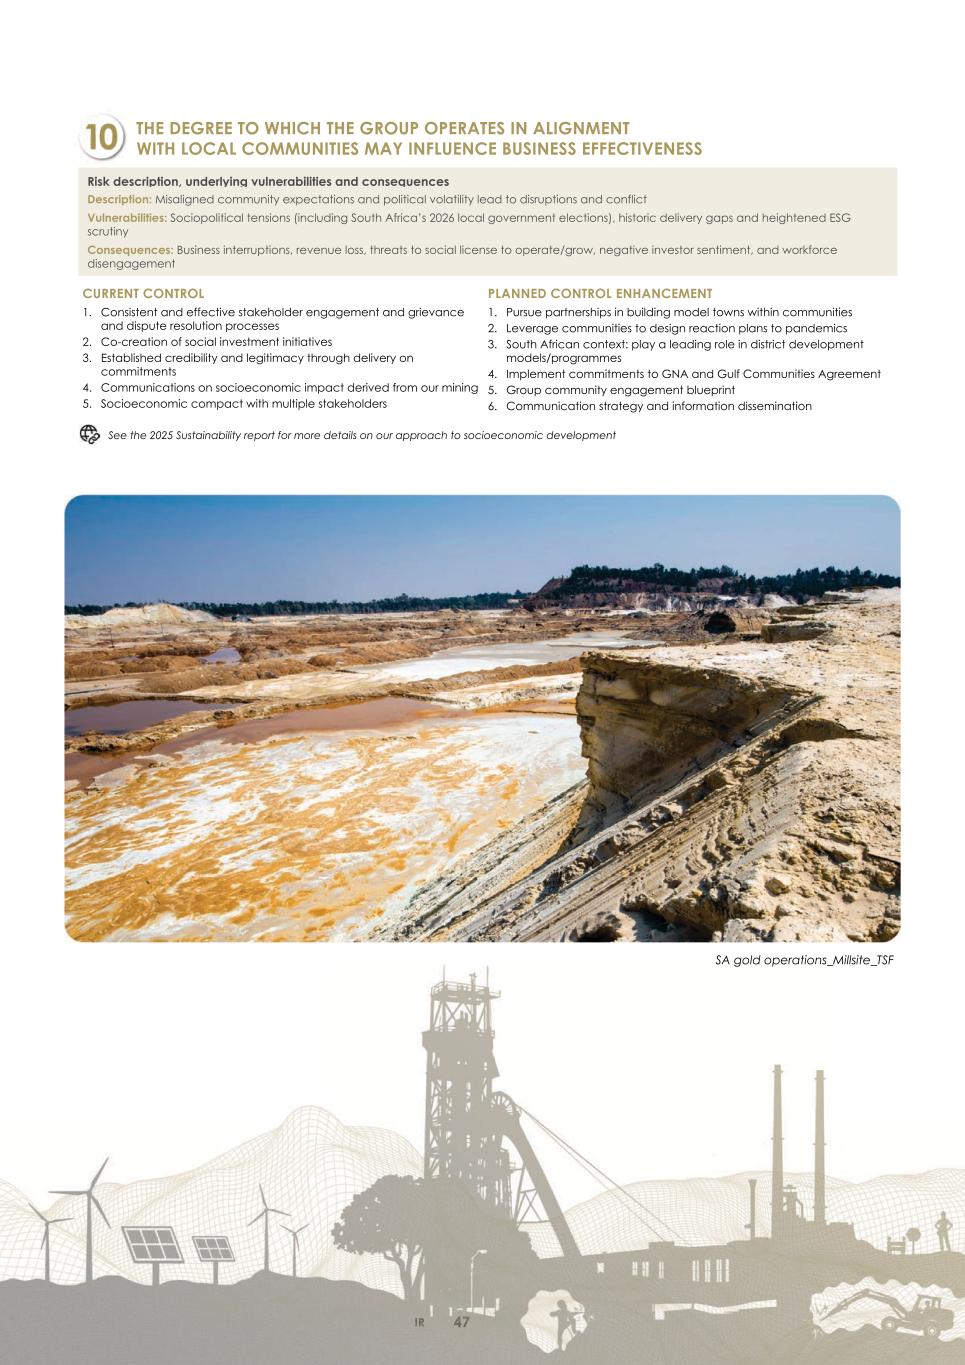
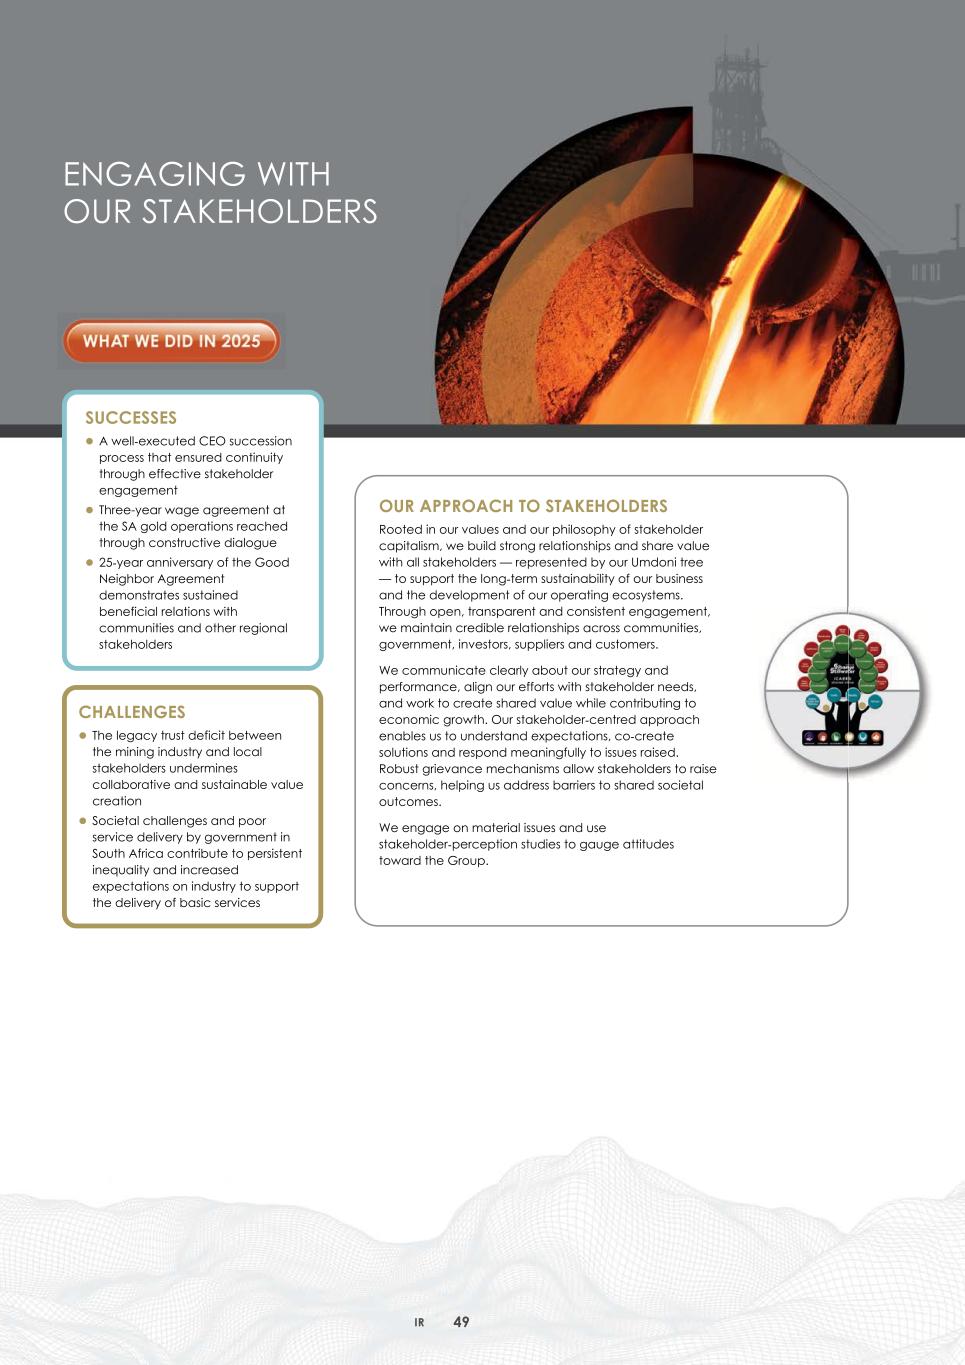
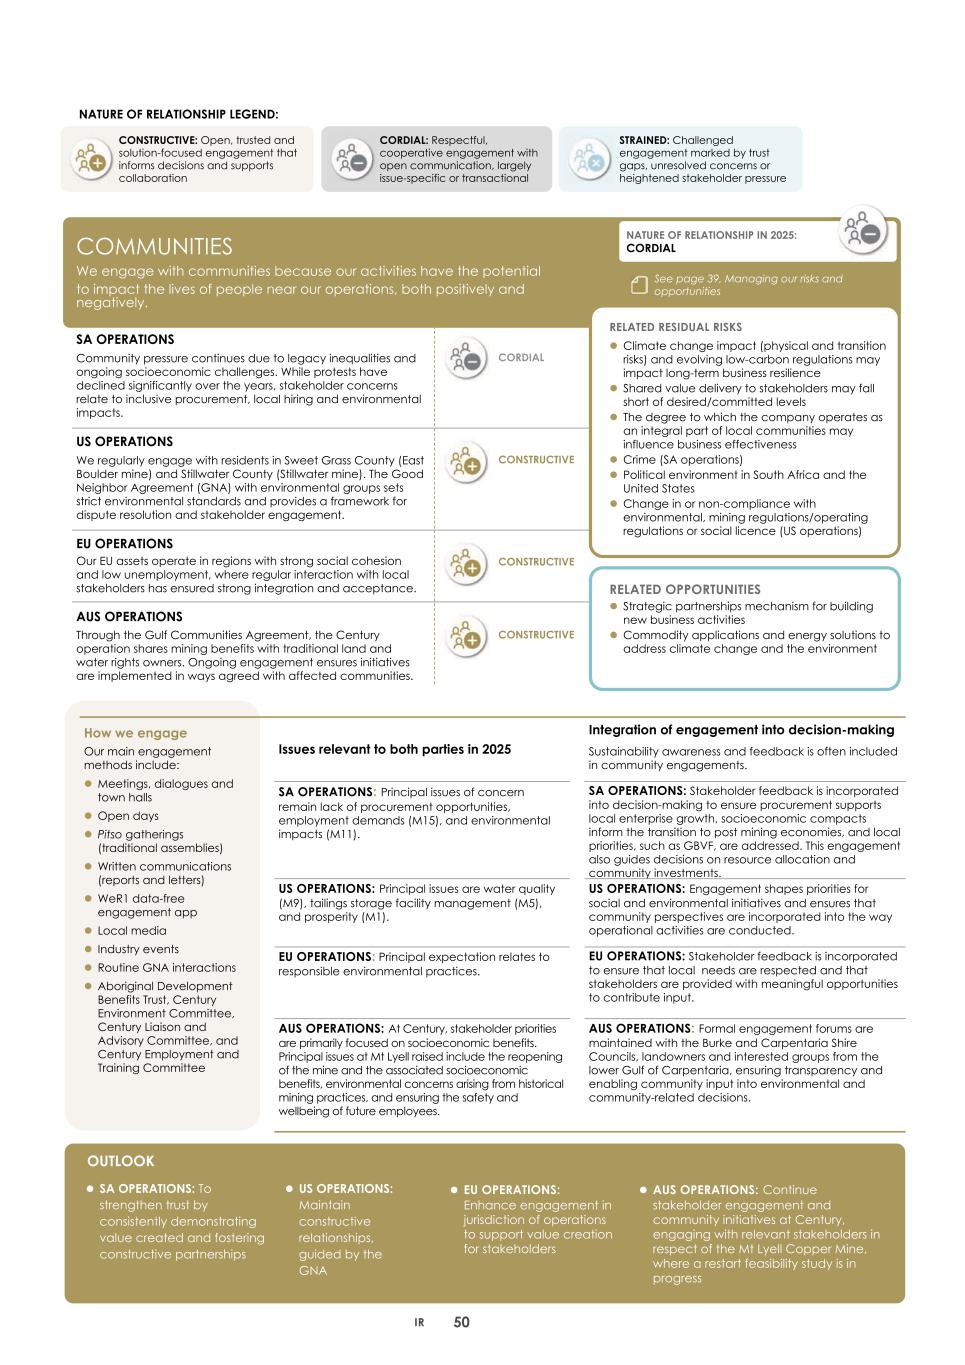
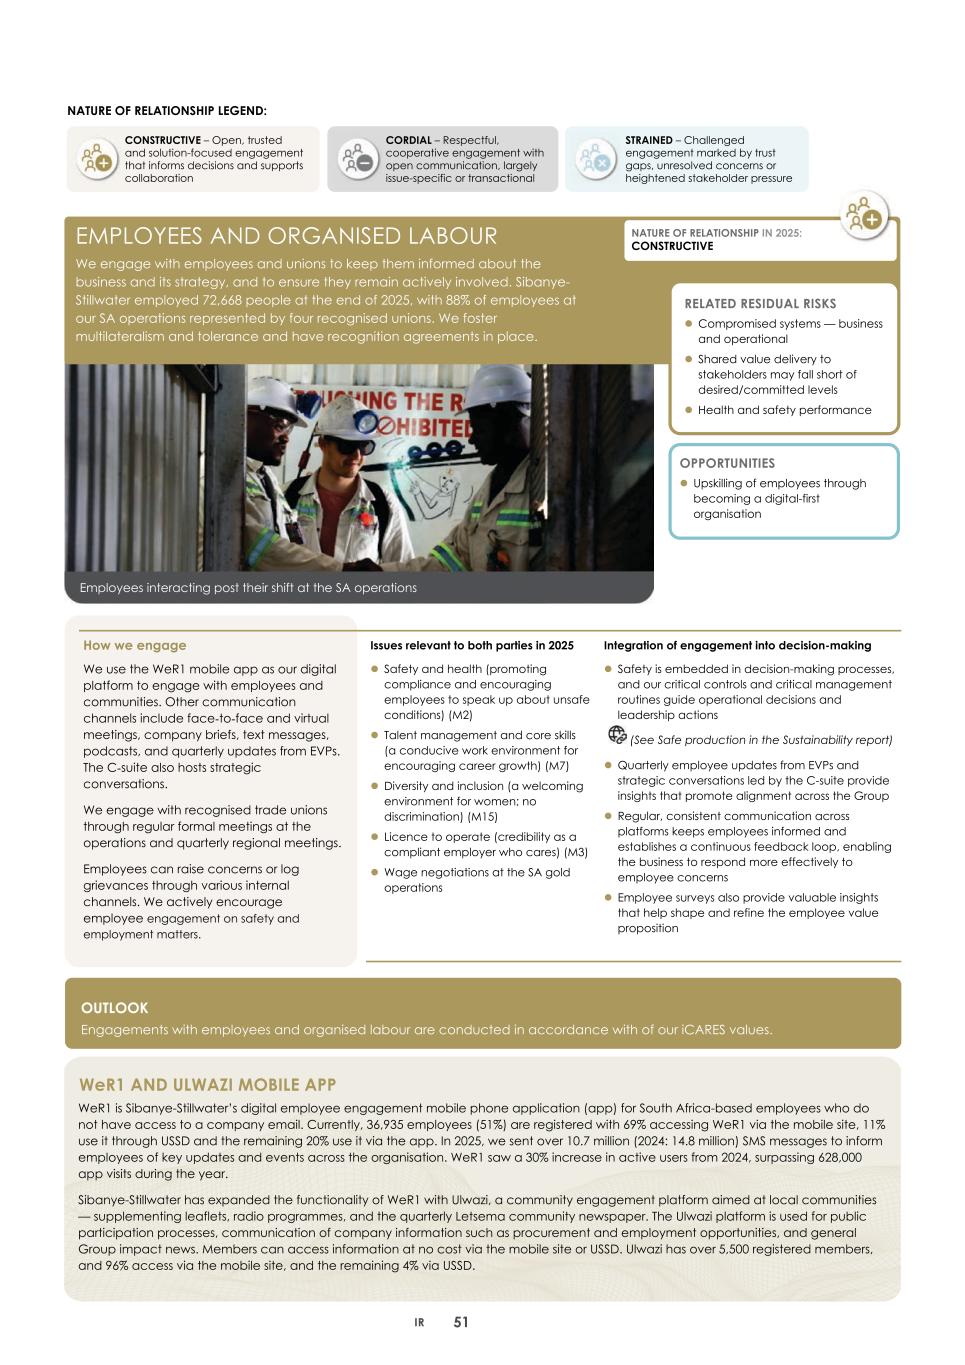
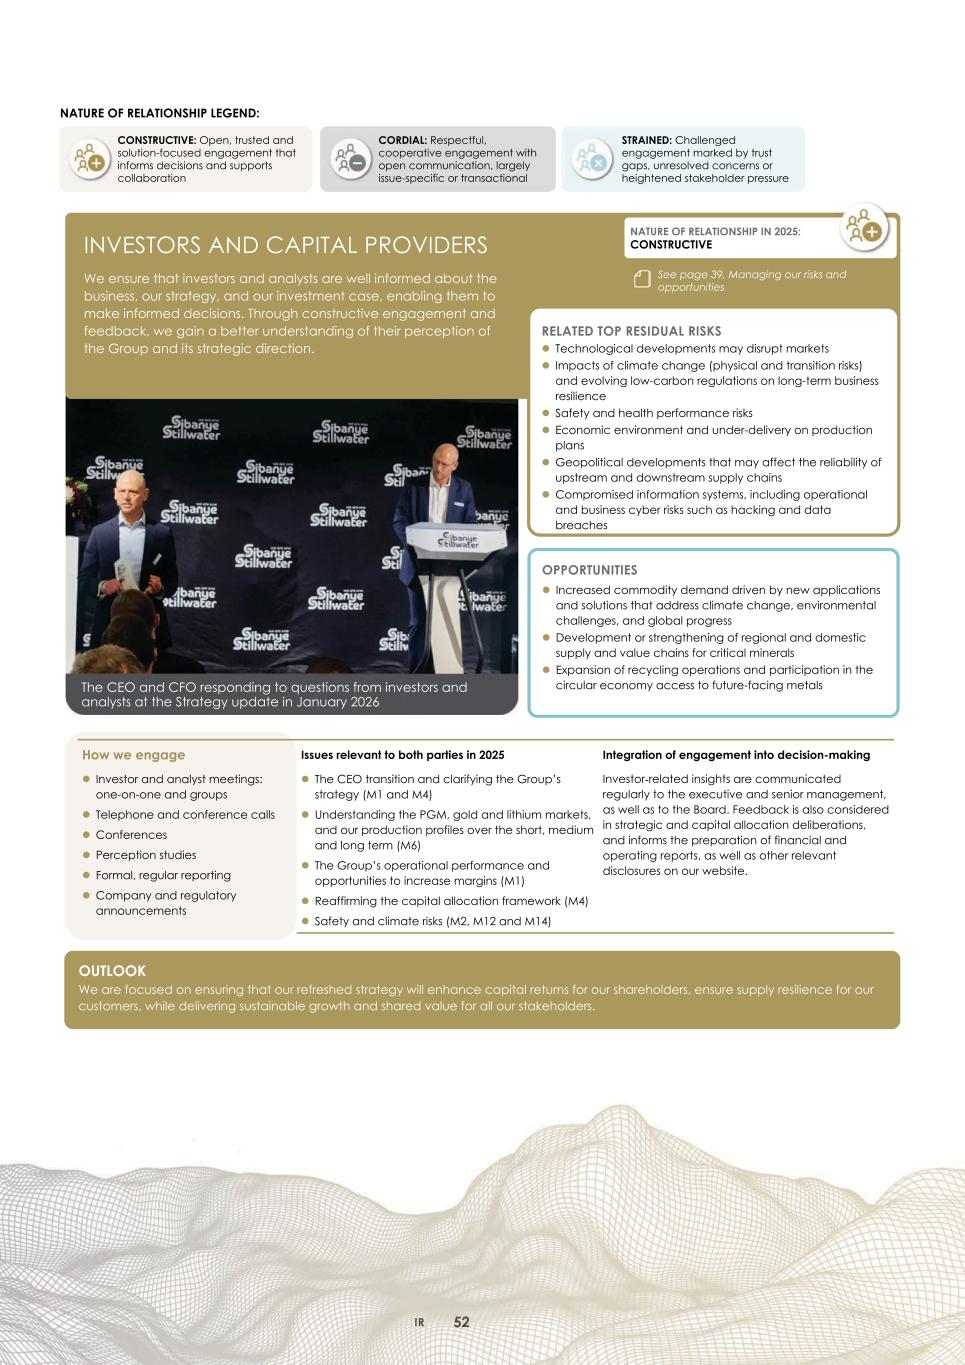
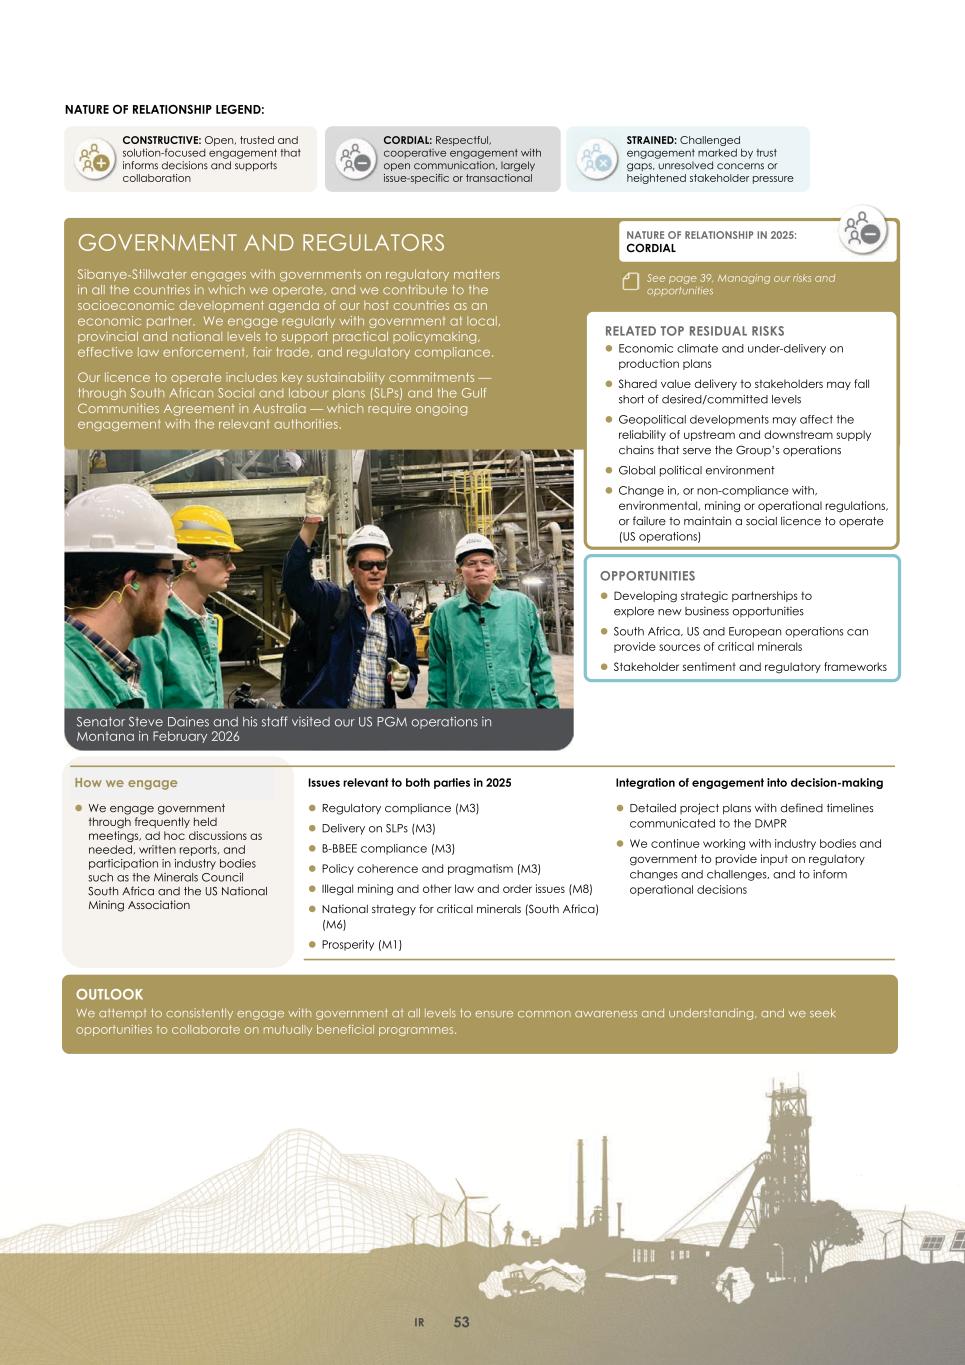
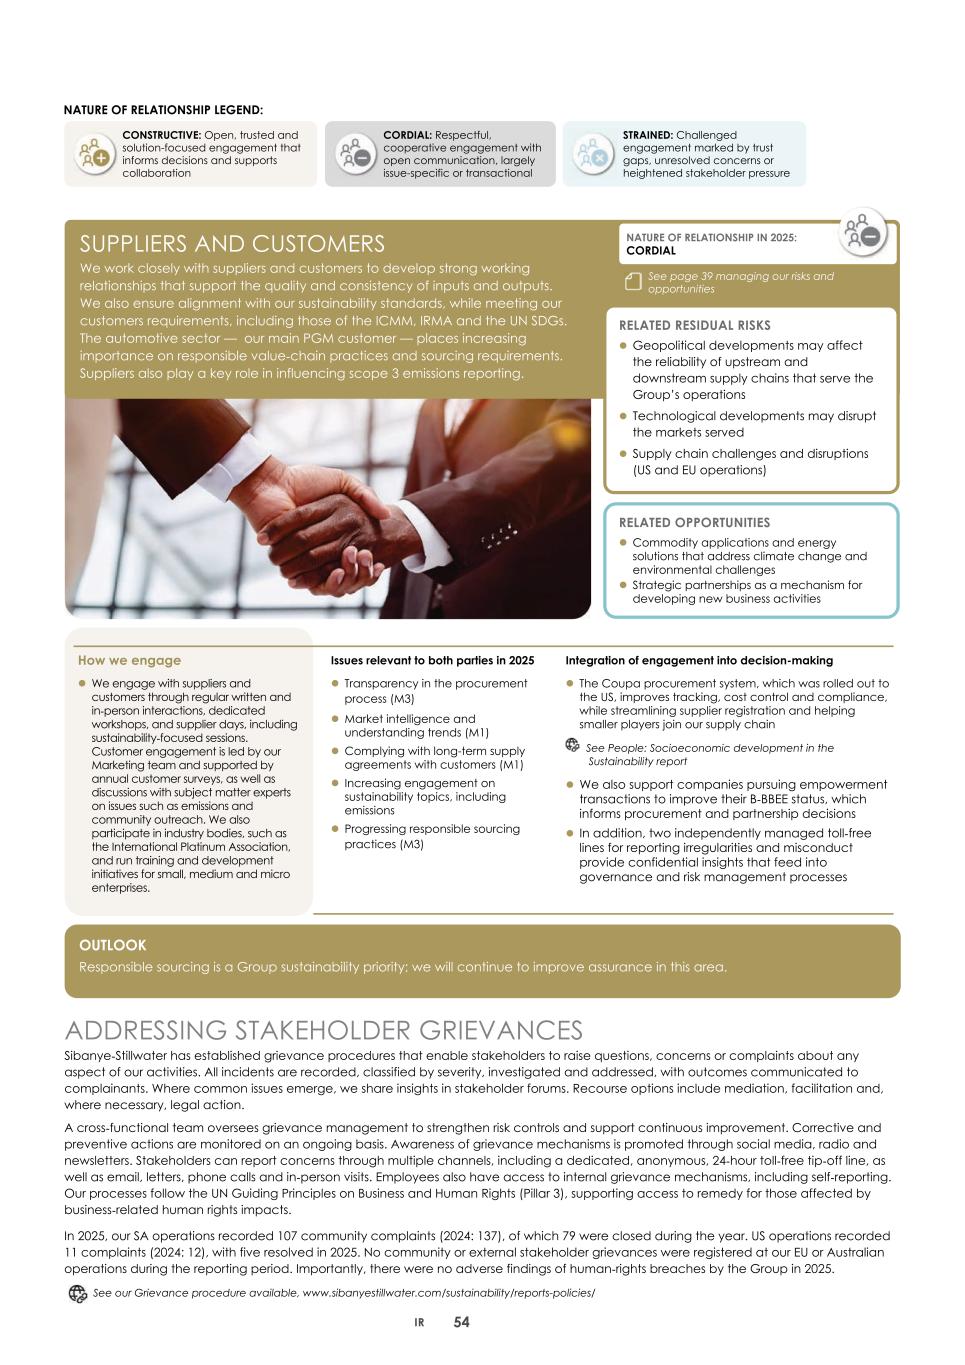
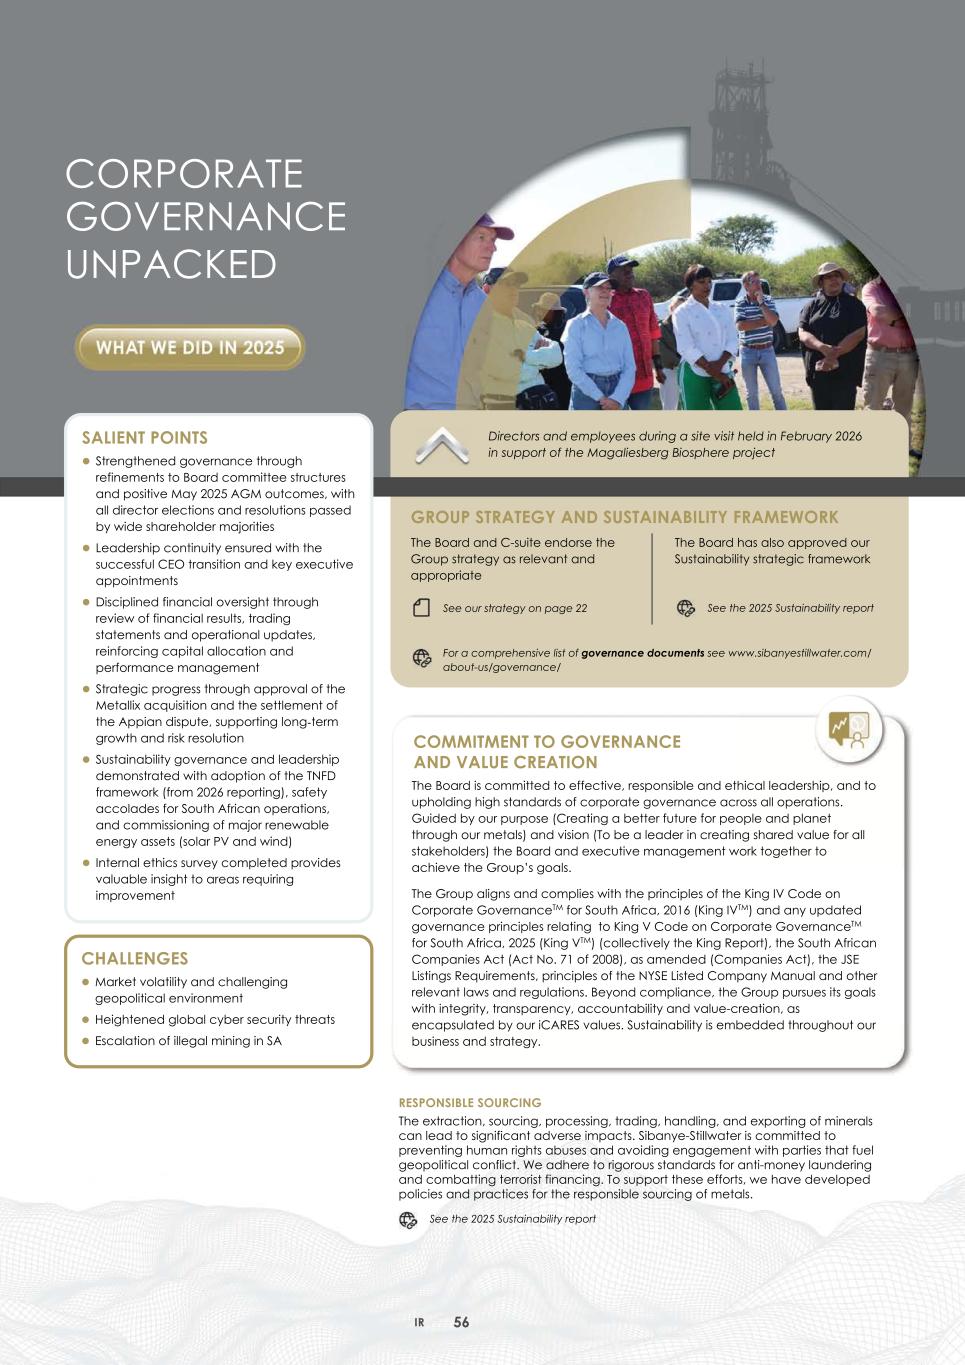
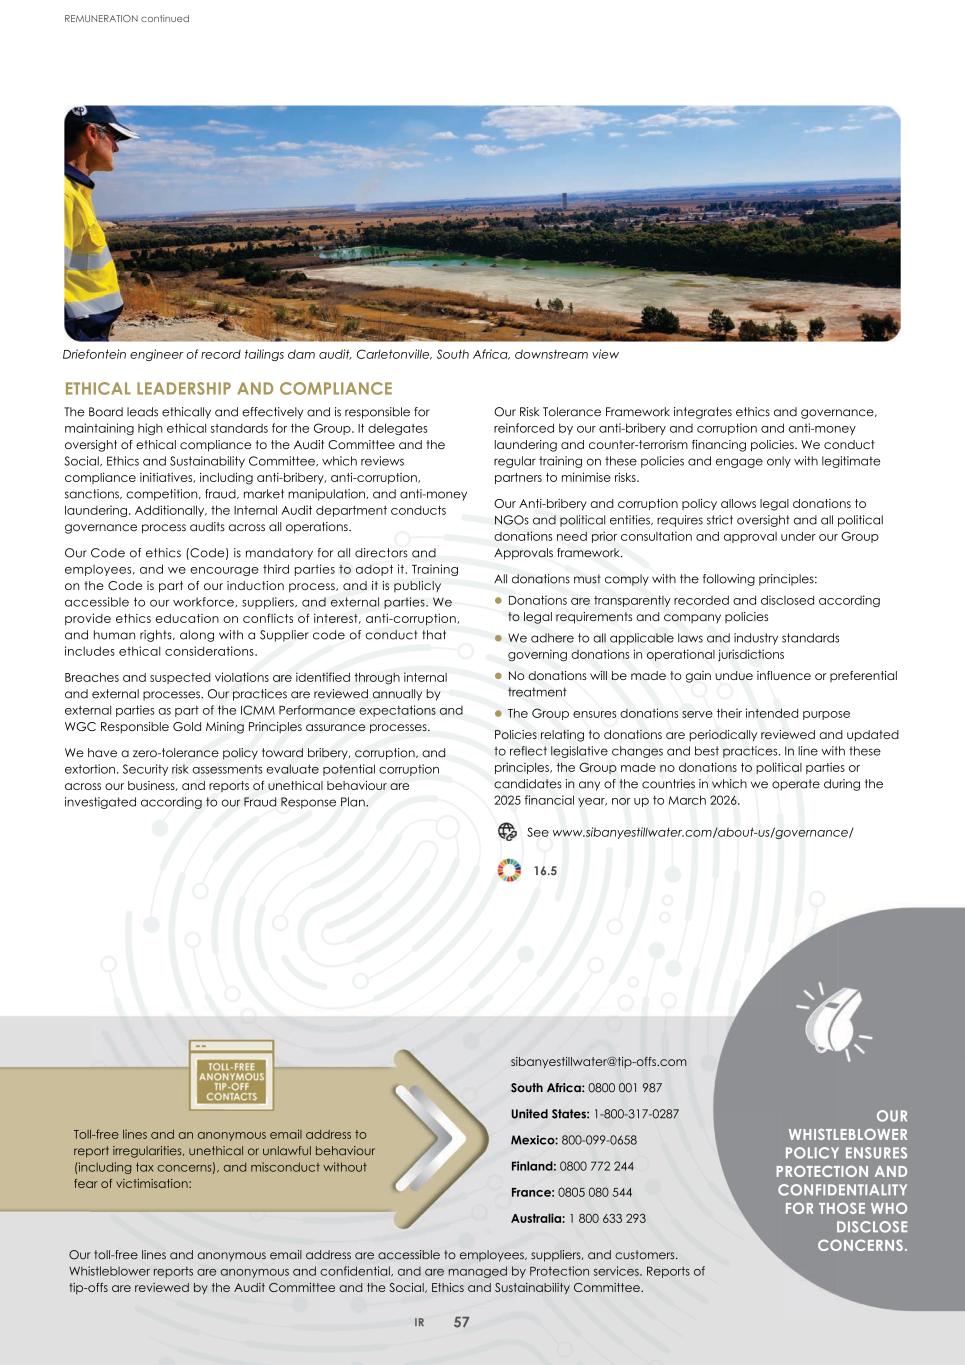
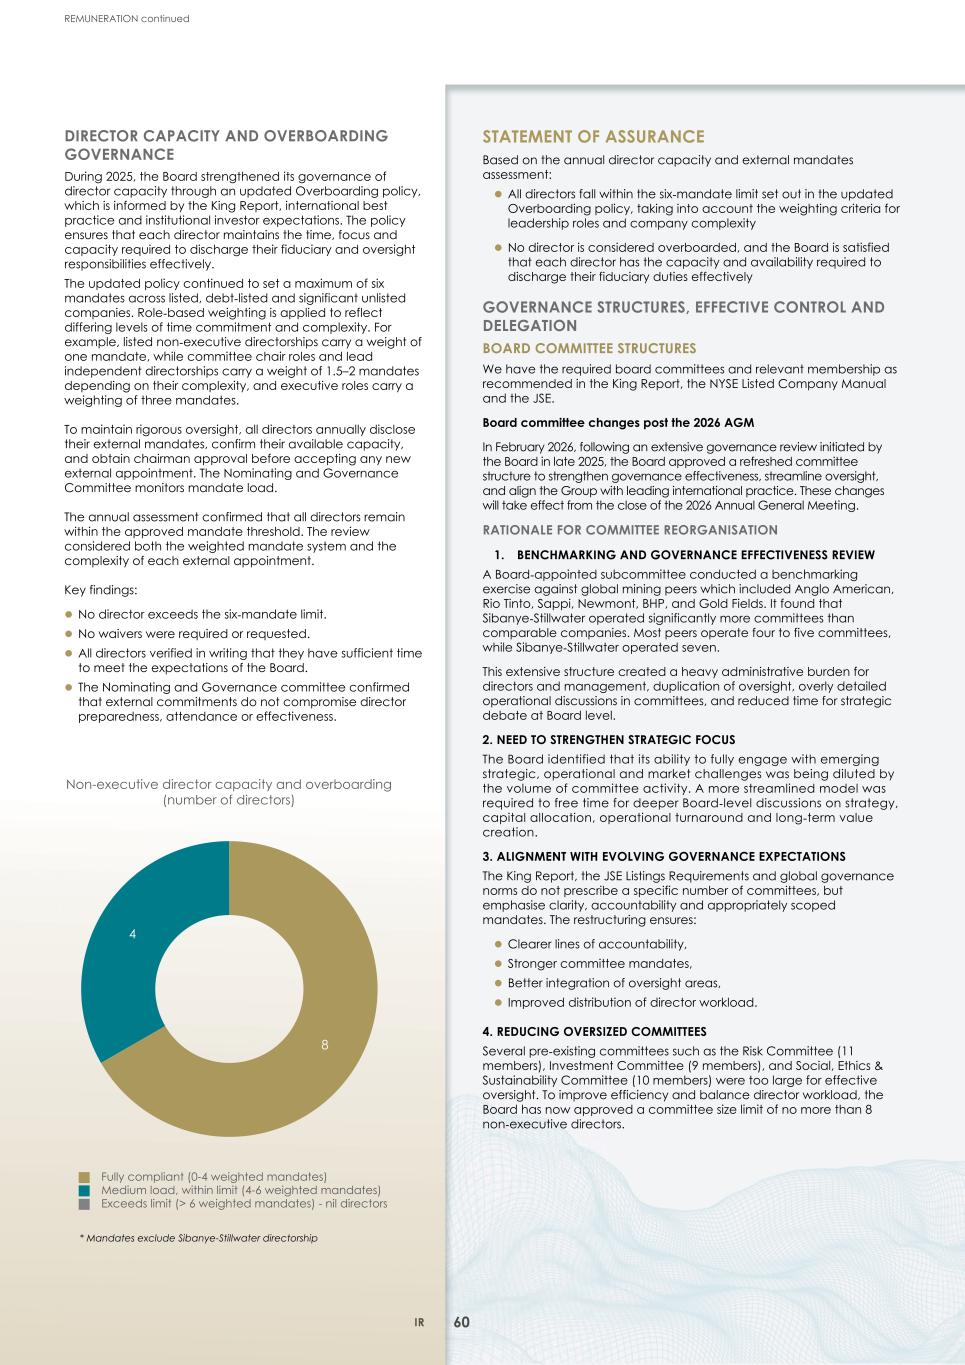
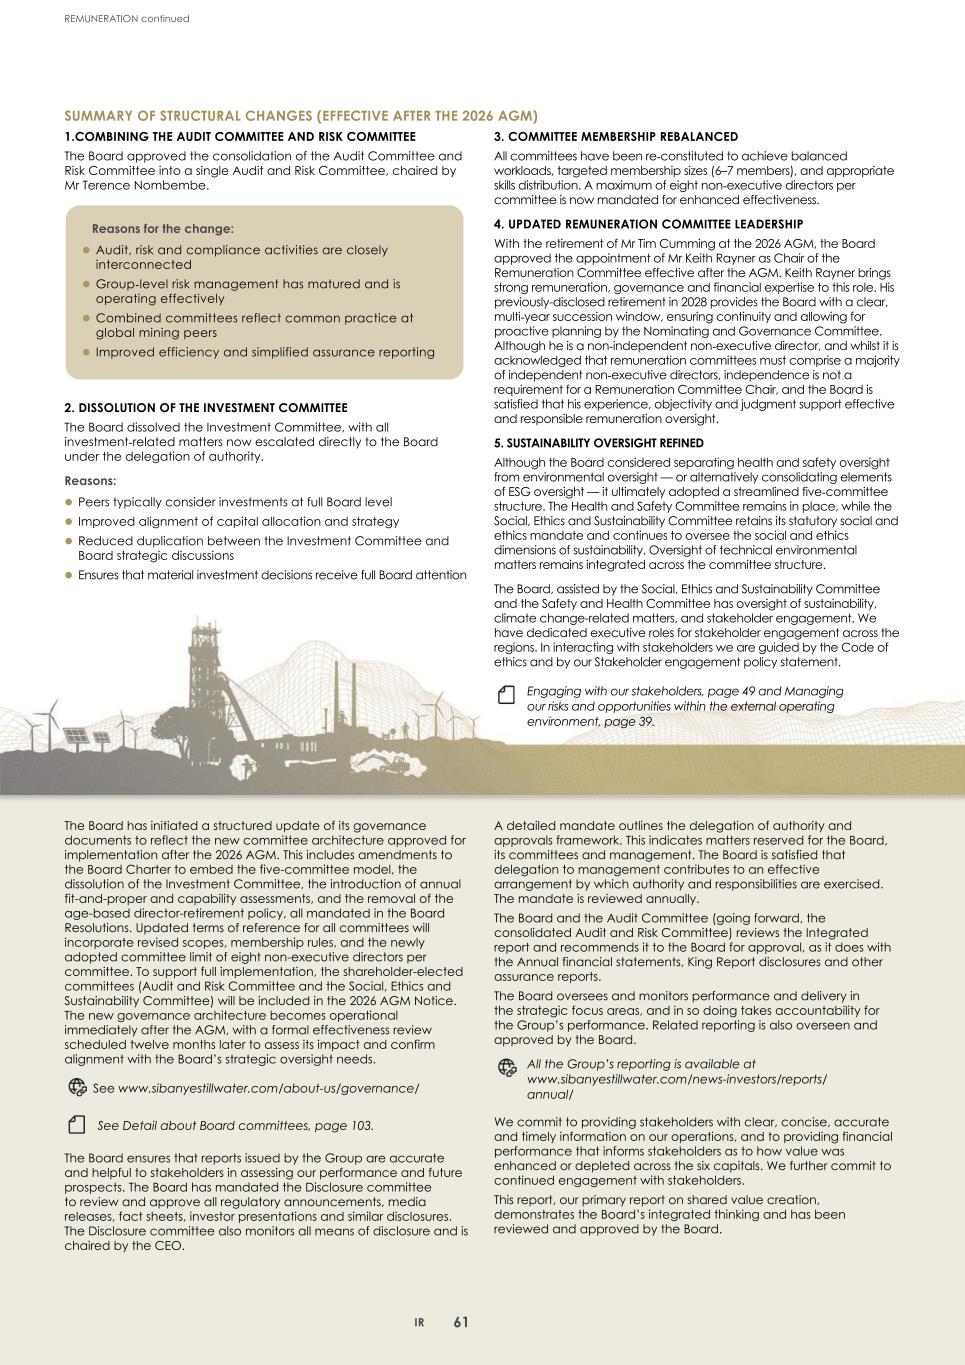
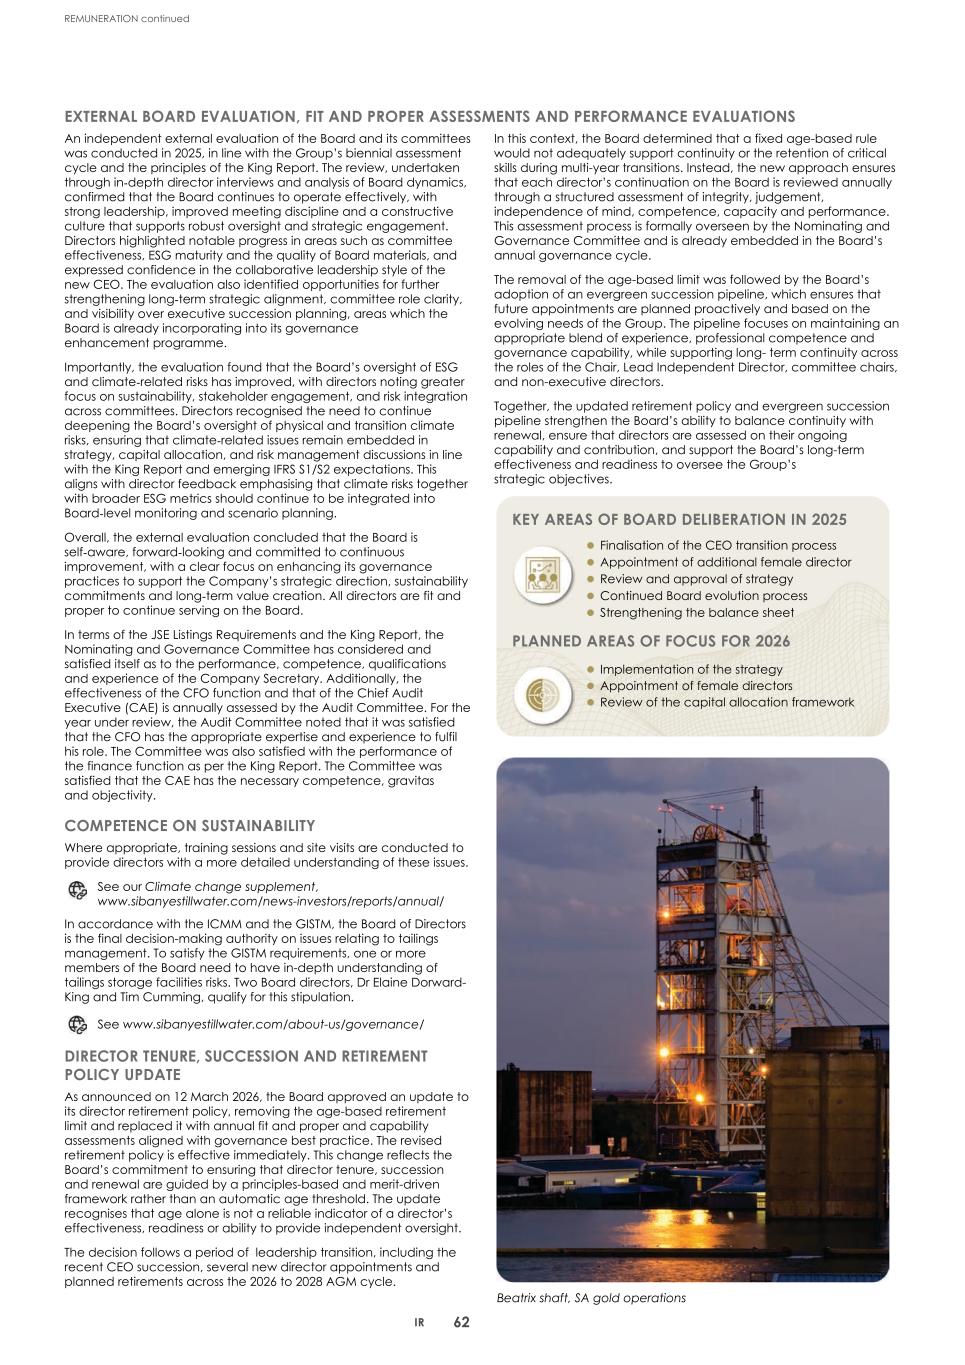
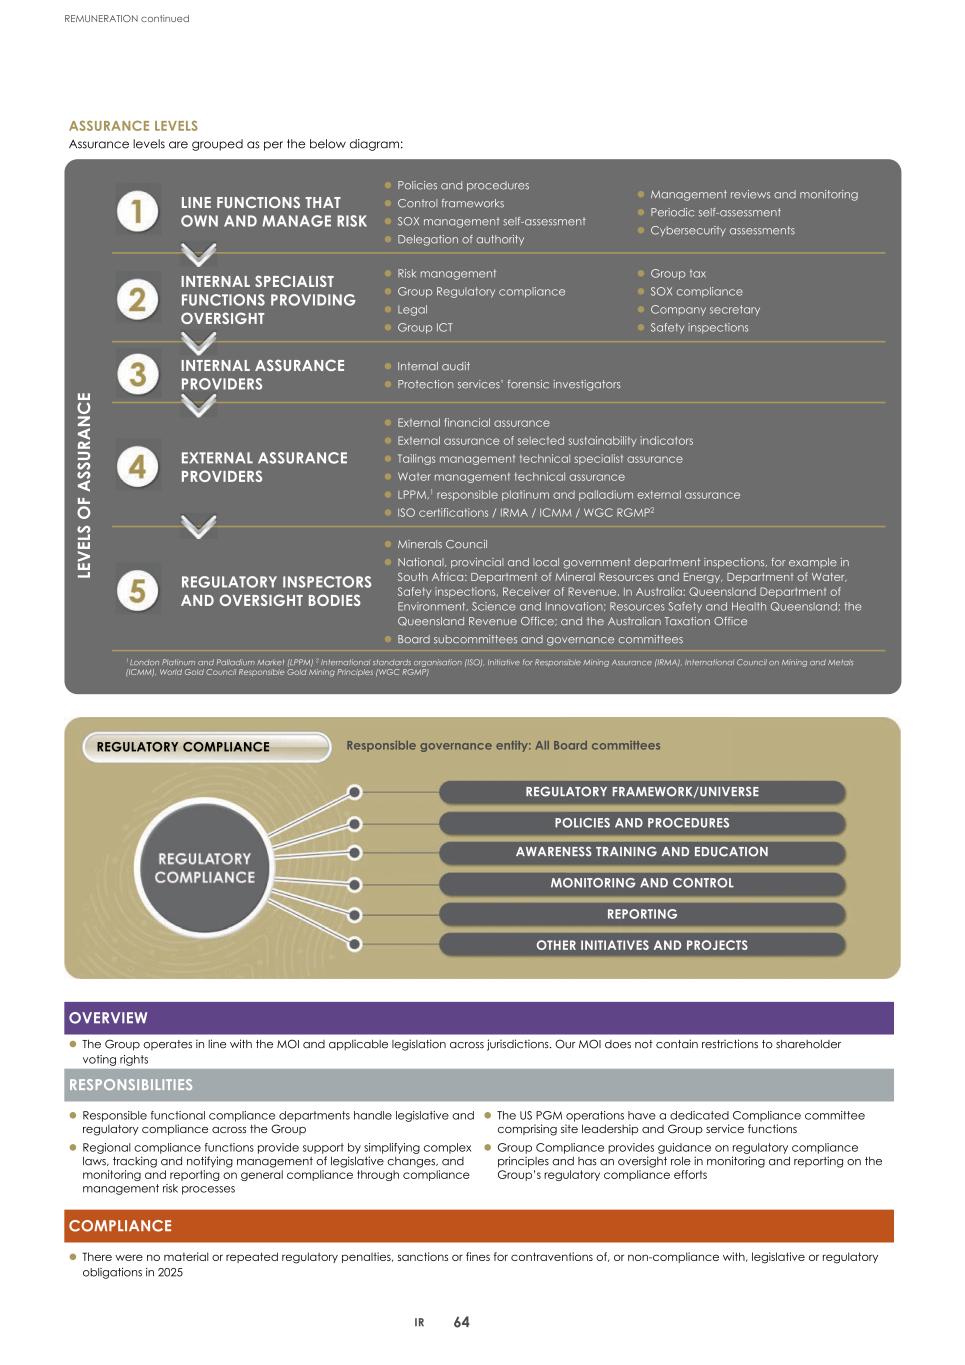

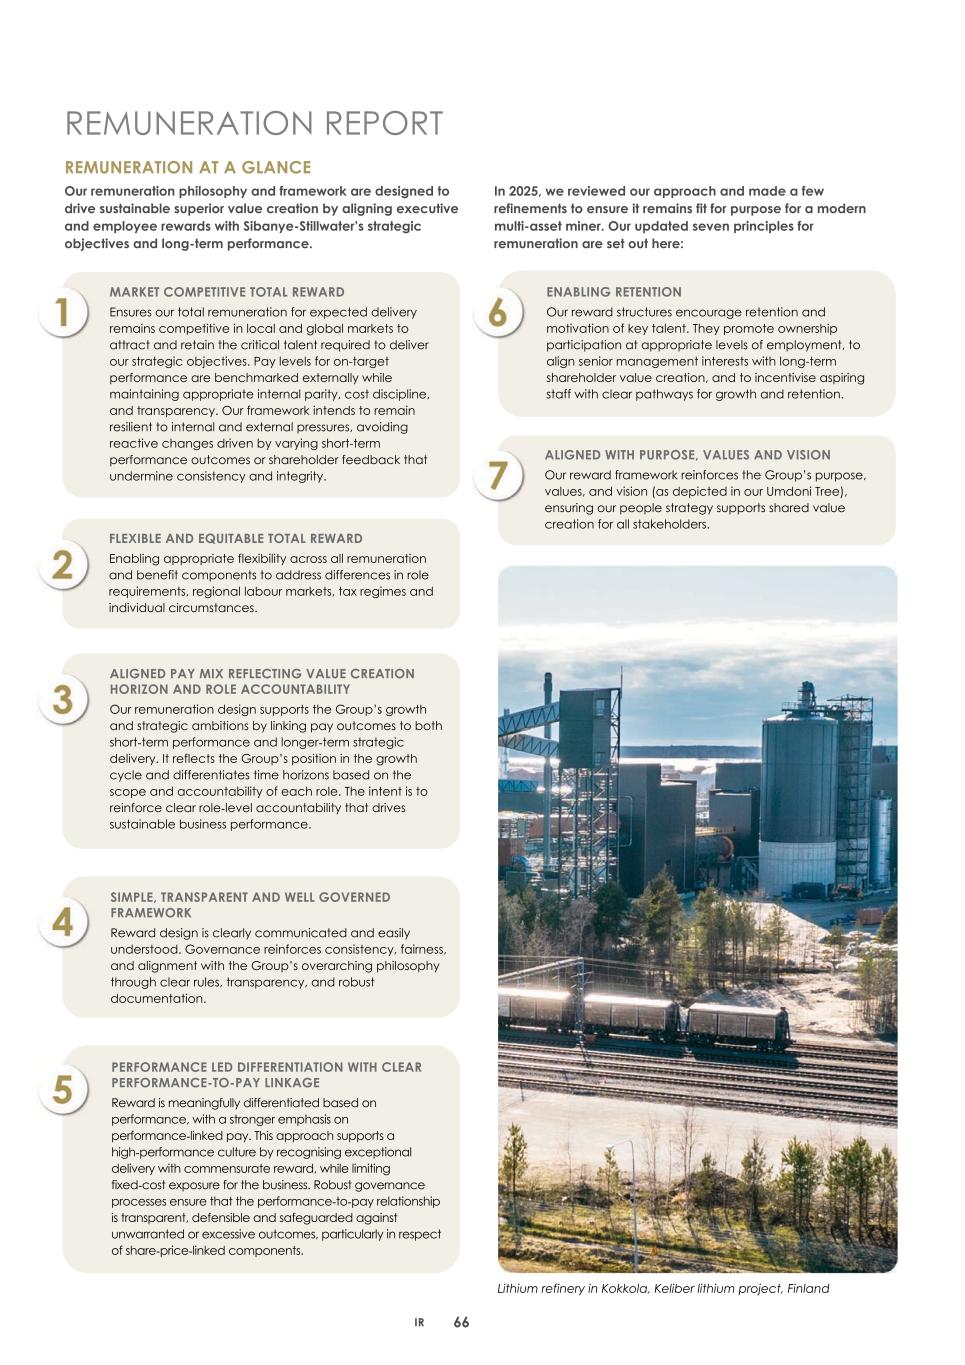
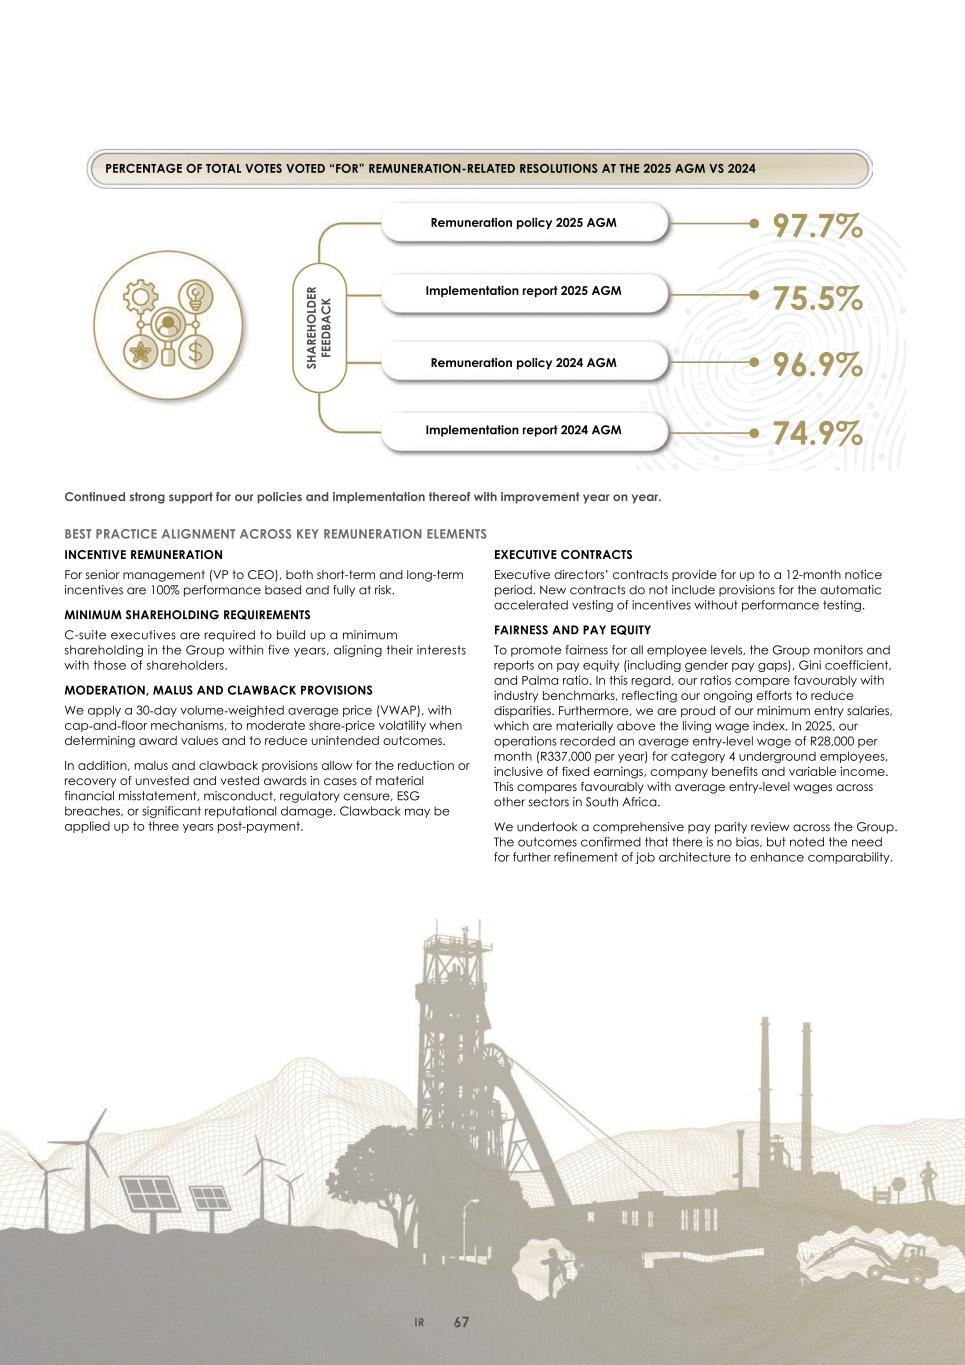
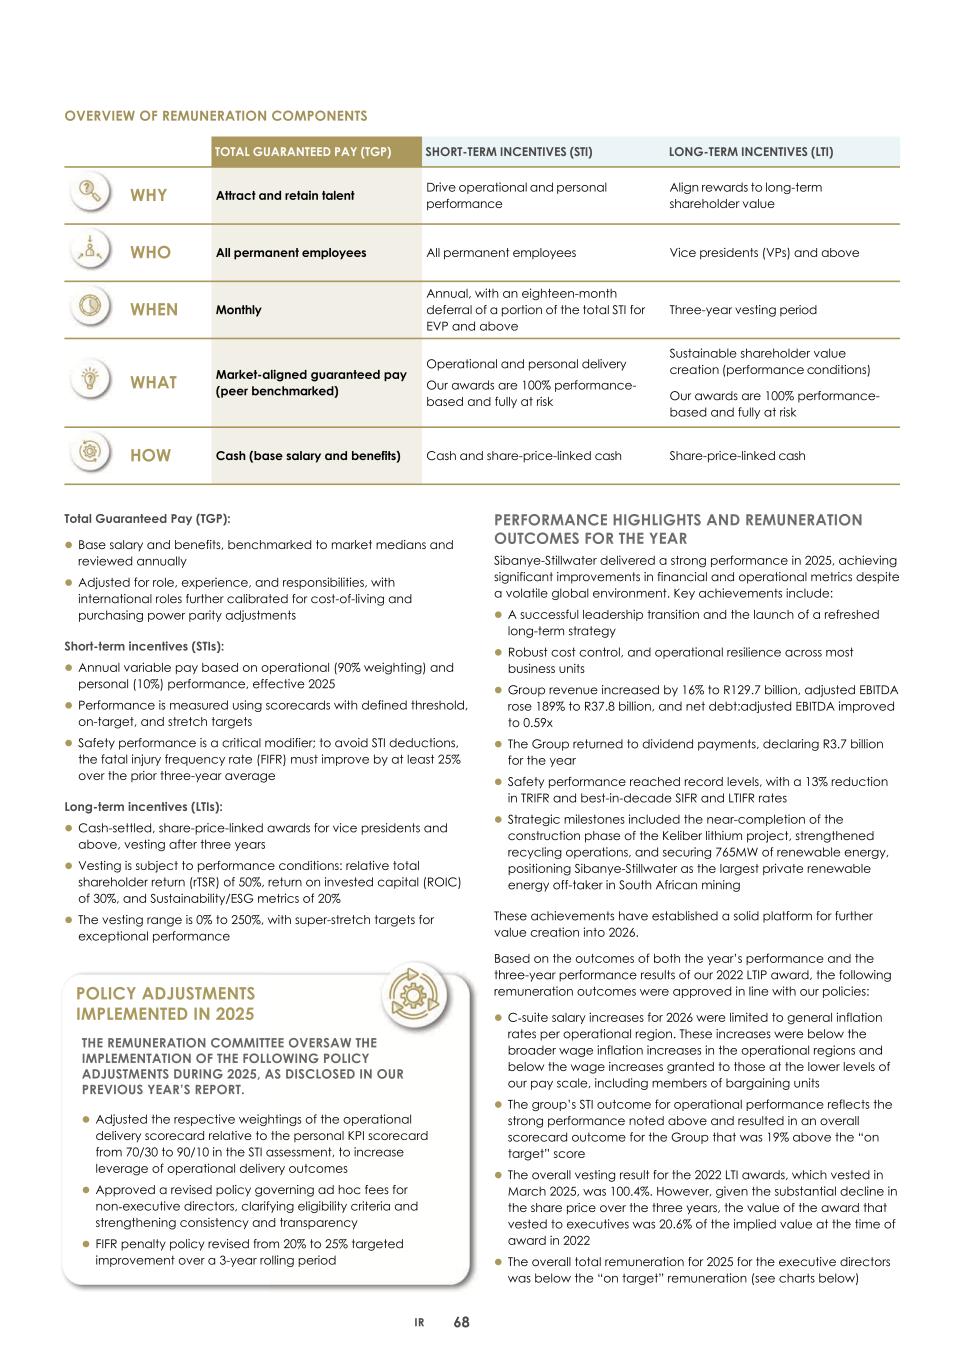
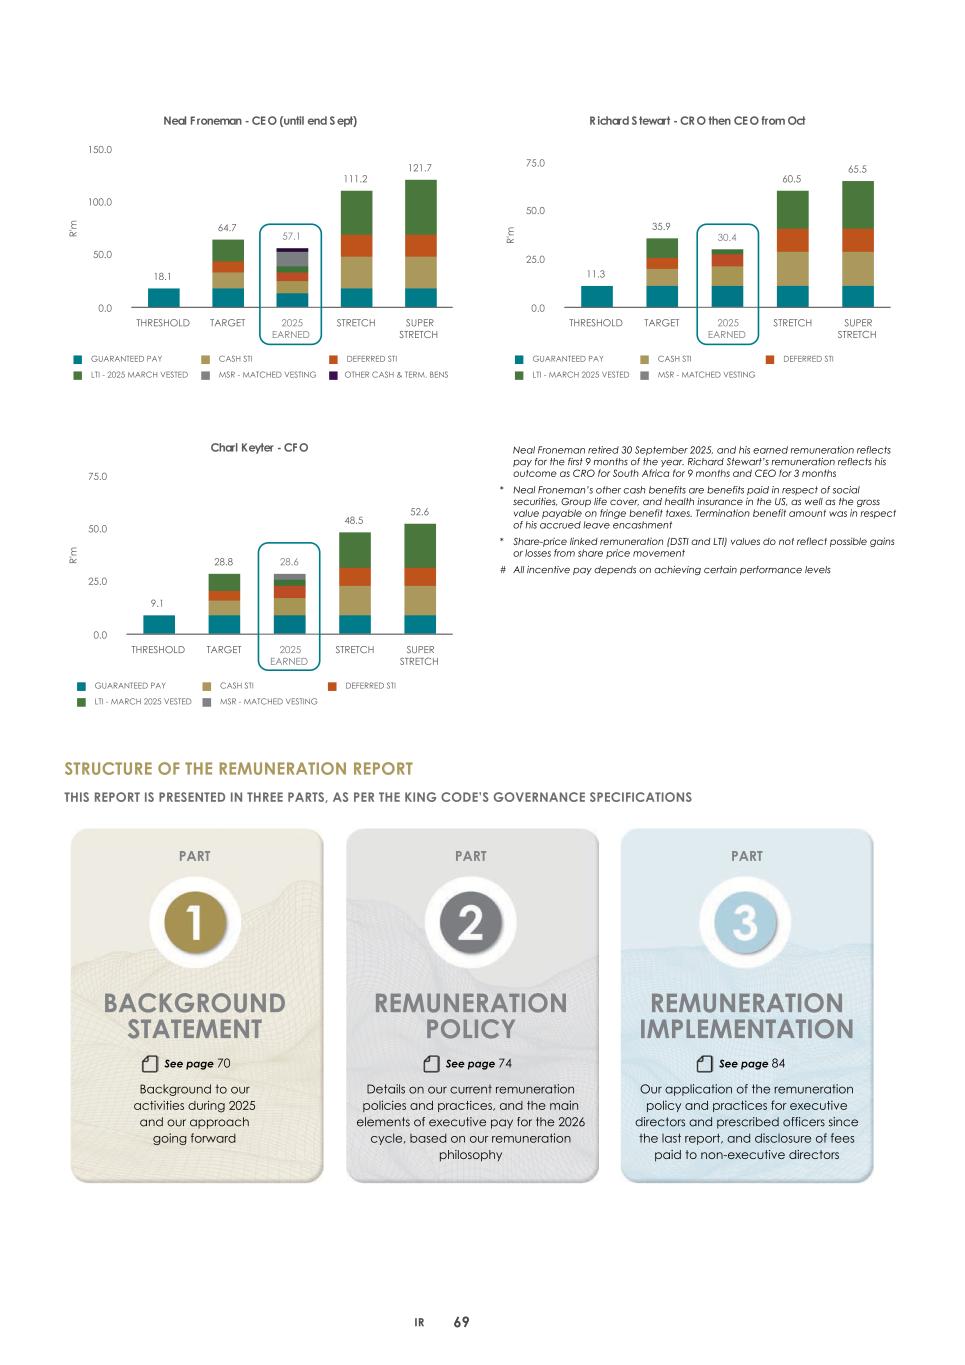
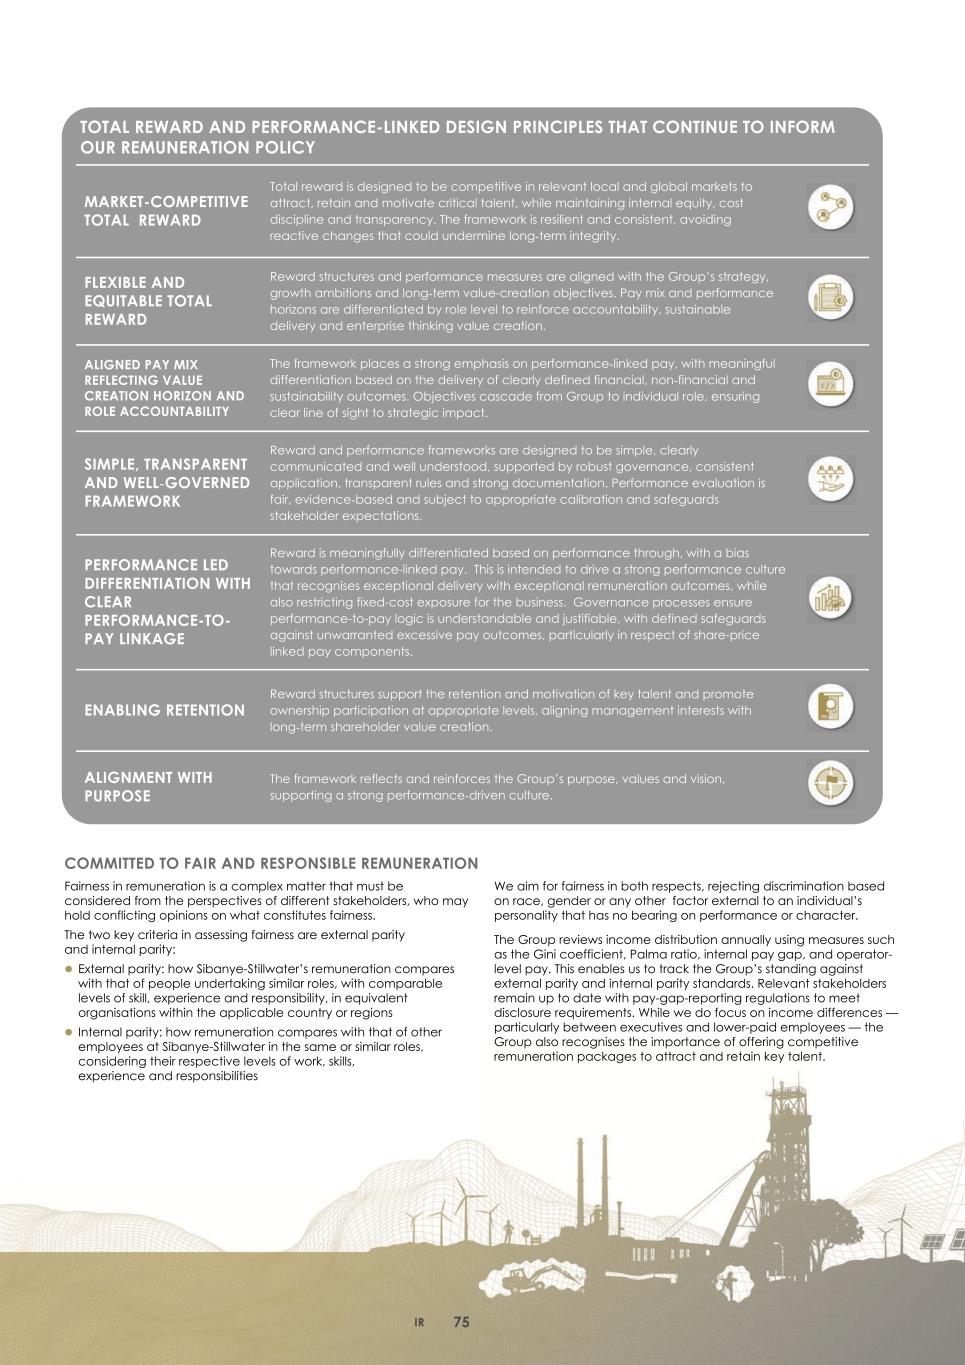
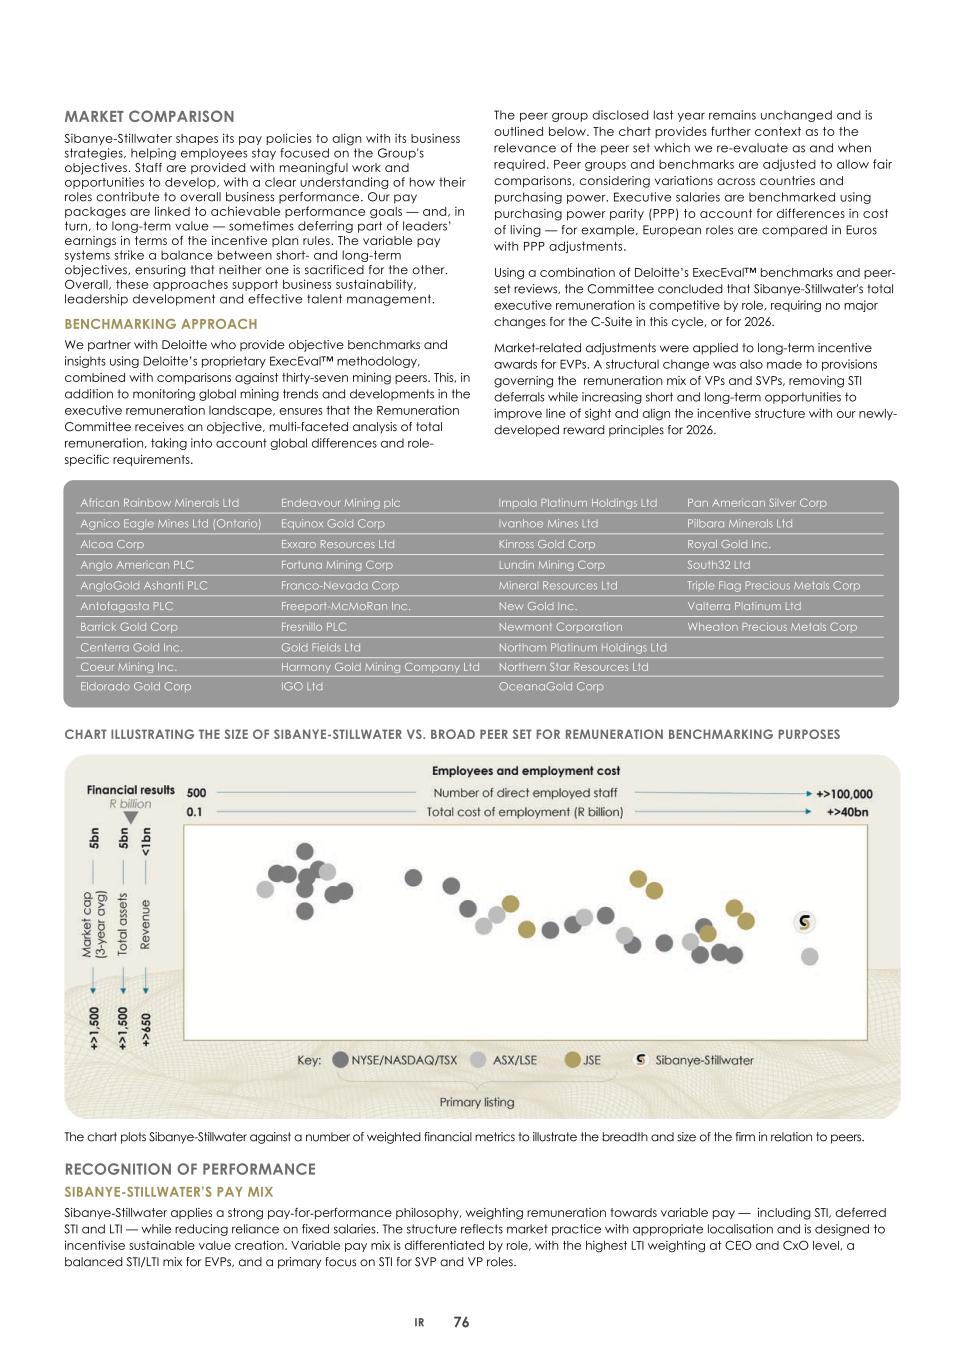
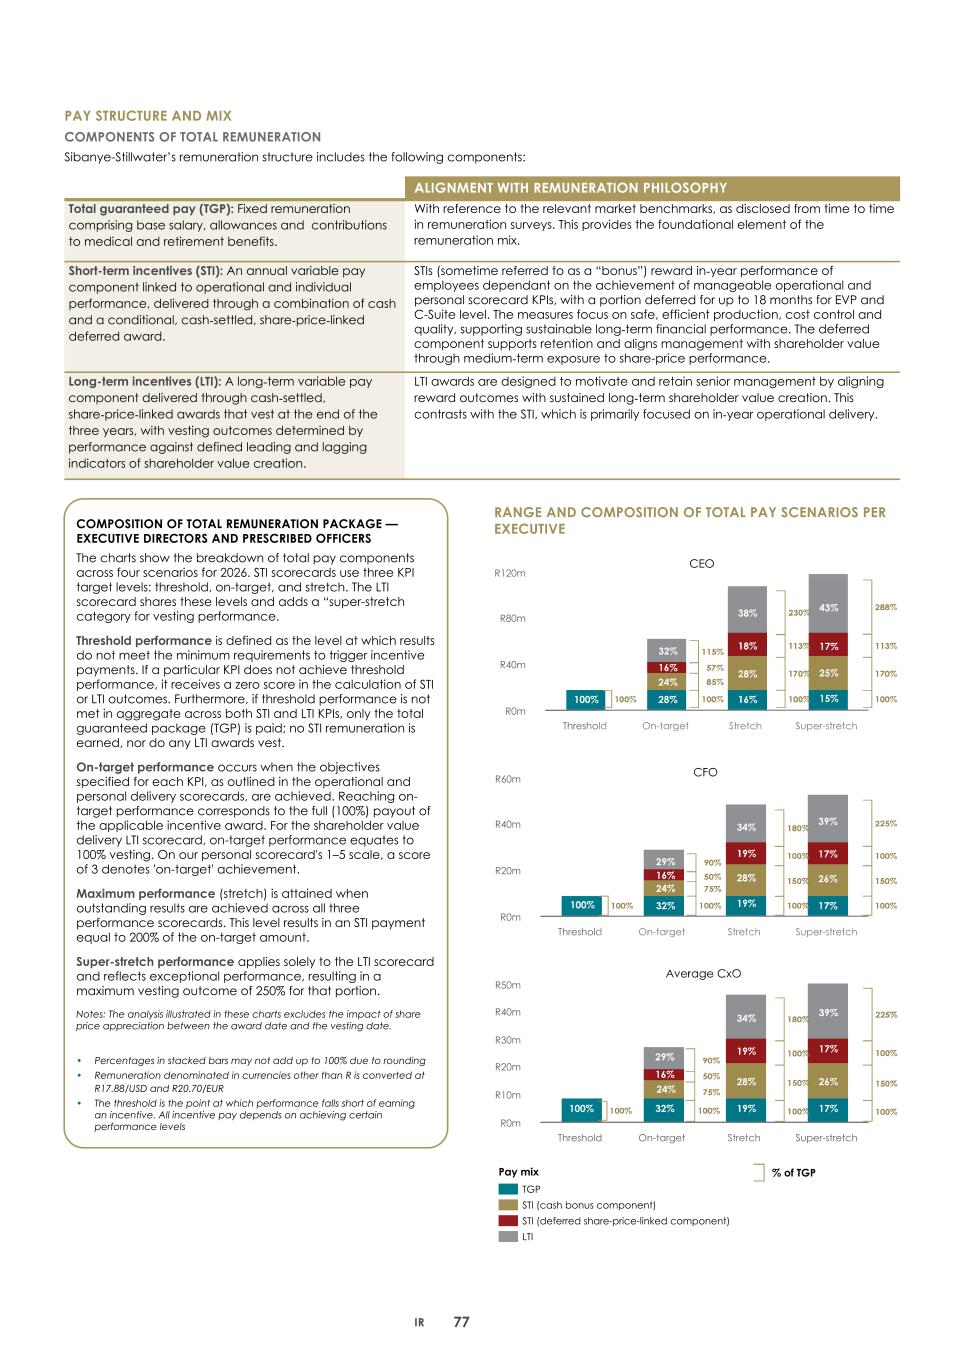
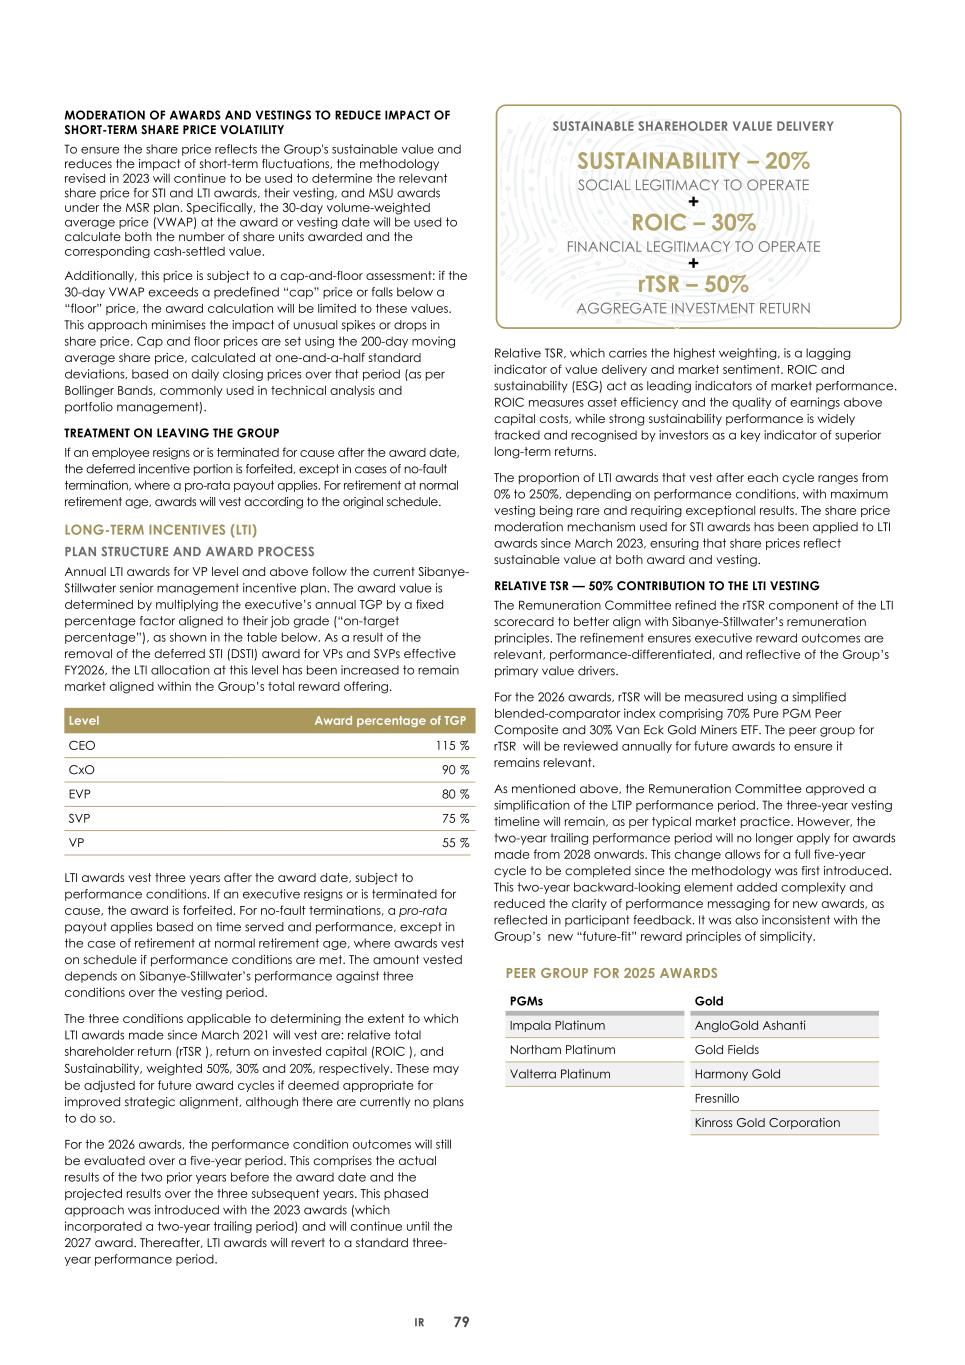
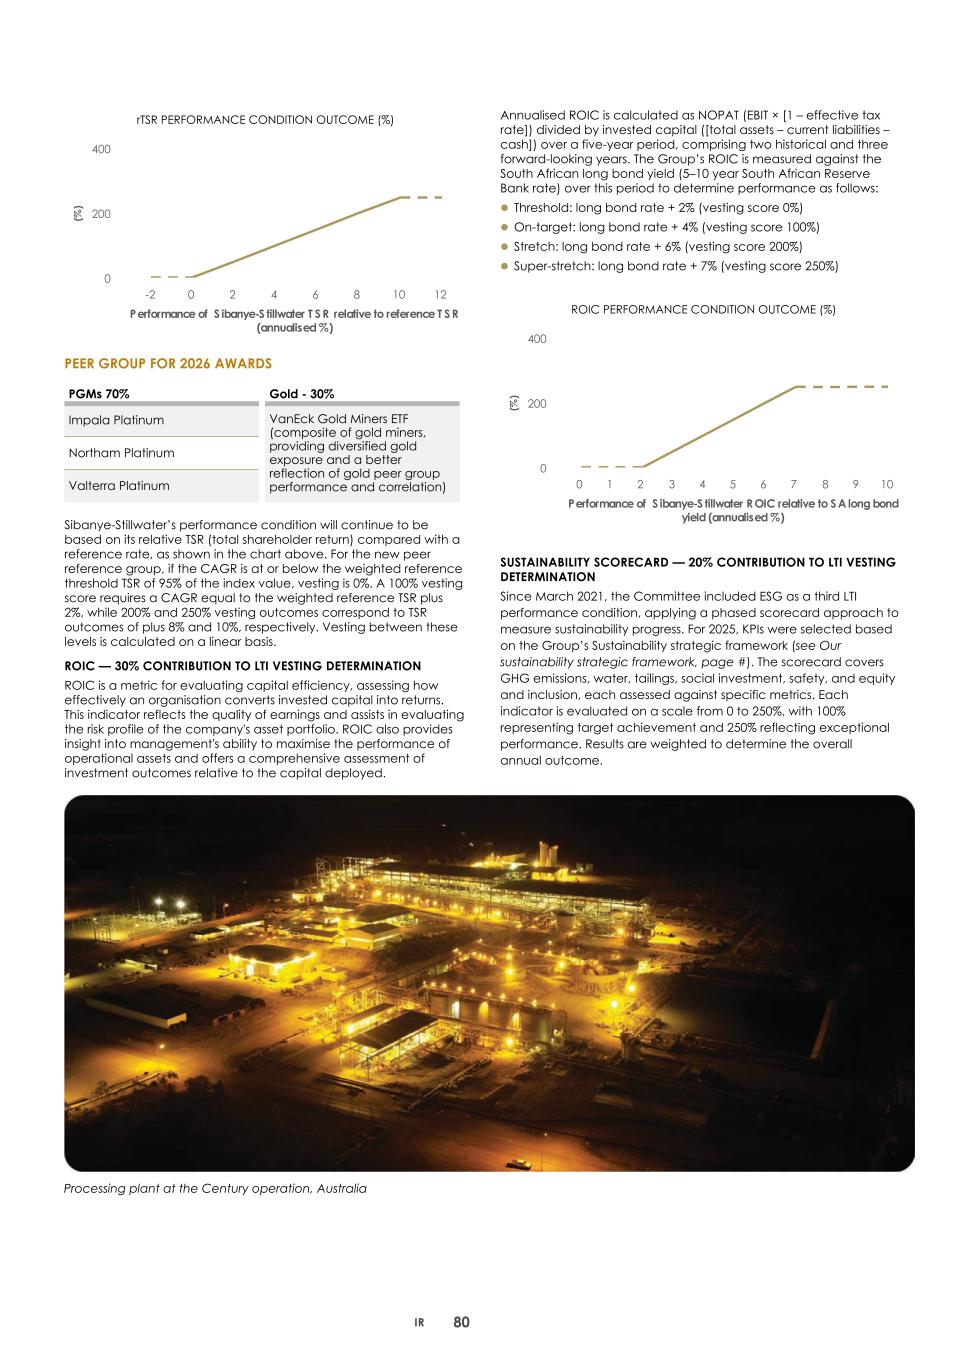
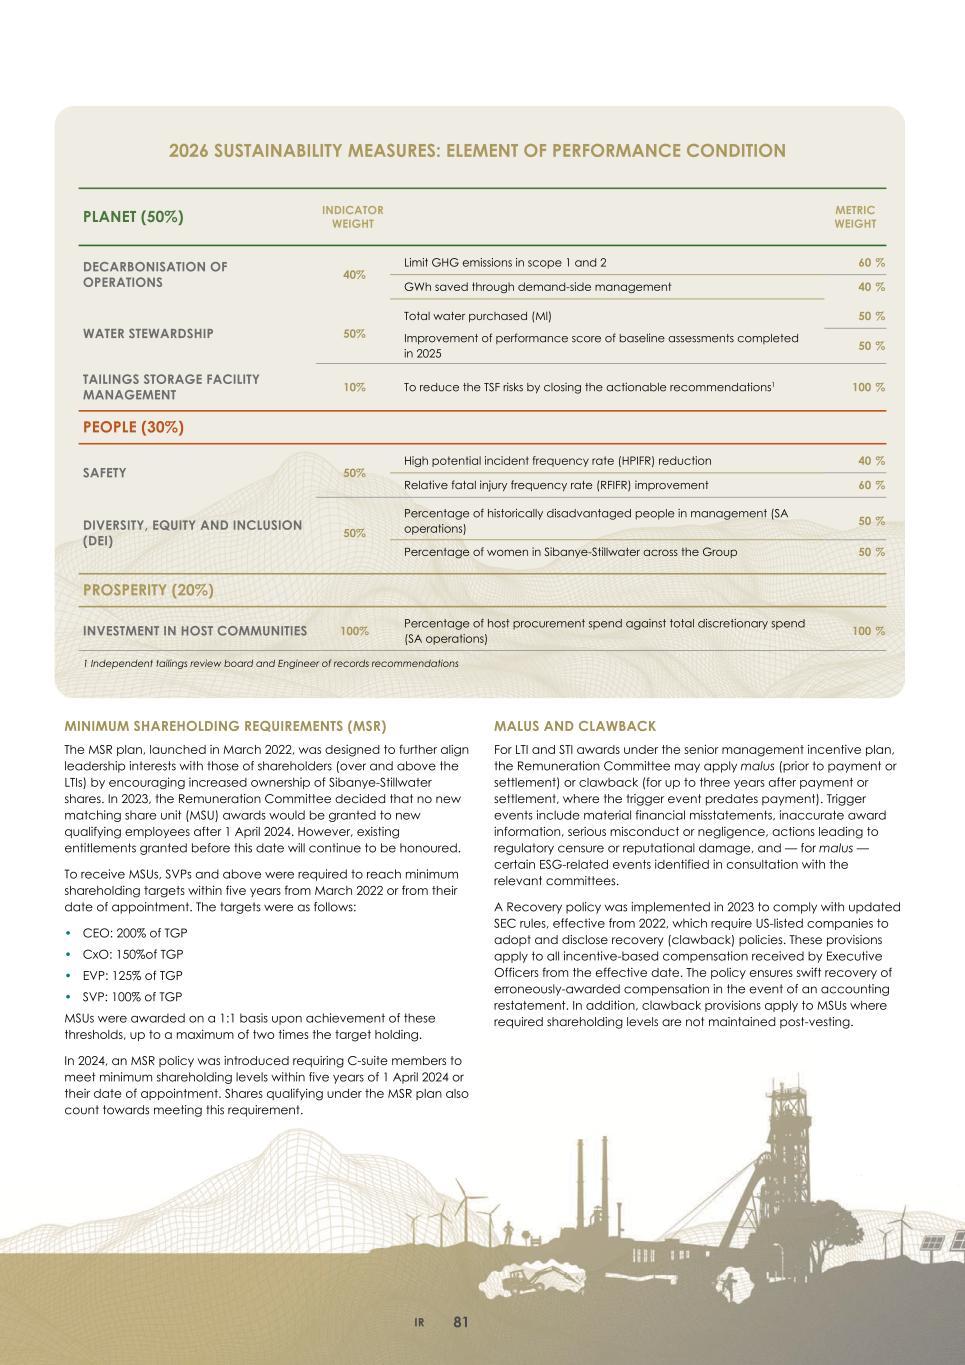
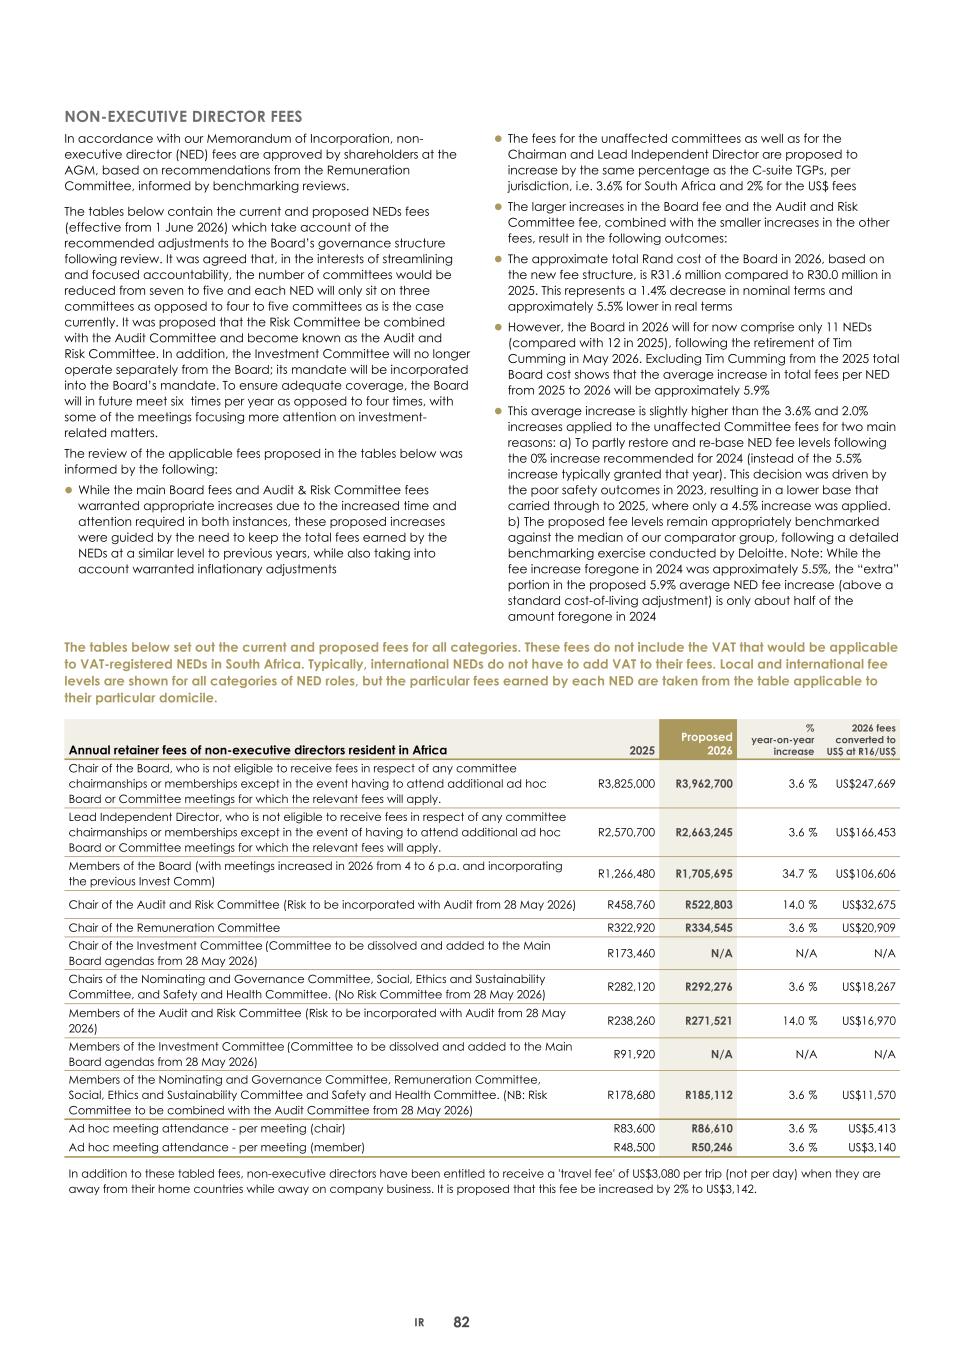
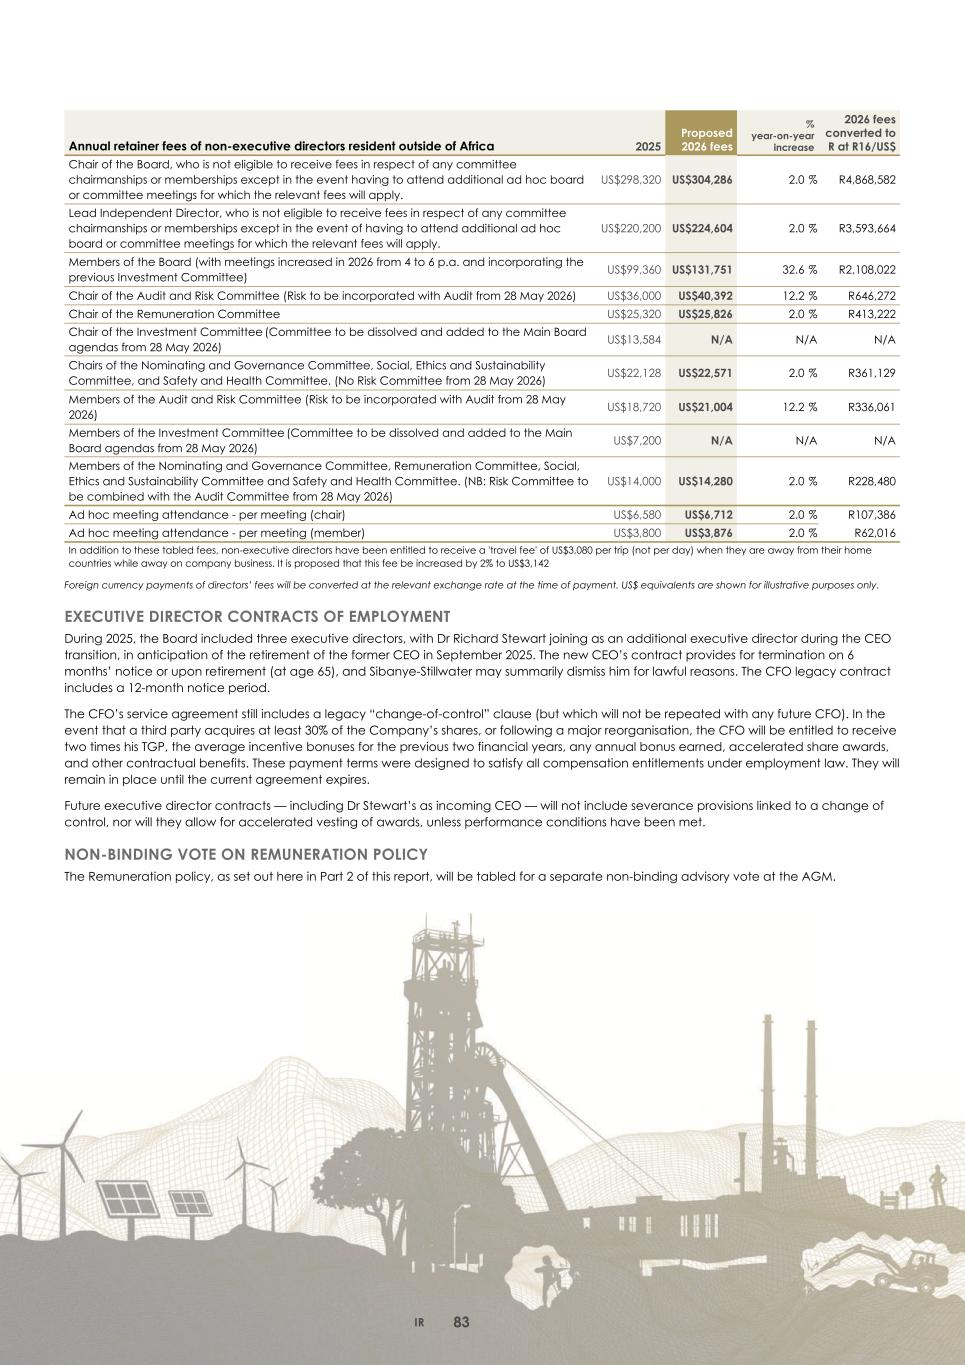
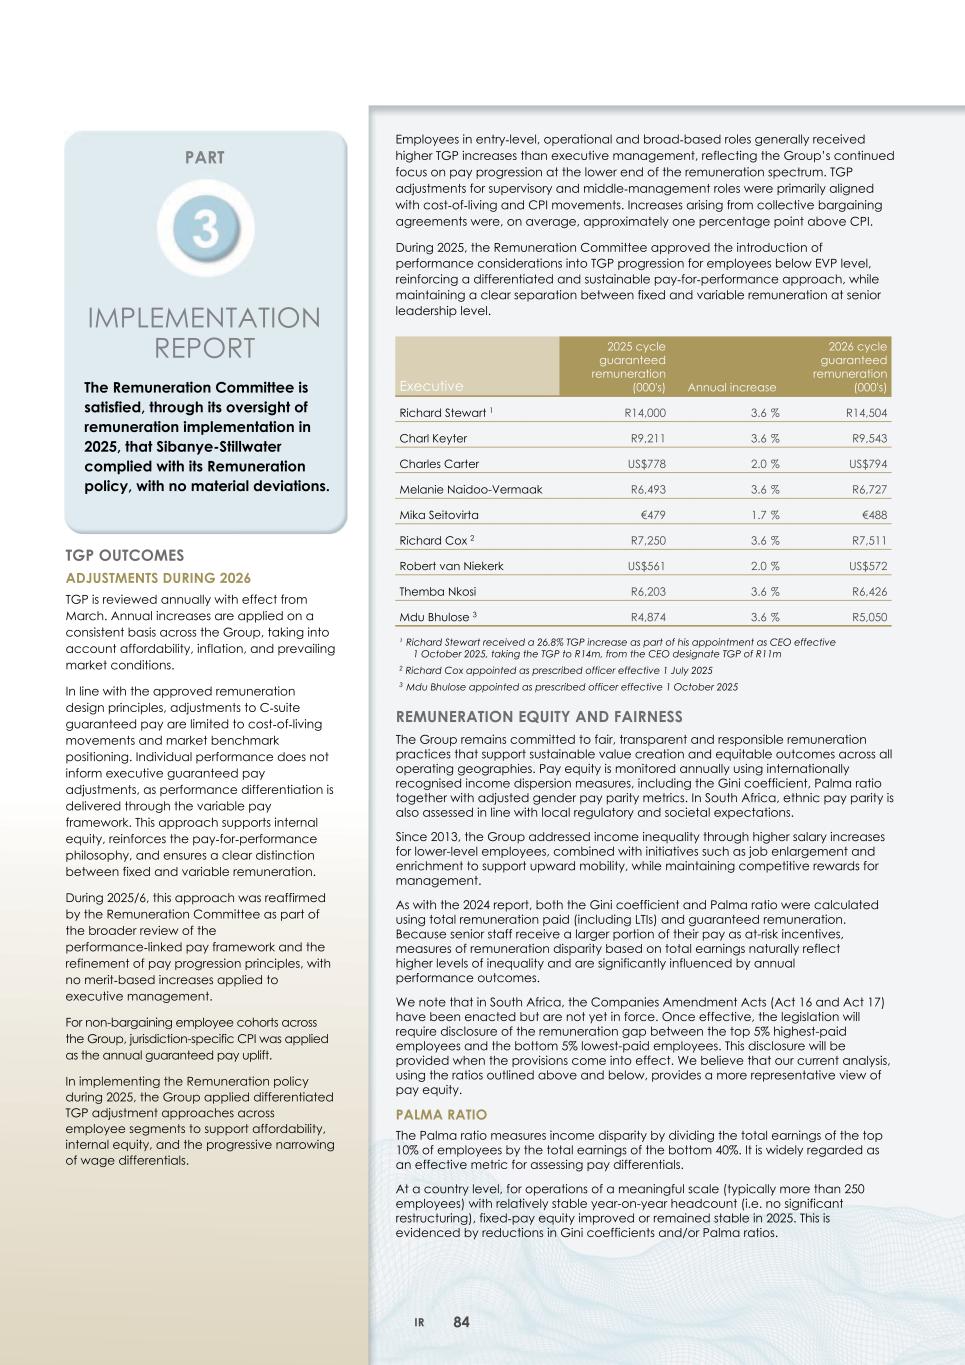
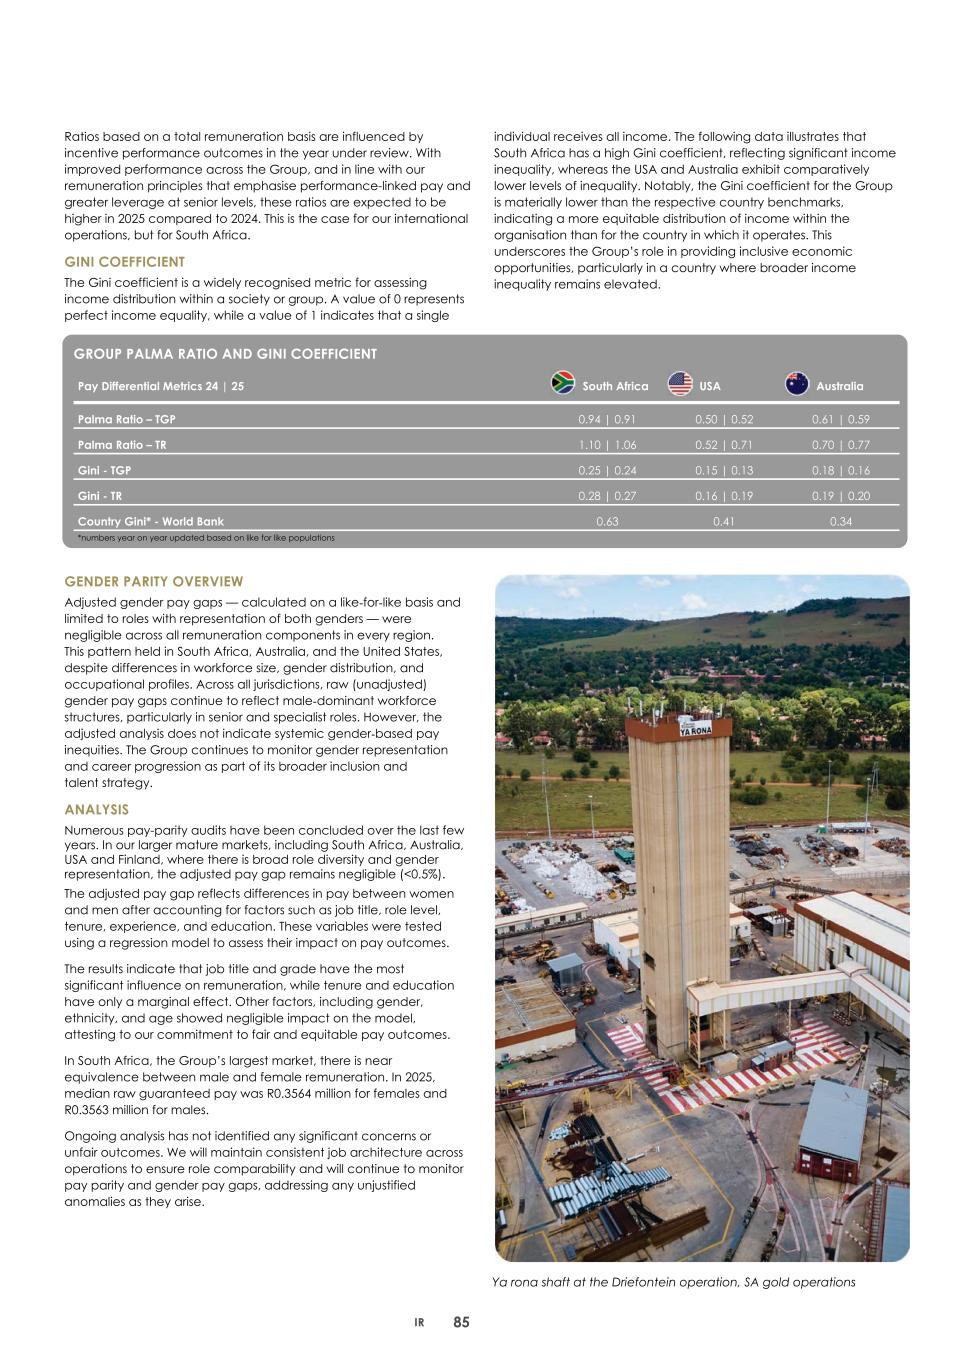
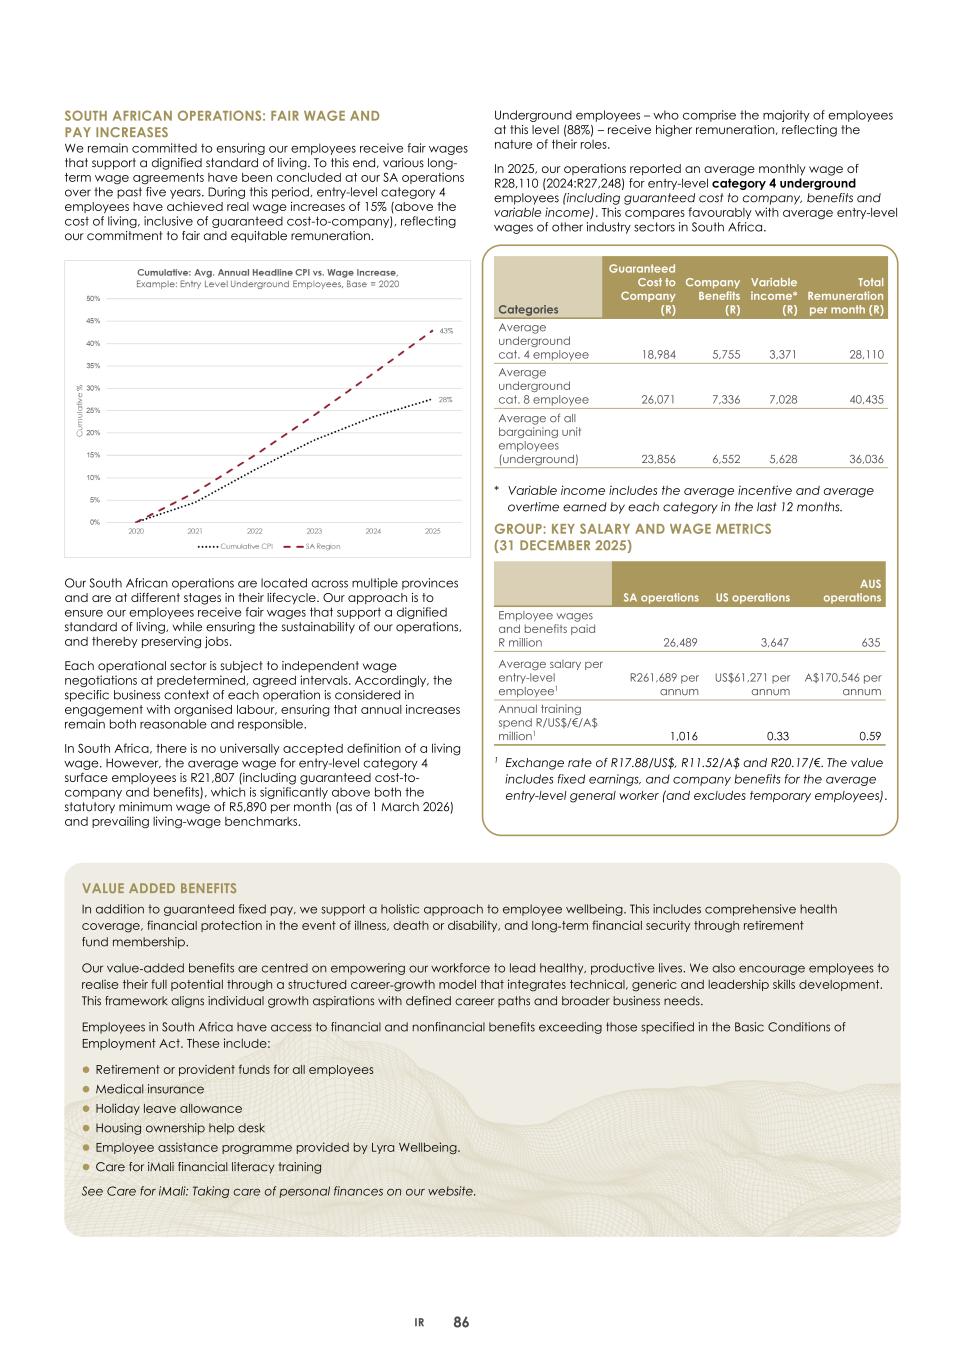
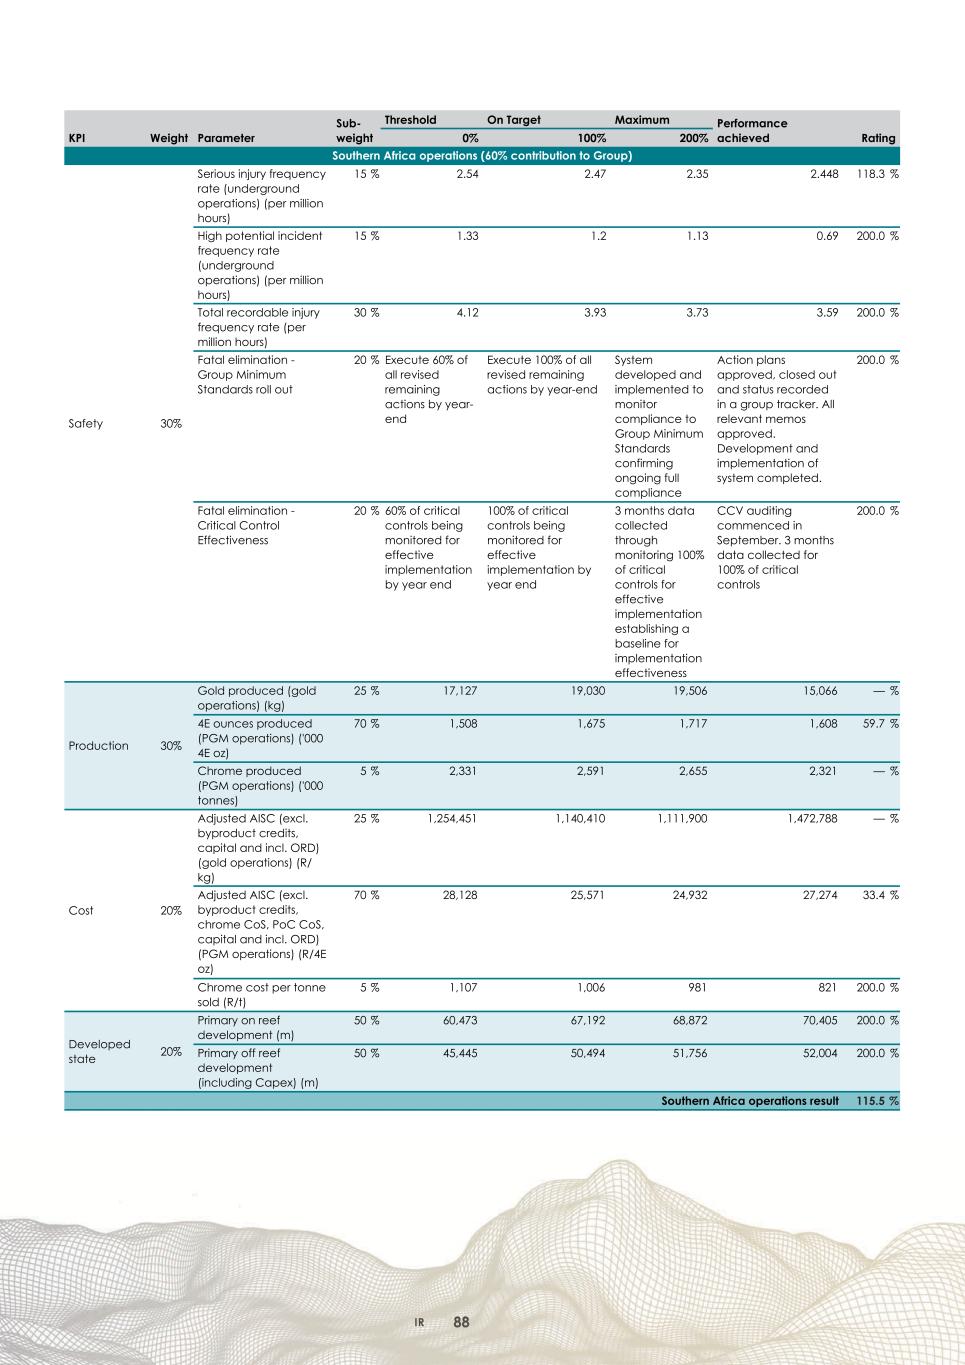
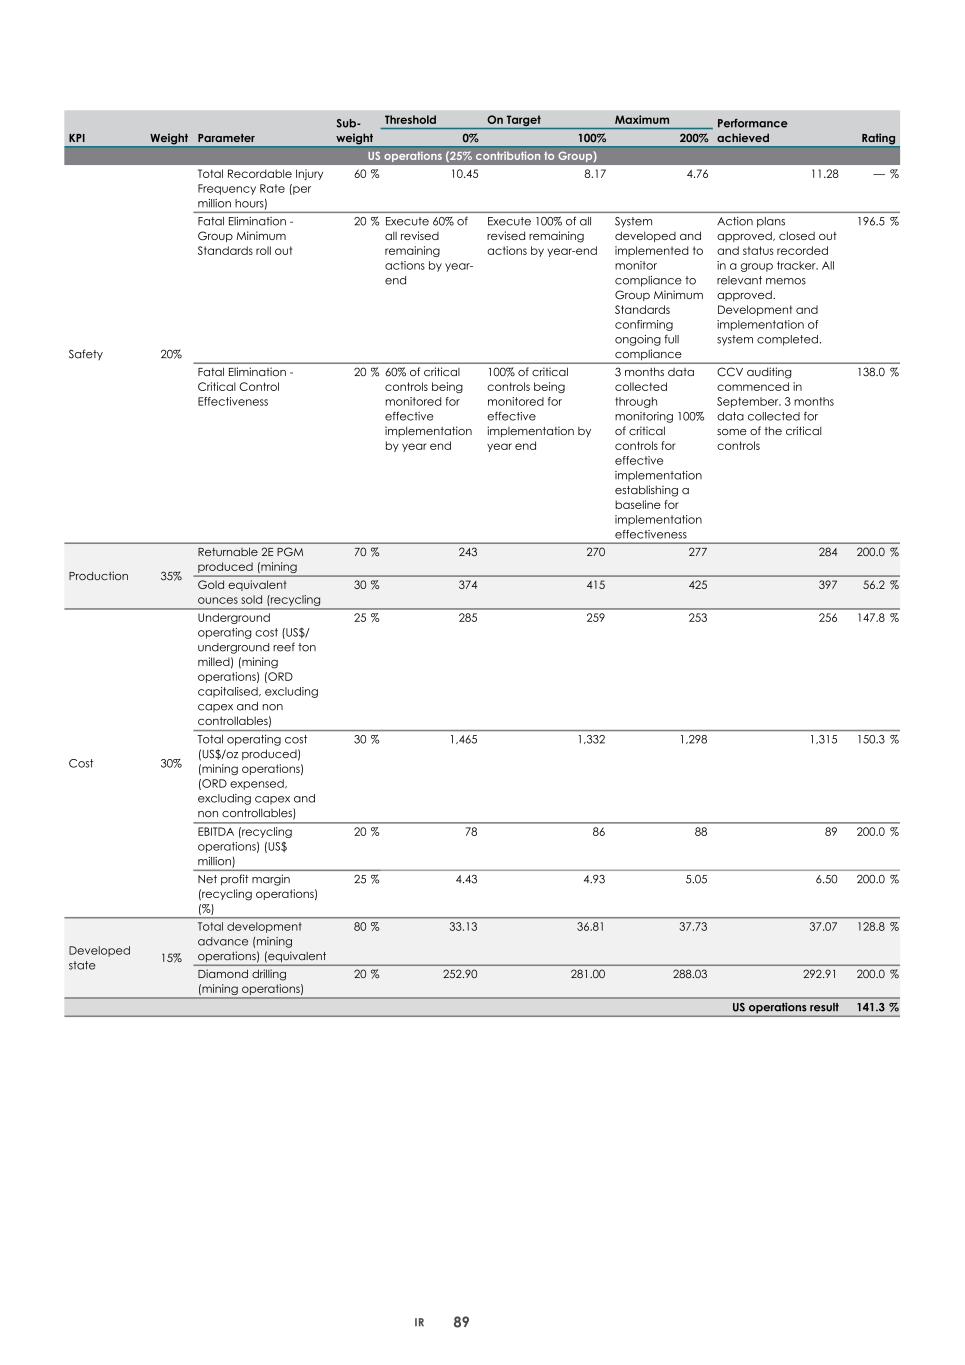
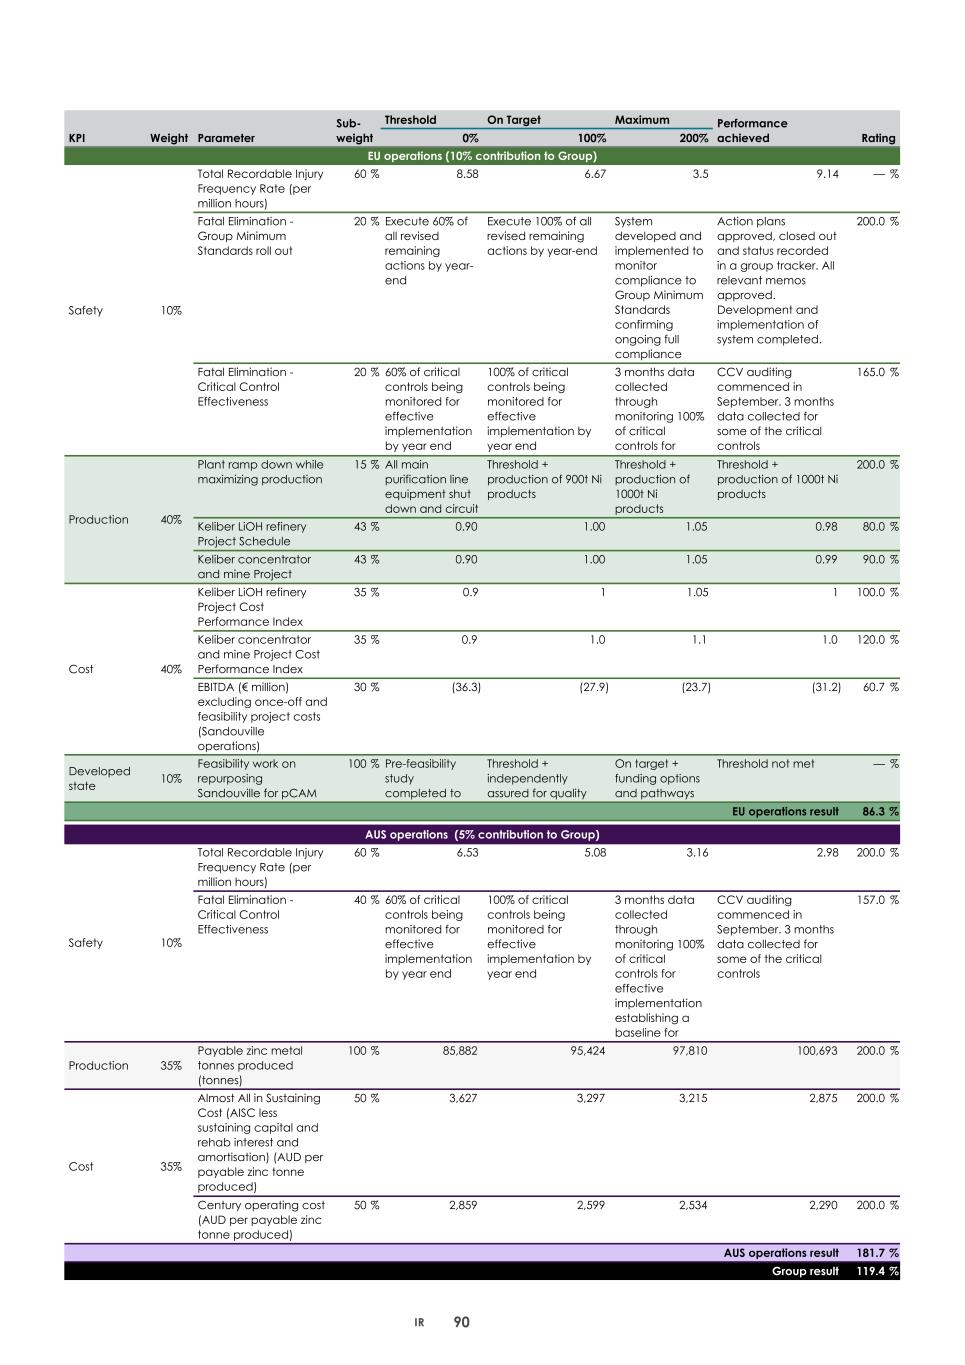
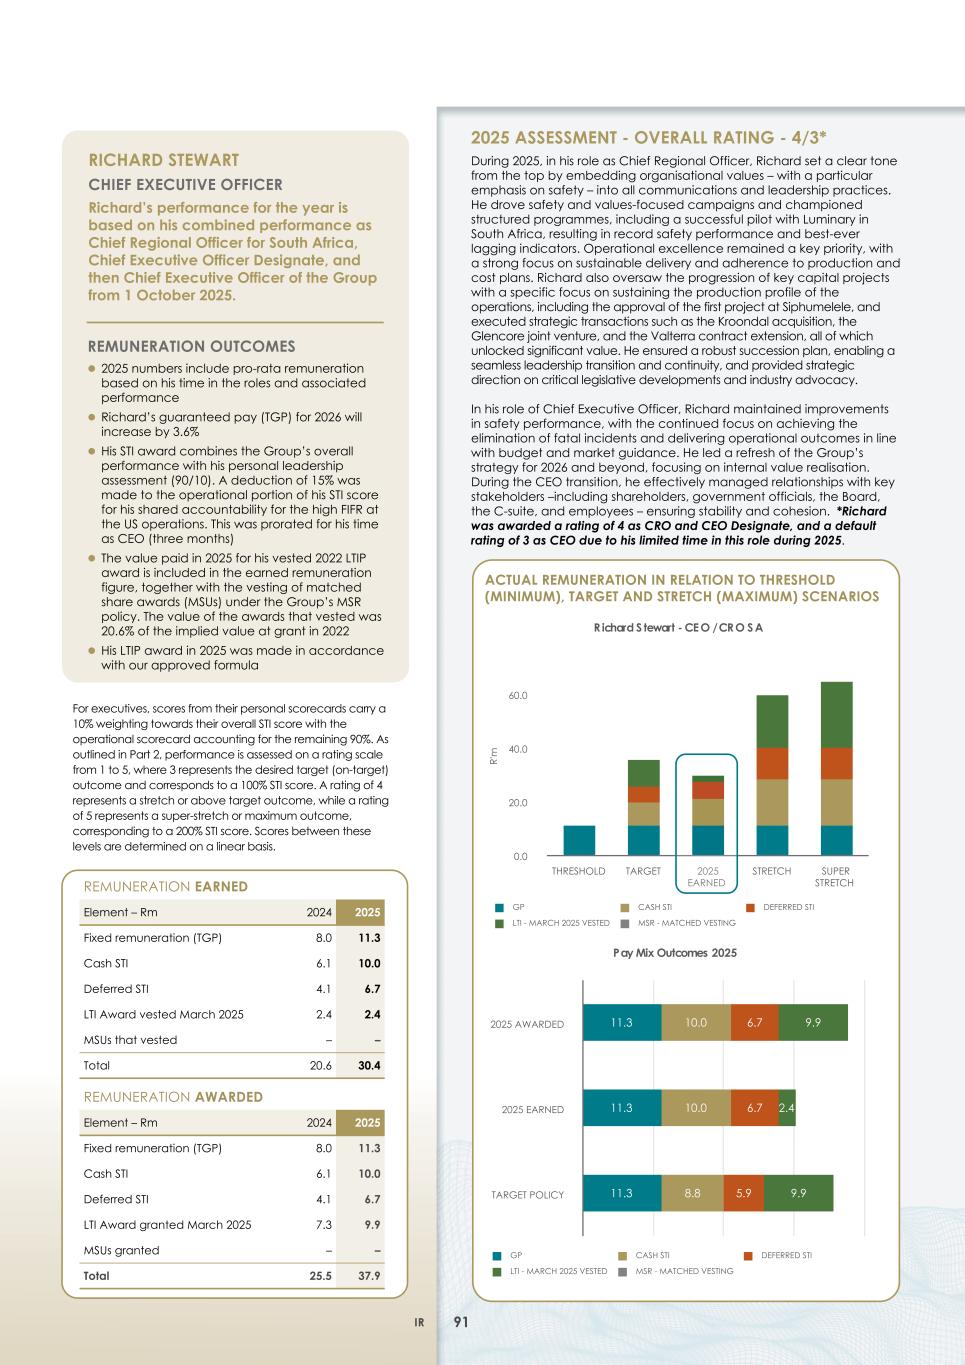
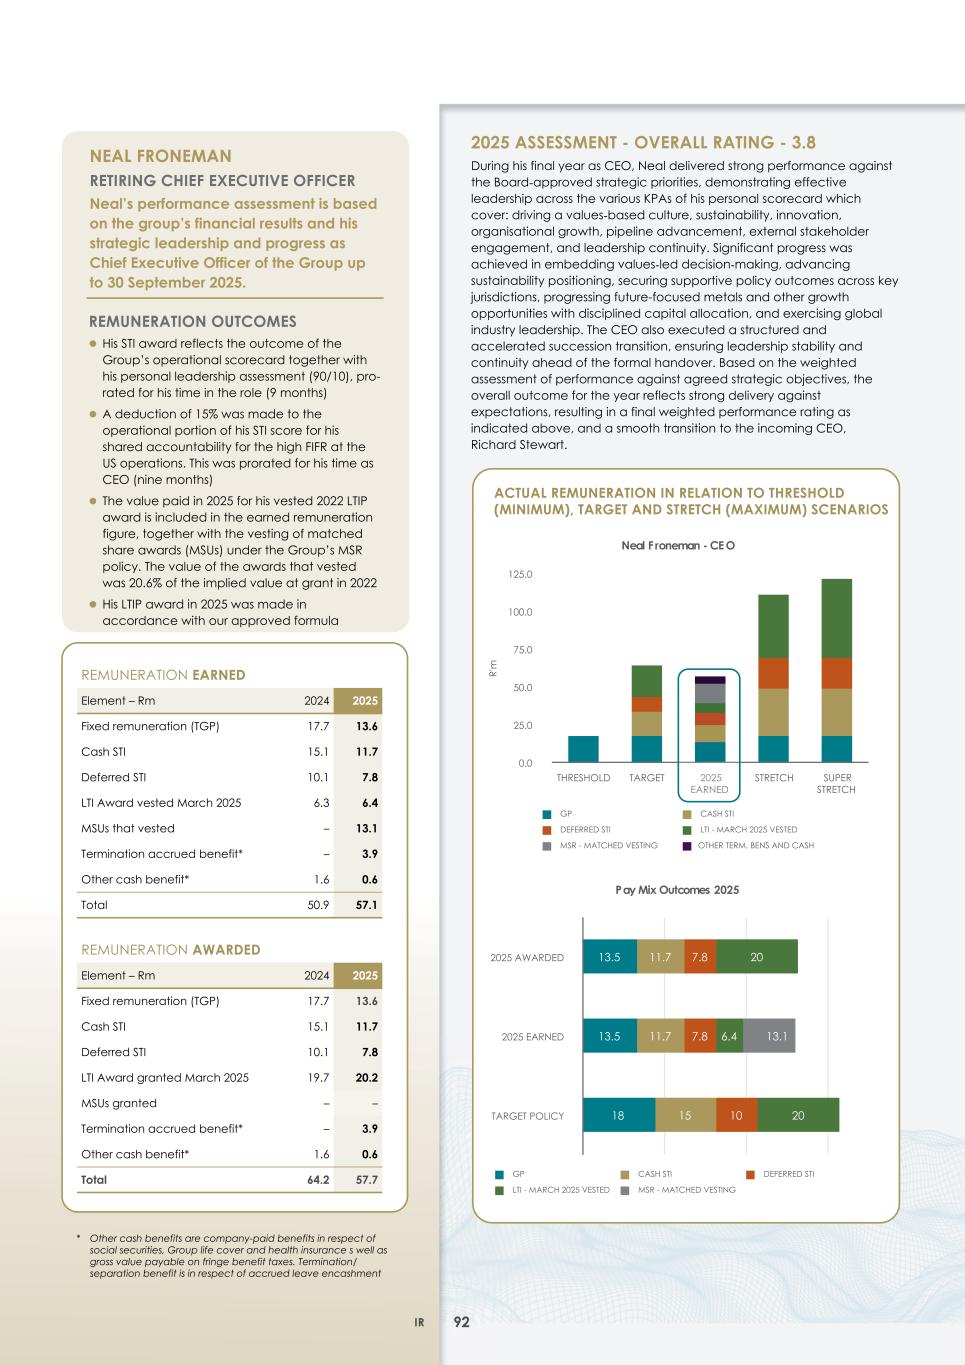
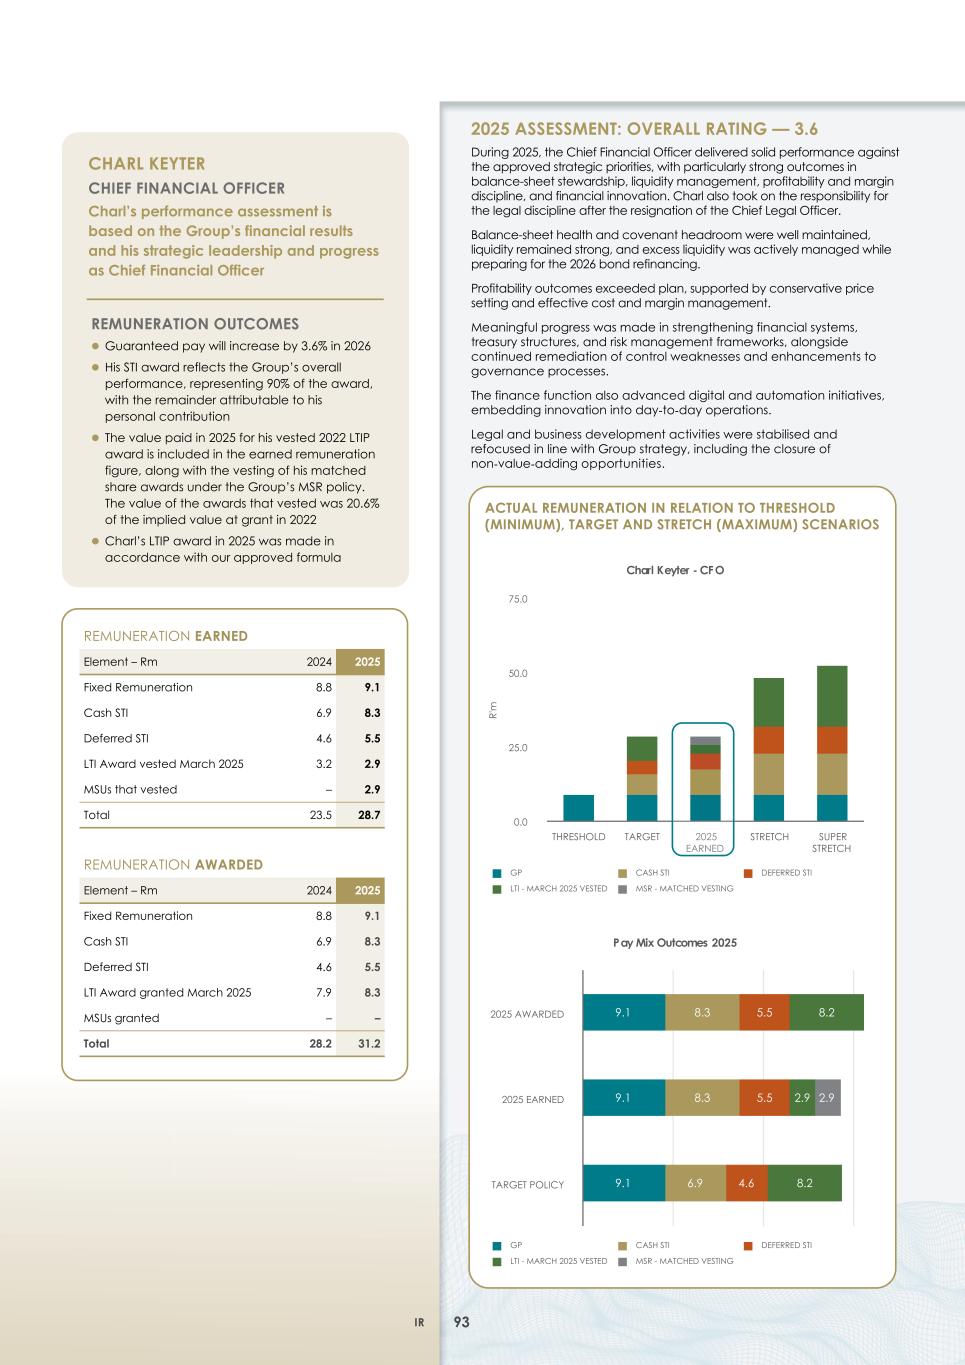
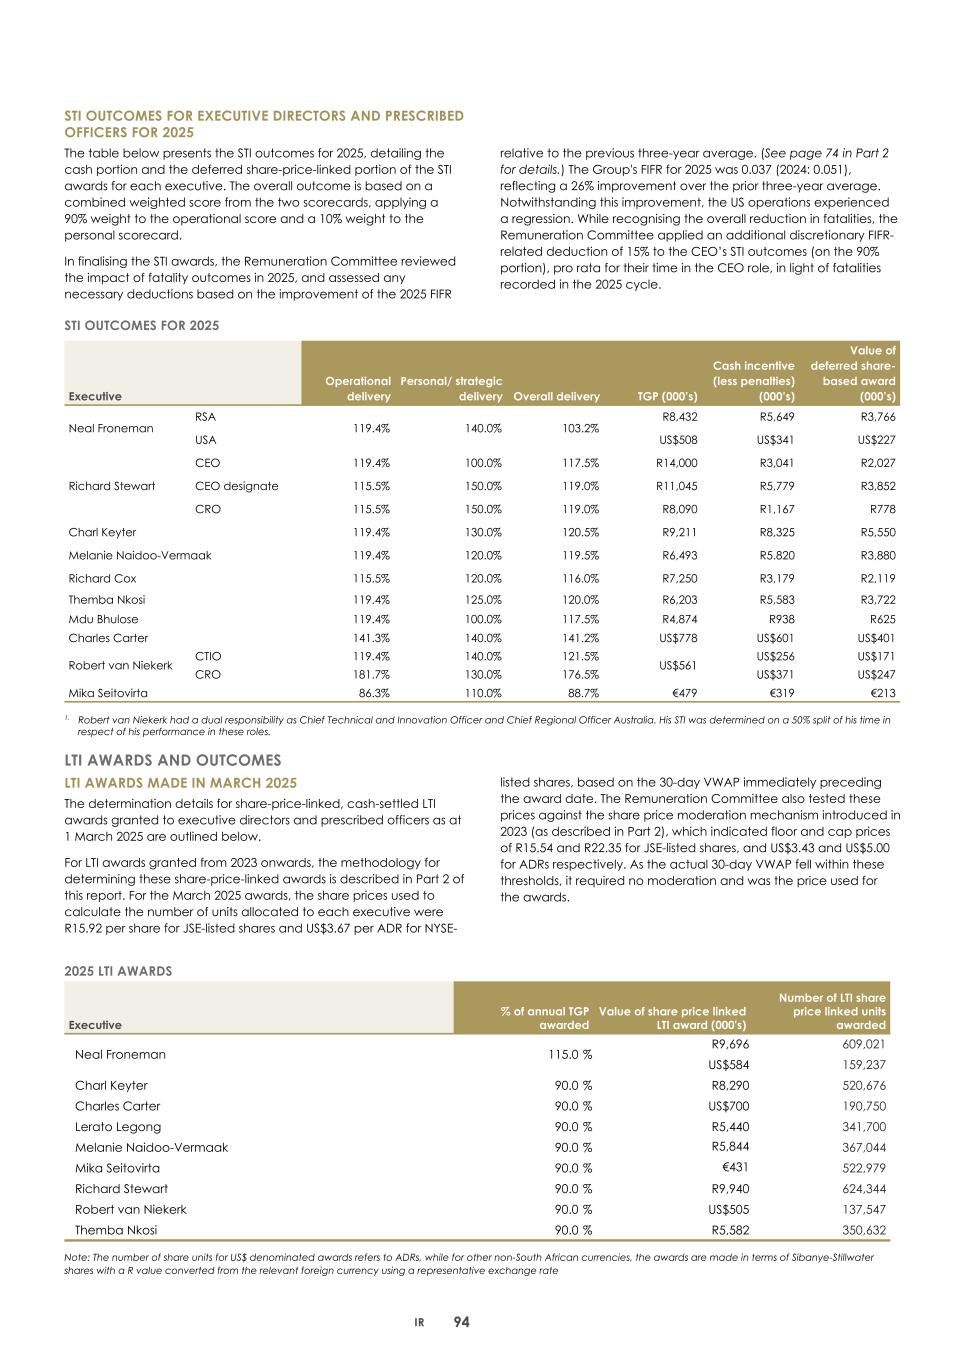
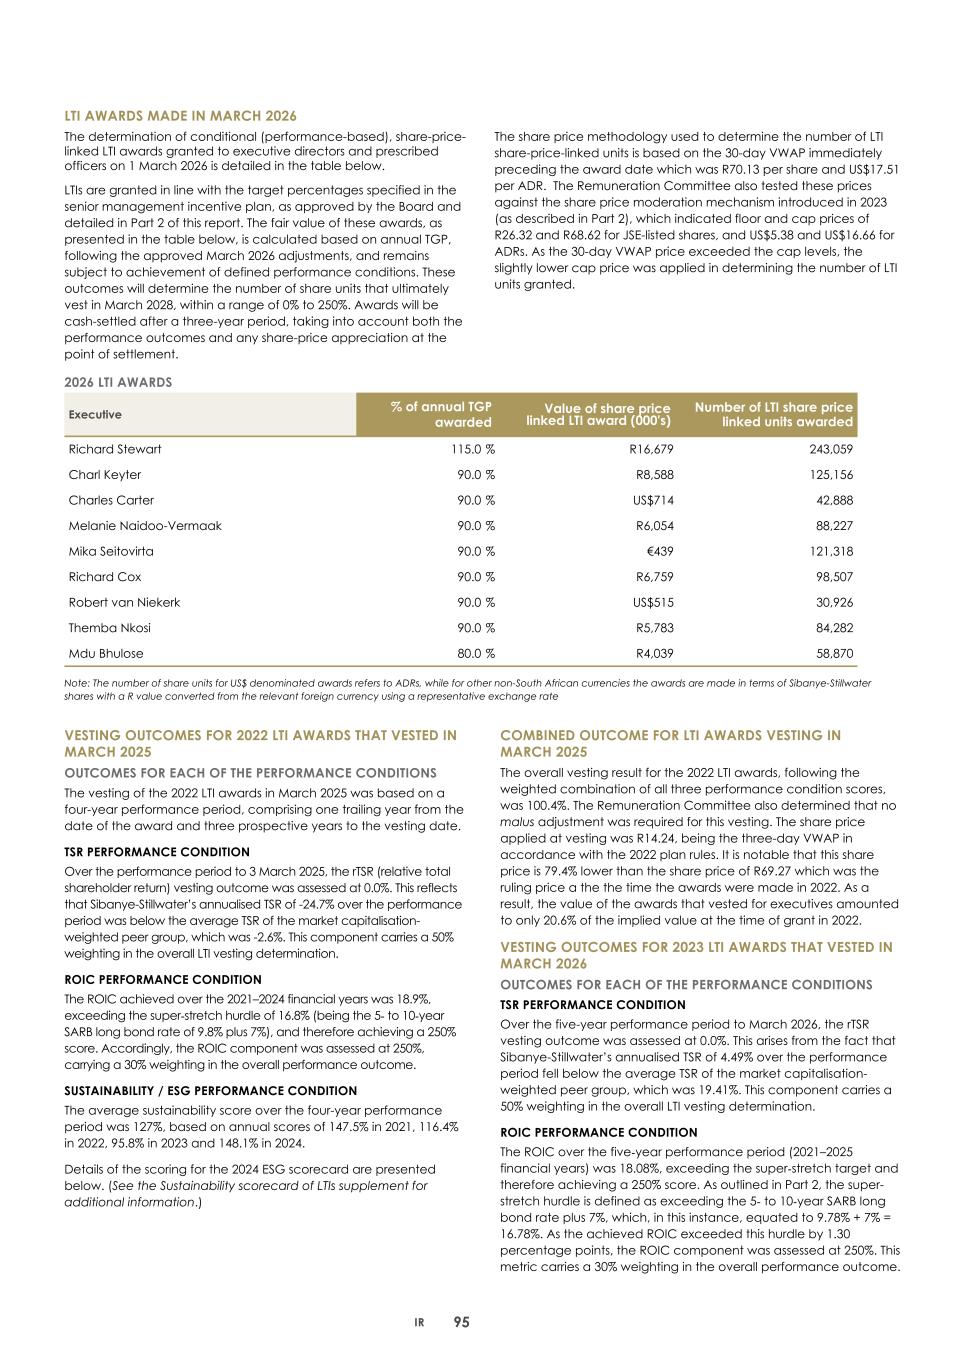
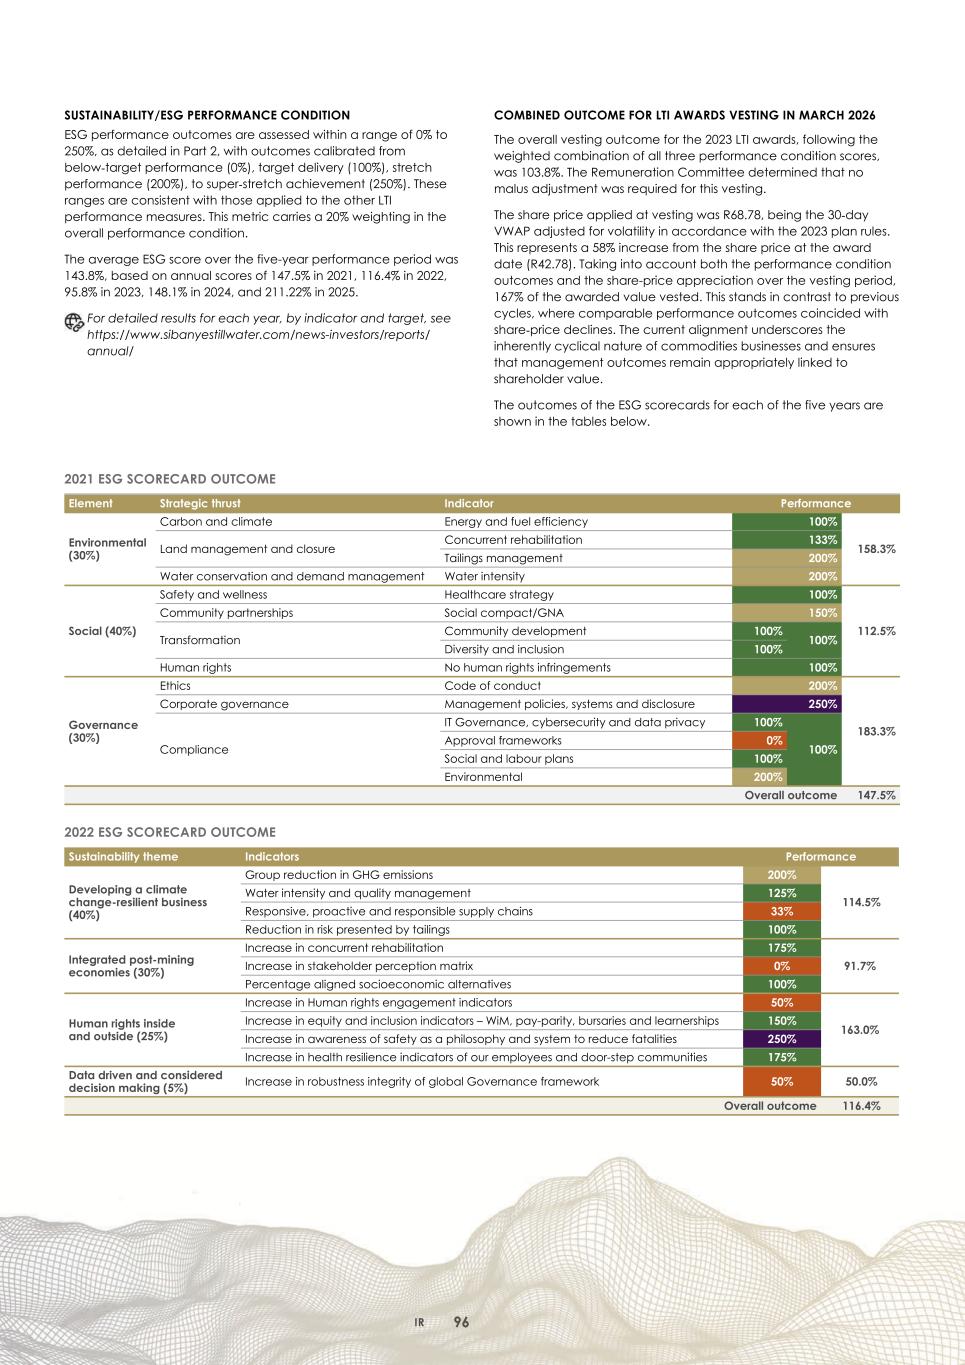
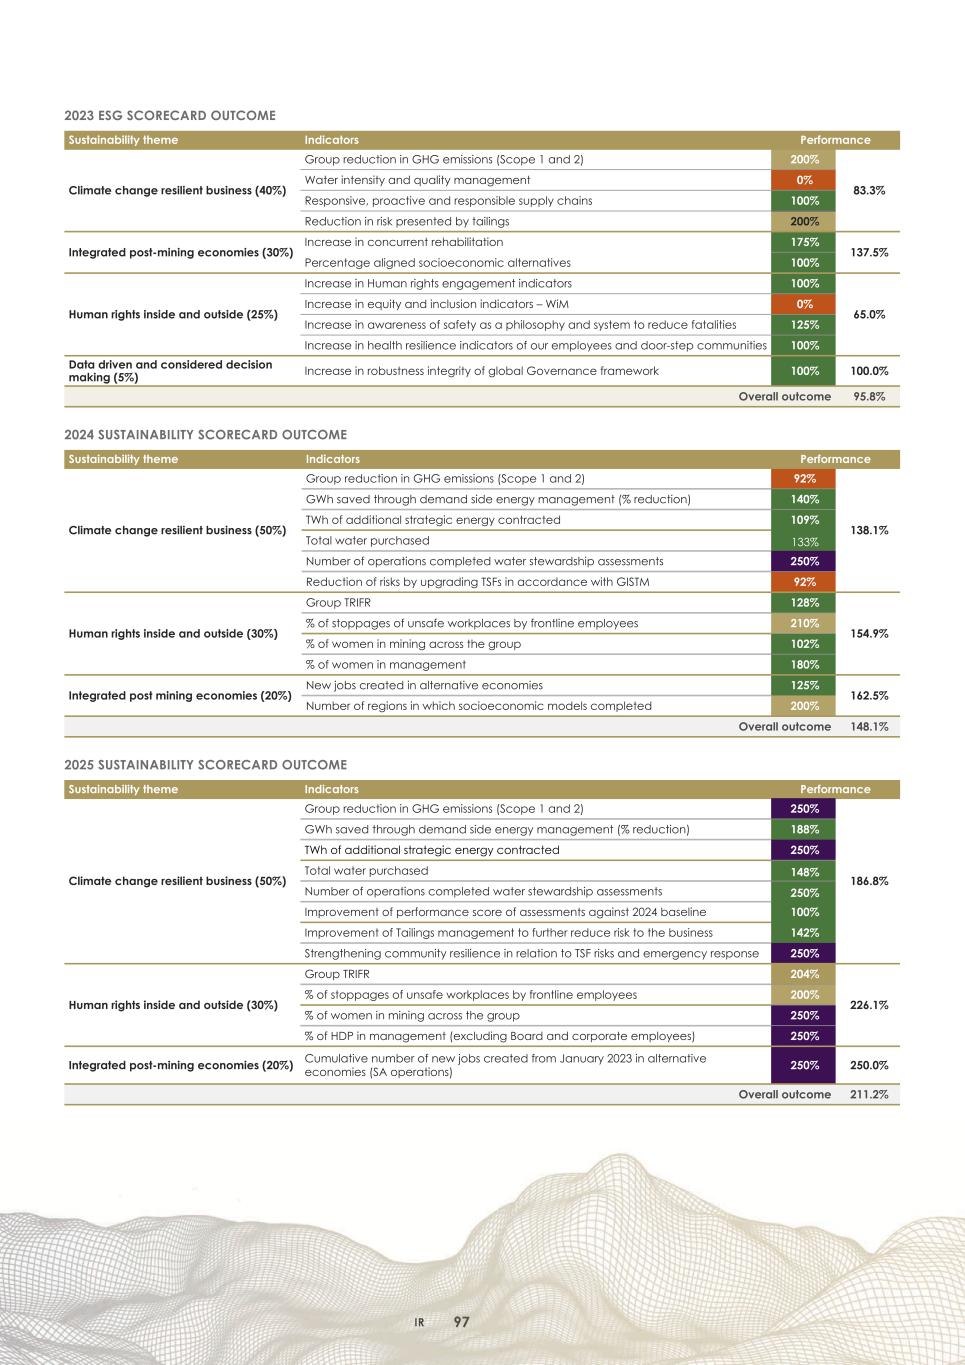
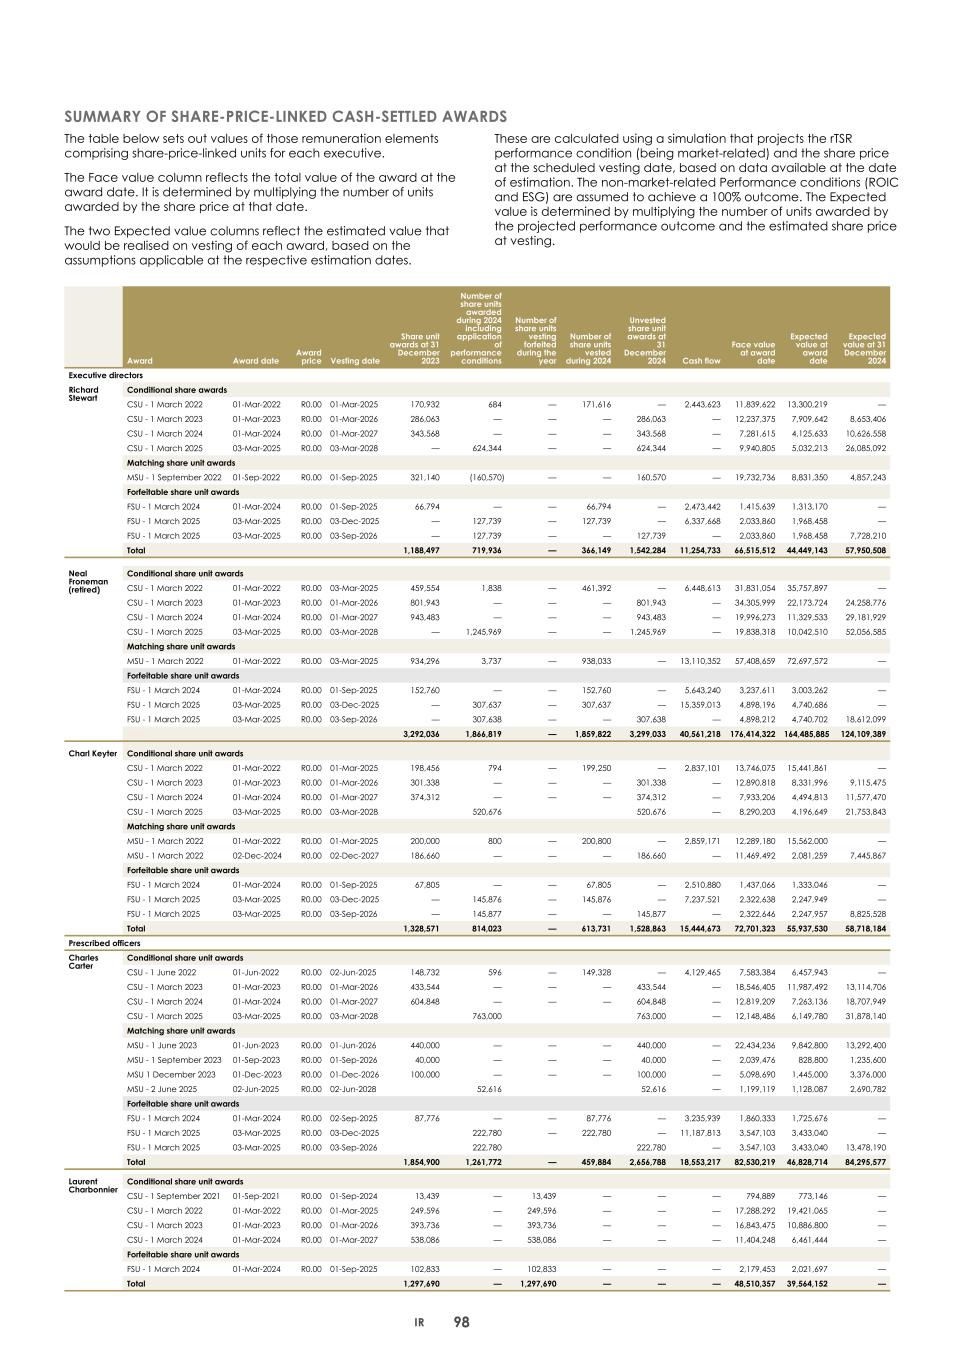
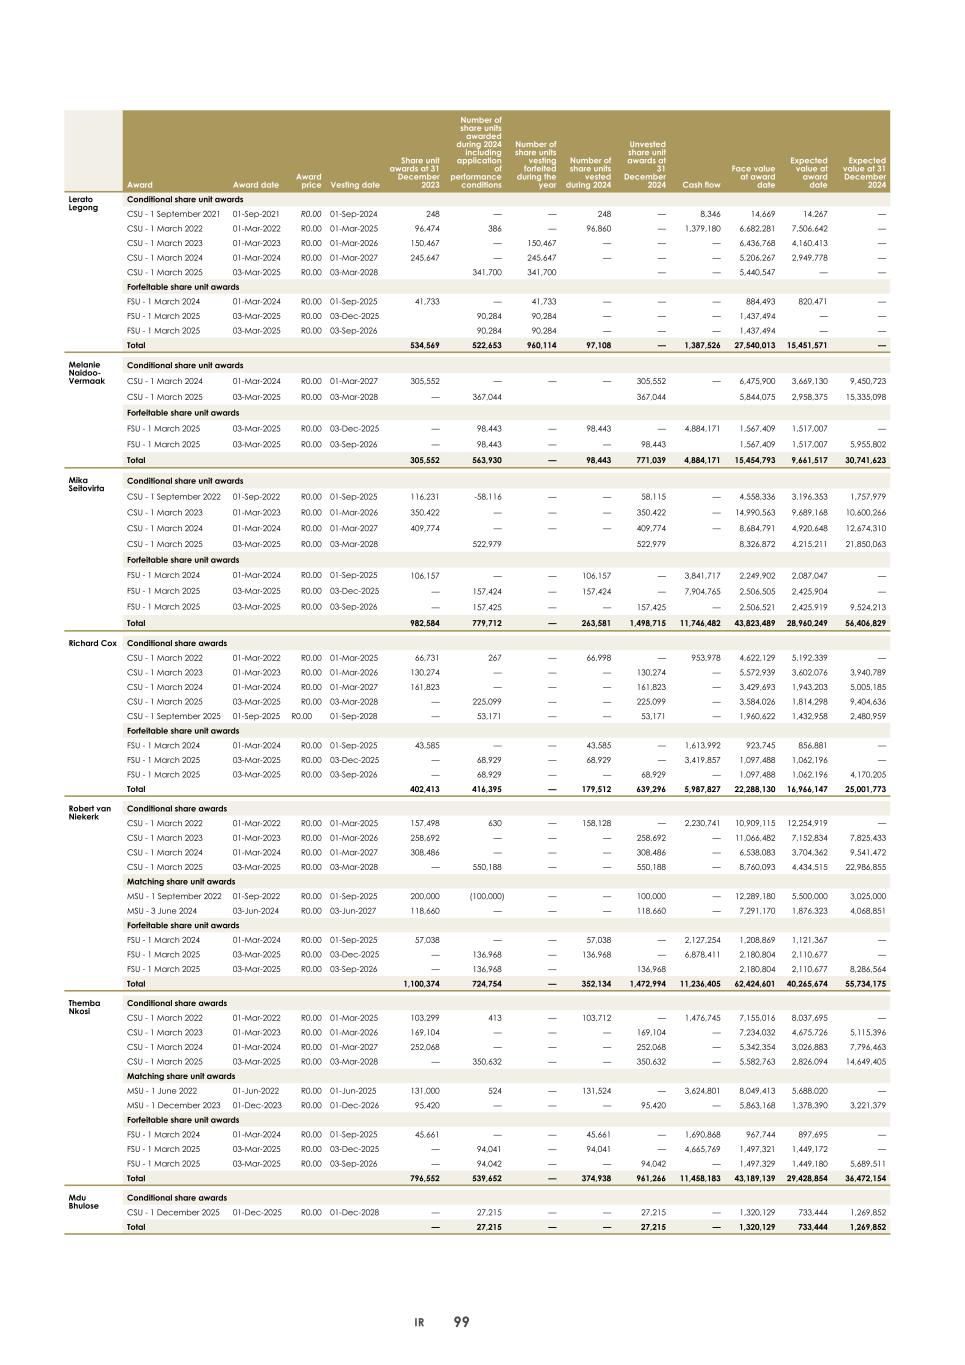
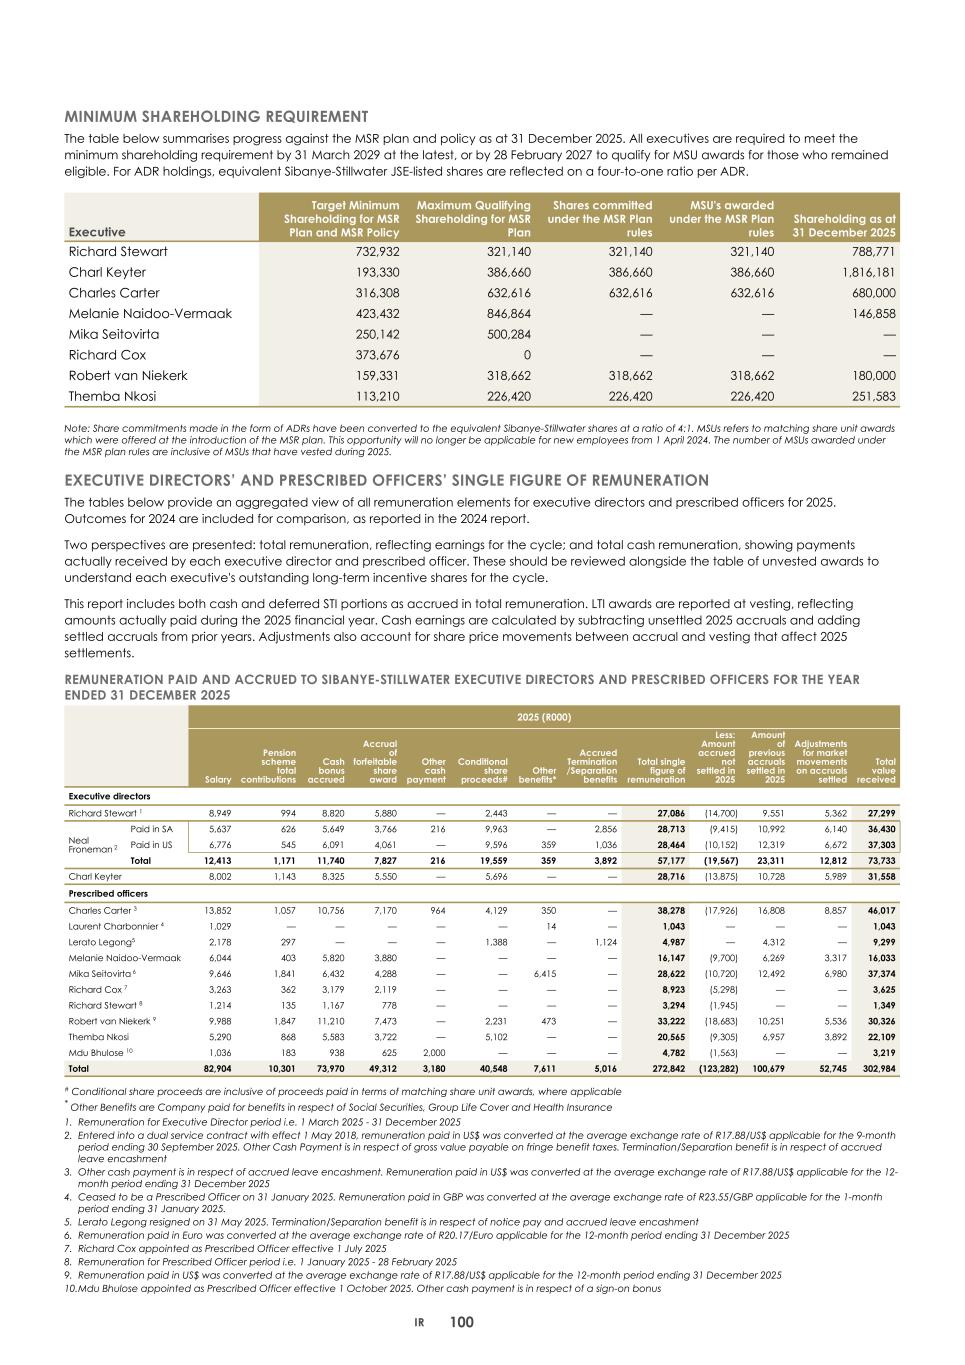
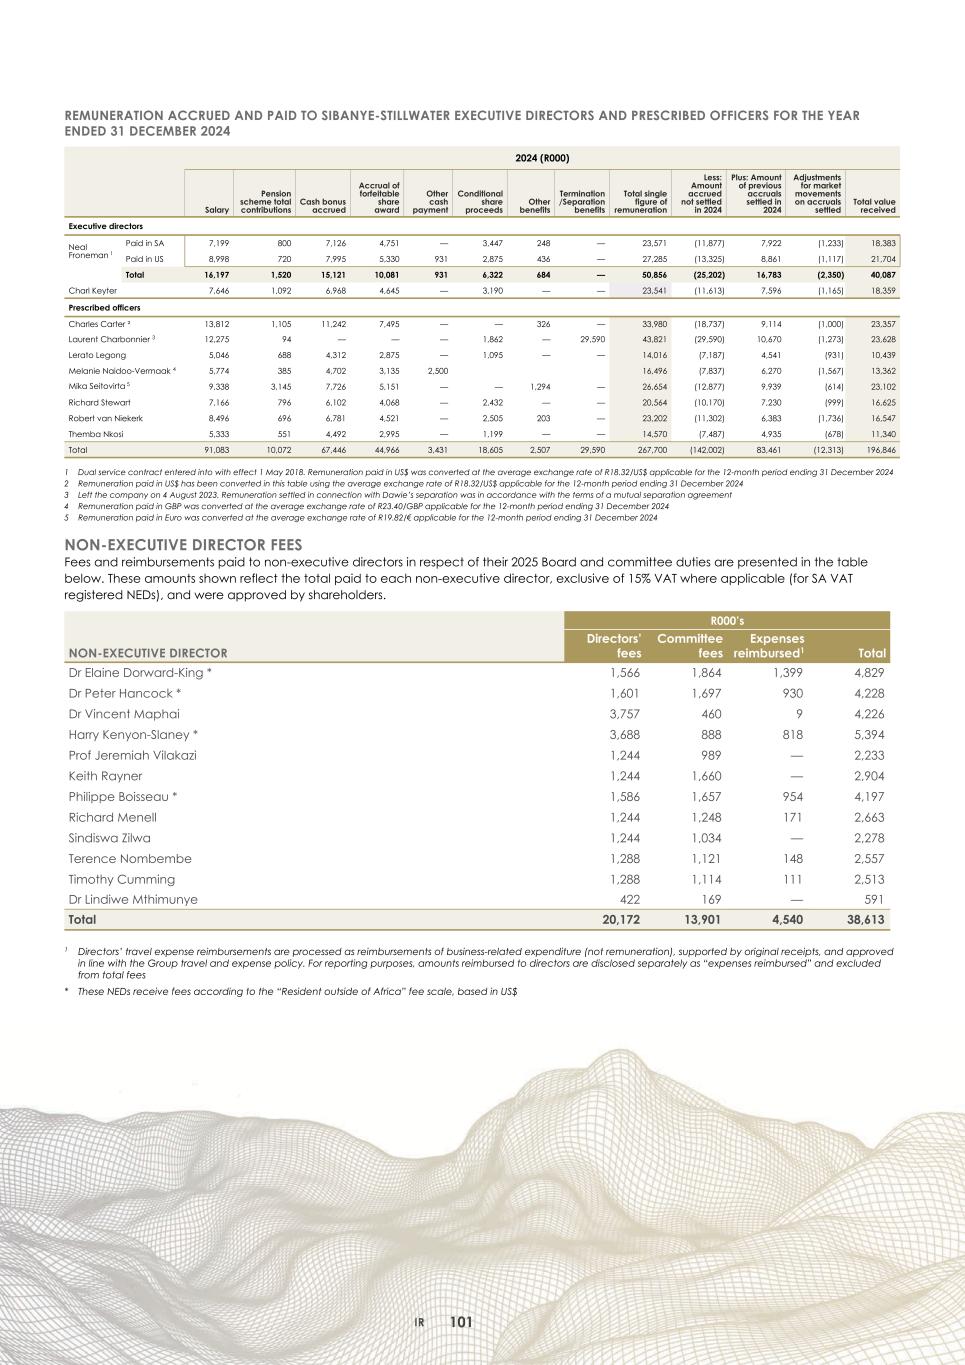
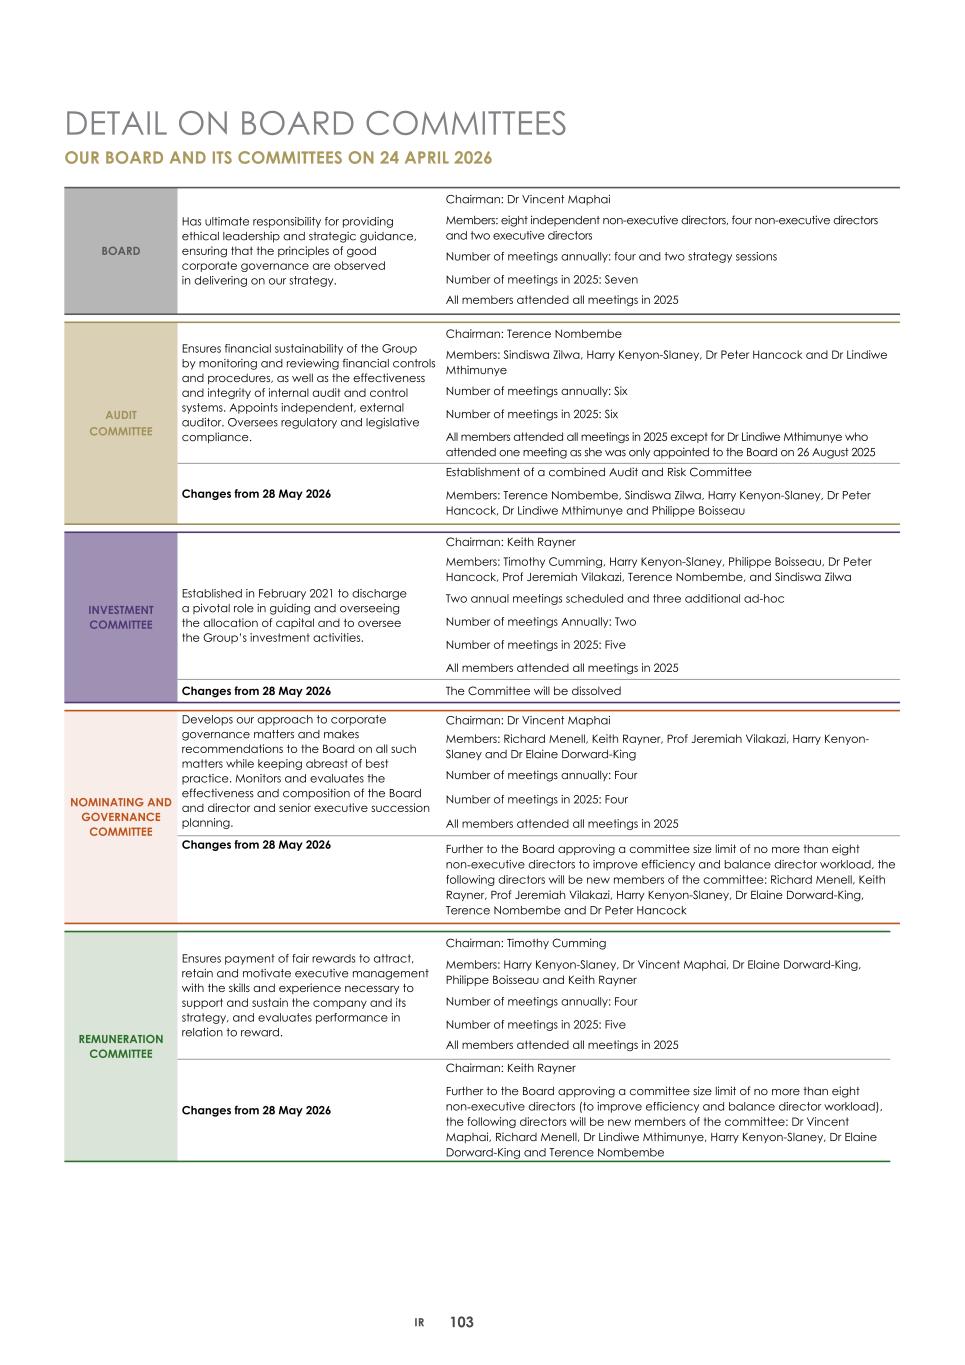
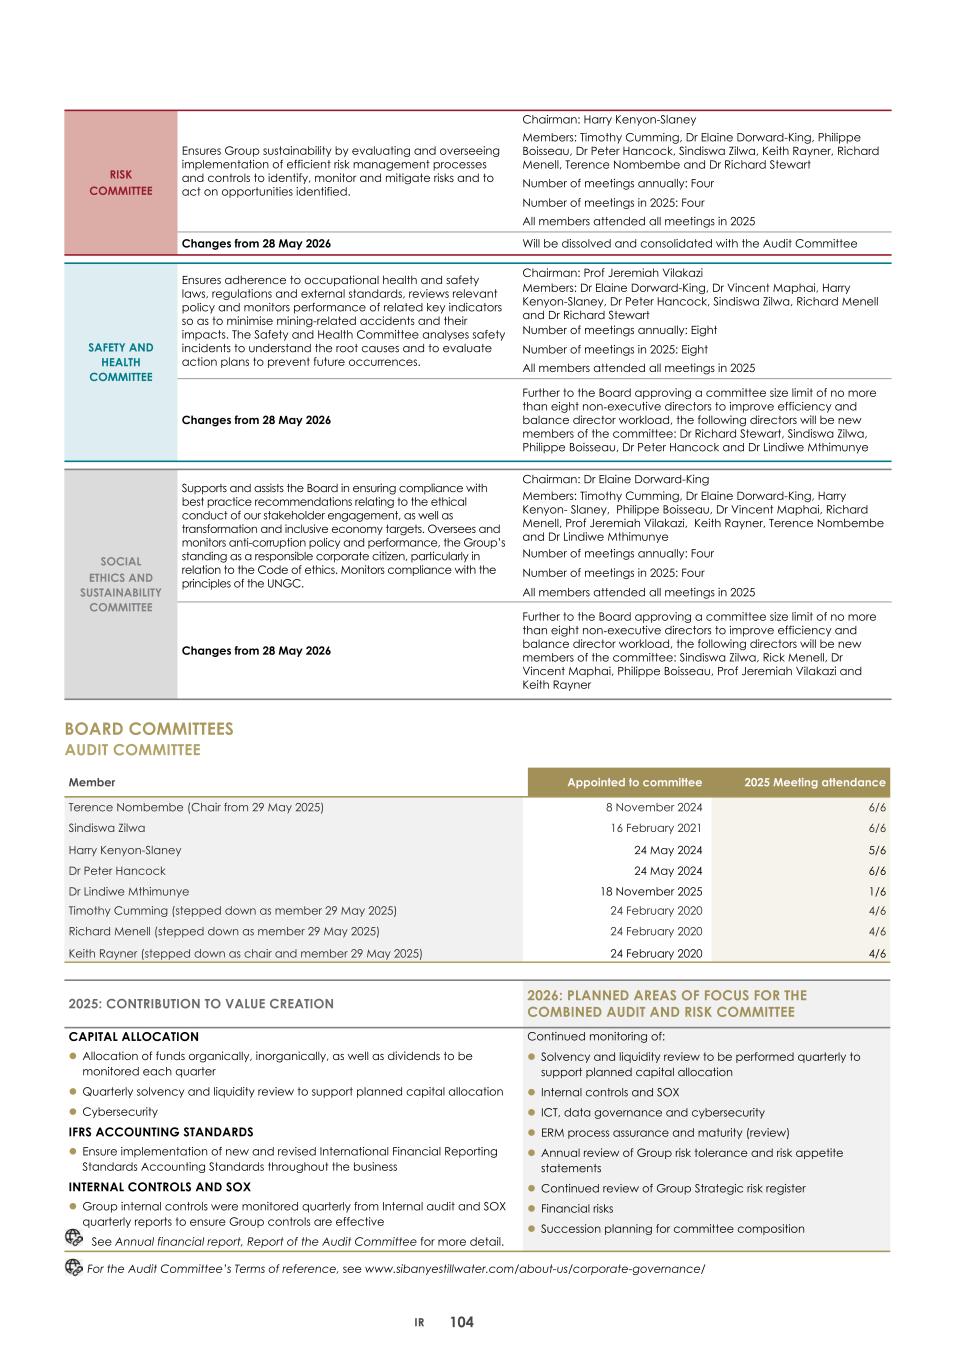
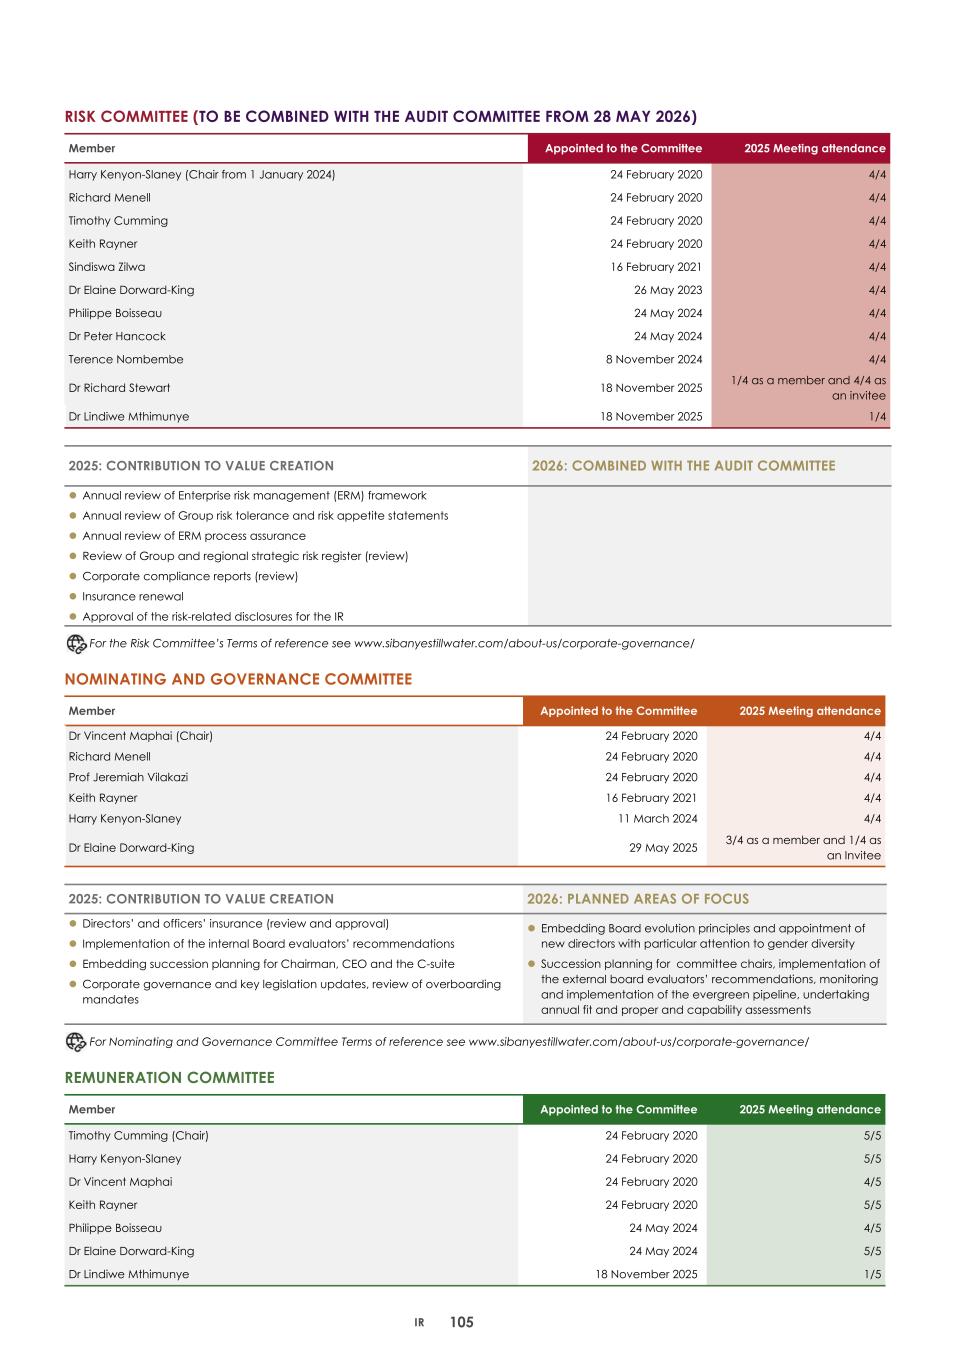
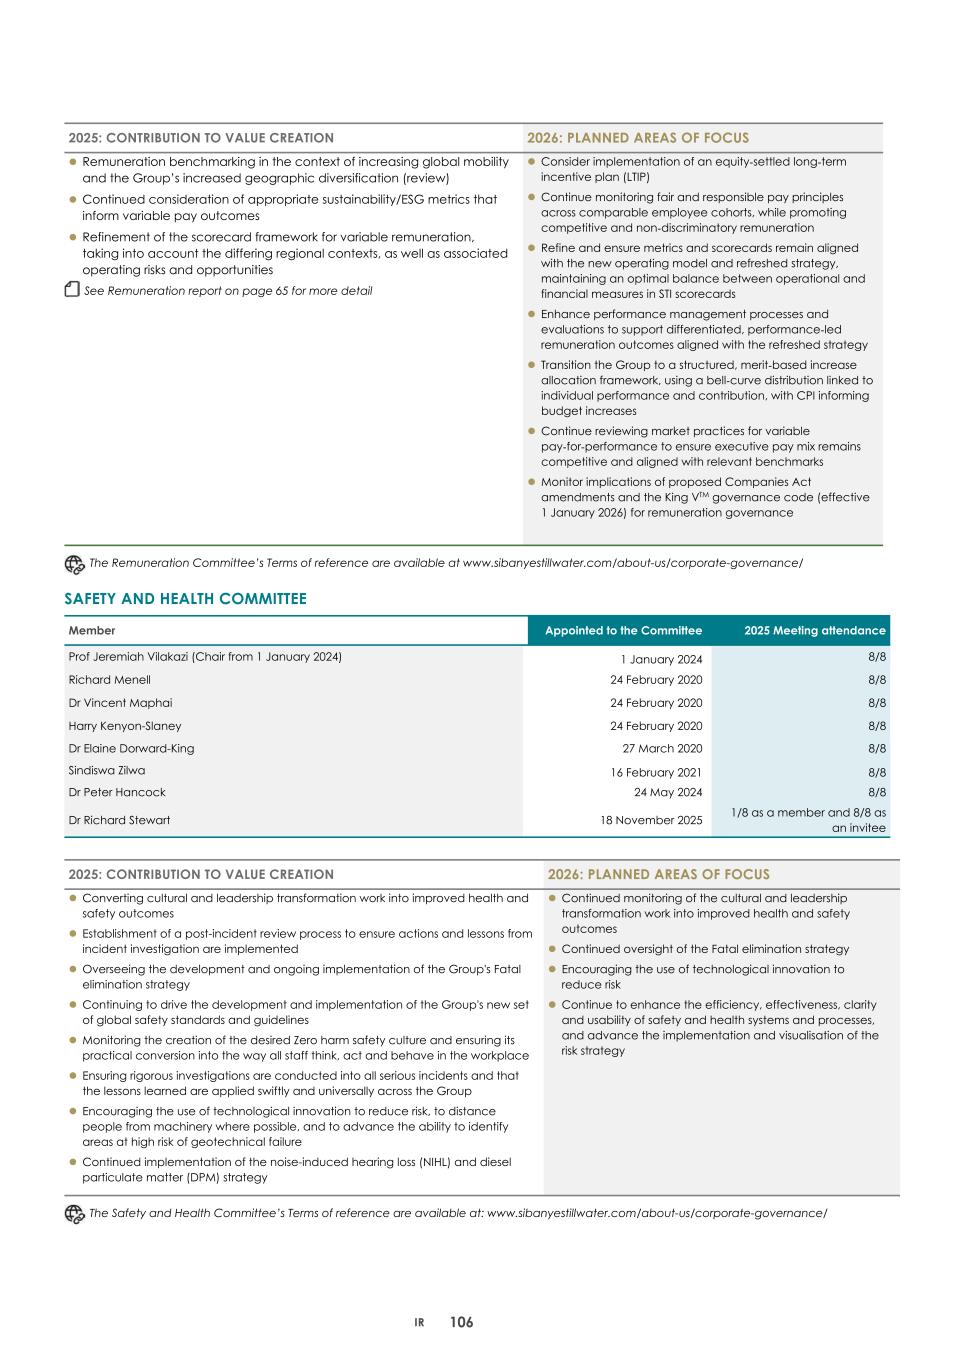
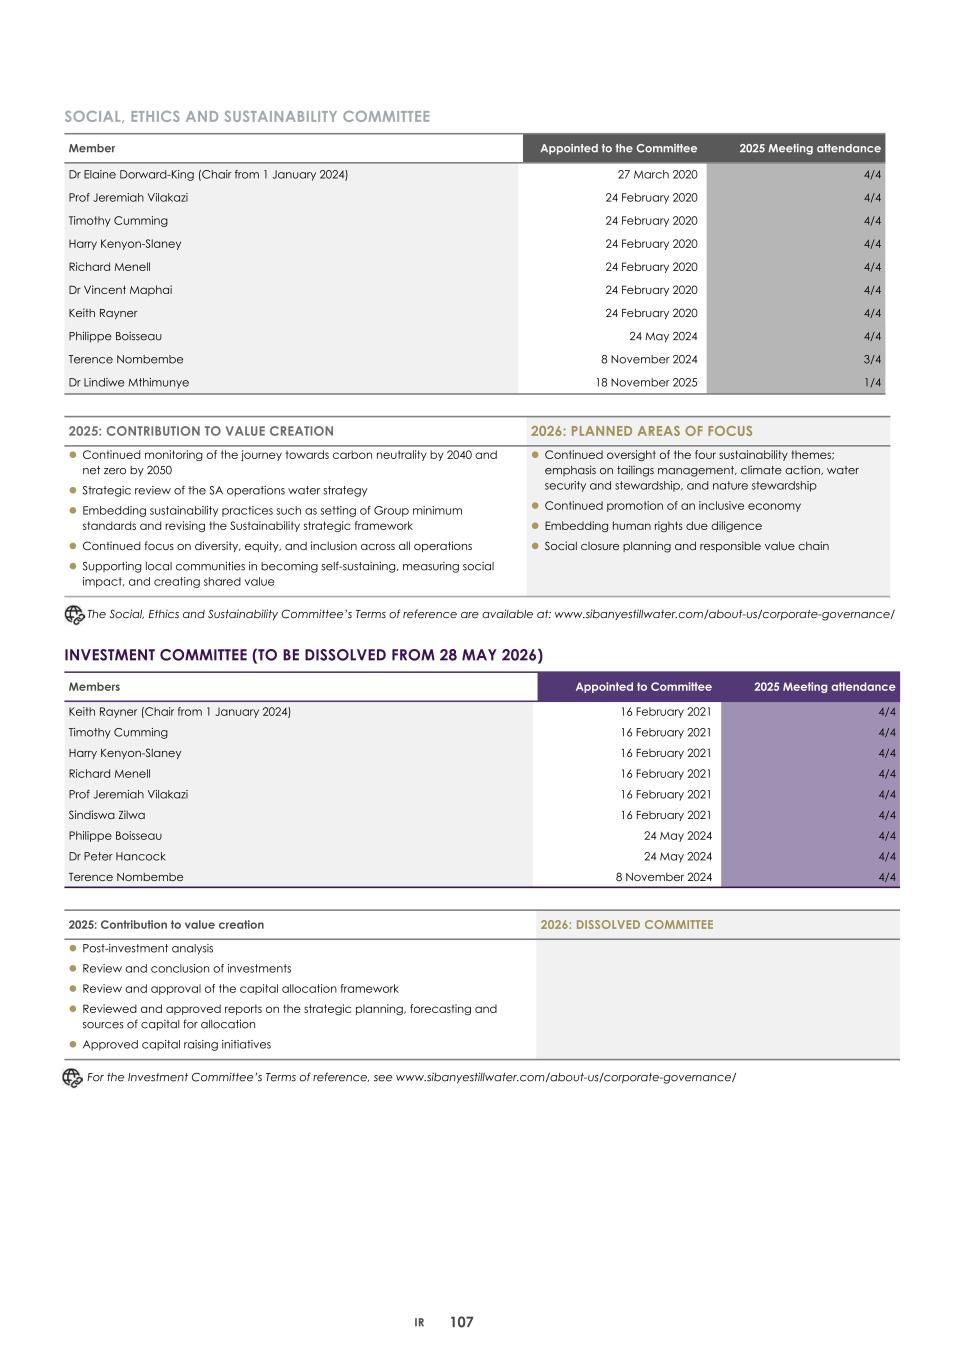
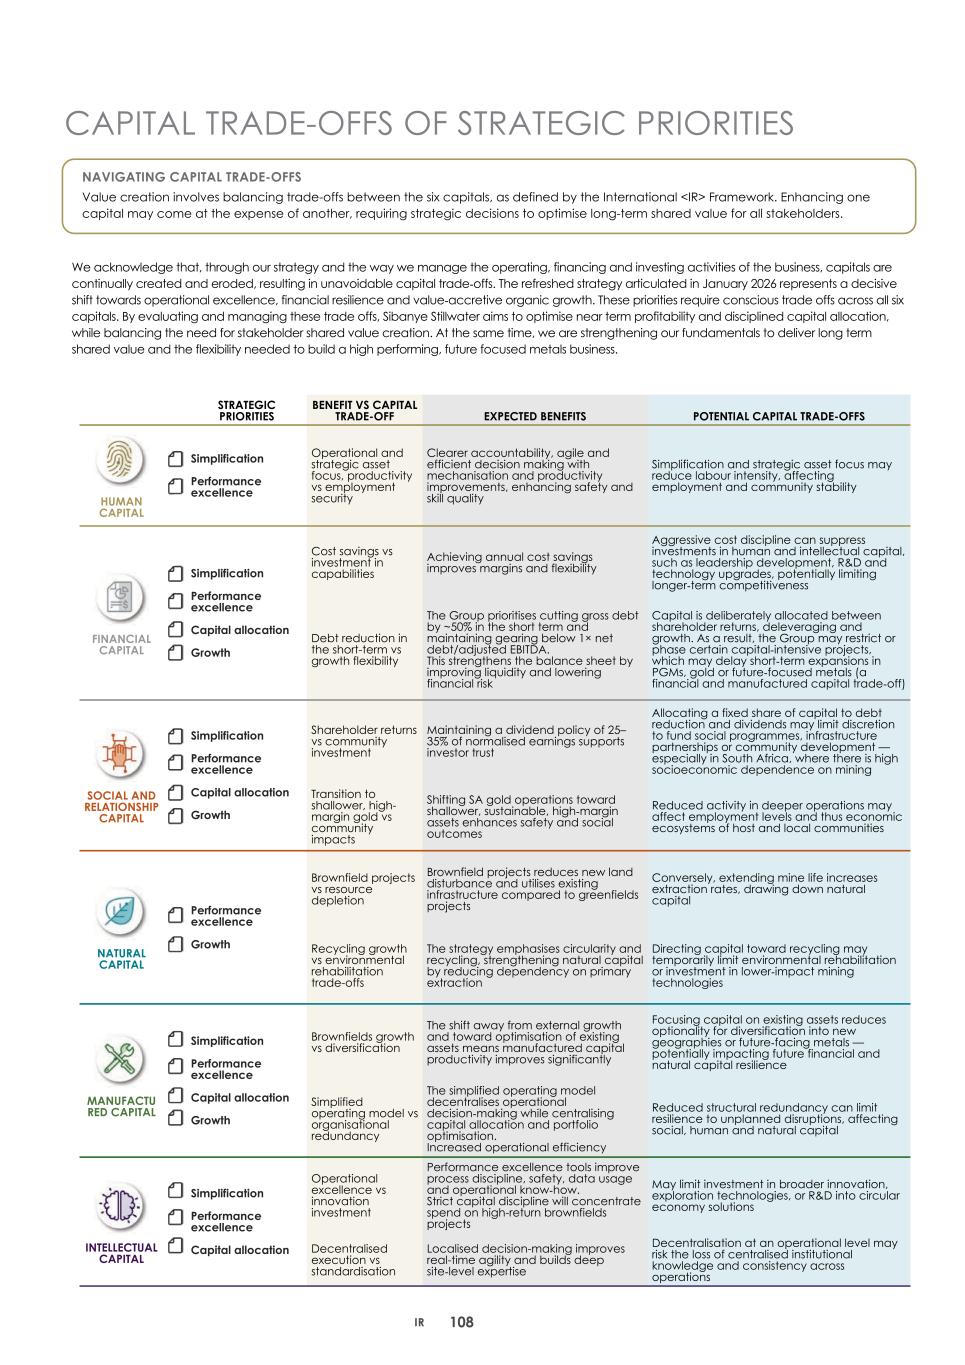
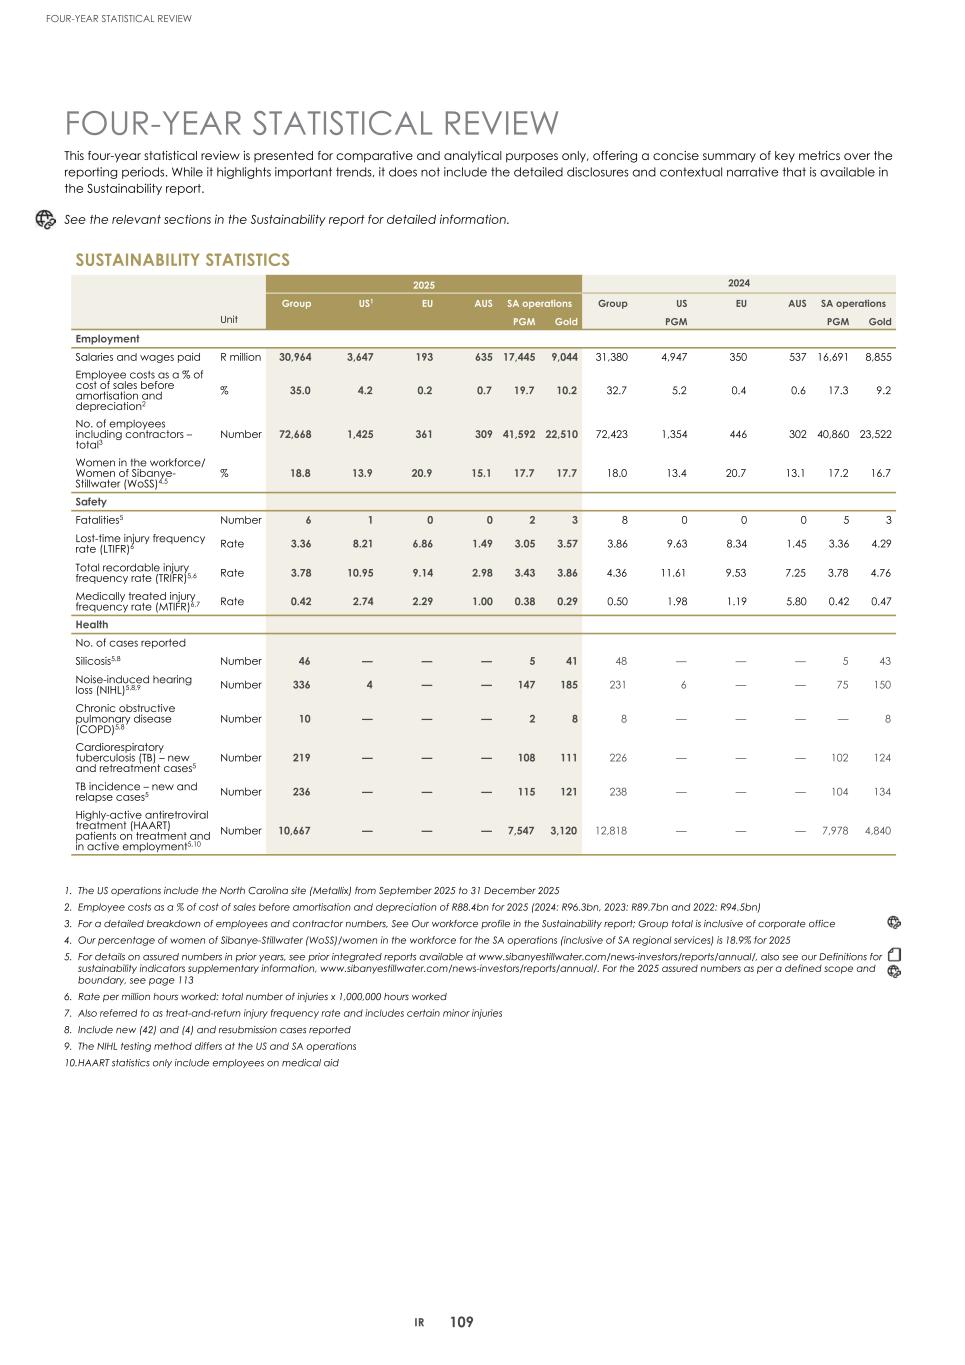
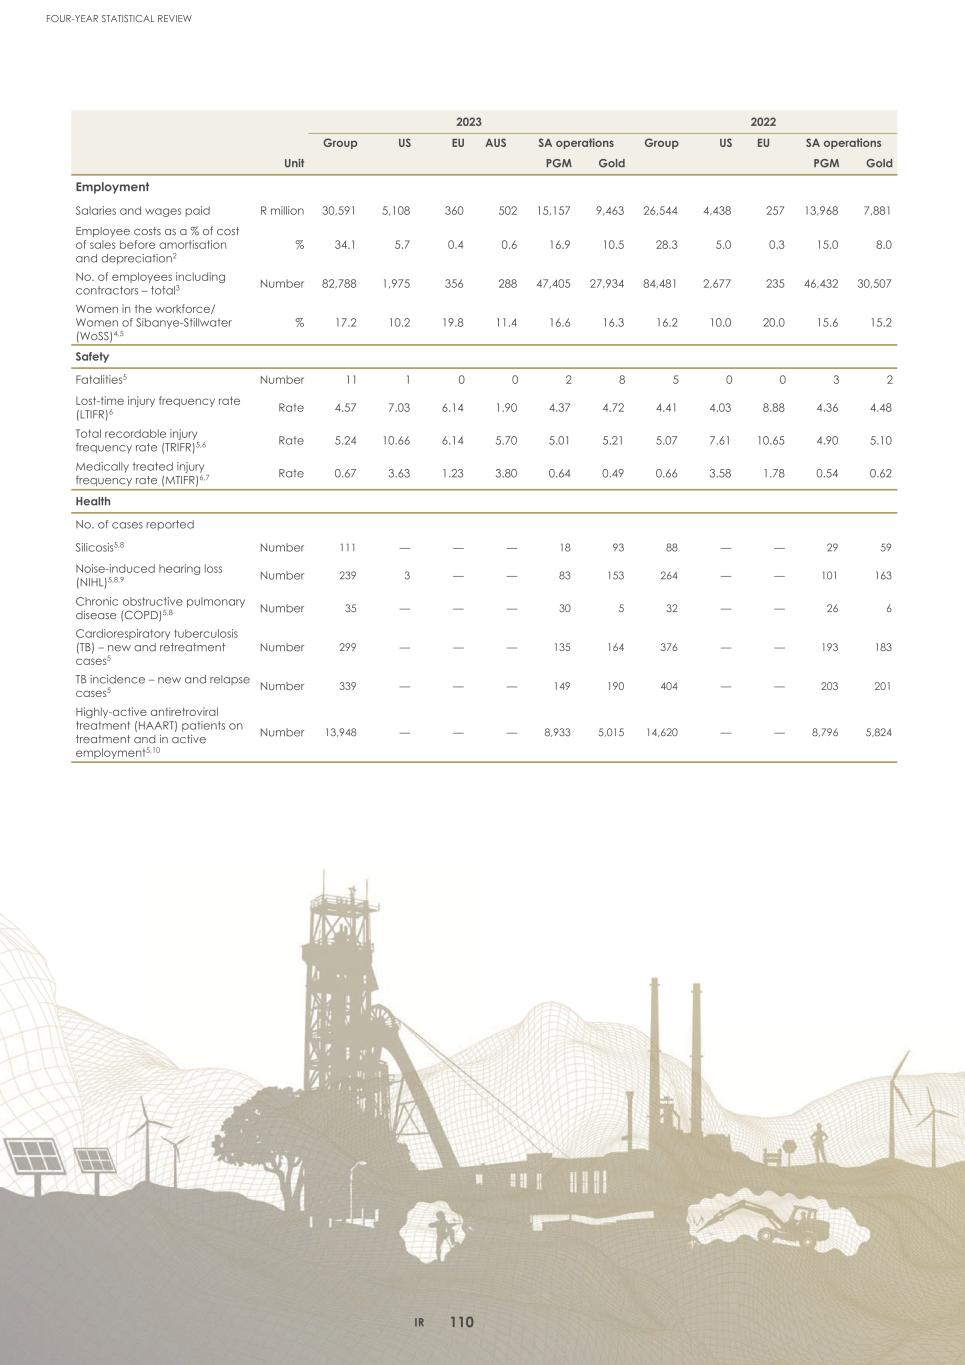
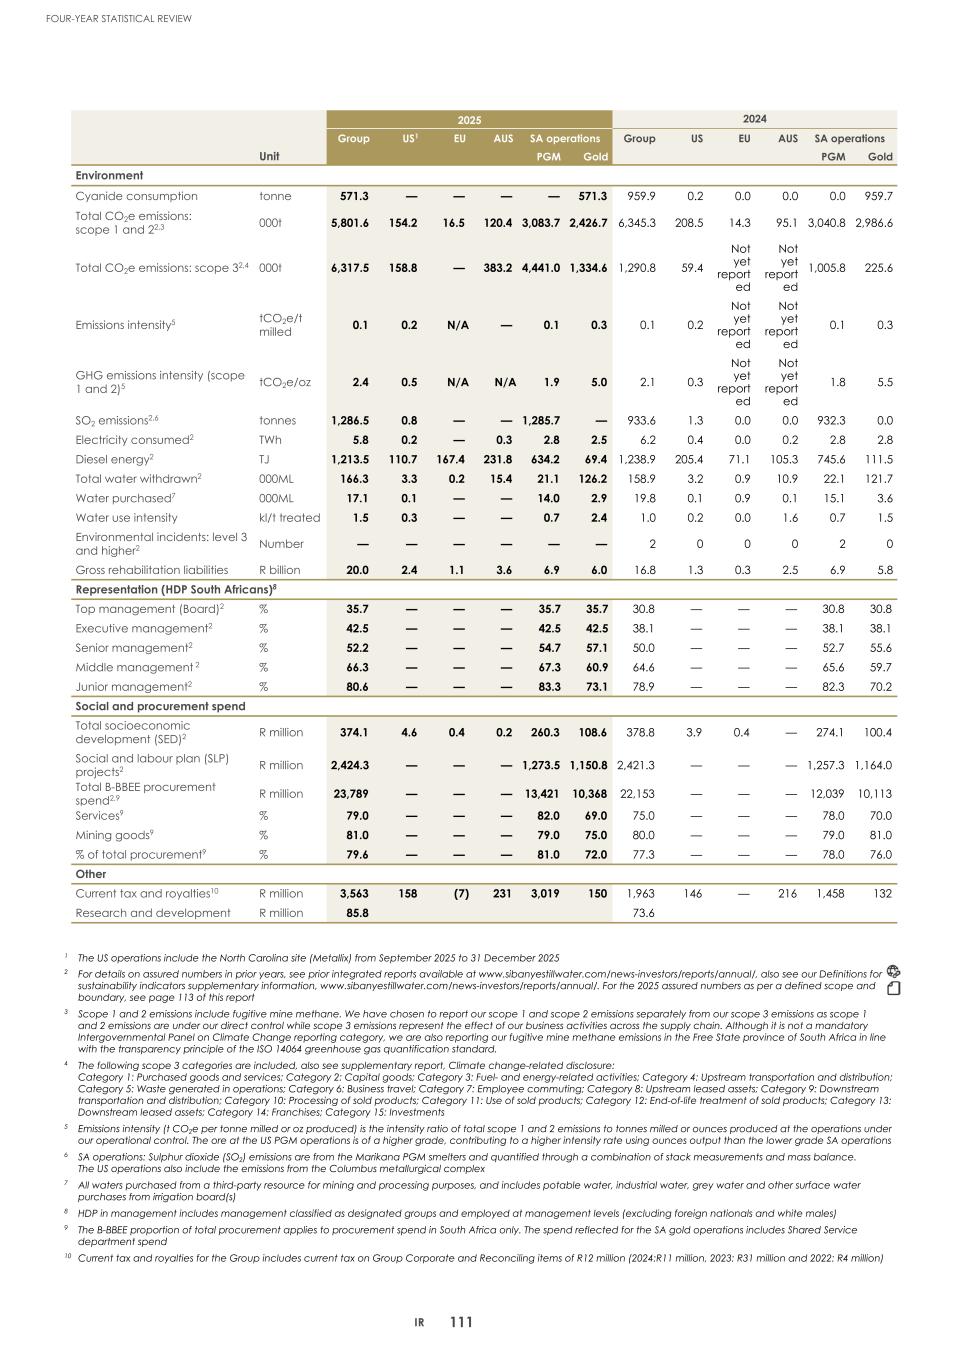
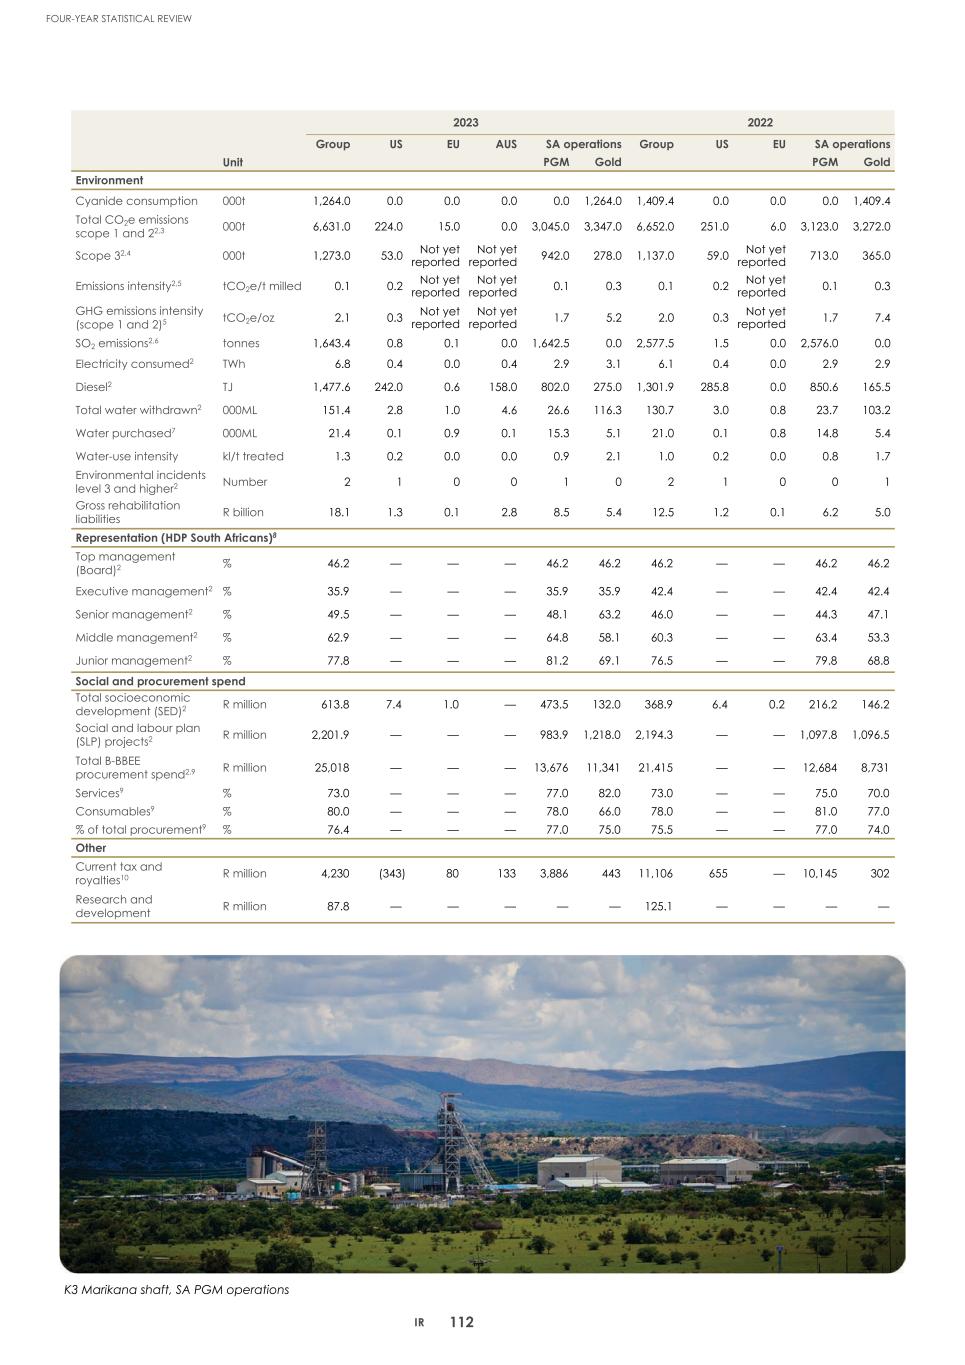
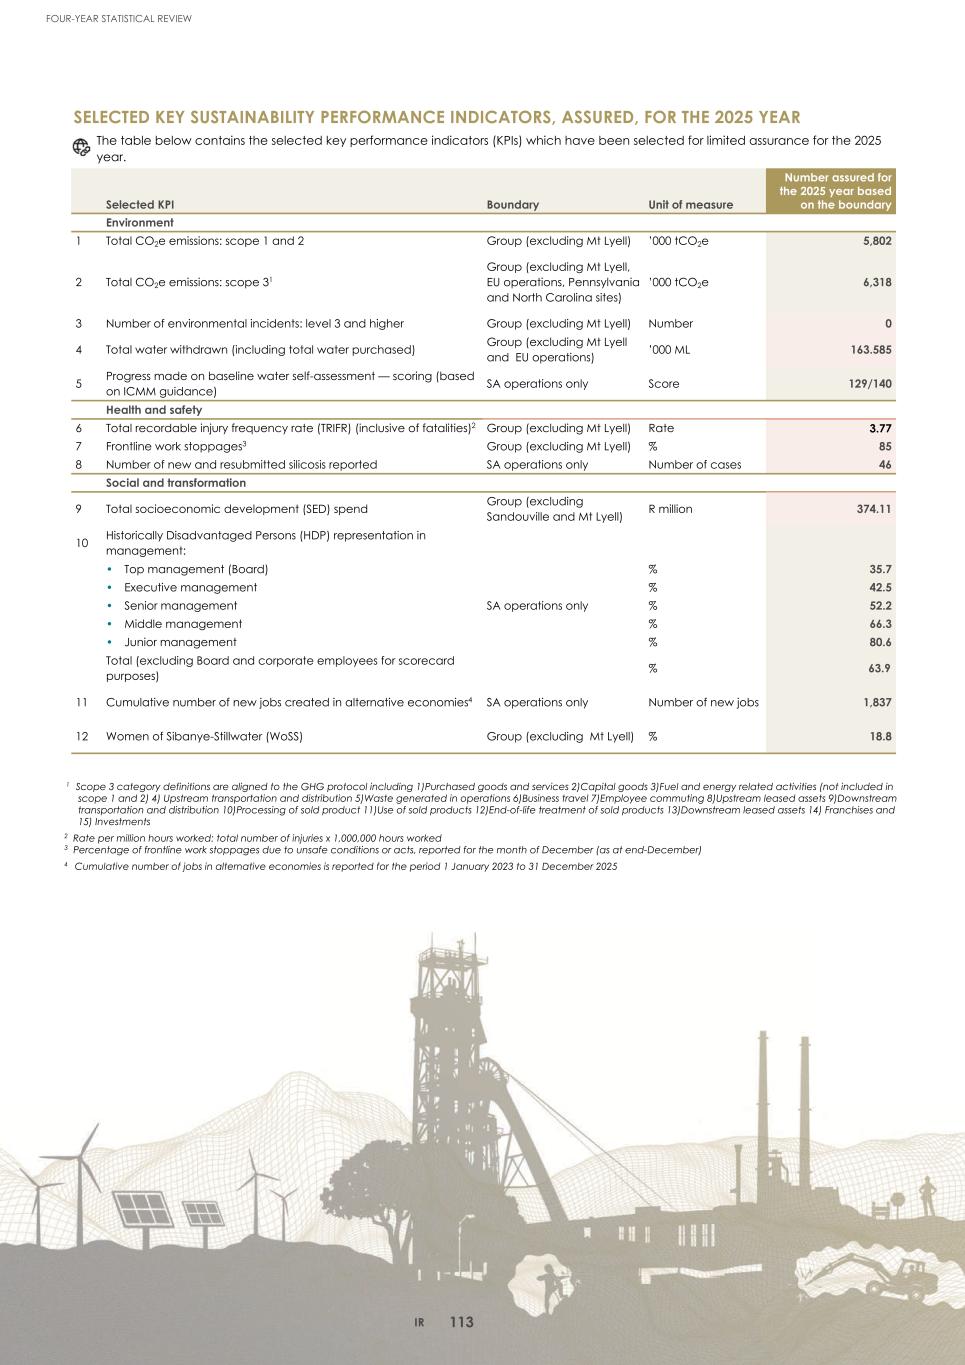
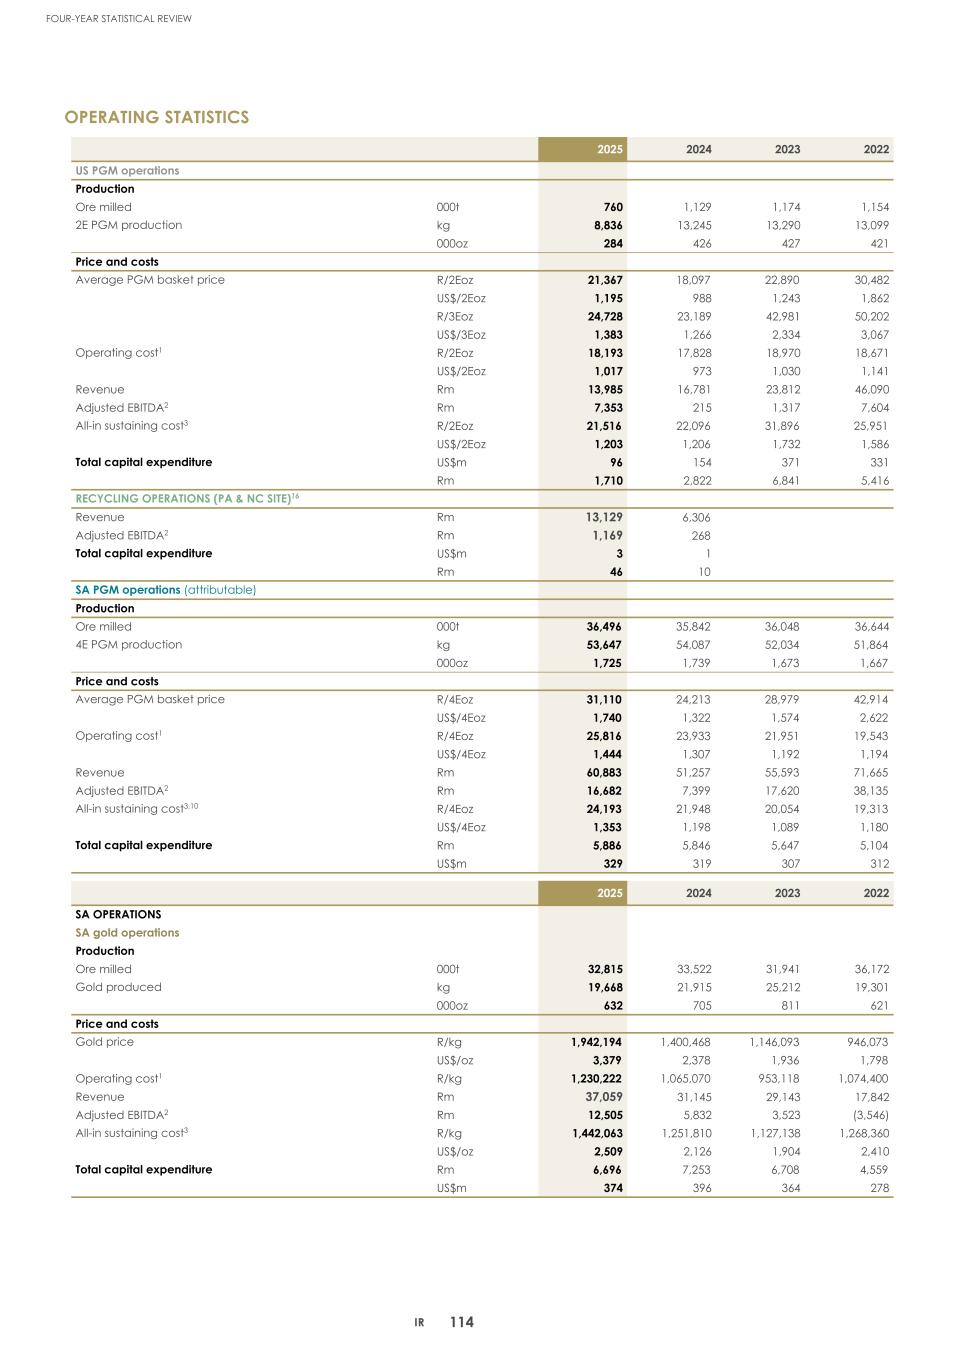
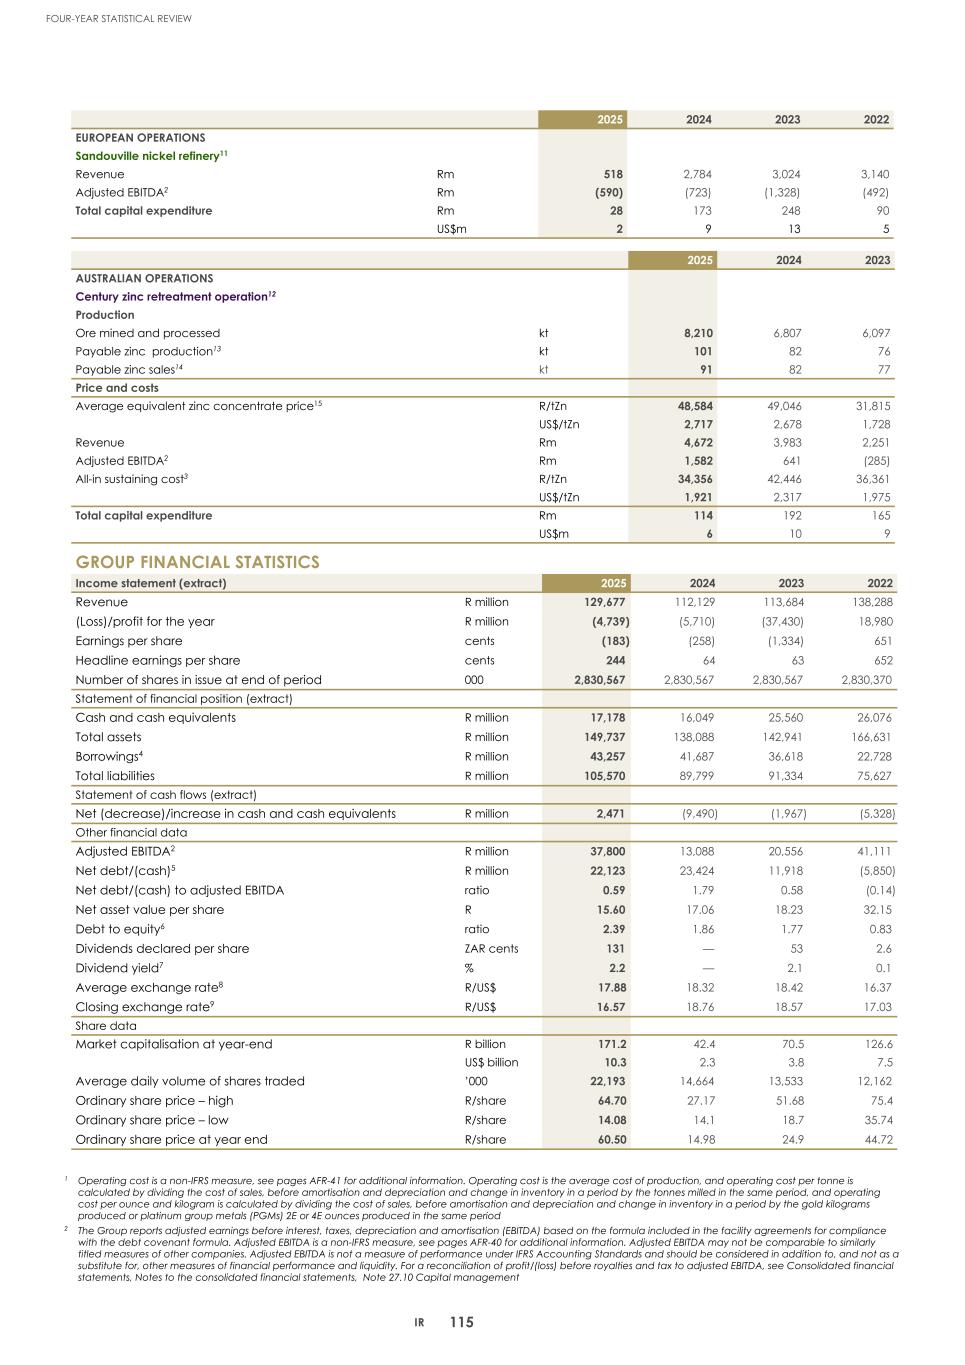
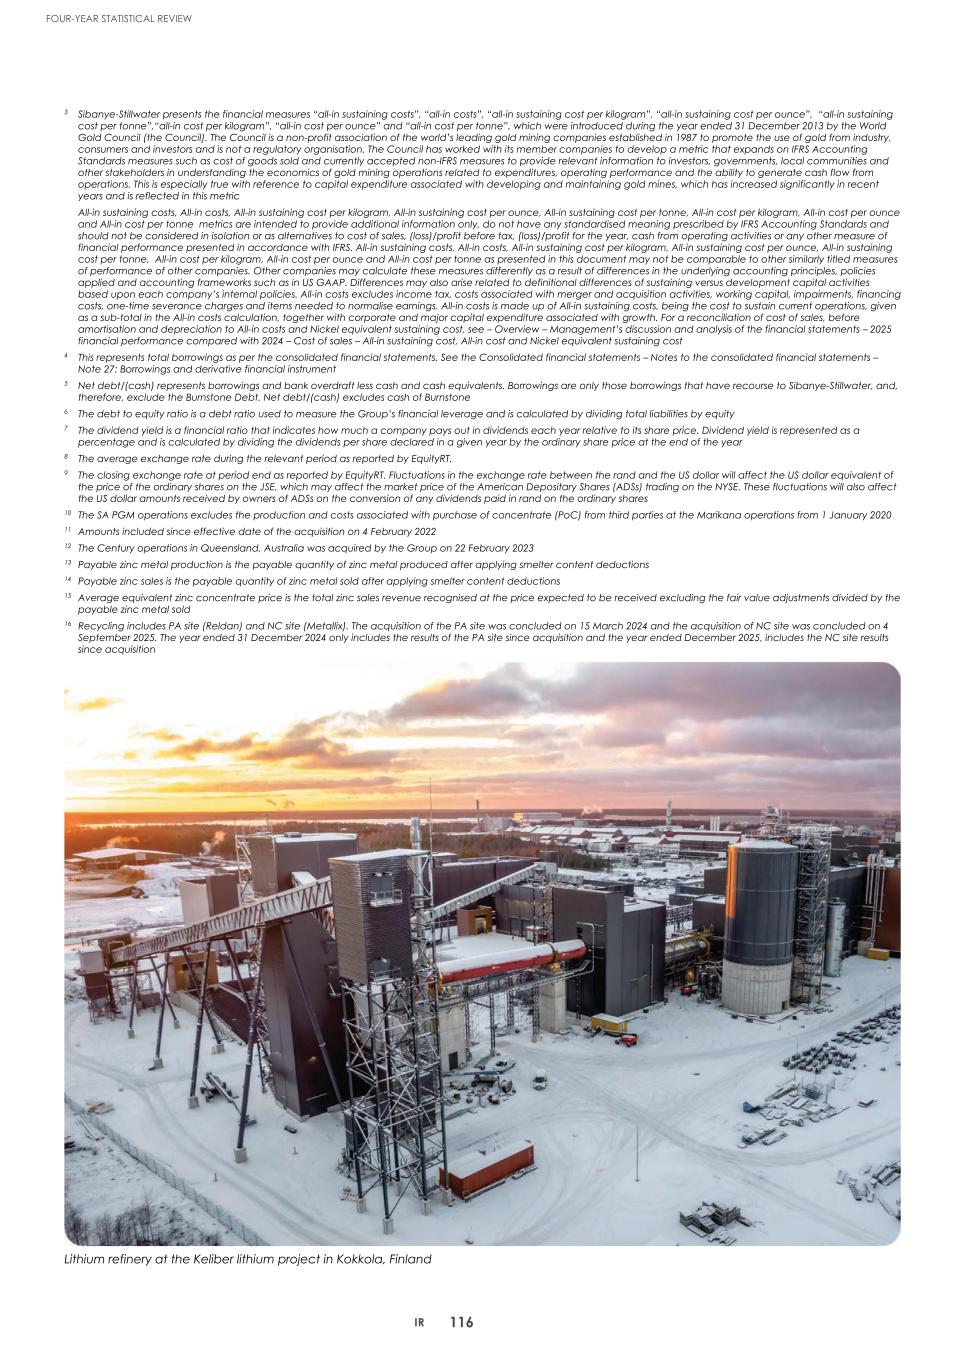
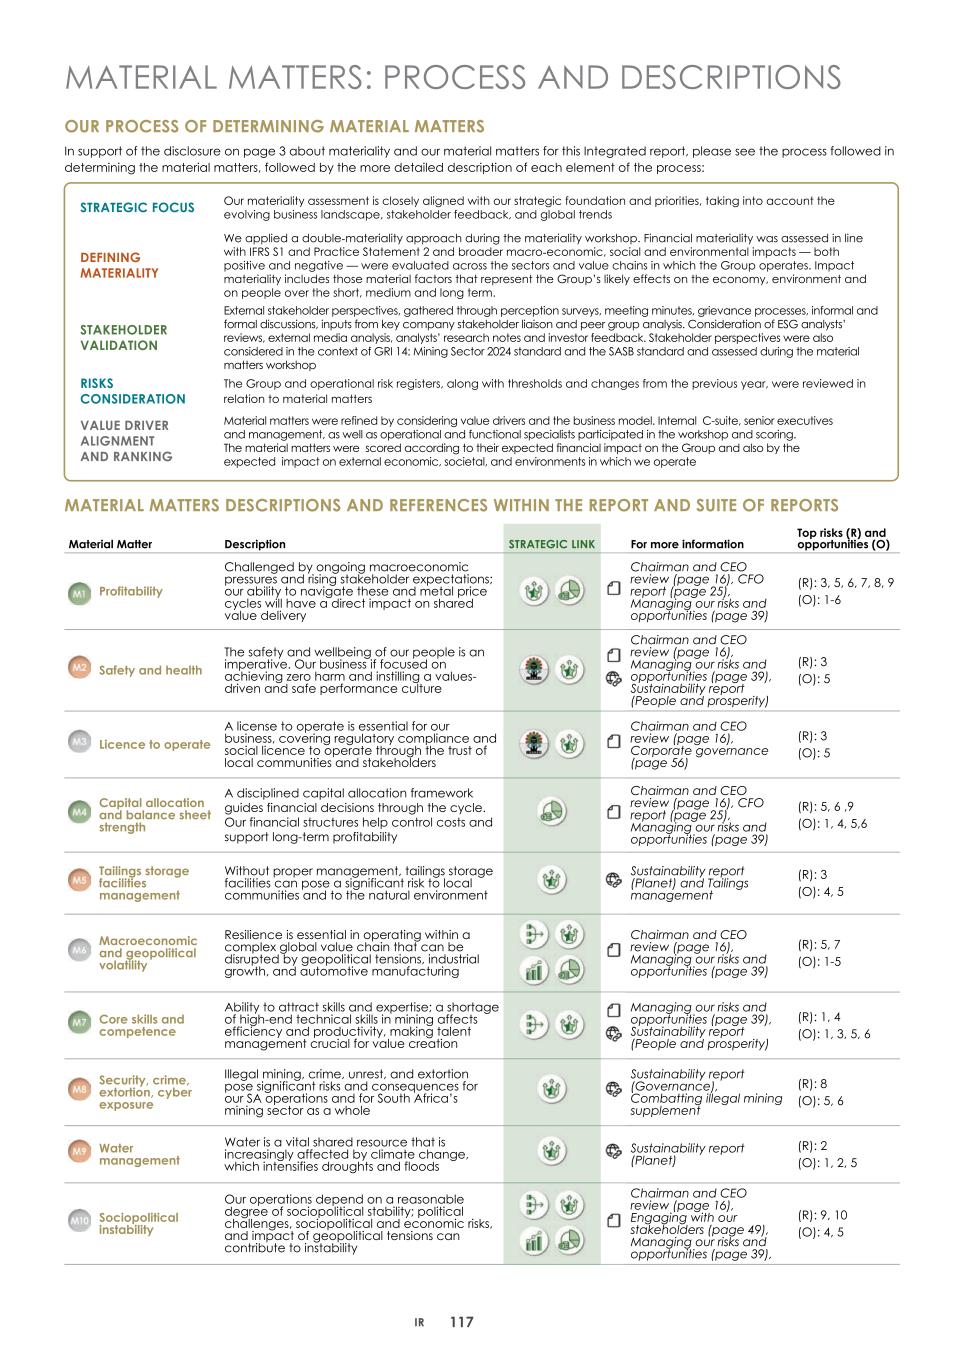
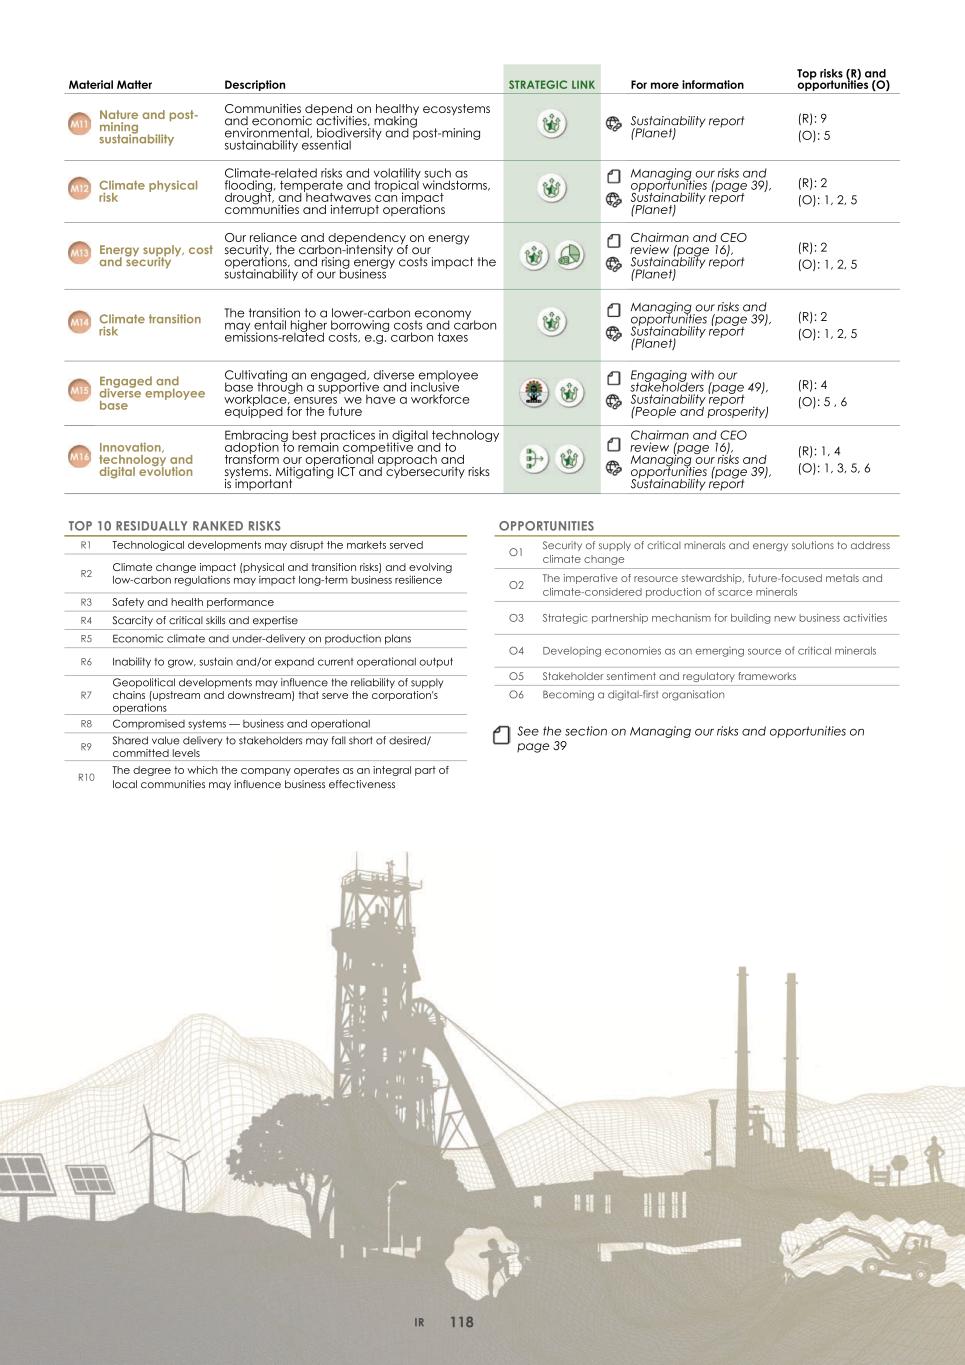
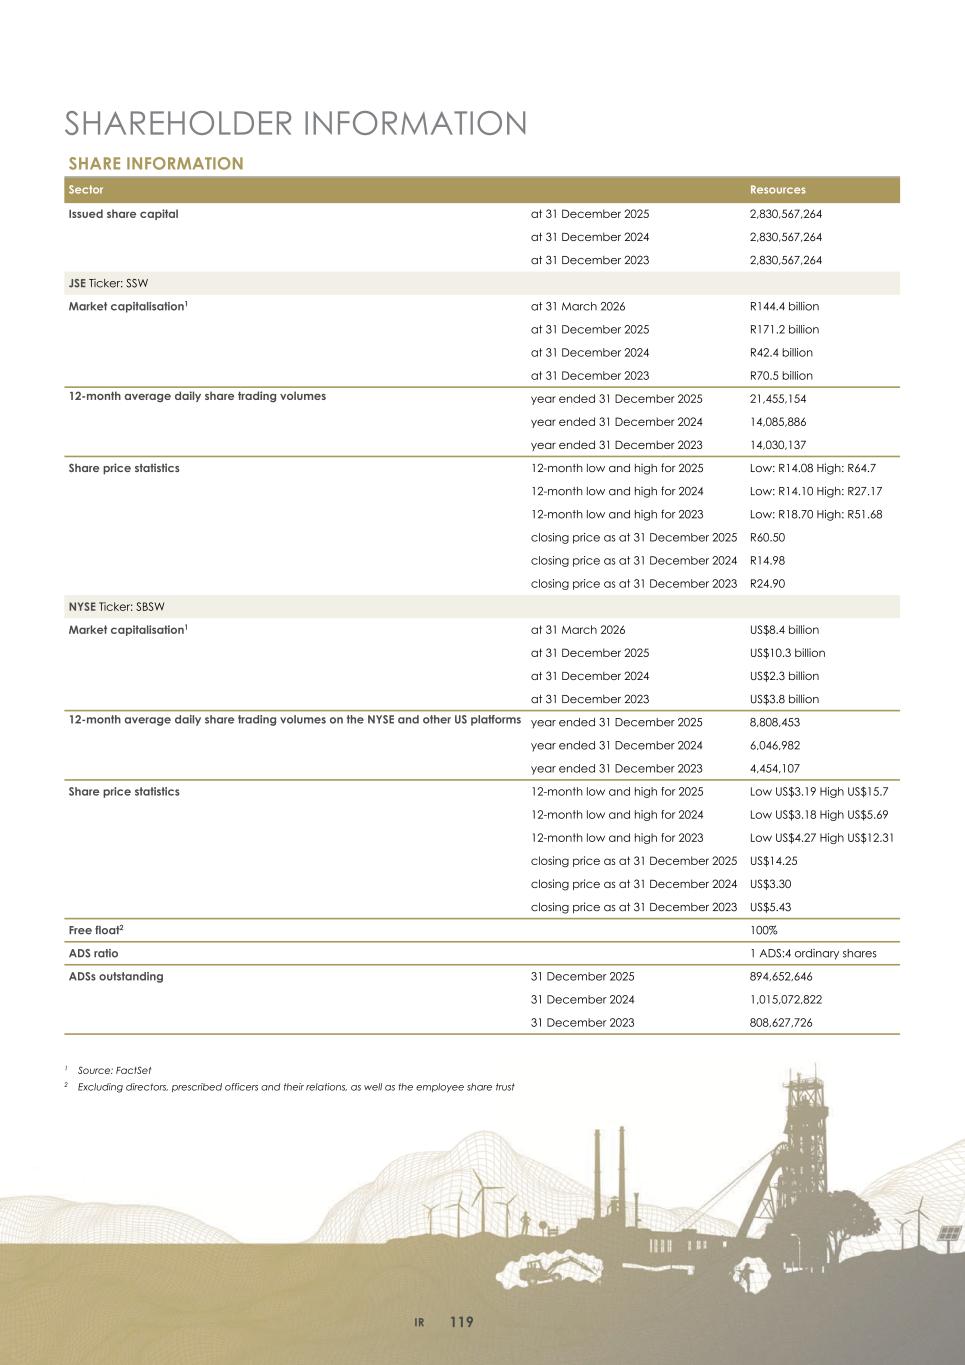
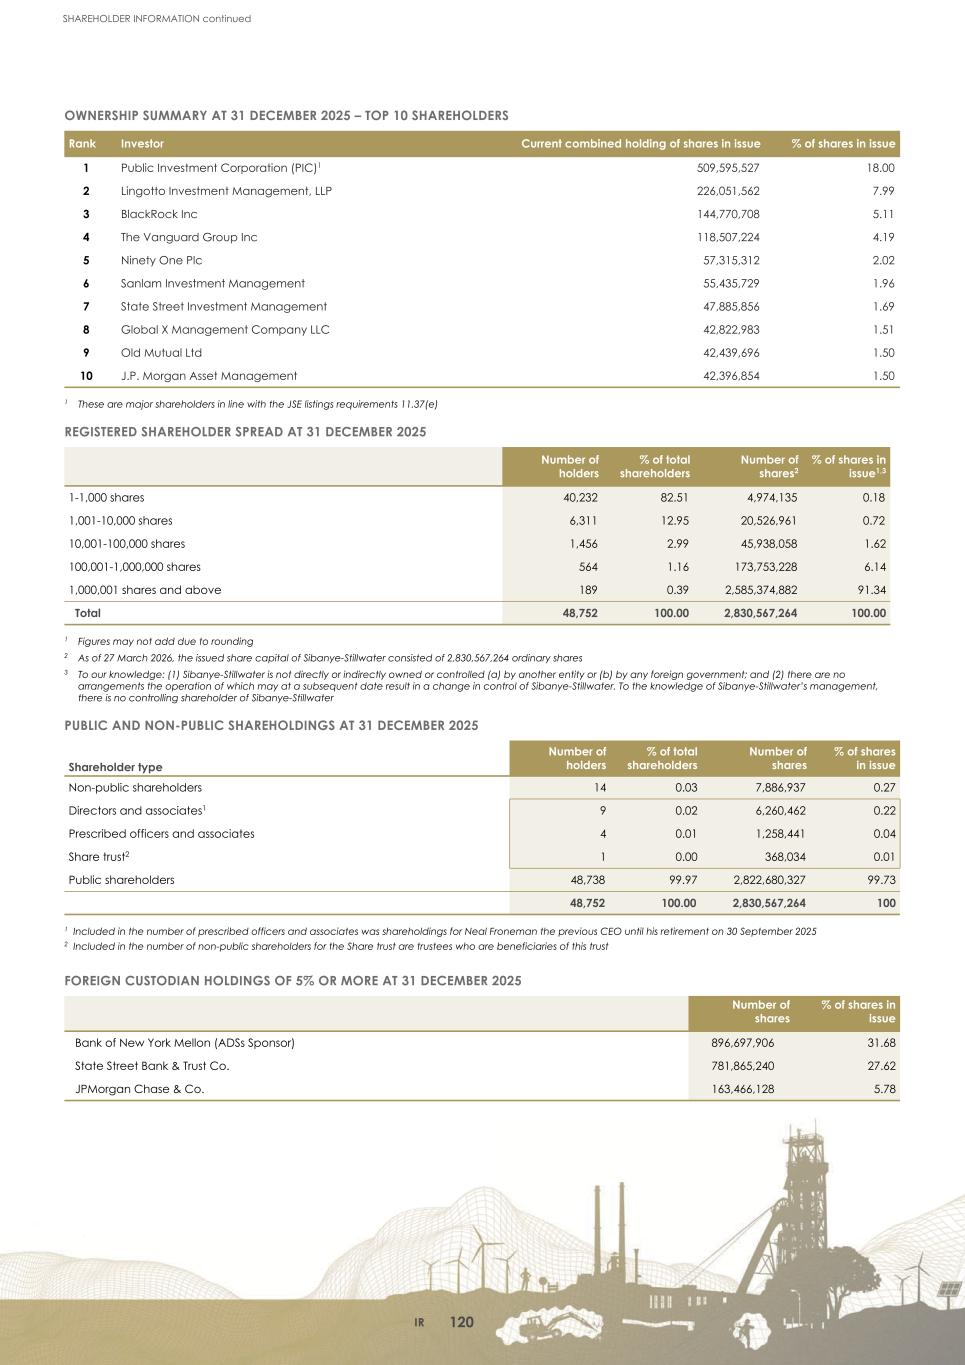
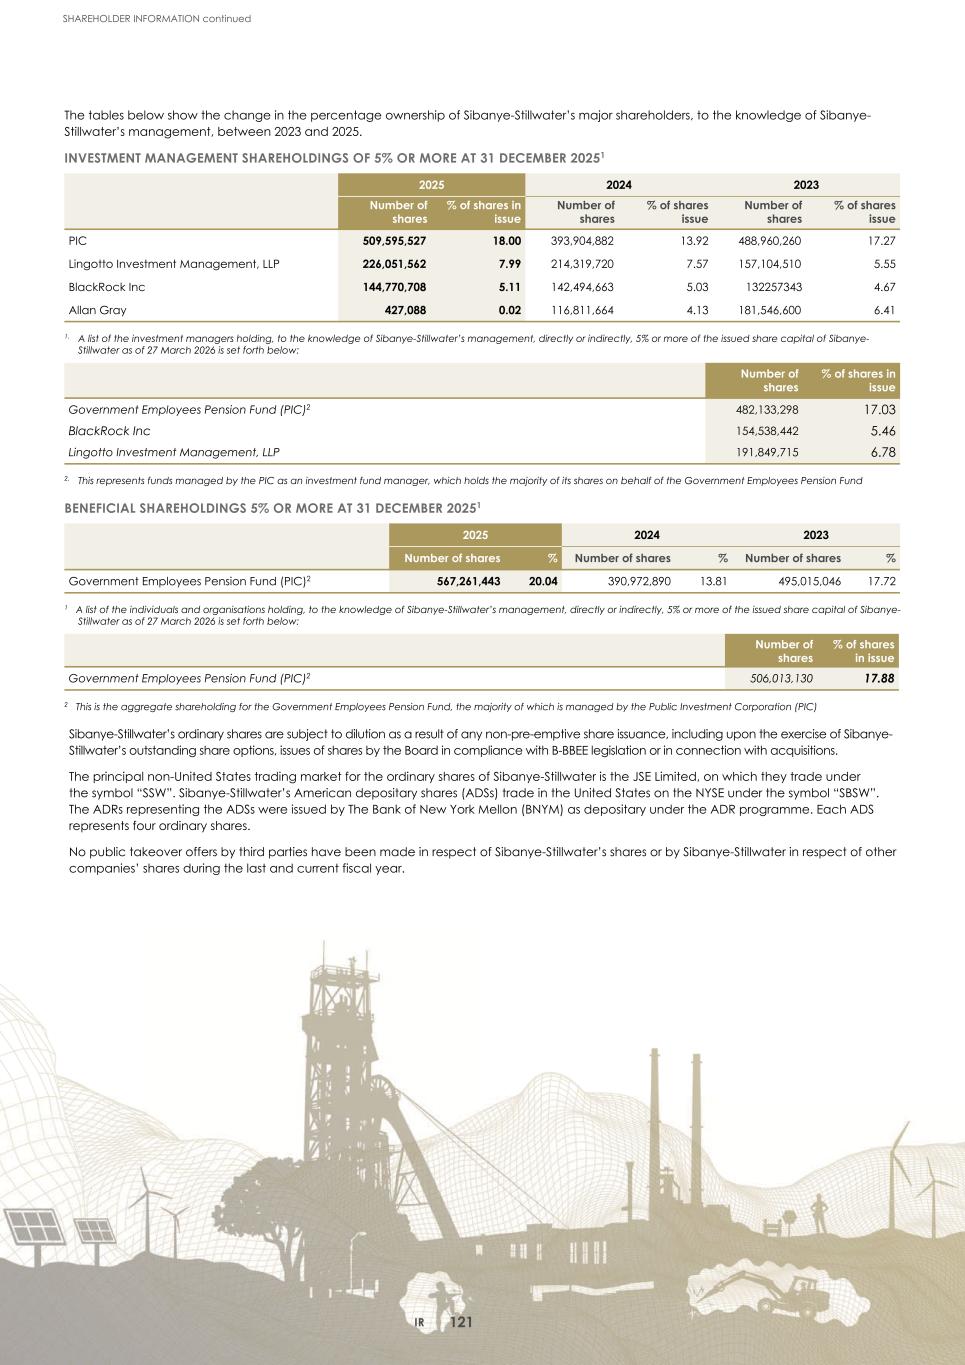
DISCLAIMER FORWARD-LOOKING STATEMENTS AND OTHER INFORMATION CONTAINED IN THIS DOCUMENT The information in this report may contain forward-looking statements within the meaning of the “safe harbour” provisions of the United States Private Securities Litigation Reform Act of 1995. These forward-looking statements, including, among others, those relating to Sibanye Stillwater Limited’s (Sibanye-Stillwater or the Group) financial positions, business strategies, plans and objectives of management for future operations, are necessarily estimates reflecting the best judgment of the senior management and directors of Sibanye-Stillwater and involve a number of risks and uncertainties that could cause actual results to differ materially from those suggested by the forward-looking statements. As a consequence, these forward-looking statements should be considered in light of various important factors, including those set forth in this report. All statements other than statements of historical facts included in this report may be forward-looking statements. Forward-looking statements often use words such as “will”, “would”, “expect”, “forecast”, “potential”, “may”, “could”, “believe”, “aim”, “anticipate”, “target”, “estimate” and words of similar or comparable meaning. By their nature, forward-looking statements involve risk and uncertainty because they relate to future events and circumstances and should be considered in light of various important factors, including those set forth in this disclaimer. Readers are cautioned not to place undue reliance on such statements. The important factors that could cause Sibanye-Stillwater’s actual results, performance or achievements to differ materially from estimates or projections contained in the forward-looking statements include, without limitation, Sibanye-Stillwater’s future financial position, plans, strategies, objectives, capital expenditures, projected costs and anticipated cost savings, financing plans, debt position and ability to reduce debt leverage; economic, business, political and social conditions in South Africa, Zimbabwe, the United States, Europe and elsewhere; plans and objectives of management for future operations; Sibanye-Stillwater’s ability to obtain the benefits of any streaming arrangements or pipeline financing; the ability of Sibanye-Stillwater to comply with loan and other covenants and restrictions and difficulties in obtaining additional financing or refinancing; Sibanye-Stillwater’s ability to service its bond instruments; changes in assumptions underlying Sibanye- Stillwater’s estimation of its Mineral Resources and Mineral Reserves; any failure of a tailings storage facility; the ability to achieve anticipated efficiencies and other cost savings in connection with, and the ability to successfully integrate, past, ongoing and future acquisitions, as well as at existing operations; the ability of Sibanye-Stillwater to complete any ongoing or future acquisitions; the success of Sibanye-Stillwater’s business strategy and exploration and development activities, including any proposed, anticipated or planned expansions into the battery metals or adjacent sectors and estimations or expectations of enterprise value; the ability of Sibanye-Stillwater to comply with requirements that it operate in ways that provide progressive benefits to affected communities; changes in the market price of gold, silver, PGMs, battery metals (e.g., nickel, lithium, copper and zinc) and the cost of power, petroleum fuels, and oil, among other commodities and supply requirements; the occurrence of hazards associated with underground and surface mining; any further downgrade of South Africa’s credit rating; the impact of South Africa's greylisting; a challenge regarding the title to any of Sibanye-Stillwater’s properties by claimants to land under restitution and other legislation; Sibanye-Stillwater’s ability to implement its strategy and any changes thereto; the outcome of legal challenges to the Group’s mining or other land use rights; the outcome of any disputes or litigation; the occurrence of labour disputes, disruptions and industrial actions; the availability, terms and deployment of capital or credit; changes in the imposition of industry standards, regulatory costs and relevant government regulations, particularly environmental, sustainability, tax, health and safety regulations and new legislation affecting water, mining, mineral rights and business ownership, including any interpretation thereof which may be subject to dispute; the outcome and consequence of any potential or pending litigation or regulatory proceedings, including in relation to any environmental, health or safety issues; failure to meet ethical standards, including actual or alleged instances of fraud, bribery or corruption; the effect of climate change or other extreme weather events on Sibanye-Stillwater’s business; the concentration of all final refining activity and a large portion of Sibanye-Stillwater’s PGM sales from mine production in the United States with one entity; the identification of a material weakness in disclosure and internal controls over financial reporting; the effect of US tax reform legislation on Sibanye-Stillwater and its subsidiaries; the effect of South African Exchange Control Regulations on Sibanye-Stillwater’s financial flexibility; operating in new geographies and regulatory environments where Sibanye-Stillwater has no previous experience; power disruptions, constraints and cost increases; supply chain disruptions and shortages and increases in the price of production inputs; the regional concentration of Sibanye-Stillwater’s operations; fluctuations in exchange rates, currency devaluations, inflation and other macro-economic monetary policies; the occurrence of temporary stoppages or precautionary suspension of operations at its mines for safety or environmental incidents (including natural disasters) and unplanned maintenance; Sibanye-Stillwater’s ability to hire and retain senior management and employees with sufficient technical and/or production skills across its global operations necessary to meet its labour recruitment and retention goals, as well as its ability to achieve sufficient representation of historically disadvantaged South Africans in its management positions, or maintain required board gender diversity; failure of Sibanye-Stillwater’s information technology, communications and systems; the adequacy of Sibanye-Stillwater’s insurance coverage; social unrest, sickness or natural or man-made disaster in surrounding mining communities, including informal settlements in the vicinity of some of Sibanye-Stillwater’s South African-based operations; and the impact of contagious diseases, including global pandemics. Expectations in relation to sustainability matters, including what investors and stakeholders view as material, are fast-paced and can differ from those in respect of more traditional, financial reporting. In preparing the [sustainability-related information contained in this report/this report], Sibanye-Stillwater has made a number of key judgements, estimations and assumptions. The processes and issues involved are complex and may continue to evolve as our, and the industry’s, understanding of sustainability matters, risks and opportunities continues to develop. The sustainability-related forward looking statements should be treated with special caution, as sustainability and climate data, models and methodologies are often relatively new, are rapidly evolving and are not of the same standard as those available in the context of other financial information, nor are they subject to the same or equivalent disclosure standards, historical reference points, benchmarks, market consensus or globally accepted accounting principles. In particular, it is not possible to rely on historical data as a strong indicator of future trajectories in the case of climate change and its evolution. Outputs of models, processed data and methodologies are also likely to be affected by underlying data quality, which can be hard to assess, and we expect industry guidance, standards, market practice, and regulations in this field to continue to evolve. There are also challenges faced in relation to the ability to access data on a timely basis and the lack of consistency and comparability between data that is available. This means the sustainability-related forward-looking statements and sustainability metrics discussed in this document
carry an additional degree of inherent risk and uncertainty, and therefore, our actual results and developments could differ materially from those expressed or implied by the sustainability-related forward-looking statements in this report. In light of the uncertainty as to the nature of future policy and market responses to climate change, including between regions, and the effectiveness of any such responses, and as market practice and data quality and availability develops, Sibanye-Stillwater may have to re-evaluate its progress and adapt its approach towards its sustainability ambitions, commitments and targets in the future, update the models and/or methodologies it uses or alter its approach to sustainability and climate analysis and may be required to amend, update and recalculate its sustainability disclosures and assessments, its sustainability ambitions, goals, commitments and/or targets, or its evaluation of its progress towards its sustainability ambitions, goals, commitments and/or targets in the future. Further details of potential risks and uncertainties affecting Sibanye-Stillwater are described in Sibanye-Stillwater’s filings with the Johannesburg Stock Exchange and the United States Securities and Exchange Commission, including the 2025 Integrated Report and the Annual Financial Report for the fiscal year ended 31 December 2025 on Form 20-F filed with the United States Securities and Exchange Commission on 24 April 2026 (SEC File no. 333-234096). These forward-looking statements speak only as of the date of the content. Sibanye-Stillwater expressly disclaims any obligation or undertaking to update or revise any forward-looking statement (except to the extent legally required). These forward-looking statements have not been reviewed or reported on by the Group’s external auditors. NON-IFRS1 MEASURES The information contained in this report may contain certain non-IFRS measures, including, among others, adjusted EBITDA, adjusted EBITDA margin, adjusted free cash flow, AISC, AIC, Nickel equivalent sustaining cost and normalised earnings. These measures may not be comparable to similarly-titled measures used by other companies and are not measures of Sibanye-Stillwater’s financial performance under IFRS Accounting Standards. These measures should not be considered in isolation or as a substitute for measures of performance prepared in accordance with IFRS Accounting Standards. Sibanye-Stillwater is not providing a reconciliation of the forecast non-IFRS financial information presented in this report because it is unable to provide this reconciliation without unreasonable effort. The forecast non-IFRS financial information presented have not been reviewed or reported on by the Group’s external auditors. 1 IFRS refers to International Financial Reporting Standards Accounting Standards (IFRS Accounting Standards) as issued by the International Accounting Standards Board (IASB) MINERAL RESOURCES AND MINERAL RESERVES Sibanye-Stillwater’s Mineral Resources and Mineral Reserves are estimates at a particular date, and are affected by fluctuations in mineral prices, the exchange rates, operating costs, mining permits, changes in legislation and operating factors. Sibanye-Stillwater reports its Mineral Resources and Mineral Reserves in accordance with the rules and regulations promulgated by each of the United States Securities and Exchange Commission (SEC) and the JSE at all managed operations, development, and exploration properties. WEBSITES References in this document to information on websites (and/or social media sites) are included as an aid to their location and such information is not incorporated in, and does not form part of, this report. IR 122
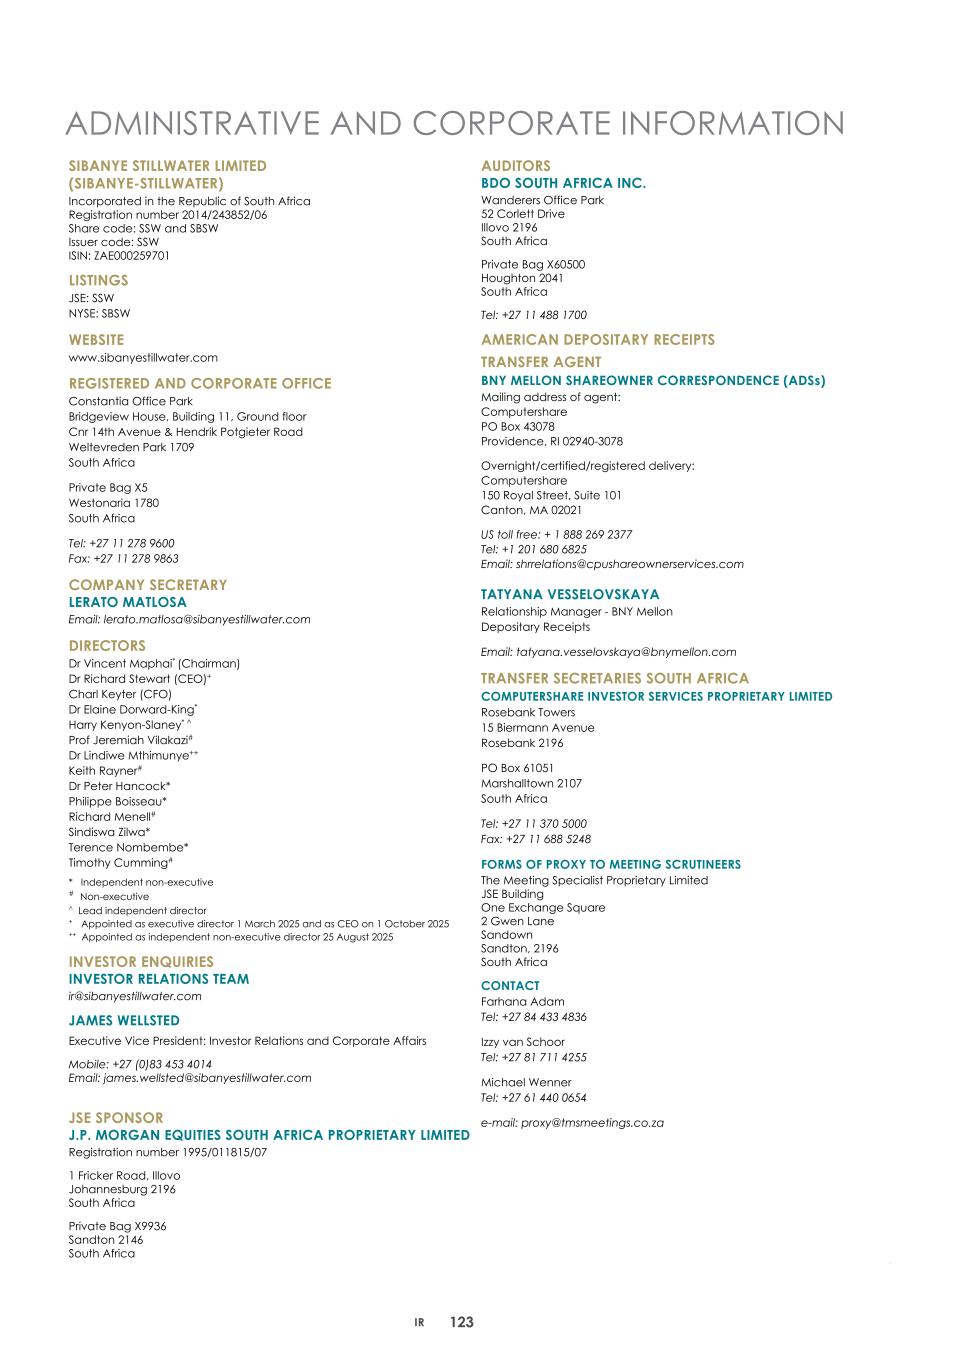
ADMINISTRATIVE AND CORPORATE INFORMATION SIBANYE STILLWATER LIMITED (SIBANYE-STILLWATER) Incorporated in the Republic of South Africa Registration number 2014/243852/06 Share code: SSW and SBSW Issuer code: SSW ISIN: ZAE000259701 LISTINGS JSE: SSW NYSE: SBSW WEBSITE www.sibanyestillwater.com REGISTERED AND CORPORATE OFFICE Constantia Office Park Bridgeview House, Building 11, Ground floor Cnr 14th Avenue & Hendrik Potgieter Road Weltevreden Park 1709 South Africa Private Bag X5 Westonaria 1780 South Africa Tel: +27 11 278 9600 Fax: +27 11 278 9863 COMPANY SECRETARY LERATO MATLOSA Email: lerato.matlosa@sibanyestillwater.com DIRECTORS Dr Vincent Maphai* (Chairman) Dr Richard Stewart (CEO)+ Charl Keyter (CFO) Dr Elaine Dorward-King* Harry Kenyon-Slaney* ^ Prof Jeremiah Vilakazi# Dr Lindiwe Mthimunye++ Keith Rayner# Dr Peter Hancock* Philippe Boisseau* Richard Menell# Sindiswa Zilwa* Terence Nombembe* Timothy Cumming# * Independent non-executive # Non-executive ^ Lead independent director + Appointed as executive director 1 March 2025 and as CEO on 1 October 2025 ++ Appointed as independent non-executive director 25 August 2025 INVESTOR ENQUIRIES INVESTOR RELATIONS TEAM ir@sibanyestillwater.com JAMES WELLSTED Executive Vice President: Investor Relations and Corporate Affairs Mobile: +27 (0)83 453 4014 Email: james.wellsted@sibanyestillwater.com JSE SPONSOR J.P. MORGAN EQUITIES SOUTH AFRICA PROPRIETARY LIMITED Registration number 1995/011815/07 1 Fricker Road, Illovo Johannesburg 2196 South Africa Private Bag X9936 Sandton 2146 South Africa AUDITORS BDO SOUTH AFRICA INC. Wanderers Office Park 52 Corlett Drive Illovo 2196 South Africa Private Bag X60500 Houghton 2041 South Africa Tel: +27 11 488 1700 AMERICAN DEPOSITARY RECEIPTS TRANSFER AGENT BNY MELLON SHAREOWNER CORRESPONDENCE (ADSs) Mailing address of agent: Computershare PO Box 43078 Providence, RI 02940-3078 Overnight/certified/registered delivery: Computershare 150 Royal Street, Suite 101 Canton, MA 02021 US toll free: + 1 888 269 2377 Tel: +1 201 680 6825 Email: shrrelations@cpushareownerservices.com TATYANA VESSELOVSKAYA Relationship Manager - BNY Mellon Depositary Receipts Email: tatyana.vesselovskaya@bnymellon.com TRANSFER SECRETARIES SOUTH AFRICA COMPUTERSHARE INVESTOR SERVICES PROPRIETARY LIMITED Rosebank Towers 15 Biermann Avenue Rosebank 2196 PO Box 61051 Marshalltown 2107 South Africa Tel: +27 11 370 5000 Fax: +27 11 688 5248 FORMS OF PROXY TO MEETING SCRUTINEERS The Meeting Specialist Proprietary Limited JSE Building One Exchange Square 2 Gwen Lane Sandown Sandton, 2196 South Africa CONTACT Farhana Adam Tel: +27 84 433 4836 Izzy van Schoor Tel: +27 81 711 4255 Michael Wenner Tel: +27 61 440 0654 e-mail: proxy@tmsmeetings.co.za IR 123

www.sibanyestillwater.com
CONTENTS
| |
| |
Four-year financial performance | |
Management’s discussion and analysis of the financial statements | |
Statement of responsibility by the Board of Directors | |
Company secretary’s confirmation | |
Report of the Audit Committee | |
| |
Report of independent registered public accounting firm | |
Consolidated income statement | |
Consolidated statement of other comprehensive income | |
Consolidated statement of financial position | |
Consolidated statement of cash flows | |
Consolidated statement of changes in equity | |
Notes to the consolidated financial statements | |
Adjusted EBITDA reconciliations | |
Notional free cash flow reconciliations | |
| |
Administration and corporate information | |
| |
The audited consolidated financial statements for the year ended 31 December 2025 have been prepared by Sibanye-Stillwater’s group financial reporting team headed by Henning Opperman CA (SA). This process was supervised by the Group’s CFO, Charl Keyter and authorised for issue by Sibanye-Stillwater’s Board of Directors on 24 April 2026. |
FOUR-YEAR FINANCIAL PERFORMANCE
| | | | | |
| | | | | |
Group financial statistics1 | | | | | |
| | | | | |
| | | | | |
Cost of sales, before amortisation and depreciation | | | | | |
Amortisation and depreciation | | | | | |
(Loss)/profit for the year | | | | | |
(Loss)/profit for the year attributable to owners of Sibanye-Stillwater | | | | | |
| | | | | |
Diluted earnings per share | | | | | |
Headline earnings per share | | | | | |
Diluted headline earnings per share | | | | | |
| | | | | |
Weighted average number of shares | | | | | |
Diluted weighted average number of shares | | | | | |
Number of shares in issue at end of period | | | | | |
Statement of financial position | | | | | |
Property, plant and equipment | | | | | |
Cash and cash equivalents | | | | | |
| | | | | |
| | | | | |
| | | | | |
| | | | | |
| | | | | |
| | | | | |
Net cash from operating activities | | | | | |
Net cash used in investing activities | | | | | |
Net cash from/(used in) financing activities | | | | | |
Net increase/(decrease) in cash and cash equivalents | | | | | |
| | | | | |
| | | | | |
| | | | | |
Net debt/(cash) to adjusted EBITDA5 | | | | | |
Net asset value per share6 | | | | | |
| | | | | |
| | | | | |
| | | | | |
Ordinary share price – high | | | | | |
Ordinary share price – low | | | | | |
Ordinary share price at year end | | | | | |
Average daily volume of shares traded | | | | | |
Market capitalisation at year end | | | | | |
1The selected historical consolidated financial data set out above have been derived from Sibanye-Stillwater’s consolidated financial statements for those periods and as at
those dates which have been prepared in accordance with IFRS Accounting Standards taking into account any changes in accounting principles. Headline earnings per
share is calculated in terms of the guidance issued by the South African Institute of Chartered Accountants (SAICA), see – Consolidated financial statements – Notes to the
consolidated financial statements – Note 12.3 Headline earnings per share
2This represents total borrowings as per the consolidated financial statements, see – Consolidated financial statements – Notes to the consolidated financial statements –
Note 27 Borrowings and derivative financial instrument
3The adjusted EBITDA is based on the formula included in the facility agreements for compliance with the debt covenant formula. Adjusted EBITDA may not be comparable
to similarly titled measures of other companies. Adjusted EBITDA is not a measure of performance under IFRS Accounting Standards and should be considered in addition to,
and not as a substitute for, other measures of financial performance and liquidity. For a reconciliation of (loss)/profit before royalties and tax to adjusted EBITDA, see –
Consolidated financial statements – Notes to the consolidated financial statements – Note 27.10 Capital management
4Net debt/(cash) represents borrowings and bank overdraft less cash and cash equivalents. Borrowings are only those borrowings that have recourse to Sibanye- Stillwater,
and, therefore, exclude the Burnstone Debt and include the derivative financial instrument. Net debt excludes cash of Burnstone. Where cash and cash equivalents exceed
borrowings and bank overdraft this represents a net cash position and the negative amount is shown in brackets
5Net debt/(cash) to adjusted EBITDA (ratio) is defined as net debt/(cash) as at the end of a reporting period divided by adjusted EBITDA of the last 12 months ending on the
same reporting date. Where a net cash position arises the Net debt/(cash) to adjusted EBITDA (ratio) is negative and the amount is shown in brackets
6Net asset value per share (ratio) is defined as total assets as at the end of a reporting period minus total liabilities as at the end of a reporting period divided by the total
number of shares in issue on the same reporting date
7The average exchange rate during the relevant period as reported by Equity RT/IRESS. The average exchange rate for the period through 17 April 2026 was R16.38/US$. The
table below sets forth the high and low exchange rates for each month during the previous six months
FOUR-YEAR FINANCIAL PERFORMANCE continued
Table of high and low exchange rates for six months from October 2025 to April 2026
The closing exchange rate at period end. The closing exchange rate on 17 April 2026, as reported by EquityRT, was R16.40/US$. Fluctuations in the exchange rate between
the rand and the US dollar will affect the US dollar equivalent of the price of the ordinary shares on the JSE, which may affect the market price of the American Depositary
Shares (ADSs) trading on the NYSE. These fluctuations will also affect the US dollar amounts received by owners of ADSs on the conversion of any dividends paid in rand on
the ordinary shares
| | | | | |
| | | | | |
| | | | | |
Group operating statistics | | | | | |
| | | | | |
| | | | | |
| | | | | |
| | | | | |
| | | | | |
| | | | | |
| | | | | |
| | | | | |
| | | | | |
| | | | | |
| | | | | |
| | | | | |
| | | | | |
| | | | | |
| | | | | |
| | | | | |
| | | | | |
| | | | | |
| | | | | |
| | | | | |
| | | | | |
| | | | | |
| | | | | |
| | | | | |
Total capital expenditure | | | | | |
| | | | | |
| | | | | |
FOUR-YEAR FINANCIAL PERFORMANCE continued
| | | | | |
| | | | | |
| | | | | |
RECYCLING OPERATIONS (PA & NC SITE)5 | | | | | |
| | | | | |
| | | | | |
| | | | | |
| | | | | |
Total capital expenditure | | | | | |
| | | | | |
| | | | | |
| | | | | |
| | | | | |
| | | | | |
| | | | | |
| | | | | |
| | | | | |
| | | | | |
| | | | | |
| | | | | |
| | | | | |
| | | | | |
| | | | | |
| | | | | |
| | | | | |
| | | | | |
| | | | | |
| | | | | |
| | | | | |
| | | | | |
| | | | | |
| | | | | |
Total capital expenditure | | | | | |
FOUR-YEAR FINANCIAL PERFORMANCE continued
| | | | | |
| | | | | |
Sandouville nickel refinery8 | | | | | |
| | | | | |
| | | | | |
| | | | | |
Total capital expenditure | | | | | |
| | | | | |
| | | | | |
| | | | | |
| | | | | |
Century zinc retreatment operation9 | | | | |
| | | | | |
| | | | | |
Payable zinc production10 | | | | | |
| | | | | |
| | | | | |
Average equivalent zinc concentrate price12 | | | | | |
| | | | | |
| | | | | |
| | | | | |
| | | | | |
| | | | | |
| | | | | |
| | | | | |
| | | | | |
Total capital expenditure | | | | | |
FOUR-YEAR FINANCIAL PERFORMANCE continued
Figures in tables below may not add as they are rounded independently
| | | | | |
Unit operating cost2: US underground PGM operations | | | | | |
Cost of sales, before amortisation and depreciation | | | | | |
Section 45X credit adjustment | | | | | |
| | | | | |
| | | | | |
| | | | | |
| | | | | |
| | | | | |
| | | | | |
| | | | | |
| | | | | |
| | | | | |
Unit operating cost2: SA PGM operations (excluding Mimosa and Purchase of Concentrate (PoC)) | | | | | |
Cost of sales, before amortisation and depreciation | | | | | |
| | | | | |
Less: Chrome cost of sales | | | | | |
Less: Purchase cost of PoC | | | | | |
Total operating cost excluding third party PoC | | | | | |
| | | | | |
| | | | | |
Less: Mimosa tonnes (equity accounted) | | | | | |
PGM tonnes excluding Mimosa and third party PoC | | | | | |
| | | | | |
PGM production (excluding PoC) | | | | | |
Less: Mimosa production (equity accounted) | | | | | |
PGM production excluding Mimosa and third party PoC | | | | | |
| | | | | |
| | | | | |
| | | | | |
| | | | | |
| | | | | |
| | | | | |
Unit operating cost2: SA Gold operations | | | | | |
Cost of sales, before amortisation and depreciation | | | | | |
Inventory change (Gold in process) | | | | | |
| | | | | |
| | | | | |
| | | | | |
| | | | | |
| | | | | |
| | | | | |
| | | | | |
| | | | | |
| | | | | |
| | | | | |
1The US PGM operations’ underground production is converted to metric tonnes and kilograms, and performance is translated into SA rand. In addition to the US PGM
operations’ underground production, the operation processes recycling material at the Columbus recycling operation (US PGM Recycling) which is excluded from the 2E
PGM production, 2E average basket price, operating cost, total capital expenditure, All-in sustaining cost and All-in cost statistics shown. PGM recycling represents
palladium, platinum, and rhodium ounces fed to the furnace
2Operating cost is a non-IFRS measure see page AFR-40 for additional information. Operating cost is the average cost of production, and operating cost per tonne is
calculated by dividing the cost of sales, before amortisation and depreciation and change in inventory in a period by the tonnes milled in the same period, and operating
cost per ounce and kilogram is calculated by dividing the cost of sales, before amortisation and depreciation and change in inventory in a period by the gold kilograms
produced or platinum group metals (PGM) 2E or 4E ounces produced in the same period
3The Group reports adjusted earnings before interest, taxes, depreciation and amortisation (EBITDA) based on the formula included in the facility agreements for compliance
with the debt covenant formula. Adjusted EBITDA is a non-IFRS measure see page AFR-39 for additional information. Adjusted EBITDA may not be comparable to similarly
titled measures of other companies. Adjusted EBITDA is not a measure of performance under IFRS Accounting Standards and should be considered in addition to, and not as
FOUR-YEAR FINANCIAL PERFORMANCE continued
a substitute for, other measures of financial performance and liquidity. For a reconciliation of profit/(loss) before royalties and tax to adjusted EBITDA, see – Consolidated
financial statements – Notes to the consolidated financial statements – Note 27.10 Capital management
4Sibanye-Stillwater presents the financial measures “All-in sustaining costs”, “All-in costs”, “All-in sustaining cost per kilogram”, “All-in sustaining cost per ounce”, “All-in
sustaining cost per tonne”,“All- in cost per kilogram”, “All-in cost per ounce” and “All-in cost per tonne”, which were introduced during the year ended 31 December 2013 by
the World Gold Council (the Council). The Council is a non-profit association of the world’s leading gold mining companies established in 1987 to promote the use of gold
from industry, consumers and investors and is not a regulatory organisation. The Council has worked with its member companies to develop a metric that expands on IFRS
Accounting Standards measures such as cost of goods sold and currently accepted non-IFRS measures to provide relevant information to investors, governments, local
communities and other stakeholders in understanding the economics of gold mining operations related to expenditures, operating performance and the ability to generate
cash flow from operations. This is especially true with reference to capital expenditure associated with developing and maintaining gold mines, which has increased
significantly in recent years and is reflected in this metric
All-in sustaining costs, All-in costs, All-in sustaining cost per kilogram, All-in sustaining cost per ounce, All-in sustaining cost per tonne, All-in cost per kilogram, All-in cost per
ounce and All-in cost per tonne metrics are intended to provide additional information only, do not have any standardised meaning prescribed by IFRS Accounting
Standards and should not be considered in isolation or as alternatives to cost of sales, (loss)/profit before tax, (loss)/profit for the year, cash from operating activities or any
other measure of financial performance presented in accordance with IFRS. All-in sustaining costs, All-in costs, All-in sustaining cost per kilogram, All-in sustaining cost per
ounce, All-in sustaining cost per tonne, All-in cost per kilogram, All-in cost per ounce and All-in cost per tonne as presented in this document may not be comparable to
other similarly titled measures of performance of other companies. Other companies may calculate these measures differently as a result of differences in the underlying
accounting principles, policies applied and accounting frameworks such as in US GAAP. Differences may also arise related to definitional differences of sustaining versus
development capital activities based upon each company’s internal policies. All-in costs excludes income tax, costs associated with merger and acquisition activities,
working capital, impairments, financing costs, one-time severance charges and items needed to normalise earnings. All-in costs is made up of All-in sustaining costs, being
the cost to sustain current operations, given as a sub-total in the All-in costs calculation, together with corporate and major capital expenditure associated with growth. For
a reconciliation of cost of sales, before amortisation and depreciation to All-in costs see – Overview – Management’s discussion and analysis of the financial statements –
2025 financial performance compared with 2024 – Cost of sales – All-in sustaining cost, All-in cost
5Recycling includes Reldan Pennsylvania (PA) site and Metallix North Carolina (NC) site. The acquisition of the PA site was concluded on 15 March 2024 and the acquisition of
NC site was concluded on 4 September 2025. The year ended 31 December 2024 only includes the results of the PA site since acquisition and the year ended December
2025, includes the NC site results since acquisition
6SA PGM operations excludes the production and costs associated with the purchase of concentrate (PoC) from third parties from 1 January 2020 onwards. During 2025, the
SA PGM operations produced 73,150 4Eoz (2024: 96,464; 2023: 96,403 4Eoz; 2022: 63,344 4Eoz;) of PoC at a cost of R2.6 billion (2024: R2.4 billion; 2023: R2.8 billion; 2022: R2.7
billion)
7The total SA PGM operations unit cost benchmarks (including capital expenditure) exclude the financial results of Mimosa, which is equity accounted, and excluded from
revenue and cost of sales
8Amounts included since effective date of the acquisition on 4 February 2022
9Century is a leading tailings reprocessing and rehabilitation asset that currently owns and operates the Century zinc tailings retreatment operation in Queensland, Australia.
Century was acquired by the Group on 22 February 2023
10Payable zinc production is the payable quantity of zinc metal produced after applying smelter content deductions
11Payable zinc sales is the payable quantity of zinc metal sold after applying smelter content deductions
12Average equivalent zinc concentrate price is the total zinc sales revenue recognised at the price expected to be received excluding the fair value adjustments divided by
the payable zinc metal sold
MANAGEMENT’S DISCUSSION AND ANALYSIS
OF THE FINANCIAL STATEMENTS
The following discussion and analysis should be read together with Sibanye Stillwater Limited's Group (the "Group" or "Sibanye-Stillwater")
consolidated financial statements, including the notes. Certain information contained in the discussion and analysis set forth below includes
forward-looking statements that involve risks and uncertainties. For a discussion of important factors that could cause actual results to differ
materially from the results described in or implied by the forward-looking statements contained in this Annual Financial Report, see –
Disclaimer – Forward-looking statements. The comparison of the Group’s 2024 financial performance to the Group’s 2023 financial
performance can be found on pages AFR-8 to AFR-40 of Sibanye Stillwater Limited’s Annual Report on Form 20-F for the year ended
31 December 2024 that was filed with United States Securities and Exchange Commission on 25 April 2025.
Introduction
Sibanye-Stillwater is a multinational mining and metals processing Group with a diverse portfolio of operations, projects and investments
across five continents. The Group is one of the foremost global recyclers of a suite of metals and has interests in leading mine tailings
retreatment operations (secondary mining).
Sibanye-Stillwater is one of the world’s largest primary producers of platinum, palladium and rhodium and is a top tier gold producer. It
produces and refines iridium and ruthenium, nickel, chrome, copper and cobalt. The Group has also diversified into battery metals mining
and processing and increased its presence in the circular economy by growing its recycling and tailings reprocessing exposure globally. The
Group's operations are discussed below and for information on the nature of the Group's business see – Consolidated Financial Statements –
Notes to the consolidated financial statements – Note 1.1: Reporting entity.
Our operations
Southern Africa
PGMs
The SA PGM operations comprise two managed underground operations (Marikana and Rustenburg). In addition, the Group has a 50%
attributable interest in a non-managed, underground operation (Mimosa) in Zimbabwe.
The Rustenburg (74% attributable) operation produces concentrate which is processed in terms of a toll-treatment agreement with
Rustenburg Platinum Mines Limited, a division of Valterra Platinum Limited.
The Marikana operation (80.64% attributable) processes its own as well as third-party concentrate via a metallurgical smelter and base
metals refinery situated at the operations, and a precious metals refinery complex located in Brakpan, to the east of Johannesburg.
Apart from the primary mining operations, significant secondary mining from tailings treatment operations exist:
•the Platinum Mile tailings retreatment facility 100% owned and managed) recovers PGMs from historic Rustenburg Tailings Storage
Facilities (TSF) as well as live tailings streams from the Rustenburg concentrator plants
•the Western Limb tailings retreatment (WLTR) plant recovers PGMs from historic TSFs at the Rustenburg operation
•the Bulk tailings treatment (BTT) facility recovers chrome and PGMs from the Eastern Platinum Tailings Dam Number 2 TSF at the Marikana
operation
•the Eastern tailings treatment project (ETTP) facility recovers PGMs from live tailings material from the Eastern Platinum Proprietary Limited
concentrator at the Marikana operation. Chrome recovery from EPL live tailings occurs at the EPL Glencore Chrome Recovery Plant
•at the Rustenburg, Kroondal and Marikana operations, chrome concentrate is recovered as a by-product from the UG2 tailings streams
The Akanani exploration project (80.13% attributable) is an exploration asset on the northern limb of the Bushveld Igneous Complex (BIC)
near the town of Mokopane. The Limpopo exploration project, located approximately 50km southeast of Mokopane, consists of the care
and maintenance Baobab operation (80.64% attributable), the Dwaalkop mining right (50:50 JV area with Northam, 40.32% attributable),
and the Doornvlei mining right (80.64% attributable).
Gold
The SA gold operations consists of four managed, producing, underground and surface operations in South Africa, namely the Kloof (100%
attributable), Driefontein (100% attributable) and Cooke (76% attributable) operations in the West Wits region, and Beatrix (100% attributable)
operation in the Free State province.
Burnstone (100% attributable) is a development project in the Mpumalanga province. In addition, and in support of its gold mining activities,
Sibanye-Stillwater owns and manages four metallurgical processing facilities where gold-bearing ore is processed and gold extracted.
Wholly-owned and managed projects in exploration phase include Bloemhoek and De Bron Merriespruit, which form part of the Southern
Free State (SOFS) exploration project.
The Group also reports Mineral Resources and Mineral Reserves on an attributable basis for DRDGOLD Limited (DRDGOLD) due to its 50.10%
equity interest. DRDGOLD operates the Far West Gold Recoveries (FWGR) and the Ergo Gold Recoveries operations.
Uranium
Significant quantities of uranium are present in the historic TSFs of the Cooke operation, as well as in the Beisa project area, a combined gold
and uranium deposit at the Beatrix operation. These are considered exploration (Beisa) or development (Cooke) projects, even though they
occur within existing operational mining right areas.
The feasibility study (FS) into the exploitation of the Cooke dump has been completed, leading to the declaration of a maiden Mineral
Reserve. The Beisa Mineral Resource is reported subject to a pending transaction with Neo Energy Metals PLC, expected to close in 2026, for
the sale of the Beisa uranium asset in exchange for a consideration of R250 million in cash and R250 million in equity in Neo (approximately
40%).
Americas
PGMs
Sibanye-Stillwater wholly owns and operates PGM mining, processing and recycling operations located in Montana, US. These assets include
the Stillwater mine (inclusive of the Stillwater west and east mines), the East Boulder mine, two concentrator plants and PGM mining claims
MANAGEMENT’S DISCUSSION AND ANALYSIS OF THE FINANCIAL STATEMENTS CONTINUED
located near the town of Nye. In addition, the Group owns and operates a metallurgical smelter and base metals refinery complex situated
in the town of Columbus, Montana, which also serves as the base for our PGM recycling business that recovers PGMs from used catalytic
converters. The Group also has a 12.14% (2024: 13.85%) equity holding in Generation Mining Limited, the owners and operator of the
Marathon PGM project in Canada.
At 31 December 2025, the Group holds a 31.47%, non-managed interest in the Altar copper-gold porphyry exploration project in Argentina,
for which a preliminary economic assessment (PEA) was completed in 2025.
Sibanye-Stillwater also wholly owns the Reldan Group of Companies following its acquisition of Reldan (US Pennsylvania recycling site) in
March 2024 and Metallix (US North Carolina recycling sites) in September 2025. The Pennsylvania recycling site processes and refines a range
of precious metals recovered from scrap jewellery, industrial waste, and electronic scrap and the North Carolina recycling sites processes
and refines a range of precious metals recovered from mainly from industrial waste. These materials are transformed into various low- and
high-grade precious metal products. High-grade metals are then sent to third-party, downstream refineries, where they are refined to 99.9%
purity through chemical purification, then cast into ingots or bars and supplied to leading refiners worldwide. Lower-grade materials are sent
to major copper smelters for further processing.
Sibanye-Stillwater acquired Metallix Refining (Metallix US North Carolina recycling site) on 4 September 2025 by acquiring 100% of the Metallix
group of entities for a cash consideration of US$129 million. The North Carolina site produces recycled precious metals, including gold, silver
and platinum group metals (PGMs), primarily from industrial waste streams. It operates two processing and recycling operations in Greenville,
North Carolina. The North Carolina site has a global customer base, which it services from the United Kingdom and South Korea, in addition
to its customers in the United States.
Battery metals
Following the Group's decision to withdraw from the Rhyolite Ridge joint venture agreement, the Group disposed of its investment in ioneer
Limited (ioneer) during H2 2025 with the proceeds on the sale amounting to R186 million.
Europe
Battery metals
The Group is developing the Keliber lithium project in Finland (79.82% attributable). During 2025, construction of the Keliber concentrator
plant and the lithium-hydroxide refinery were advanced as planned, both scheduled for completion in 2026. Ore extraction at the Syväjärvi
open pit mine commenced in February 2026 and the hot commissioning of the Keliber concentrator is expected to start in H1 2026. Hot
commissioning of the Keliber lithium refinery is expected to follow in H2 2026, pending final decision subject to market conditions. Exploration
activities are also ongoing at the extensive mineral title holdings.
Australia
Green metals
The Group owns 100% of the Century zinc operation in Queensland, which operates the largest tailings retreatment operation in Australia.
The Group is undertaking a feasibility study incorporating the mining of neighbouring phosphate deposits as an alternative use for the
considerable fixed infrastructure that would extend the life of the operation, post the TSF depletion.
The feasibility study into reopening the Mt Lyell copper mine in Tasmania (under care and maintenance), has been completed, leading to a
maiden Mineral Reserve being declared.
Metals and Production Summary
At our PGM operations in South Africa and Zimbabwe, the primary PGMs produced are platinum, palladium and rhodium, which together
with gold, are referred to as 4E (3 PGM+Au). 4E Production prill split ratio in 2025 was approximately 59% (2024: 59%) platinum (Pt), 30% (2024:
30%) palladium (Pd), 9% (2024: 9%) rhodium (Rh) and gold (Au) 2% (2024: 2%). Under the Toll arrangement Sibanye-Stillwater uses Valterra
Platinum Limited to smelt and refine concentrate from its Rustenburg operation and it retains ownership of the refined 4E metal produced. At
our Marikana operation all concentrate is smelted to produce furnace matte and is further refined by the base metal and precious metal
refineries. The final refined metals are produced as ingots or sponge and comprise platinum, palladium, rhodium, gold, iridium and
ruthenium which together are referred to as the 6E. Platinum Mile operations remain on a PoC agreement with Valterra Platinum Limited. The
Marikana operation has agreements in place to purchase PGM concentrate from third parties. The processing of third-party material allows
better utilisation of excess smelting and refining capacity.
The US PGM operations primarily produce 78% (2024: 77%) palladium and 22% (2024: 23%) platinum, referred to as 2E (or 2PGM) from primary
mining and 21% (2024: 21%) platinum, 71% (2024: 71%) palladium and 8% (2024: 8%) rhodium, referred to as 3E (or 3PGM) from the recycling
of spent autocatalytic converters. Ore extraction at its mines takes place within the J-M Reef. A mill at each of the mining operations
upgrades the mined production into a concentrated form. Sibanye-Stillwater operates a smelter and base metal refinery in Columbus,
Montana which further upgrades the mined concentrates into a PGM-rich filter cake. The filter cake is then shipped to a third-party refiner
for final refining before the PGMs are sold to third-parties.
Also based in the US, and complementing the US recycling operation at Montana, are the Reldan and Metallix recycling operations which
are located at Pennsylvania and North Carolina, respectively. Reldan processes and refines a range of precious metals recovered from
scrap jewellery, industrial waste, and electronic scrap. These materials are transformed into various low- and high-grade precious metal
products. Metallix operates two processing and recycling operations which produces recycled precious metals, including gold, silver and
platinum group metals, primarily from industrial waste streams
The major sources of demand for PGMs are for use in autocatalysts, various industrial applications and jewellery. Autocatalysts and jewellery
combined accounted for around 60% (2024: 61%) of gross platinum demand in 2025. Gross autocatalyst demand alone accounted for 42%
(2024: 43%) of platinum demand and for 84% (2024: 84%) of palladium demand in 2025. Sibanye-Stillwater sells PGM concentrate from its SA
PGM operations locally and it also sells refined PGMs to customers in the USA, UK, EU, Canada and Japan.
Sibanye-Stillwater mines, extracts and processes gold-bearing ore at its SA gold operations to produce a beneficiated product, doré, which
is then refined at Rand Refinery Proprietary Limited (Rand Refinery) to gold bars with a purity of at least 99.9% in accordance with the
London Bullion Market Association’s standards of Good Delivery. Sibanye-Stillwater holds a 44% interest in Rand Refinery, one of the largest
MANAGEMENT’S DISCUSSION AND ANALYSIS OF THE FINANCIAL STATEMENTS CONTINUED
refiners of gold globally and the largest in Africa. Sibanye-Stillwater sells the refined gold to its customers who are international and local
banks based and a residual amount (below 5%) is sold to Rand Refinery. The main sources of demand for gold are as a store of value (such
as central bank holdings), as an investment (exchange traded funds, bars and coins), jewellery and for various industrial purposes.
The majority of the nickel product at Sandouville was sold to a commodity trading company. The balance of the nickel product was sold to
catalyst producers and plating product distributors.
Zinc concentrate was sold either through traders or directly to smelters in Australia, Korea and China for treatment into a refined 99.995% zinc
metal, ready for sale to end users. The main sources of demand for zinc are for use as a coating to protect iron and steel from corrosion
(galvanized metal), as alloying metal to make bronze and brass, as zinc-based die casting alloy and as rolled zinc.
In 2025, Sibanye-Stillwater delivered attributable PGM production of 1.80Moz (4E) (2024: 1.84Moz (4E)) and 0.28Moz (2E) (2024: 0.43Moz (2E)),
and produced 19,668kg (0.63Moz) (2024: 21,915kg or 0.70Moz) of gold, from its SA PGM, US PGM, SA gold operations respectively. Sibanye-
Stillwater also produced 1,109 tonnes of Nickel (tNi) (2024: 7,705tNi) at Sandouville and 122 kilotonnes (kt) of zinc in a 46.4% zinc concentrate
for 101kt of payable zinc metal at its Century zinc retreatment operation (2024: 100 kt of zinc in a 45.8% zinc concentrate for 82kt of payable
zinc metal).
During the 2025 year, Sibanye-Stillwater incurred a loss of R4,739 million (2024: R5,710 million), of which a R5,171 million loss (2024: R7,297
million) is attributable to the owners of Sibanye-Stillwater.
At 31 December 2025, Sibanye-Stillwater had the following attributable mineral reserves
•2E PGM mineral reserves of 19.4Moz (2024: 19.0Moz)
•4E PGM mineral reserves of 29.4Moz (2024: 28.1Moz)
•gold mineral reserves of 9.4Moz (2024: 10.0Moz)
•zinc mineral reserve of 308.2kt (2024: 552.6kt)
•lithium mineral reserve of 248.4kt (2024: 248.4kt)
•Strategy and Outlook
Strategic Overview
The Group’s refreshed strategy, presented in January 2026, is focused on creating a high‑performing, future‑focused metals business by
unlocking unrealised value across its diversified portfolio of primary mining, secondary mining and recycling operations. The strategy is
designed to enhance returns through the cycle by strengthening operational performance, simplifying the portfolio, applying disciplined
capital allocation and advancing value‑accretive growth opportunities aligned with the global energy transition.
The Group’s strategy is underpinned by a continued emphasis on precious metals, complemented by selective exposure to battery and
energy‑transition metals, supported by its geographic diversification across South Africa, the Americas, Europe and Australia.
Strategic Pillars
The refreshed strategy is structured around four core pillars:
1.Simplification
The Group is simplifying its operating model and asset portfolio to enhance accountability, agility and management focus. This includes
prioritising capital and management attention on assets with the highest return potential, while evaluating partnerships, harvesting strategies
or divestments for non‑core assets to crystallise value and improve capital efficiency.
2.Performance Excellence
Performance excellence is targeted through operational discipline, cost efficiency, productivity improvements and safe, consistent delivery.
Initiatives include portfolio‑wide productivity programmes, enhanced mine planning, digital and technology innovation, and a strong focus
on safety, sustainability and a values‑driven performance culture. These initiatives are expected to support margin improvement, resource
optimisation and improved returns on capital employed.
3.Growth
Growth is focused primarily on organic, value‑accretive projects, with an emphasis on unlocking inherent resource value through brownfield
extensions and low capital‑intensity developments. Key growth areas include South African PGM projects, the transition of the South African
gold portfolio towards higher‑margin production, and the staged start up of the Keliber lithium project in Europe. External growth
opportunities are assessed within a defined value framework, with continued focus on primary mining, secondary mining and recycling
assets aligned with the Group’s core capabilities.
4.Capital Allocation
Capital allocation is governed by a disciplined framework prioritising returns, sustainability and balance sheet resilience. The Group targets
maintaining liquidity sufficient to cover at least two months of operating and capital expenditure, reducing gross debt over the medium
term, and allocating surplus capital between stakeholder returns, debt reduction and life‑extension or growth projects. Capital deployment
decisions are subject to risk‑adjusted hurdle rates and are evaluated on a internal rate of return, net present value and return‑on‑invested-
capital basis.
Portfolio and Growth Initiatives
Within South African PGM operations, the strategy focuses on unlocking resource value through integration benefits, mechanisation projects
and selective internal investments aimed at extending life of mine and increasing future production at relatively low capital intensity.
In the South African gold portfolio, the Group is transitioning towards a higher‑margin, longer‑life production profile, supported by its interest
in DRDGOLD and the evaluation of shallow underground and secondary mining opportunities, including the Burnstone project, subject to
feasibility outcomes and investment approval.
MANAGEMENT’S DISCUSSION AND ANALYSIS OF THE FINANCIAL STATEMENTS CONTINUED
The Keliber lithium project represents a key element of the Group’s battery metals strategy. The project is being progressed through a staged
start‑up approach, providing flexibility and optionality across the value chain, with defined holding points prior to committing to full
battery‑grade lithium hydroxide production. This phased approach is intended to manage execution risk, capital intensity and market
uncertainty while positioning the Group within European critical minerals supply chains.
Operating Model and Organisational Alignment
The previous strategy was supported by a regionalised growth and capital allocation approach with decentralised operational
accountability. The updated strategy presented in January 2026 centralises Group oversight for strategic growth, capital allocation, portfolio
optimisation, project development and execution. This structure is intended to maximise return on capital employed, facilitate the
development of project execution as a core competency and allow for enterprise-wide alignment with the Group's strategic priorities.
Strategic Outlook
Management believes that the refreshed strategy positions the Group to remain resilient in a rapidly changing macroeconomic and
geopolitical environment, characterised by evolving demand dynamics for critical metals, increasing regulation and ongoing commodity
price volatility. By focusing on performance excellence, portfolio simplification, disciplined capital allocation and value‑accretive growth,
the Group aims to improve margins, enhance returns on capital and deliver sustainable value for shareholders and other stakeholders over
the long term.
Factors affecting Sibanye-Stillwater’s performance
Commodity prices
Sibanye-Stillwater’s revenues are derived primarily from the sale of the PGMs and gold produced from its own mines and processed at its
recycling facilities, which include the U.S. Columbus (U.S. PGM recycling) PGM, Reldan and Metallix operations. At these facilities, the Group
generates revenue from the sale of gold, silver, copper, and PGMs recovered from reclaimed industrial manufacturing scrap, post-consumer
electronic scrap, and jewellery scrap, as well as from the sale of silver and mixed scrap. The Group also derives revenues from the sale of zinc
and silver in concentrate from the Century zinc retreatment operation. The Group also derived revenues from the sale of nickel metal and
nickel salts at the Sandouville nickel refinery which ramped down and ceased production during 2025. For mined production, Sibanye-
Stillwater does not generally enter into forward sales, commodity derivatives or other hedging arrangements in order to establish a price in
advance of the sale of its production, unless these derivatives are used for risk mitigation and project funding initiatives. As a result, Sibanye-
Stillwater is normally exposed to changes in commodity prices for its mined production.
However, Sibanye-Stillwater has policies in areas such as counterparty exposure, hedging practices and prudential limits, which have been
approved by Sibanye-Stillwater’s Board of Directors (Board). Management of financial risk is centralised at Sibanye-Stillwater's treasury
department (Treasury), which acts as the interface between Sibanye-Stillwater’s operations and counterparty banks. Treasury manages
financial risk in accordance with the policies and procedures established by the Board and executive committee. The Board has approved
dealing limits for money market, foreign exchange and commodity transactions, which Treasury is required to adhere to. Among other
restrictions, these limits describe which instruments may be traded and demarcate open position limits for each category as well as
indicating counterparty credit-related limits.
Metals recovered from recycled materials at the Columbus metallurgical facilities in Montana, the Reldan facilities in Pennsylvania, and the
Metallix facilities in North Carolina are normally price-hedged at the time the material is purchased. The recovered metal ounces are then
delivered against the hedge instrument once the metals are processed and recovered. This process mitigates exposure to commodity price
volatility during the outturn period, which is approximately sixty to ninety days for Columbus and thirty to one hundred and eighty days for
Pennsylvania and North Carolina sites.
As detailed previously, PGM, gold, nickel and zinc hedging is normally considered under one or more of the following circumstances: to
protect cash flows at times of significant capital expenditures; financing projects; or to safeguard the viability of higher cost operations. For a
list of commodity price hedges for the year ended 31 December 2025, see – Consolidated financial statements – Notes to the consolidated
financial statements – Note 35.2: Risk management activities.
Historically, platinum, palladium and rhodium prices have been subject to wide fluctuations and are affected by numerous factors beyond
Sibanye-Stillwater’s control, including international macroeconomic conditions and outlook, levels of supply and/or demand, any actual or
potential threats to the stability of supply and/or demand, inventory levels maintained by users and producers, liquidity of above ground
excess inventories, actions of participants in the commodities markets and currency exchange rates, particularly the rand to the US dollar.
Platinum
The platinum price gained 125% in 2025. The price traded sideways until late May when it started to rally. The price rose to a record high of
$2,459/oz on 26 December before pulling back in the last few trading days of the year. In South Africa, supply disruptions in the first half of
the year, along with smelter maintenance which resulted in a build-up of partially processed material, reduced the supply of refined
platinum in 2025. China reported significantly higher platinum imports in the first half of the year. The potential for the US to impose tariffs on
imported precious metals resulted in significant transfer of platinum into the US, which reduced liquidity outside the US. The continued strong
rally in gold stretched relative valuations helping to lift platinum higher.
Without the disruptions that impacted 2025, primary production in South Africa is expected to rise in 2026. There are also three projects that
are ramping up production in South Africa and one in Russia. With a higher platinum price China’s platinum imports could be lower than in
2025. A high platinum price may be detrimental to jewellery demand. With the platinum price now substantially higher than the palladium
price there may be some reduction of the platinum loading in gasoline tri-metal autocatalysts with the palladium loading being increased.
The volatility of the price of platinum is illustrated in the platinum price table below (which shows the annual high, low and average market
price of platinum). Over the period from 2023 to 2025, the platinum price fluctuated between a high price of US$2,539/oz and a low price
US$839/oz.
MANAGEMENT’S DISCUSSION AND ANALYSIS OF THE FINANCIAL STATEMENTS CONTINUED
| | | |
| |
| | | |
| | | |
| | | |
| | | |
2026 (through 17 April 2026) | | | |
1 Rounded to the nearest US dollar | | | |
2 Metal price sourced from EquityRT | | | |
The market price of platinum was US$2,056/oz at 31 December 2025 and was US$2,142/oz on 17 April 2026.
Palladium
The palladium price ended 2025 at $1,634/oz, a rise of 84%. The price reached a peak of $2,072/oz in December, its highest price for more
than three years. Reduced output from Stillwater and supply disruptions in South Africa contributed to a decline in primary palladium
production. Battery electric vehicles (BEVs) sales continued to grow, particularly in China and Europe, resulting in lower sales of combustion
engine light vehicles globally, reducing automotive palladium demand. Secondary supply of palladium increased as the rising palladium
price resulted in greater volumes of spent catalytic converters being recycled. Palladium also experienced some pre‑emptive flows into the
US amid tariff‑related trade uncertainty, particularly in response to anti‑dumping investigations focused on Russian supply. However, these
movements were more limited and temporary than those observed in platinum, with a smaller impact on global liquidity.
South African palladium production is anticipated to recover from disruptions last year. A palladium rich project in Russia is ramping up
production and three projects in South Africa will also contribute some additional metal. Nornickel, the largest producer of palladium, has
released production guidance for 2026 that is ~300 koz (~10%) lower than the output achieved in 2025. Globally, production of battery
electric vehicles is predicted to rise faster than the overall market which reduces automotive palladium requirements.
The volatility in the price of palladium is illustrated in the palladium price table below (which shows the annual high, low and average market
price of palladium). Over the period from 2023 to 2025, the palladium price fluctuated between a high price of US$2,072/oz and a low price
US$808/oz.
| | | |
| |
| | | |
| | | |
| | | |
| | | |
2026 (through 17 April 2026) | | | |
1 Rounded to the nearest US dollar | | | |
2 Metal price sourced from EquityRT | | | |
The market price of palladium was US$1,634/oz at 31 December 2025 and was US$1,601/oz on 17 April 2026.
Rhodium
The rhodium price increased by approximately 98% from the average of US$4,638/oz in 2025, ending the year at $9,175/oz. Primary rhodium
supply fell slightly in 2025 owing to disruptions to production in South Africa. Automotive demand for rhodium dipped as BEVs took market
share from combustion engine light vehicles.
A further decline in rhodium automotive demand is anticipated in 2026 because BEVs are forecast to gain greater market share.
The volatility of the price of rhodium is illustrated in the rhodium price table below (which shows the annual high, low and average market
price of rhodium). Over the period from 2023 to 2025, the rhodium price fluctuated between a high price of US$12,400/oz and a low price
US$4,000/oz.
| | | |
| |
| | | |
| | | |
| | | |
| | | |
2026 (through 17 April 2026) | | | |
1 Rounded to the nearest US dollar | | | |
2 Metal price sourced from EquityRT | | | |
The market price of rhodium was US$9,025/oz at 31 December 2025 and was US$10,100/oz on 17 April 2026.
MANAGEMENT’S DISCUSSION AND ANALYSIS OF THE FINANCIAL STATEMENTS CONTINUED
Gold
The gold price rose by 65% in 2025, reaching a record high price of US$4,550/oz in December. The price began the year at $2,624/oz and
ended the year at $4,319/oz. There were several interrelated trends linked to the US economy and geopolitical events that caused investors
to increase their holdings of gold and a weaker US dollar also helped propel the gold price higher. Purchases of gold bars and coins were
higher year-on-year and gold held in ETFs increased significantly. In addition, central bank purchases of gold for their reserves remained at a
high level. However, the high price resulted in lower sales of gold jewellery.
The trend of central banks increasing their gold reserves has been in place for more than 10 years and is likely to continue in 2026, although
the amount purchased may not be as high as in 2025. Further interest rate cuts were projected by the US Federal Reserve, and if the US
dollar weakens that would typically be supportive of a higher gold price. If the gold price remains high gold jewellery demand could decline
further.
The volatility of the price of gold is illustrated in the gold price table below (which shows the annual high, low and average of the London
afternoon fixing price of gold). Over the period from 2023 to 2025, the gold price fluctuated between a high price of US$4,550/oz and a low
price US$1,804/oz.
| | | |
| |
| | | |
| | | |
| | | |
| | | |
2026 (through 17 April 2026) | | | |
1 Rounded to the nearest US dollar | | | |
2 Metal price sourced from EquityRT | | | |
The London afternoon fixing price of gold was US$4,319/oz at 31 December 2025 and was US$4,834/oz on 17 April 2026.
Zinc
Zinc prices weakened sharply in early 2025 but recovered strongly in the second half, ending the year higher, supported by low inventories
and supply‑side constraints despite a broadly balanced‑to‑surplus market. Looking ahead to 2026, market consensus points to a more
subdued price environment, with increasing mine and smelter supply expected to result in a refined zinc surplus. As a result, zinc prices are
forecast to remain range‑bound to slightly lower than late‑2025 levels, with upside largely dependent on renewed supply disruptions or
stronger‑than‑expected demand growth.
The volatility of the price of zinc is illustrated in the zinc price table below (which shows the annual high, low and average market price of
zinc). Over the period from 22 February 2023 to 31 December 2025, the zinc price fluctuated between a high price of US$3,296/t and a low
price US$2,045/t.
| | | |
| |
| | | |
| | | |
| | | |
| | | |
2026 (through 17 April 2026) | | | |
1 Rounded to the nearest US dollar | | | |
2 Metal price sourced from EquityRT | | | |
The market price of zinc was US$3,122/t at 31 December 2025 and was US$3,436/t on17 April 2026.
MANAGEMENT’S DISCUSSION AND ANALYSIS OF THE FINANCIAL STATEMENTS CONTINUED
Silver
Silver ended the 2025 year at $71.26, an increase of approximately 241% from the average of US$29.59/oz in 2025. During the year ended 31
December 2025, the silver price recorded a significant and sustained increase, reflecting a combination of supportive macroeconomic
conditions, strong industrial demand, and tightening supply fundamentals. At the beginning of 2025, silver traded in the low US$30/oz range,
remaining relatively stable through the first half of the year before entering a pronounced upward trend in the second half when the metal
entered an accelerated price rally. The rally was underpinned by robust industrial demand, particularly from the solar photovoltaic,
electronics, and electric vehicle sectors, combined with a persistent global supply deficit, as silver production remained constrained by its
by‑product nature and limited new mine development.
The strong price performance reflected both fundamental supply‑and‑demand dynamics and increased investor participation, which
continued to support prices into early 2026.
The volatility of the price of silver is illustrated in the silver price table below (which shows the annual high, low and average market price of
silver). Over the period from 15 March 2024 to 31 December 2025, the silver price fluctuated between a high price of US$83.62/oz and a low
price US$24.32/oz.
| | | |
| |
| | | |
| | | |
| | | |
2026 (through 17 April 2026) | | | |
1 Rounded to the nearest US dollar | | | |
2 Metal price sourced from EquityRT | | | |
The market price of silver was US$71.26/oz at 31 December 2025 and was US$80.76/t on17 April 2026.
Lithium
The battery grade lithium carbonate price fell to a low of $8,259/t in July 2025. The price then rebounded above $10,000/t during Q3 2025
and accelerated higher in Q4 2025 to end the year at $17,026/t, an increase of 65% over the year. The lithium hydroxide monohydrate
(lithium hydroxide) price was less volatile but followed the same trajectory as lithium carbonate, falling during the first half of the year and
then rebounding. The lithium hydroxide price reached a low of $8,144/t in June and then rallied to the end of year at $14,866/t. Battery
electric and plug-in hybrid vehicle production increased lifting lithium carbonate demand. Battery storage system growth accelerated
during 2025. A major Chinese mine closed down after the expiry of a mining licence in August 2025.
Further growth in battery electric and plug-in hybrid production is forecast which, combined with battery storage system growth, is projected
to lift lithium demand. Mine supply is projected to increase as five projects are scheduled to start up in 2026. Demand is expected to rise by
more than supply leading to a smaller surplus market in 2026.
The volatility of the price of lithium carbonate is illustrated in the table below (which shows the annual high, low and average market price of
lithium carbonate). Over the 2025 year, the lithium carbonate price fluctuated between a high price of US$17,026/t and a low price
US$8,259/t.
| | | |
| |
| | | |
| | | |
2026 (through 17 April 2026) | | | |
1 Rounded to the nearest US dollar | | | |
2 Metal price sourced from Bloomberg | | | |
The market price of lithium carbonate was US$17,438/t at 31 December 2025 and was US$24,568/t on17 April 2026.
The volatility of the price of lithium hydroxide is illustrated in the table below (which shows the annual high, low and average market price of
lithium hydroxide). Over the 2025 year, the lithium hydroxide price fluctuated between a high price of US$14,866/t and a low price
US$8,144/t.
| | | |
| |
| | | |
| | | |
2026 (through 17 April 2026) | | | |
1 Rounded to the nearest US dollar | | | |
2 Metal price sourced from Bloomberg | | | |
The market price of lithium hydroxide was US$14,866/t at 31 December 2025 and was US$24,568/t on17 April 2026.
Exchange rate
Sibanye-Stillwater’s SA PGM and gold operations (with the exception of Mimosa) are all located in South Africa, and its revenues are equally
sensitive to changes in the US dollar PGM (4E) basket and gold prices, and the rand/US dollar exchange rate (the exchange rate).
Depreciation of the rand against the US dollar results in Sibanye-Stillwater’s revenues and operating margins increasing. Conversely, should
the rand appreciate against the US dollar, revenues and operating margins would decrease. The impact on profitability of any change in
the exchange rate can be substantial. Furthermore, the exchange rates obtained when converting US dollars to rand are set by foreign
MANAGEMENT’S DISCUSSION AND ANALYSIS OF THE FINANCIAL STATEMENTS CONTINUED
exchange markets, over which Sibanye-Stillwater has no control. The relationship between currencies and commodities, which includes the
PGM (4E) basket, gold, nickel, silver and zinc prices, is complex, and changes in exchange rates can influence commodity prices, and vice
versa.
Costs
Sibanye-Stillwater’s cost of sales, before amortisation and depreciation comprise mainly labour and contractor costs, power and water,
processing and smelting and consumable stores which include, inter alia, explosives, timber, processing chemicals, steel and related
products and other consumables. Sibanye-Stillwater expects that its cost of sales, particularly the input costs noted above, are likely to
continue to increase in the near future and will be driven by inflation, general economic trends, market dynamics and other regulatory
changes. In order to restrict these cost inputs, there is a continuous programme driven by operational initiatives throughout the Group to
improve efficiencies and productivity.
Inflation moderated across key jurisdictions during 2025. In South Africa, CPI declined to an average of 3.2%, the lowest annual inflation rate
in over two decades (2024:4.4%), although mining‑sector inflation continued to exceed headline CPI due to above‑inflation wage increases,
electricity tariffs and higher input costs. In the US, inflation eased further to an average of approximately 2.7% in 2025 (2024: 2.9%), while in
Europe inflation declined significantly, with France recording approximately 0.8% (2024: 2.0%) and Finland approximately 0.2% (2024: 0.7%). In
Australia, CPI remained elevated at approximately 3.7% in 2025 (2024: 4.1%), reflecting persistent labour and energy cost pressures, despite
moderating headline inflation. Across all regions, cost pressures in energy‑intensive and labour‑dependent operations continued to exceed
general inflation trends.
Sibanye-Stillwater’s operations are labour intensive. Labour represented 34% and 32% during 2025 and 2024, respectively, of Group cost of
sales, before amortisation and depreciation.
Sibanye-Stillwater concluded a five-year wage agreement for its Kroondal operation on 6 November 2023. The wage agreement was signed
with the National Union of Mineworkers (NUM) and the Association of Mineworkers and Construction Union (AMCU), in respect of wages and
conditions of service for a five-year period from 1 July 2023 to 30 June 2028. The basic wage increase for Category 4-8 employees is 6% per
annum over the five year period. Miners, artisans and officials will also receive 6% per annum over the five-year period.
The SA PGM operations concluded a five-year wage agreement on 28 October 2022, for its Rustenburg and Marikana PGM operations with
the AMCU. This agreement follows previous agreements reached with NUM and UASA (formerly known as United Association of South Africa)
on 30 September 2022. The final agreement with AMCU is consistent with the previous five-year, inflation-linked offer, with the first three years
still comprising fixed, average, annual wage increases of 6% and above for bargaining unit employees, but with increases for year four and
five fixed at R1,300 (or 6%) in year four and R1,400 (or 6%) in year five, compared with the previous offer’s CPI-linked variable increases.
Miners and artisans will receive average annual wage increases of 6% per annum for each of the five years. The increases in other benefits
remain the same as the previous offer. The final agreement was extended to all unionised and non-unionised employees at these
operations.
Sibanye-Stillwater concluded a three-year wage agreement in December 2025 at its SA gold operations. The wage agreement was signed
with AMCU, NUM, UASA and Solidarity regarding annual wage and benefit increases for the SA gold employees. The agreement is effective
for three years from 1 July 2025 to 30 June 2028, with the estimated average three-year basic wage increase for the total bargaining-unit
wage bill, including all benefits, approximately 5.4% per annum. Category 4- 8 employees will receive an increase on the greater of the
standard rate of pay of R850 or 4.5% in year 1; R900 or 4.8% in year 2; and R1,000 or 5.0% in year 3 while miners, artisans and officials will
receive increases of 4.5% in year 1, 4.8% in year 2 and 5.0% in year 3 of the agreement.
Historically, the South African mining industry experienced union unrest. Unions such as AMCU and NUM are dominant in the industry and
engagements remain robust, but could result in disputes and industrial action, with the risk of disrupting Sibanye-Stillwater’s business and
expose Sibanye-Stillwater to liability.
In the United States, Sibanye-Stillwater’s employees located at the US PGM operations, which include the Stillwater and East Boulder mines
and the Metallurgical Complex are covered by two collective bargaining agreements with the United Steel Workers Local 11-001 (USW Local
11-0001). Sibanye-Stillwater and the United Steel Workers International Union (USW) agreed to one-year contract extensions in June 2025. The
Stillwater Mine and Columbus contract expires on May 31, 2026, and the East Boulder Mine contract expires on July 31, 2026. Sibanye-
Stillwater is subject to the risk of strikes and other labour disputes at its US PGM operations, and its ability to alter labour costs is restricted by
the fact that unionised employees are party to collective bargaining agreements.
Labour represented approximately 3.35% of Sibanye-Stillwater’s Pennsylvania (Reldan) recycling operations costs for 2025 (2024: 3%).
Pennsylvania recycling site workforce is non-unionised and received an inflationary adjusted wage increase of approximately 4% for the
2025 financial year (2024: 4%).
Labour represented approximately 5.87% of Sibanye-Stillwater’s North Carolina (Metallix) recycling operations costs for 2025 (since
acquisition: 4 September to 31 December 2025). North Carolina recycling site workforce is non-unionised and received an inflationary
adjusted wage increase of approximately 3.22% for the 2025 financial year.
In France, it is mandatory to engage with the Unions once a year to discuss compensation/ hours of work and this annual negotiation is
called “Négociation Annuelle Obligatoire” (NAO). This annual meeting ends up either with a signed agreement or with a signed
disagreement. At Sandouville, the negotiation period takes place early in the year and the provisions are effective backdated to 1January
of the same year. Following the stoppage of the matte processing in Sandouville an agreement on a voluntary leave plan was reached with
the unions in 2025 leading to 86 leavers until December 2025. In January 2026 another agreement was signed on partial unemployment for
all staff at a maximum of 40% unemployment per employee on average in order to reduce further the working headcount down to 62. This
plan was endorsed by the French Authorities on the 5th of January 2026 for 24 months subject to the conditions that the employer does not
make any redundancy (otherwise, the unemployment indemnities must be reimbursed) and that staff employees are trained and
developed to adapt to the future industrial environment.
The Australian labour market remained competitive in 2025, particularly in the mining sector, which continues to experience above‑average
job vacancy rates and strong demand for skilled labour. Mining maintains one of the highest vacancy rates in the country at around 4.3%,
MANAGEMENT’S DISCUSSION AND ANALYSIS OF THE FINANCIAL STATEMENTS CONTINUED
indicating sustained workforce pressure, and overall national employment is still growing - increasing 1.2% over the past year to January
2026. The Mt Lyell Project, which is currently in care and maintenance, has an existing, but expired, wage agreement which is in the process
of being renegotiated. For the Century and Karumba operations in far North Queensland and the Australian regional office, no wage
agreements are in place, preferencing a direct engagement with employees and wage increases are based on a paid for performance
approach, with the overall wage increase not exceeding 3% for 2026.
The purchasing costs of spent catalytic material incurred by the US PGM recycling operation are variable and correlated with the PGM
prices and comprised 17% and 7% of Group Cost of Sales, before amortisation and depreciation in 2025 and 2024 years, respectively.
Similarly, the purchasing costs of third-party concentrate at the SA PGM operations are variable and correlated with the PGM prices and
comprised 3% and 6% of the total SA PGM cost of Sales, before amortisation and depreciation in 2025 and 2024.
During 2025 electricity tariffs continued to increase above inflation. Power and water together accounted for 14% in 2025 and 12% in 2024 of
Group cost of sales before amortisation and depreciation. Notwithstanding this, operating costs at the Group’s SA PGM and SA gold
operations increased during the year, driven primarily by above‑inflation increases in labour, electricity and consumable input costs.
Labour costs were impacted by wage increases concluded through collective bargaining agreements, while electricity tariffs and
consumable prices continued to increase at rates exceeding headline inflation. Electricity supplied by Eskom increased by an average of
12.74% during 2025, while no increases were recorded for electricity supplied by independent power producers (IPPs), as these facilities only
commenced generation in March and September 2025, with future tariff increases expected to be CPI‑linked.
During 2025, electricity consumption sourced from Eskom decreased to 94.4% (4,597,230 MWh), with renewable energy procured under
power purchase agreements accounting for 5.6% (293,042 MWh) of total consumption. Renewable energy supply is expected to increase
further during 2026. In addition, management expects approximately 20% cost savings on electricity supplied under IPP and trader contracts
relative to Eskom tariffs.
These cost pressures resulted in higher unit costs and adversely affected operating margins during the period. Although the SA PGM and SA
gold operations benefit from US dollar‑linked revenues against predominantly rand‑denominated cost structures, providing a partial natural
hedge, this did not fully mitigate the impact of sustained above‑inflation cost increases during the period. As a result the Group’s SA PGM
and SA gold operations remain sensitive to ongoing cost inflation, notwithstanding favourable movements in the ZAR/USD exchange rate.
Production
Sibanye-Stillwater’s revenues are driven by its production levels and the price it realises from the sale of PGMs, gold, nickel, zinc and
associated co- and by- products, as discussed above. Production can be affected by a number of factors including mining grades, safety
related work stoppages, industrial action and other mining related incidents and any global grey elephant events including climate change
related events such as a flood and bush fires in some operations. These factors could have an impact on production levels in the future.
The SA PGM operations production of 1,797,928 4Eoz for 2025 (including attributable ounces from Mimosa and third-party PoC) was 2% lower
than 2024. The decrease in production from the SA PGM operations year-on-year was mainly due to underground production from the
Marikana operations which declined due to safety related stoppages (particularly at the high production Saffy shaft). 4E PGM PoC
production was 24% lower when compared to 2024 at 73,150 4Eoz for 2025, mainly due to heavy rainfall and the transition between tailings
storage facilities.
Gold production at the managed SA gold operations of 15,066 kg (484,383 oz) for 2025 was 11% lower than 2024, mainly resulting from
significant operational disruptions at the Kloof operation compounded by elevated seismicity in high grade Isolated Blocks of Ground.
Mined PGM production from the US PGM operations in 2025 of 284,069 2Eoz was 33% lower mainly due to the reduced production profile
following restructuring undertaken during 2024 in which the Stillwater West mine was placed on care and maintenance from the end of
2024. 3E PGM recycled production for 2025 decreased marginally by 2% to 308,617 3Eoz.
The Columbus (US PGM) recycling operations fed an average of 10.2 tonnes per day of spent autocatalyst for 2025, 4% lower than for 2024.
The Pennsylvania (Reldan) recycling operations sold 138,977 oz gold, 2,031,547 oz silver, 17,697 oz platinum, 24,103 oz palladium and 3.1
million lbs of copper and processed 8.9 million lbs of industrial scrap. For the four months ended 31 December 2025 the North Carolina
(Metallix) recycling operations contributed revenue of R1,590 million.
The Sandouville refinery produced 628 tonnes of nickel metal (tNi) in 2025 representing a decrease of 90% compared to 2024 and 481 tonnes
of nickel salts representing a decrease of 58% compared to 2024. The overall production of 1,109tNi was 86% lower year-on-year as the site
ramped down and ceased production during 2025.
The Century zinc tailings retreatment operation produced 101kt of payable zinc metal at an AISC of R34,356/tZn (2024: R42,446/tZn).
Production for 2025 increased by 22% due to positive weather conditions which enabled increased run time and plant stability with
increased throughput and favourable head grade and recoveries.
Safety stoppages
Stringent enforcement of mine health and safety legislation is increasing in South Africa. In certain instances, environmental conditions may
contribute to safety risks, which could also result in the issuance of safety-related stoppage instructions. Regulators, such as the Department
of Mineral Resources and Energy in South Africa, can and do issue in the ordinary course of operations, instructions, such as Section 54 work
stoppages, after routine visits or following safety incidents or accidents to partially or completely halt operations at affected mines until
corrective measures are agreed and implemented. In 2025, Sibanye-Stillwater’s South African gold operations experienced 16 Section 54
work stoppages (2024: 24) and 21 Section 54 work stoppages at the South African PGM operations (2024: 27).
In the United States, underground mines, including the Stillwater and East Boulder Operations, are continuously inspected by the Mine Safety
and Health Administration (MSHA) which can lead to notices of violation. Any of Sibanye-Stillwater’s US mines could be subject to a
temporary or extended shut down as a result of a violation alleged by the MSHA, known as “k-orders”. In 2025 the US Region had 4 “k-orders”
issued (2024: 6).
MANAGEMENT’S DISCUSSION AND ANALYSIS OF THE FINANCIAL STATEMENTS CONTINUED
The Sibanye-Stillwater Pennsylvania (Reldan) and North Carolina (Metallix) recycling operations did not have any work stoppages as a result
of inspections by the Occupational Safety and Health Administration (OSHA) and the Environmental Protection Agency (EPA).
At the European region at Keliber there were no regulatory stoppages to the development of the project by the occupational authorities.
The Australian region did not have any work stoppages as a result of inspections by the relevant governing bodies, including Resources
Safety & Health Queensland and WorkSafe Tasmania.
Royalties, carbon tax and mining tax
The following is a summary of certain material tax considerations applicable to the Group and is not intended to be complete analysis of all
tax consequences. The summary below is based on laws and administrative practice in force as of the date hereof, which may be subject
to change, potentially with retrospective effect.
South Africa
Mining operations in South Africa are subject to a royalty payable to the South African government based on revenue, in terms of the
Mineral and Petroleum Resource Royalty Act 2008 (Royalty Act). The Royalty Act imposes a royalty on the transfer of mineral resources and
provides for different royalty formulae for refined and unrefined mineral resources. The Royalty Act imposes a royalty on the transfer of
mineral resources and provides for different royalty formulae for refined and unrefined mineral resources. Mineral resources are classified as
refined or unrefined with reference to the conditions prescribed in Schedule 1 (refined) and Schedule 2 (unrefined) of the Royalty Act. The
royalty rate is determined using a sliding‑scale formula that takes into account (among other factors) gross sales and a profitability measure,
subject to statutory caps. Based on published guidance, the royalty rate ranges from a minimum of 0.5% up to a maximum of 5% for refined
minerals and up to a maximum of 7% for unrefined minerals.
The Carbon Tax Act, 2019 (the Carbon Tax Act), with effect from 1 June 2019, which imposes a tax on carbon dioxide equivalent (CO₂e)
emissions in excess of applicable tax‑free allowances. Carbon tax liability is determined with reference to gross CO₂e emissions, reduced by
tax‑free allowances and offsets available under the Carbon Tax Act and related regulations. As a result of these allowances, the effective
carbon tax burden may be significantly lower than the statutory carbon tax rate, depending on its emissions profile and eligibility for
allowances. The Carbon Tax Act was amended in 2022 to provide for progressive increases in the statutory carbon tax rate, which is
scheduled to increase from R236 per tonne in 2025 to R462 per tonne by 2030, with further increases to be announced thereafter. In parallel,
certain tax‑free allowances are expected to be phased down over time, which is anticipated to result in a gradual increase in the Group’s
effective carbon tax rate. Proposed amendments to the Carbon Tax Act provide for the introduction of a higher carbon tax rate of R640 per
tonne of CO₂e in respect of emissions exceeding an allocated carbon budget, to become effective once the mandatory carbon budget
system is operational and brought into force by notice of the Minister of Finance. The proposed exceedance rate would apply without
tax‑free allowances and is intended to be punitive in nature. The previous 5% carbon budget‑linked allowance under the Carbon Tax Act
ceased on 31 December 2025.
Under South African tax legislation, gold mining companies and non-gold mining companies are taxed at different rates. Sibanye- Stillwater’s
SA gold operations are subject to the gold tax formula on their respective mining incomes. The formula calculating tax payable, is affected
by the profitability of the applicable gold mining operation. In addition, these gold mining operations are ring fenced from a capital
expenditure perspective. As a result, only taxable losses can be offset between the Beatrix, Kloof and Driefontein operations (as these are
separate mining operations under one legal entity, Sibanye Gold Proprietary Limited) to reduce taxable income from another operation.
Depending on the profitability of the operations, the tax rate can vary significantly from year to year. Sibanye-Stillwater’s SA PGM operations
are subject to the tax at the South African corporate income tax (CIT) rate and the mining operations are also ring fenced from capital
expenditure. For 2024 and subsequent years a CIT rate of 27% applies to Sibanye-Stillwater and its South African subsidiaries, which apply a
CIT rate, but are reassessed by the government on an annual basis.
In the United States, there are no federal taxes specific to mineral extraction; mining companies are subject to general federal, state, county
and municipal taxes, including income, payroll, sales, property and use taxes. Sibanye-Stillwater’s US PGM operations are subject to the US
federal corporate income tax rate of 21% and are subject to tax in the states of California, Colorado, Florida, Montana, North Carolina,
Pennsylvania and Utah. The Inflation Reduction Act (IRA) of 2022 added a new tax code, Section 45X, which allows for an advanced
manufacturing production tax credit for manufacturing of critical minerals within the US. Under the final rules issued in October 2024, the
company is eligible to claim a 10% production tax credit on costs associated with the production of primary (mined) and secondary
(recycled) applicable critical minerals. Due to the fact that the US PGM operations outsources the purification of platinum, palladium and
rhodium to an unrelated third party refinery, it is required that the US PGM operations must enter into an agreement with the third party that
identifies the US PGM operations as the sole party that may claim the credit and both the third party and the US PGM operations signs a
certification statement reflecting this agreement. During June 2025, the certification statements relating to the 31 December 2023 and
31 December 2024 financial years were signed by the US PGM operations and the third party refinery. The refining agreement was also
amended to address the certification for the remainder of the contract period. Accordingly, R2,472 million and R1,931 million were
recognised as income during the year ended 31 December 2025, but in respect of the 2023 and 2024 Section 45X credits, respectively.
These credits are expected to be received in 2026 or 2027 when the tax returns will be assessed by the relevant authority. There is no carbon
tax in the United States.
From 1 January 2024, private parties carrying out mining activities in Finland are subject to a separate tax on mined minerals under the Act
on Mined Minerals Tax (314/2023). The tax applies to minerals mined in Finland, excluding minerals obtained through gold panning, and is
payable by the entity holding the mining permit. Metallic minerals are subject to a value‑based royalty of 0.6% of the taxable value of the
metal contained in the mined mineral. The taxable value is determined based on international market prices and applies to an exhaustively
listed group of metals, including precious metals (such as gold, silver, platinum and palladium), base metals (including copper, nickel,
cobalt, zinc and lead), as well as iron, lithium and uranium. The taxable values are confirmed annually by the Finnish Tax Administration.
Under current legislation, the mining tax applies in addition to corporate income tax and other generally applicable taxes. Amendments
approved by the Finnish Parliament in December 2025 will significantly increase the mining tax rates from 1 January 2026, including an
increase in the value‑based royalty on metallic minerals and the volume‑based royalty on industrial minerals. These increases are not
effective for 2024 or 2025. Under Finnish tax legislation, resident companies are subject to Finnish corporate income tax at a rate of 20% on
their taxable income. While the Finnish government has announced a reduction of the corporate income tax rate to 18% from 2027, this
MANAGEMENT’S DISCUSSION AND ANALYSIS OF THE FINANCIAL STATEMENTS CONTINUED
change has not yet entered into force. Finland also levies a carbon tax on fossil fuels, calculated based on the amount of CO₂e emissions
rising from their use. The carbon tax rate applicable in 2024 and 2025 is approximately €93 per tonne of CO₂e, subject to fuel‑specific
adjustments and interactions with the EU Emissions Trading System. Keliber is not paying any corporate income tax as it remains in the project
development phase and is currently incurring losses.
Australian tax legislation levies a 30% tax on corporate income and Australia does not levy a national carbon tax. There was no corporate
income tax liability for the Australian region at 31 December 2025. Royalty tax is payable on zinc concentrate produced in all states of
Australia. All royalty systems in Australia are value-based, and the rate applied depends on the form in which the mineral is sold and the
sales price. For concentrate material subject to substantial enrichment through a concentration plant, which is produced in Queensland,
the royalty rate is varies between 2.5 and 5.0 per cent of the sales value.
Sensitivity Analysis
The Group’s financial performance is exposed to movements in commodity prices, exchange rates and operating costs. The following
sensitivity analysis illustrates the effect of reasonably possible changes in these key variables on adjusted EBITDA for the year ended
31 December 2025, assuming all other variables remain constant.
A 10% decrease or increase in the gold price, at the SA gold operations, would have resulted in an approximate increase or decrease,
respectively, of R3,199 million in adjusted EBITDA.
A 10% decrease or increase in the 4E PGM basket price, at the SA PGM operations, would have resulted in an approximate increase or
decrease, respectively, of R4,971 million in adjusted EBITDA.
A 10% decrease or increase in the 2E PGM basket price, the US PGM underground operations, would have resulted in an approximate
increase or decrease, respectively, of R539 million in adjusted EBITDA.
A 10% decrease or increase in the average equivalent zinc concentrate price price would have resulted in an approximate increase or
decrease, respectively, of R420 million in adjusted EBITDA.
A 10% decrease or increase in the price of all commodities of the Group i.e. gold, 2E PGM basket, 3E PGM basket, 4E PGM basket,
average equivalent zinc concentrate and nickel equivalent basket price would have resulted in an approximate decrease or increase in
adjusted EBITDA of R8,099 million and R9,898 million, respectively.
The above sensitivities ares based on attributable production for the year and excludes the impact of any hedging arrangements.
The Group’s operating cost base is predominantly denominated in South African rand. A 10% strengthening of the rand against the US dollar
would have resulted in an approximate decrease in the Group adjusted EBITDA of R10,137 million and a 10% weakening of the rand against
the US dollar would have resulted in an approximate increase in the Group adjusted EBITDA of R10,531 million.
A 10% decrease or increase in operating costs would have resulted in an approximate decrease or increase, respectively, of R8,902 million in
adjusted EBITDA.
These sensitivities are intended to provide an indication of the potential impact of changes in key variables and do not reflect the effects of
any mitigating actions that management may take in response to such changes.
Capital management outlook
The Group’s capital management objectives remain focused on maintaining balance sheet strength, preserving liquidity through the
commodity price cycle and ensuring ongoing compliance with financial covenants. Capital allocation priorities include sustaining capital
expenditure required to maintain safe and efficient operations, completion of committed growth projects, disciplined debt reduction and
shareholder returns.
Capital expenditure
Capital allocation falls under one of the Group's strategic essentials and under the refreshed strategy recently announced in January 2026,
the Group will ensure capital allocation through a disciplined framework prioritising returns, balance sheet and growth flexibility and securing
sustainability. Capital allocation priorities start with using the net cash from operating activities before dividends and ensuring that the non-
negotiable capital requirements of sustaining and ore reserve development capital, and a liquidity buffer of greater than 2 months of opex
and capex are covered. The remaining capital available for allocation is then available to be utilised with approximately one third going to
each of the following: Stakeholder returns, Debt reduction and Life extension and/or growth. Stakeholder returns are determined in line with
the Group's dividend policy with a payout ratio of between 25% to 35% of normalised earnings. The targeted outcomes of capital allocation
are to ensure that the Group is able to maintain a net debt:Adjusted EBITDA ratio of less than one times through the cycle and a targeted
reduction in gross debt over the next 2 to 3 years from existing levels.
Current capital projects include the K4 project at the SA PGM operations and Keliber lithium project in Finland, both of which are in their final
stages of completion. The Burnstone project remained on care and maintenance during 2024 and 2025. Due to the high gold price, the
options to continue development of the Burnstone project are being evaluated and the Group is following its internal approval process with
a decision expected by the end of Q2 2026 .
In 2025, Sibanye-Stillwater’s total cash capital expenditure was R20,307 million (2024: R21,569 million), a decrease of 6%. Capital spend in
2025 remained stable on the Keliber project and the the decrease was mainly due to a reduction in capital expenditure spend at the US
PGM operations, following the restructuring in 2024 which placed Stillwater West mine on temporary care and maintenance.
Sibanye-Stillwater expects to spend approximately R19.3 billion on capital in 2026, which includes the capital expenditure of DRDGOLD
(R3.4 billion) and Mimosa (R0.3 billion). The actual amount of capital expenditure will depend on a number of factors, such as production
volumes, the commodity prices and general economic conditions and may differ from the amount forecast. Some of these factors are
outside of the control of Sibanye-Stillwater.
MANAGEMENT’S DISCUSSION AND ANALYSIS OF THE FINANCIAL STATEMENTS CONTINUED
SA PGM operations
Capital expenditure at the SA PGM operations increased by 1% from R5,845 million in 2024 to R5,886 million in 2025, with ore reserve
development 5% lower at R2,344 million (2024: R2,472 million), sustaining capital 12% higher at R2,867 million (2024: R2,566 million) and project
spend decreasing by 16% from R807 million in 2024 to R675 million in 2025. Sustaining capital of R2,867 million was 12% higher mainly due to
the replacement and upgrades of essential equipment at the mining operations and infrastructure upgrades at the Precious Metals Refinery
(PMR). Project capital of R675 million was 16% lower primarily due to deferred spending on the Marikana K4 and Siphumelele projects.
Project capital decreased by 16% to R675 million due to the completion of expenditure for a reflux classifier plant at Rustenburg during 2024,
and a 10% decline in project capital at K4 project to R590 million in line with the ramp-up plan.
SA gold operations
Total capital expenditure at the managed SA gold operations decreased by 4% from R3,882 million in 2024 to R3,721 million in 2025. Project
capital at the managed SA gold operations decreased by 96% to R14 million in 2025 (2024: R354 million) mainly due to the Burnstone project
being placed on care and maintenance during H1 2024. Capital expenditure at DRDGOLD remained elevated due to expenditure on the
Far West Gold Recoveries facility but decreased by 12% to R3.0 billion primarily due to a 15% decrease in project capital expenditure.
US PGM operations
Capital expenditure at the US PGM operations for 2025 was 40% lower at R1,713 million (2024: R2,834 million) with sustaining capital 41% lower
at R366 million (2024: R623 million) and ore reserve development (ORD) expenditure 37% lower at R1,212 million (2024: R1,920 million). This was
in line with the Q4 2024 restructuring plan mentioned previously. Project capital expenditure decreased by 54% to R135 million for 2025.
US Pennsylvania (Reldan) and North Carolina (Metallix) recycling operations
Total sustaining capital expenditure at the US Pennsylvania (Reldan) and North Carolina (Metallix) recycling operations was R46 million
(2024: R10 million).
European region
Total capital expenditure from the European region included project expenditure capitalised on the Keliber project of R5,756 million
(EUR296 million) and sustaining capital expenditure at Sandouville nickel refinery was R28 million. At the end of December 2025, total project
capital expenditure for the construction phase amounted to €693 million (R14.1 billion) (excluding capitalised interest and exploration) and
in line with the revised capital forecast of €783 million (R15.9 billion) in 2024 real terms.
Australian region
Total capital expenditure from the Century operation decreased by 39% from R192 million in 2024 to R114 million in 2025 and included
R59 million of sustaining capital expenditure and R55 million of growth projects. The decrease in sustaining capital expenditure was due to
once off infrastructure expenditure in 2024 post the bushfire recovery, and the five yearly scheduled maintenance overhaul for the Century
transhipment vessel, the Wunma. Sustaining capital expenditure during 2025 focused on maintaining asset integrity, strengthening
operational resilience and ensuring the long-term reliability of critical infrastructure. Project capital expenditure of R55 million was due to
spend and capitalisation of costs relating to the phosphate feasibility study that commenced in 2025.
Mt Lyell copper project:
The Mt Lyell feasibility study (AACE Class 2 Estimate) was completed at the end of 2025. The work undertaken during the year allowed the
declaration of a 1,053Mlb copper Mineral Reserve at 31 December 2025. Progression of any further study work and a final investment
decision to be evaluated in accordance with the Group's capital allocation framework and subject to final board approval.
Project capital amounted to R66 million in 2025 due to spend and capitalisation of the Mt Lyell feasibility study costs.
MANAGEMENT’S DISCUSSION AND ANALYSIS OF THE FINANCIAL STATEMENTS CONTINUED
2025 financial performance compared with 2024
Group loss for the year decreased from R5,710 million in 2024 to R4,739 million in 2025. The reasons for this decrease are discussed below. The
primary factors explaining the movement are set out in the table below.
| | | |
Figures in million – SA rand | | | |
| | | |
| | | |
| | | |
| | | |
Share-based payment expenses | | | |
(Loss)/gain on financial instruments | | | |
Gain/(loss) on foreign exchange differences | | | |
Share of results of equity-accounted investees after tax | | | |
| | | |
Occupational healthcare gain | | | |
| | | |
Onerous contract provision utilisation/change in estimate/(provision) | | | |
| | | |
Transaction and project costs | | | |
| | | |
Change in estimate of environmental rehabilitation obligation, and right of recovery receivable and payable | | | |
Cost incurred on employee and community trusts | | | |
Corporate and social investment costs | | | |
| | | |
| | | |
| | | |
Profit/(loss) before royalties, carbon tax and tax | | | |
| | | |
| | | |
| | | |
| | | |
| | | |
Group financial performance
Group revenue for 2025 increased by 16% to R129,677 million mainly due to higher commodity prices received at all operations except the
Century operations, partially offset by lower sales volumes at the SA gold, SA and US PGM operations and Sandouville nickel refinery. The
acquisition of North Carolina recycling operations (Metallix) was the primary reason for the 8% increase in Group cost of sales before
amortisation and depreciation to R88,439 million, partially offset by the S45X advanced manufacturing production credits of R5,885 million
recognised during 2025, but in respect of 2023, 2024 and 2025 reporting periods and lower cost of sales at the Sandouville nickel refinery.
Group loss before royalties, carbon tax and tax decreased by 120% or R4,403 million to R734 million profit in 2025, which is mainly attributable
to the increase in revenue of R17,548 million and reduction in cost of sales of R7,403 million, partially offset by a net adverse movement in loss
on financial instruments of R9,227 million, an in increase share based payment expenses of R1,863 million (a function of the share price), a
net increase in impairments recognised of R4,834 million, a decrease in other income of R1,250 million and an increase in transaction and
project costs of R3,692 million (mainly related to the Appian settlement of R3,607 million). Group adjusted EBITDA for 2025 increased by 189%
or R24,712 million to R37,800 million.
MANAGEMENT’S DISCUSSION AND ANALYSIS OF THE FINANCIAL STATEMENTS CONTINUED
Revenue
| | | |
Figures in million – SA rand | | | |
Southern African operations | | | |
| | | |
Managed SA gold operations | | | |
| | | |
| | | |
| | | |
US PGM underground operations | | | |
Columbus recycling operation (US PGM Recycling) | | | |
Pennsylvania (Reldan) and North Carolina (Metallix) recycling operations2 | | | |
| | | |
Sandouville nickel refinery | | | |
| | | |
Century zinc retreatment operation | | | |
Group Corporate and reconciling items1 | | | |
| | | |
1 Included in Group Corporate and reconciling items is net revenue generated through the streaming arrangement with Wheaton International
2 The North Carolina (Metallix) recycling operations, acquired effective 4 September 2025 are included in cost of sales from September 2025 and the Pennsylvania (Reldan)
recycling operations are included in cost of sales from March 2024
Revenue from the SA PGM operations increased by 19% to R60,883 million in 2025 from R51,257 million in 2024, due to a 28% higher average
4E basket price received of R31,110/4Eoz, partially offset by a 4% or 71,074 4Eoz decrease in PGMs sold.
Revenue from the managed SA gold operations increased by 16% to R27,930 million (2024: R24,077 million) in 2025, mainly due to a 31%
higher rand gold price of R1,803,144/kg, partially offset by a 16% or 2,776 kg decrease in gold sold mainly due to lower production resulting
from significant operational disruptions at the Kloof operation compounded by elevated seismicity in high grade Isolated Blocks of Ground.
Revenue from DRDGOLD increased by 29% to R9,129 million (2024: R7,068 million) mainly due to a 40% higher rand gold price received of
R1,967,881/kg, partially offset by 8% lower sales volumes.
Revenue from the US PGM underground operations decreased by 27% to R6,718 million (2024: R9,207 million) in 2025 due to a 39% decrease
in mine ounces sold, which correlates with the lower production achieved. post the restructuring undertaken from Q4 2024 in which the
Stillwater West mine was placed on care and maintenance, partially offset by 21% higher average 2E basket price of US$1,195/2Eoz.
Revenue from the Columbus recycling operation (US PGM Recycling) decreased by 4% to R7,267 million (2024: R7,574 million) in 2025, mainly
due to 10% lower sales volumes, partially offset by a 9% higher average 3E basket price of US$1,383/3Eoz.
Revenue from the Pennsylvania (Reldan) and North Carolina (Metallix) recycling operations increased due to higher commodity prices and
the inclusion of the North Carolina (Metallix) recycling operations acquired during September 2025, the results of which are consolidated into
the Reldan Group. This resulted in revenue increasing by 108% to R13,129 million (2024: R6,306 million), which included revenue from the
North Carolina (Metallix) recycling operations for 2025 of R1,590 million (2024 Rnil).
Revenue from the Sandouville nickel refinery decreased by 81% to R518 million (2024: R2,784 million) in 2025, mainly due to an 81% decrease
in sales volumes.
Revenue from the Century zinc retreatment operation increased by 17% to R4,672 million (2024: R3,983 million) in 2025, mainly due to an 11%
increase in sales volumes, partially offset by a 1% lower average equivalent zinc concentrate price of R48,584/tZn.
MANAGEMENT’S DISCUSSION AND ANALYSIS OF THE FINANCIAL STATEMENTS CONTINUED
Cost of sales
The primary drivers of cost of sales are set out in the table below. The analysis that follows provides a more detailed discussion of cost of
sales, together with the total cash cost, All-in sustaining cost and All-in cost.
| | | |
Figures in million – SA rand | | | |
| | | |
| | | |
| | | |
| | | |
| | | |
Section 45X credit (relating to 2023 and 2024) | | | |
Section 45X credit (relating to 2025 primary mining) | | | |
Section 45X credit (relating to 2025 recycling) | | | |
| | | |
Ore reserve development costs capitalised | | | |
Cost of sales, before amortisation and depreciation2 | | | |
| | | |
| | | |
Managed SA gold operations | | | |
| | | |
| | | |
| | | |
US PGM underground operations | | | |
Columbus recycling operation (US PGM Recycling) | | | |
Pennsylvania (Reldan) and North Carolina (Metallix) recycling operations3 | | | |
| | | |
Sandouville nickel refinery | | | |
| | | |
Century zinc retreatment operation | | | |
Group Corporate and reconciling items4 | | | |
Amortisation and depreciation | | | |
| | | |
| | | |
Managed SA gold operations5 | | | |
| | | |
| | | |
| | | |
US PGM underground operations | | | |
Columbus recycling operation (US PGM Recycling) | | | |
Pennsylvania (Reldan) and North Carolina (Metallix) recycling operations | | | |
| | | |
Sandouville nickel refinery6 | | | |
| | | |
Century zinc retreatment operation7 | | | |
Group Corporate and reconciling items | | | |
| | | |
1Recycling cost consists of cost relating to the purchasing of spent catalytic material and the cost incurred to convert the spent catalytic material into finished PGMs
2Included in cost of sales, before amortisation and depreciation for the year ended 31 December 2025 is total write-down of inventory to net realisable value amounting to
R1,477 million (2024: R4,784 million). The write-downs mainly relate to PGM in process and PGM finished goods of R1,171 million (2024: R3,843 million) and R306 million
(2024:R844 million), respectively, as a result of the lower commodity price environment
3The North Carolina (Metallix) recycling operations, acquired effective 4 September 2025 are included in cost of sales from September 2025 and the Pennsylvania (Reldan)
recycling operations are included in cost of sales from March 2024
4Cost of sales for Group corporate includes items related to the elimination of intercompany transactions between Stillwater Mining Company and Sibanye Reldan HoldCo
Incorporated
5Amortisation for the Managed SA gold operations includes amortisation related to corporate and reconciling items of R186 million (2024: R25 million)
6Included in amortisation for the Sandouville nickel refinery is amortisation related to corporate and reconciling items of R17 million (2024: R9 million)
7Included in amortisation for the Century zinc retreatment operation is amortisation related to corporate and reconciling items of R1 million (2024: R1 million)
MANAGEMENT’S DISCUSSION AND ANALYSIS OF THE FINANCIAL STATEMENTS CONTINUED
| | | |
Figures in million – SA rand | | | |
| | | |
| | | |
| | | |
Managed SA gold operations | | | |
| | | |
| | | |
| | | |
US PGM underground operations | | | |
Columbus recycling operation (US PGM Recycling) | | | |
Pennsylvania (Reldan) and North Carolina (Metallix) recycling operations | | | |
| | | |
Sandouville nickel refinery | | | |
| | | |
Century zinc retreatment operation | | | |
Group Corporate and reconciling items | | | |
Cost of sales, before amortisation and depreciation
Cost of sales, before amortisation and depreciation at the SA PGM operations increased by 1% to R43,214 million due to above inflation
increases in cost of electricity and imported spares, partially offset by decrease of 4% in PGMs sold. Mined underground 4E PGM production
decreased by 2% to 1,499,526 4Eoz and surface production volumes excluding third-party PoC were 29% lower at 108,233 4Eoz. Third-party
concentrate purchased and processed at the Marikana smelting and refining operations decreased by 24% to 73,150 4Eoz, mainly due to
heavy rainfall and the transition between tailings storage facilities. Third-party PoC material is purchased at a higher cost, than own mined
ore, due to the direct correlation to the basket price of PGM’s.
Cost of sales, before amortisation and depreciation at the managed SA gold operations decreased by 4% to R18,339 million due to a 16%
decrease sales volumes, partially offset by above inflationary increases in in electricity, support and consumables costs. Cost of sales, before
amortisation and depreciation from DRDGOLD increased by 4% to R4,649 million due to higher maintenance requirements for ageing plant
equipment, reagent and consumable cost increases.
Cost of sales, before amortisation and depreciation at the US PGM underground operations decreased significantly by 78% to R2,149 million
mainly due to the S45X advanced manufacturing production credits of R3,267 million recognised during 2025 for 2023, 2024 and 2025
reporting periods and the reduced production profile following restructuring undertaken during 2024. Cost of sales, before amortisation and
depreciation at the US PGM recycling operation decreased by 40% from R7,248 million to R4,358 million mainly due to the S45X advanced
manufacturing production credits of R2,618 million recognised during 2025 for 2023, 2024 and 2025 reporting periods and 2% lower volumes
fed. On a like for like basis without the S45X advanced manufacturing production credits recognised of R2,618 million cost of sales, before
amortisation and depreciation at the US PGM recycling operation decreased by 4%, in line with the decrease in revenue.
Cost of sales, before amortisation and depreciation at the Pennsylvania (Reldan) and North Carolina (Metallix) recycling operations
increased mainly due to higher purchase costs of recycle material correlated with the higher commodity prices and the inclusion of the
North Carolina (Metallix) recycling operations acquired during September 2025. This resulted in cost of sales, before amortisation and
depreciation increasing by 98% to R11,933 million (2024: R6,032 million), which included cost of sales, before amortisation and depreciation
from the North Carolina (Metallix) recycling operations for 2025 of R1,281 million (2024 Rnil).
Cost of sales, before amortisation and depreciation at the Sandouville nickel refinery decreased by 77% to R767 million mainly due to lower
production volumes as the site ramped down and ceased production during 2025.
Cost of sales, before amortisation and depreciation at the Century zinc retreatment operation increased by 8% to R3,061 million mainly due
to a 11% increase in sales volumes.
All-in sustaining cost and All-in cost
All-in cost per ounce, was introduced in 2013 by the members of the World Gold Council. Sibanye-Stillwater has adopted the principle
prescribed by the Council. This non-IFRS measure provides transparency into the total costs associated with mining and reporting this metric
allows for a meaningful comparison across our operations and different mining companies. The All-in cost per ounce metric provides
relevant information to investors, governments, local communities and other stakeholders in understanding the economics of mining.
This is especially true with reference to capital expenditure associated with developing and maintaining mines, which has increased
significantly in recent years and is reflected in this metric. All-in cost excludes income tax, costs associated with merger and acquisition
activities, working capital, impairments, financing costs, one-time severance charges and items needed to normalise earnings. All-in cost is
made up of All-in sustaining cost, being the cost to sustain current operations, given as a sub-total in the All-in cost calculation, together with
corporate and major capital expenditure associated with growth. All-in sustaining cost per kilogram, ounce and tonne and All-in cost per
kilogram, ounce and tonne are calculated by dividing the All-in sustaining cost and All-in cost, respectively, in a period by the total PGM
produced/gold sold over the same period.
All-in sustaining cost and All-in cost are non-IFRS measures see page AFR-39 and AFR-40 for additional information. Non-IFRS measures such
as All-in sustaining cost and All-in cost are considered as pro forma financial information as per the JSE Listings Requirements. The pro forma
financial information is the responsibility of the Group’s Board of Directors and is presented for illustration purposes only, and because of its
nature, All-in sustaining cost and All-in cost should not be considered as a representation of financial performance.
This pro forma financial information has been reported on by BDO in terms of ISAE 3420 and their unmodified report is available for inspection
at the Company’s registered office or by emailing the Company Secretary (lerato.matlosa@sibanyestillwater.com)
MANAGEMENT’S DISCUSSION AND ANALYSIS OF THE FINANCIAL STATEMENTS CONTINUED
The below tables set out a reconciliation of All-in-sustaining cost and All-in-cost to cost of sales before amortisation and depreciation.
| | | | | | | | | | | | | | | |
Figures in million - SA rand | | | | Rustenburg including Kroondal | | | | Corporate and re- conciling items | | | | | | | Group Corporate and reconciling items |
| | | | | | | | | | | | | | | |
Cost of sales, before amortisation and depreciation3 | | | | | | | | | | | | | | | |
| | | | | | | | | | | | | | | |
Section 45X credit adjustment14 | | | | | | | | | | | | | | | |
| | | | | | | | | | | | | | | |
| | | | | | | | | | | | | | | |
| | | | | | | | | | | | | | | |
| | | | | | | | | | | | | | | |
| | | | | | | | | | | | | | | |
| | | | | | | | | | | | | | | |
| | | | | | | | | | | | | | | |
| | | | | | | | | | | | | | | |
Sustaining capital expenditure11 | | | | | | | | | | | | | | | |
| | | | | | | | | | | | | | | |
| | | | | | | | | | | | | | | |
| | | | | | | | | | | | | | | |
| | | | | | | | | | | | | | | |
Corporate cost, growth and other capital expenditure | | | | | | | | | | | | | | | |
| | | | | | | | | | | | | | | |
Gold sold/4E PGM produced/2E PGM produced | | | | | | | | | | | | | | | |
| | | | | | | | | | | | | | | |
| | | | | | | | | | | | | | | |
| | | | | | | | | | | | | | | |
| | | | | | | | | | | | | | | |
| | | | | | | | | | | | | | | |
| | | | | | | | | | | | | | | |
| | | | | | | | | | | | | | | |
MANAGEMENT’S DISCUSSION AND ANALYSIS OF THE FINANCIAL STATEMENTS CONTINUED
| | |
Figures in million - SA rand | | Century zinc retreatment operation |
| | |
Cost of sales, before amortisation and depreciation3 | | |
| | |
| | |
| | |
| | |
Rehabilitation interest and amortisation8 | | |
| | |
Sustaining capital expenditure11 | | |
Less: By-product credit15 | | |
Total All-in-sustaining costs13 | | |
Plus: Corporate cost, growth and capital expenditure | | |
| | |
| | |
| | |
| | |
| | |
| | |
MANAGEMENT’S DISCUSSION AND ANALYSIS OF THE FINANCIAL STATEMENTS CONTINUED
| | | | | | | | | | | | | | | |
Figures in million - SA rand | | | | Rustenburg including Kroondal | | | | Corporate and re- conciling items | | | | | | | Group Corporate and reconciling items |
| | | | | | | | | | | | | | | |
Cost of sales, before amortisation and depreciation3 | | | | | | | | | | | | | | | |
| | | | | | | | | | | | | | | |
Section 45X credit adjustment14 | | | | | | | | | | | | | | | |
| | | | | | | | | | | | | | | |
| | | | | | | | | | | | | | | |
| | | | | | | | | | | | | | | |
| | | | | | | | | | | | | | | |
| | | | | | | | | | | | | | | |
| | | | | | | | | | | | | | | |
| | | | | | | | | | | | | | | |
| | | | | | | | | | | | | | | |
Sustaining capital expenditure11 | | | | | | | | | | | | | | | |
| | | | | | | | | | | | | | | |
| | | | | | | | | | | | | | | |
| | | | | | | | | | | | | | | |
| | | | | | | | | | | | | | | |
Corporate cost, growth and other capital expenditure | | | | | | | | | | | | | | | |
| | | | | | | | | | | | | | | |
Gold sold/4E PGM produced/2E PGM produced | | | | | | | | | | | | | | | |
| | | | | | | | | | | | | | | |
| | | | | | | | | | | | | | | |
| | | | | | | | | | | | | | | |
| | | | | | | | | | | | | | | |
| | | | | | | | | | | | | | | |
| | | | | | | | | | | | | | | |
| | | | | | | | | | | | | | | |
MANAGEMENT’S DISCUSSION AND ANALYSIS OF THE FINANCIAL STATEMENTS CONTINUED
| | |
Figures in million - SA rand | | Century zinc retreatment operation17 |
| | |
Cost of sales, before amortisation and depreciation3 | | |
| | |
| | |
| | |
| | |
Rehabilitation interest and amortisation8 | | |
| | |
Sustaining capital expenditure11 | | |
Less: By-product credit15 | | |
Total All-in-sustaining costs13 | | |
Plus: Corporate cost, growth and capital expenditure | | |
| | |
| | |
| | |
| | |
| | |
| | |
The average exchange rate for the year ended 31 December 2025 was R17.88/US$ (2024: R18.32/US$)
1The US PGM operations’ underground production is converted to metric tonnes and kilograms, and performance is translated into rand. In addition to the US PGM operations’ underground production, the operation processes various recycling material which
is excluded from the 2E PGM production, All-in sustaining cost and All-in cost statistics shown
2The total SA PGM and Marikana includes the production and costs associated with the third party PoC
3Cost of sales, before amortisation and depreciation includes all mining and processing costs, third party refining costs, corporate general and administrative costs and permitting costs
4Community costs includes costs related to community development
5Share-based payments are calculated based on the fair value at initial recognition and do not include the adjustment of the cash-settled share-based payment obligation to the reporting date fair value
6Royalties are the current royalty on refined and unrefined minerals payable to the South African government
7In South Africa the Carbon Tax Act of 2019 came into effect on 1 June 2019. The South African Government introduced Carbon tax based on a polluter-pays-principle and the aim of which is to help ensure that companies and consumers take the negative
adverse costs (externalities) of climate change into account in their future production, consumption and investment decisions. The first phase of the Carbon Tax Act applies to the so-called “Scope 1” emissions from 1 June 2019 to 31 December 2022. Under
the first phase, the introduction of the carbon tax is not expected to have an immediate impact on the price of electricity. Accordingly, although the statutory rate of carbon tax in 2025 was R236 per tonne (2024: R190 per tonne) of carbon dioxide equivalent
(CO2e) emissions, allowances under the Carbon Tax Act resulted in an effective carbon tax rate of R12 to R94 per tonne of CO2e emissions (2024: R10 to R65). For fiscal 2025, due to the 60% basic tax-free allowance applicable under the Carbon Tax Act,
Sibanye-Stillwater’s maximum effective carbon tax rate was R94 per tonne, meaning the statutory rate of R236 was reduced by 60%
8Rehabilitation includes the interest charge related to the environmental rehabilitation obligation and the amortisation of the related capitalised rehabilitation costs recorded as an asset. The interest charge related to the environmental rehabilitation
obligation and the amortisation of the capitalised rehabilitation costs do not reflect annual cash outflows and are calculated in accordance with IFRS Accounting Standards. The interest charge and amortisation reflect the periodic costs of rehabilitation
associated with current production and are, therefore, included in the measure
9Leases represent the lease payment costs for the year
MANAGEMENT’S DISCUSSION AND ANALYSIS OF THE FINANCIAL STATEMENTS CONTINUED
10ORD are those capital expenditures that allow access to reserves that are economically recoverable in the future, including, but not limited to, crosscuts, footwalls, return airways and box holes which will avail production or reserves
11Sustaining capital expenditure are those capital expenditures that are necessary to maintain current production and execute the current mine plan. Sustaining capital costs are relevant to the All-in sustaining cost metric as these are needed to maintain
Sibanye-Stillwater’s current operations and provide improved transparency related to Sibanye-Stillwater’s ability to finance these expenditures
12By-product credit - The All-in cost metric is focused on the cost associated with producing and selling a kilogram of gold or an ounce of 4E/2E PGMs, and therefore the metric captures the benefit of mining other metals when gold and 4E/2E PGMs are
produced and sold. In determining the All-in cost, the costs associated with producing and selling a kilogram of gold or an ounce of 4E/2E PGMs are reduced by the benefit received from the sale of co-products and by-products, recognised as product sales,
which is extracted and processed along with the gold and 4E/2E PGMs produced. At the SA gold operations, the sale of silver is recognised as product sales, and at the PGM operations in both regions, the minor PGMs – iridium and ruthenium – are produced
as co-products, which together with the three primary PGMs, are referred to as 6E (5PGM+Au). In addition, nickel, copper and chrome, among other minerals, are by-products at these operations. This is relevant to the All-in cost metric as it aids in the investor’s
analysis of the profitability of producing a kilogram of gold or an ounce of 4E/2E PGMs, without the need to consider multiple metal prices
13For information on how Sibanye-Stillwater has calculated All-in sustaining costs, All-in costs, All-in sustaining cost per kilogram, All-in sustaining cost per ounce, All-in sustaining cost per tonne, All-in cost per kilogram, All-in cost per ounce and All-in cost per tonne,
see – Management’s discussion and analysis of the financial statements - 2025 financial performance compared with 2024. All-in sustaining costs, All-in costs, All-in sustaining cost per kilogram, All-in sustaining cost per ounce, All-in sustaining cost per tonne, All-
in cost per kilogram, All-in cost per ounce and All-in cost per tonne are non-IFRS measures see page AFR-39 for additional information
14The Inflation Reduction Act Section 45X Advanced Manufacturing Production Credit provides credits to the US PGM operations equal to 10% of production costs incurred for critical minerals produced and sold after December 31, 2022. During the year ended
31 December 2025 the US PGM operations recognised R2,466 million (US$139 million) which relates to mining costs incurred for the years ended 31 December 2024 and 31 December 2023, respectively . Although these amounts were recognised as a credit
against the 30 June 2025 cost of sales, management believes that the cost of sales for the year ended 31 December 2025 should be adjusted with the 2023 and 2024 credits against the period when the mining costs were accrued. It is expected that, because
the required certification requirements were addressed in June 2025, the recognition of the credits will now match the related mining cost accruals. Accordingly, total All-in-sustaining costs and total All-in-costs were adjusted to reflect the appropriate amounts
which relates to the periods presented above
15The zinc equivalent sustaining cost is associated with the cost of producing and selling a tonne of zinc, and therefore the metric captures the benefit of other metals when zinc is produced and sold. In determining the zinc equivalent sustaining cost, the costs
associated with producing and selling a tonne of zinc are reduced by the benefit received from the sale of co‑products, recognised as product sales, which are extracted and processed along with the zinc produced. At Century, the sale of silver is
recognised as a by‑product sale.
MANAGEMENT’S DISCUSSION AND ANALYSIS OF THE FINANCIAL STATEMENTS CONTINUED
Cost of production
Despite disciplined cost containment measures, the AISC at the SA PGM operations of R24,312/4Eoz (including third-party PoC) increased by
11% from R21,848/4Eoz due to above inflation increases in costs of electricity and imported spares and 2% lower production volumes. The
AISC at the SA gold operations increased by 15% to R1,442,063/kg in 2025 and was mainly due to 10% lower production volumes resulting
from significant operational disruptions at the Kloof operation compounded by elevated seismicity in high grade Isolated Blocks of Ground
and above average inflationary increases in electricity, support and consumables costs. The All-in sustaining cost (AISC) at the US PGM
operations was flat at US$1,203/2Eoz in 2025 primarily due to the S45X advanced manufacturing production credits and the reduced
production profile following restructuring undertaken during 2024. The Century zinc retreatment operation, AISC of US$34,356/tZn for 2025
was 19% lower than 2024 levels as a result of 22% higher production and by-product credits which increased by 59% to R346 million as a result
of the higher prices of silver and increased sales.
Adjusted EBITDA
Group Adjusted EBITDA of R37,800 million in 2025 increased by R24,712 million or 189% from R13,088 million in 2024. Adjusted EBITDA for the SA
PGM operations increased by 125% to R16,682 million due to higher 4E PGM basket prices, which rallied in the second half of the year.
Adjusted EBITDA at the SA gold operations increased by 114% to R12,505 million in 2025, mainly due to a 39% increase in the rand gold price,
which reached an all time high in 2025. Negative adjusted EBITDA from the US PGM underground operations decreased by 4104% to swing
into a positive Adjusted EBITDA of R4,444 million mainly due to the S45X credits recognised in 2025, but in respect of the 2025, 2024 and 2023
years, and higher 2E PGM basket prices. Similarly for the Columbus recycling operations (US PGM) adjusted EBITDA increased by 792% to
R2,909 million mainly due to the S45X credits recognised in 2025 but in respect of the 2025, 2024 and 2023 years, and higher 3E PGM basket
prices. Adjusted EBITDA at the US Pennsylvania (PA) and North Carolina (NC) recycling operations (Reldan and Metallix) increased by 336%
to R1,169 million mainly due to increased commodity prices and the inclusion of the NC recycling site (Metallix acquired during September
2025) which is consolidated with the Reldan Group. Negative adjusted EBITDA from the Sandouville nickel refinery decreased by 18% to
negative R590 million, mainly due to the operation ramping down and ceasing production. Adjusted EBITDA at the Century zinc retreatment
operation increased by 247% to R1,582 million mainly due to higher sales volumes.
Adjusted EBITDA includes other cash costs, strike costs, care and maintenance costs, corporate and social investment costs and non-mining
royalties expenditures. The care and maintenance costs were R1,761 million in 2025 compared with R1,609 million in 2024. Corporate and
social investment costs (CSI) were R352 million in 2025 compared with R405 million in 2024. Non-mining royalties relating to royalties payable
to the Bafokeng nation were R20 million in 2025 compared with R73 million in 2024.
Non-IFRS measures such as Adjusted EBITDA is considered as pro forma financial information as per the JSE Listings Requirements. The pro
forma financial information is the responsibility of the Group’s Board of Directors and is presented for illustration purposes only, and because
of its nature, Adjusted EBITDA should not be considered as a representation of financial performance see – Consolidated financial
statements – Notes to the consolidated financial statements – Note 27.10: Capital management
The (Loss)/profit and Adjusted EBITDA are shown in the graphs below:
The (Loss)/profit in the graph above includes the impairment losses recognised/reversed during the 2025 year, which are discussed under the
impairments section further below.
MANAGEMENT’S DISCUSSION AND ANALYSIS OF THE FINANCIAL STATEMENTS CONTINUED
Adjusted EBITDA is shown in the graph below:
The below table illustrates the reconciliation of (loss)/profit before royalties, carbon tax and tax to adjusted EBITDA:
| | | | | | | | | | | | |
| | | | | | | | | | | |
Figures in million – SA rand | | | | | Pennsylvani a site and North Carolina site | | | | Sandouvill e nickel refinery | | Century zinc retreatme nt operation | |
(Loss)/profit before royalties, carbon tax and tax | | | | | | | | | | | | |
| | | | | | | | | | | | |
Amortisation and depreciation | | | | | | | | | | | | |
| | | | | | | | | | | | |
| | | | | | | | | | | | |
| | | | | | | | | | | | |
(Gain)/loss on financial instruments | | | | | | | | | | | | |
Loss/(gain) on foreign exchange movements | | | | | | | | | | | | |
Share of results of equity- accounted investees after tax | | | | | | | | | | | | |
Change in estimate of environmental rehabilitation obligation | | | | | | | | | | | | |
(Gain)/loss on disposal of property, plant and equipment | | | | | | | | | | | | |
| | | | | | | | | | | | |
| | | | | | | | | | | | |
Occupational healthcare gain | | | | | | | | | | | | |
| | | | | | | | | | | | |
Transaction and project costs | | | | | | | | | | | | |
| | | | | | | | | | | | |
Onerous contract provision | | | | | | | | | | | | |
Corporate leadership costs | | | | | | | | | | | | |
Compensation for losses incurred | | | | | | | | | | | | |
Gain on increase in equity- accounted investment | | | | | | | | | | | | |
Gain on assets held for sale | | | | | | | | | | | | |
| | | | | | | | | | | | |
1 The SA rand amounts can be translated to US dollar at an average exchange rate of R17.88/US$
2 Included in total Group is Group corporate which comprises mainly the Wheaton Stream and Franco-Nevada transactions, corporate tax, interest and transaction costs
3 Adjusted EBITDA is a non-IFRS measure see page AFR-39 for additional information on this non-IFRS measure. This measure constitutes pro forma financial information in terms
of the JSE Listings Requirements, and is not a measure of performance under IFRS Accounting Standards. As a result, it may not be comparable to similarly titled measures of
other companies, and should not be considered in isolation or as alternatives to any other measure of financial performance presented in accordance with IFRS Accounting
Standards, and is the responsibility of the Board. This pro forma financial information has been reported on by BDO in terms of ISAE 3420 and a copy of their unmodified
report can be obtained from the Company’s registered office, by emailing the Company Secretary (lerato.matlosa@sibanyestillwater.com)
MANAGEMENT’S DISCUSSION AND ANALYSIS OF THE FINANCIAL STATEMENTS CONTINUED
| | | | | | | | | | | | |
The below table illustrates the reconciliation of profit/(loss) before royalties, carbon tax and tax to adjusted EBITDA: |
| | | | | | | | | | | |
Figures in million – SA rand | | | | | | | | | Sandouvill e nickel refinery | | Century zinc retreatme nt operation | |
(Loss)/profit before royalties, carbon tax and tax | | | | | | | | | | | | |
| | | | | | | | | | | | |
Amortisation and depreciation | | | | | | | | | | | | |
| | | | | | | | | | | | |
| | | | | | | | | | | | |
| | | | | | | | | | | | |
(Gain)/loss on financial instruments | | | | | | | | | | | | |
(Gain)/loss on foreign exchange movements | | | | | | | | | | | | |
Share of results of equity- accounted investees after tax | | | | | | | | | | | | |
Change in estimate of environmental rehabilitation obligation, and right of recovery liability and asset | | | | | | | | | | | | |
(Gain)/loss on disposal of property, plant and equipment | | | | | | | | | | | | |
| | | | | | | | | | | | |
Transaction and project costs | | | | | | | | | | | | |
| | | | | | | | | | | | |
| | | | | | | | | | | | |
Compensation for losses incurred | | | | | | | | | | | | |
Provision for community costs post closure | | | | | | | | | | | | |
Onerous contract provision | | | | | | | | | | | | |
Gain/increase in equity- accounted investment | | | | | | | | | | | | |
Gain on remeasurement of previous interest in Kroondal | | | | | | | | | | | | |
| | | | | | | | | | | | |
1The SA rand amounts can be translated to US dollar at an average exchange rate of R18.32/US$
2Included in total Group is Group corporate which comprises mainly the Wheaton Stream transaction, corporate tax, interest and transaction costs
3Adjusted EBITDA is a non-IFRS measure see page AFR-39 for additional information on this non-IFRS measure. This measure constitutes pro forma financial information in terms
of the JSE Listings Requirements, and is not a measure of performance under IFRS Accounting Standards. As a result, it may not be comparable to similarly titled measures of
other companies, and should not be considered in isolation or as alternatives to any other measure of financial performance presented in accordance with IFRS Accounting
Standards, and is the responsibility of the Board. This pro forma financial information has been reported on by BDO in terms of ISAE 3420 and a copy of their unmodified
report can be obtained from the Company’s registered office, by emailing the Company Secretary (lerato.matlosa@sibanyestillwater.com)
Interest income
Interest income for 2025 increased by R231 million to R1,568 million (2024: R1,337 million) which was mainly due to Section 45X interest
accrued at the US PGM and Columbus recycling operations of R146 million and R127 million, respectively and higher interest on
rehabilitation obligation funds invested, partially offset by lower interest received on cash balances. Interest income mainly includes interest
received on cash deposits amounting to R849 million (2024: R882 million), interest received on rehabilitation obligation funds of R417 million
(2024: R404 million), and other interest earned of R29 million (2024: R51 million). For additional information on finance income see –
Consolidated financial statements – Notes to the consolidated financial statements – Note 5.1: Finance income.
Finance expense
Finance expense for 2025 increased by R429 million to R5,000 million (2024: R4,571 million), primarily due to higher deferred revenue‑related
finance costs and non‑cash finance cost accretion.
The increase was mainly driven by a R750 million increase in the unwinding of the finance costs on the deferred revenue transactions, an R18
million increase in unwinding of the environmental rehabilitation obligation and a R5 million increase in interest on lease liabilities, partially
offset by lower interest on borrowings of R153 million and a R48 million decrease in the unwinding of amortised cost on borrowings, reflecting
a decrease in average outstanding borrowings during 2025. Further offsets included a R103 million decrease in the unwinding of the
Marikana dividend obligation, a R4 million decrease in interest on the occupational healthcare obligation and a R36 million decrease in
sundry interest. For additional information on finance expense see – Consolidated financial statements – Notes to the consolidated financial
statements – Note 5.2: Finance expense.
Sibanye-Stillwater’s gross debt outstanding, excluding the Burnstone Debt and including the derivative financial instrument was R39,252
million as at 31 December 2025 compared with approximately R39,426 million at 31 December 2024.
Share-based payments
The share-based payments expense increased by 742% to R2,114 million (2024: R251 million) in 2024. The share-based payments expense
includes R40 million (2024: R27 million) relating to the DRDGOLD equity-settled share options and R2,074 million (2024: R224 million) relating to
the cash-settled Sibanye-Stillwater Share Plan. For additional information on share-based payments see – Consolidated financial statements
– Notes to the consolidated financial statements – Note 6: Share-based payments.
MANAGEMENT’S DISCUSSION AND ANALYSIS OF THE FINANCIAL STATEMENTS CONTINUED
Loss on financial instruments
The loss on financial instruments for 2025 of R3,794 million, compared with a gain of R5,433 million in 2024, resulting in a year-on-year net
adverse movement of R9,227 million.
The net loss in 2025 was primarily driven by valuation‑related losses on commodity‑linked financial instruments and obligations. These
included a R1,805 million fair value loss on the Burnstone project debt, reflecting changes in estimated cash flows and valuation assumptions
following higher long-term gold price assumptions, and fair value losses of R1,736 million on gold hedge contracts as a result of record high
gold prices during the year, and fair value losses of R420 million on the (Rustenburg and Marikana operations BEE cash-settled) share-based
payment obligations. These losses were partially offset by gains of R156 million on hedge contracts for zinc, a R427 million gain arising from
reduced estimated cash flows on the Keliber dividend obligation and gains of R185 million on other investments. For additional information
on the gain on financial instruments see – Consolidated financial statements – Notes to the consolidated financial statements – Note 7:
(Loss)/gain on financial instruments.
Share of results of equity-accounted investees after tax
The profit from share of results of equity-accounted investees of R337 million in 2025 (2024: R212 million) was primarily due to profit of R516
million (2024: R327 million) relating to Sibanye-Stillwater’s 44% interest in Rand Refinery, partially offset by share of losses of R148 million
(2024: R97 million) relating to Sibanye-Stillwater’s 50% attributable share in Mimosa and share of losses of R21 million (2024: R11 million) relating
to Sibanye-Stillwater’s investment in Glint Incorporated. For additional information on the share of results of equity-accounted investees after
tax, see – Consolidated financial statements – Notes to the consolidated financial statements – Note 18: Equity-accounted investments.
Impairments
During 2025 the Group recognised impairment losses of R14,007 million compared with impairment losses R9,173 million recognised in 2024.
The impairment losses recognised mainly related to the following cash-generating units (CGU):
•Kloof CGU: An impairment loss of R3,779 million was recognised at 31 December 2025 following a decrease in the life of mine arising from
logistical constraints, seismicity and safety concerns to access higher grade areas, which adversely affected the recoverable amount.
•US PGM operations (Stillwater CGU): An impairment loss of R4,230 million was recognised at 30 June 2025 following the enactment of the
One Big Beautiful Bill Act in the US, which provided for the phase-out and termination of Section 45X credits for critical minerals produced
after 31 December 2030. The resulting reduction in future net cash flows from the US PGM operations led to a reduction in the
recoverable amount.
•Keliber CGU: An impairment loss of R2,460 million was recognised at 31 December 2025, in addition to R5,344 million recognised at
30 June 2025. The additional impairment reflected a further decrease in the long-term forecasted lithium hydroxide price assumptions
compared to 30 June 2025 and the decision to proceed with an extended start-up profile, which reduced expected future net cash
flows. The impairment loss recognised at 30 June 2025 was due to a decrease in the long-term forecasted lithium hydroxide price and an
increased discount rate which reduced expected future net cash flows.
•Reversals of impairment: Impairment reversals of R449 million, R168 million and R1,307 million million at 31 December 2025 were
recognised at Beatrix, Driefontein and Burnstone, respectively. The reversals of impairment resulted from the higher gold price outlook
and sustained operational improvements at the Beatrix and Driefontein operations which increased expected future net cash flows and
recoverable amounts.
The impairment losses recognised in 2024 were disclosed in the Group’s 2024 Form 20‑F and are not repeated here.
For additional information on the impairments see – Consolidated financial statements – Notes to the consolidated financial statements –
Note 10: Impairments and reversal of impairments.
Occupational healthcare gain
At 31 December 2025 Sibanye-Stillwater provided R384 million (2024: R336 million) for its share of the settlement cost. The estimated costs at
31 December 2025 and 2024 was determined by an actuarial specialist and as a result, a change in estimate of R49 million loss was
recognised in profit or loss for the year (2024: R76 million gain). For additional information on the occupational healthcare expense, see –
Consolidated financial statements – Notes to the consolidated financial statements – Note 30: Occupational healthcare obligation.
Restructuring costs
Restructuring costs of R247 million (2024: R550 million) were incurred during 2025 which mainly related to the SA gold operations (R65 million
(2024: R144 million)), SA PGM operations (R8 million (2024: R269 million)), Protection Services (R2 million (2024: R11 million)), US PGM operations
(R2 million (2024: R126 million)) and Sandouville (R170 million (2024: Rnil)).
Transaction costs
Transaction costs were R4,543 million in 2024 compared with R851 million in 2024. The transaction costs in 2025 mainly included the Appian
settlement R3,607 million (2024: Rnil), Appian legal fees R212 million (R115 million), project cost of the GalliCam pre-feasibility study R373
million (2024: R193 million), legal and advisory fees on merger and acquisition activities relating to Reldan Rnil (2024: R187 million) and Metallix
R175 million (2024: Rnil), acquisition related advisory and legal fees of R2 million (2024: R55 million), advisory fees on Franco Nevada stream
R104 million (2024: Rnil) and other transaction related general legal and advisory fees of R70 million (2024: R301 million).
Care and maintenance costs
Care and maintenance costs were R1,761 million in 2025 compared with R1,609 million in 2024. The care and maintenance costs included
R1,132 million (2024: R970 million) at Cooke, R10 million (2024: R14 million) at Beatrix, R69 million (2024: R340 million) at Kloof, R206 million
(2024: R194 million) at Burnstone, R103 million (2024: R69 million) at Marikana, R46 million (2024: R10 million) at Rustenburg, R1 million
(2024: R10 million) at Kroondal and R194 (2024: Rnil million) at Sandouville.
Change in estimate of environmental rehabilitation obligation, and right of recovery receivable and payable
Change in estimate of environmental rehabilitation obligation, and right of recovery receivable and payable was a net income of R495
million in 2025 (2024: R446 million). The income is mainly due to changes in gross closure cost estimates, changes in discount rates
MANAGEMENT’S DISCUSSION AND ANALYSIS OF THE FINANCIAL STATEMENTS CONTINUED
and changes in expected timing of rehabilitation for operations on care and maintenance and operations that are being rehabilitated
(recognised through profit or loss).
Cost incurred on employee and community trusts
Cost incurred on employee and community trusts were R364 million in 2025 compared with R204 million in 2024. These costs were incurred on
the Marikana R135 million (2024: R288 million) and SRPM employee Trusts R226 million (2024: R84 million credit).
Corporate and social investment costs
Corporate and social investment costs (CSI) were R352 million in 2025 compared with R405 million in 2024. CSI costs mainly related to the SA
gold operations (R25 million (2024: R13 million)), SA PGM operations (R265 million (2024: R337 million)) Century operation (R62 million
(2024: R54 million)) and Reldan operation (R62 million (2024: R47 million)).
Onerous contract provision utilisation/change in estimate/(provision)
The onerous contract provision utilisation/change in estimate included in Sandouville segment, decreased from R1,017 million in 2024 to R124
million in 2025 due to the realisation of onerous contract losses provided for at 31 December 2023. There was no additional onerous contract
provision recognised in 2025 (2024: R200 million). During 2024, the Group agreed with the supplier to terminate this supply contract with final
delivery made in January 2025 which resulted in additional provisions raised for onerous contracts amounting to R200 million in respect of the
Sandouville nickel refinery's production process, see – Consolidated financial statements – Notes to the consolidated financial statements –
Note 29.2: Other provisions.
Exploration costs
Exploration costs were R4 million in 2025 compared with R36 million in 2024. The exploration costs in 2025 mainly related to the SA PGM
operations (R2 million (2024: R28 million)) and Century operation (R1 million (2024: R8 million)).
Non-mining royalties
Non-mining royalties relating to royalties payable to the Bafokeng nation were R20 million in 2025 compared with R73 million in 2024 and
decreased mainly due to higher capital expenditure spend in the royalty areas of Kroondal such that no royalty is payable on the total
combined calculation post the merger of Kroondal into the Rustenburg operations. The non-mining royalties were incurred at the Marikana
(R20 million (2024: R17 million)) and Rustenburg (Rnil (2024: R56 million)) operations.
Royalty Tax
Royalty tax increased by 111% to R1,145 million in 2025 from R543 million in 2024. The increase in 2025 was mainly due to the increased
revenue and profitability at the SA PGM and SA gold operations as a result of higher PGM basket prices and gold prices in 2025. The
decrease in 2024 was mainly due to the decreased revenue and profitability at the SA PGM operations as a result of continued lower PGM
basket prices in 2024, partially offset by the increase in royalties payable by New Century due to higher zinc concentrate prices in 2024.
Mining and income tax
Mining and income tax charge increased to R4,328 million in 2025 compared to R1,496 million in 2024. This was due to a higher current tax
charge of R2,418 million in 2025, of which mining tax increased by R1,323 million and higher deferred tax of R1,910 million, of which the
deferred tax charge increased by R1,463 million and the deferred tax rate adjustment increased by R467 million. The increase in mining tax
mainly related to higher current tax at the SA PGM Marikana and Rustenburg operations of R271 million and R1,056 million, respectively. The
increase in deferred tax charge mainly related to utilisation of capital expenditure at the Marikana operations and DRDGOLD Limited which
was redeemed due to higher profitability. The table below indicates Sibanye-Stillwater’s effective tax expense rate in 2025 and 2024.
In 2025, the tax charge on the loss before tax at the South African statutory company tax rate of 27%, or R111 million, compared with tax
charge of R4,328 million is mainly due to the impact on the statutory tax rate of the following
•R5,334 million unrecognised or derecognised deferred tax assets
•R1,048 million non-deductible transaction costs
•R169 million SA gold mining tax formula rate adjustment
•R103 million change in estimated deferred tax rate
•R101 million non-deductible finance expense
•R46 million tax adjustment in respect of prior periods
•R27 million US statutory tax rate adjustment
•R13 million non-taxable gain on foreign exchange differences
•R13 million non-deductible impairments
•R11 million non-deductible share-based payments
The above was partially offset by the following
•R1,670 million non-taxable Section 45X credit
•R592 million net other non-taxable income and non-deductible expenditure
•R94 million non-taxable share of results of equity-accounted investee
•R40 million non-deductible loss on fair value of financial instruments
MANAGEMENT’S DISCUSSION AND ANALYSIS OF THE FINANCIAL STATEMENTS CONTINUED
•R24 million US state tax adjustment
•R6 million non-taxable dividend received
The drivers of the Group’s tax charge in 2024 were disclosed in the Group’s 2024 Form 20‑F and are not repeated here.
Liquidity and capital resources
Liquidity position
At 31 December 2025, the Group maintained a strong liquidity position supported by cash generated from operations and access to
committed revolving credit facilities. For the year ended 31 December 2025, the Group generated adjusted EBITDA of R37.8 billion, reflecting
a significant improvement in operating performance compared with the prior year. Net debt at 31 December 2025 amounted to
approximately R22.1 billion, resulting in a net debt to adjusted EBITDA ratio of 0.59 times.
The Group continues to actively manage liquidity through disciplined capital allocation, cost control initiatives and maintaining adequate
headroom under committed debt facilities to withstand periods of commodity price volatility.
Cash flow analysis
Net increase in cash and cash equivalents in 2025 was R2,471 million compared with a net decrease in cash and cash equivalents in 2024 of
R9,490 million.
Net cash from operating activities
Net cash from operating activities increased by R11,294 million to R21,407 million in 2025 from R10,113 million in 2024. The items contributing to
the increase in 2025 and 2024 are indicated in the table below.
| | |
Figures in million - SA rand | | |
Increase/(decrease) in cash generated by operations¹ | | |
Increase in deferred revenue advance received² | | |
Decrease/(increase) in cash-settled share-based payments paid | | |
(Decrease)/increase in change in working capital | | |
Increase in interest paid | | |
Increase/(decrease) in royalties and tax paid³ | | |
Increase in royalties and tax refunded4 | | |
(Increase)/decrease in dividends paid5 | | |
Decrease in additional deferred payments relating to acquisition of a business6 | | |
| | |
Increase in net cash from operating activities | | |
1The increase in cash generated by operations in 2025 was mainly due to higher commodity prices at all operations with the exception of nickel and the acquisition of the
Metallix recycling operation during September 2025 and includes a non-recurring cash payment of R3.6 billion in respect of the Appian Capital legal settlement. The
decrease in cash generated by operations in 2024 was mainly due to continued lower average realised PGM basket prices at the SA PGM, US PGM and US Recycling
operations partially offset by additional increases in the gold price for 2024
2The amount received for the year ended 31 December 2025 of R10,745 million relates to the Franco-Nevada stream cash receipts amounting to R9,215 million and Century
deferred proceeds, amounting to cash receipts of R1,097 million and Reldan deferred proceeds amounting R433 million. The amount received for the year ended 31
December 2024 of R3,307 million relates to income received in advance from customers of Century of R366 million, Reldan deferred proceeds of R243 million and cash
prepayments received in respect of the gold prepay and chrome prepay amounting to R1,793 million and R905 million, respectively
3The increase in royalties and tax paid in 2025 was due to the increase in revenue and taxable mining income as a result of higher commodity prices at all operations with the
exception of nickel and the decrease in royalties and tax paid in 2024 was due to the decrease in revenue and taxable mining income as a result of lower average realised
PGM basket prices at the SA PGM, US PGM and US Recycling operations, partially offset by an increase in the gold price for 2024
4The increase in royalties and tax refunded in 2025 was due to refunds received on tax mainly at Eastern Platinum Proprietary Limited of R82 million and at Stillwater Mining
Company of R298 million, and refunds received on royalties at Western Platinum Proprietary Limited of R292 million and Sibanye Rustenburg Mines Proprietary Limited of
R96 million
5There were no dividends paid by the Group during 2025 and dividends paid by subsidiary companies to their non-controlling shareholders was R302 million. There were no
dividends paid by the Group during 2024 and dividends paid by subsidiary companies to their non-controlling shareholders was R173 million.
6The acquisition date fair value of deferred payments and contingent consideration relating to business combinations is part of the aggregate consideration for obtaining
control of the underlying net assets. Therefore, unless the obligations are clearly part of the borrowing structure of the group, repayments of the acquisition date fair value
are classified as investing activities. Additional deferred/contingent payments in excess of the grant date fair value are considered to be operating activity cash flows by
nature and amounted to Rnil in 2025 and R44 million in 2024 mainly relating to the acquisition of the Pandora acquisition
MANAGEMENT’S DISCUSSION AND ANALYSIS OF THE FINANCIAL STATEMENTS CONTINUED
Cash flows from investing activities
Net cash used in investing activities decreased to R21,692 million in 2025 from R24,338 million in 2024. The decrease in cash used in investing
activities was mainly due to a decrease in additions to property, plant and equipment of R20,307 million in 2025 compared to R21,569 million
in 2024 and a decrease in net cash used in investing activities mainly due to the acquisition of Metallix net of cash acquired for R1,894 million
and the final payment on the Reldan acquisition of R96 million (2024: R2,690 million relating to Redan acquisition), see – Consolidated
financial statements – Notes to the consolidated financial statements – Note 16: Acquisitions. Net cash used in investing activities increased
to R24,338 million in 2024 from R22,038 million in 2023. The increase in the 2024 of net cash used in investing activities was mainly due to the
acquisition of Reldan net of cash acquired for R2,690 million (2023: R471 million net cash received from the Kroondal acquisition), partially
offset by a decrease in additions to property, plant and equipment of R21,569 million, compared to R22,411 million in 2023.
Cash additions to property, plant and equipment at the individual mines are shown in the table below.
| | |
Figures in million – SA rand | | |
| | |
| | |
| | |
| | |
| | |
| | |
Corporate and reconciling items2 | | |
| | |
| | |
| | |
| | |
| | |
Corporate and reconciling items2 | | |
| | |
| | |
US PGM underground operations | | |
Pennsylvania (Reldan) and North Carolina (Metallix) recycling operations3 | | |
| | |
| | |
Corporate and reconciling items2 | | |
| | |
Century zinc retreatment operation | | |
Corporate and reconciling items2 | | |
Group Corporate and reconciling items | | |
Total Capital Expenditure | | |
1Kroondal was included as part of the Rustenburg operation from 2025 and its corresponding cash additions to property, plant and equipment was therefore reported as
part of the Rustenberg operations from 2025
2Corporate and reconciling items does not represent a separate segment as it does not generate revenue. Corporate and reconciling items for SA gold operations include
the Burnstone project, total EU operations include the Keliber project and the Australian operations include the Mt Lyell project
3Capital expenditure at the Pennsylvania (Reldan) and North Carolina (Metallix) recycling operations was R46 million compared to R10 million in 2024 which did not include
the North Carolina (Metallix) recycling operations which were acquired in September 2025.
Cash flows from financing activities
Net cash from financing activities of R2,756 million in 2025 compared with R4,735 million in 2024. Net cash from financing activities comprised
loans raised of R7,912 million (2024: R8,278 million), partially offset by lease payments of R228 million (2024: R208 million), loans repaid of
R4,883 million (2024: R3,335 million) and reattribution of non-controlling interests (NCI) of R45 million l (2024: Rnil million).
Net increase/(decrease) in cash and cash equivalents
As a result of the above, net cash and cash equivalents (excluding the effect of exchange rate fluctuations on cash held) increased by
R2,471 million in 2025 compared with a decrease of R9,490 million in 2024.
Total Group cash and cash equivalents amounted to R17,178 million at 31 December 2025 (2024: R16,049 million).
Notional free cash flow
Sibanye-Stillwater defines notional free cash flow as adjusted EBITDA, less non cash revenue relating to streaming transactions and deferred
prepayments, non cash government grants and accrued taxes and royalties, and includes other non-routine cash items such as legal
dispute settlements and realised hedges.
MANAGEMENT’S DISCUSSION AND ANALYSIS OF THE FINANCIAL STATEMENTS CONTINUED
The table below shows a calculation of notional free cash flow:
| | | |
Figures in million - SA rand | | | |
| | | |
Adjusted for non-cash items: | | | |
Deferred revenue released - Streaming | | | |
Deferred revenue released - Prepays | | | |
Section 45X grant not yet received | | | |
Tax and royalties (accrued) | | | |
Other non-routine cash items: | | | |
Legal settlement payment to Appian | | | |
Early settlement payment on onerous contract | | | |
| | | |
| | | |
Property. plant and equipment additions | | | |
| | | |
Non-IFRS measures such as notional free cash flow is considered as pro forma financial information as per the JSE Listing Requirements. The
pro forma financial information is the responsibility of the Group’s Board of Directors and is presented for illustration purposes only, and
because of its nature, notional free cash flow should not be considered in isolation or as a substitute for measures of financial performance
and cash flows prepared in accordance with IFRS Accounting Standards, namely net cash from operating activities. The pro forma financial
information for the years ended 31 December 2025 and 31 December 2024 have been reported on by BDO SA in terms of ISAE 3420,
respectively and a copy of their reporting accountants assurance report can be obtained from the Company’s registered office, by
emailing the Company Secretary (lerato.matlosa@sibanyestillwater.com)
For a reconciliation between notional free cash flow and net cash from operating activities, see – Consolidated financial statements –
Reconciliation of notional free cash flow to net cash from operating activities.
The table below shows a calculation of notional free cash flow:
| | | |
Figures in million - SA rand | | | |
| | | |
| | | |
| | | |
| | | |
| | | |
| | | |
US PA & NC recycling operations | | | |
| | | |
| | | |
| | | |
| | | |
| | | |
The SA PGM operations generated notional free cash flow for 2025 of R5,846 million compared to notional free cash flow for 2024 of R136
million, due to a 28% higher 2E PGM basket price received during 2025 which resulted in R9,626 million higher revenue, partially offset by 4%
lower sales volumes and higher taxes and royalties accrued of R1,561 million due to higher profitability.
The SA gold operations generated notional free cash flow for 2025 of R3,224 million compared to negative notional free cash flow of
R1,608 million in 2024, mainly due to the 39% higher gold price received during 2025 which resulted in R5,914 million higher revenue, partially
offset by 10% lower volumes and the losses realised on the gold hedge contracts of R1,288 million.
The US PGM operations negative notional free cash flow for 2025 of R831 million compared to negative notional free cash flow for 2024 of
R3,375 million. The decrease in negative notional free cash flow for 2025 was mainly due an increase in adjusted EBITDA and lower cash
additions to property, plant and equipment of R1,208 million, partially offset by lower revenue of R2,796 million mainly due to 39% lower 2E
sales volumes in line with the restructured US PGM production profile.
The US Pennsylvania (Reldan) and North Carolina (Metallix) recycling operations generated notional free cash flow for 2025 of R1,012 million
compared to notional free cash flow for 2024 of R133 million, mainly due to higher commodity prices received and including 12 months of
the Pennsylvania results for 2025. Included in the notional cashflow was a net negative notional cashflow of R205 million arising from the
addition of the NC recycling site (Metallix) for four months since September 2025 (PPA negative notional cashflow of R503 million and
operational notional cashflow of R298 million).
The European operations incurred negative notional free cash flow for 2025 of R6,572 million compared to negative notional free cash flow
for 2024 of R7,449 million, mainly attributable to capital expenditure on the Keliber lithium project of R5,734 million (2024: R5,732 million), a
decrease in the Sandouville adjusted EBITDA loss to R590 million in 2025 (2024: R723 million) due to the Sandouville nickel refinery which
ramped down and ceased production during 2025 and the settlement of a key contract of R665 million paid during H2 2024.
MANAGEMENT’S DISCUSSION AND ANALYSIS OF THE FINANCIAL STATEMENTS CONTINUED
The Century operation generated notional free cash flow for 2025 of R996 million compared to notional free cash flow for 2024 of R30 million,
mainly due to 11% higher sales compared to 2024 year where production was impact by heavy rainfall during Q1 2024 and the bushfire,
partially offset by a 1% lower zinc concentrate price and lower sales recognised in December 2025 due to shipping constraints.
Group corporate generated negative notional free cash flow for 2025 of R3,646 million compared to negative notional free cash flow for
2024 of R264 million, mainly due to the legal settlement payment to Appian of R3,565 million.
Statement of financial position
Borrowings
Total borrowings (short- and long-term), excluding R4,005 million (2024: R2,260 million) attributable to Burnstone which has no recourse to
Sibanye-Stillwater’s balance sheet, decreased modestly to R39,252 million at 31 December 2025 from R39,426 million at 31 December 2024.
Total gross debt increased by R1,570 million to R43,257 million (2024: R41,687 million) at 31 December 2025 and was mainly attributable to
remaining draw down on the Keliber Green loan facility of R3,851 million (2024: R5,618 million), partially offset by foreign exchange
movements on foreign denominated debt (mainly Burnstone, 2026 and 2029 Notes and the US$ Convertible Bond) amounting to a gain of
R4,020 million (2024: R344 million loss).
At 31 December 2025, Sibanye-Stillwater had committed undrawn facilities of R21,255 million (31 December 2024: R26,743 million) available
under the US$1 billion RCF, the R6.5 billion RCF and on other short-term borrowing facilities.
For a description of borrowings, see – Consolidated financial statements – Notes to the consolidated financial statements – Note 27:
Borrowings and derivative financial instrument.
Working capital and going concern assessment
For the year ended 31 December 2025, the Group incurred a loss of R4,739 million (2024: loss of R5,710 million and 2023: loss of
R37,430 million). As at 31 December 2025, the Group’s current assets exceeded its current liabilities by R26,595 million (2024: R27,458 million
and 2023: R25,415 million) and the Group’s total assets exceeded its total liabilities by R44,167 million (2024: R48,289 million and 2023:
R51,607 million). During the year ended 31 December 2025 the Group generated net cash from operating activities of R21,407 million (2024:
R10,113 million and 2023: R7,095 million).
The Group has committed undrawn debt facilities of R21,255 million at 31 December 2025 (2024: R26,743 million and 2023: R20,755 million)
and cash balances of R17,178 million (2024: R16,049 million and 2023: R25,560 million). The Group’s leverage ratio (net debt/(cash) to
adjusted EBITDA) as at 31 December 2025 was 0.59:1 (2024 was 1.79:1 and 2023 was 0.58:1) and its interest coverage ratio (adjusted EBITDA
to net finance charges/(income)) was 25:1 (2024 was 11:1 and 2023 was 66:1). The maximum permitted leverage ratio up to 31 December
2025 is 3.0:1 and thereafter 2.5:1. The maximum required interest coverage ratio up to 31 December 2025 3.0:1 and 4.0:1 thereafter.
Included under current borrowings on the consolidated statement of financial position is the 2026 Notes, amounting to R11,185 million which
matures by November 2026. The Group has commenced its planning for the refinancing of these Notes and is expecting to conclude the
process before 30 June 2026. In addition, at the date of approving these consolidated financial statements for issue, the US$1 billion RCF and
R6.5 billion RCF were totally undrawn. There were no significant events which had a significant negative impact on the Group’s strong
liquidity position.
Management believes that the cash forecasted to be generated by operations, cash on hand, the committed unutilised debt facilities as
well as additional funding opportunities will enable the Group to continue to meet its obligations as they fall due for a period of at least
eighteen months after the reporting date. The consolidated financial statements for the year ended 31 December 2025 have therefore
been prepared on a going concern basis.
Credit facilities
The Group has access to committed revolving credit facilities with a syndicate of international and South African banks, which are intended
to support general corporate purposes, including working capital requirements and refinancing of existing indebtedness.
At 31 December 2025, the Group’s committed facilities comprised a US dollar‑denominated revolving credit facility of US$1.0 billion and a
South African rand‑denominated revolving credit facility of R6.5 billion, both maturing in 2028. These facilities were unsecured and subject to
customary representations, warranties and covenants. These facilities were undrawn at the date of this report, providing the Group with
substantial liquidity headroom.
Financial Covenants
The Group’s revolving credit facilities are subject to financial covenants based primarily on a net debt to adjusted EBITDA ratio and an
interest cover ratio, each calculated in accordance with definitions set out in the relevant facility agreements. At 31 December 2025, the
Group was in compliance with all applicable financial covenants. Net debt to adjusted EBITDA was 0.59 times, which was well below the
applicable covenant limits of between 3.0 times and 3.5 times, depending on the relevant measurement period. Interest cover was also
comfortably in excess of the minimum covenant requirement. The Group had significant headroom against all covenant thresholds at
year‑end.
Management continues to monitor covenant compliance on an ongoing basis, including under downside commodity price and exchange
rate scenarios, and considers the risk of covenant breach to be remote based on current forecasts.
MANAGEMENT’S DISCUSSION AND ANALYSIS OF THE FINANCIAL STATEMENTS CONTINUED
Ability to generate and obtain adequate cash to meet its funding requirements
The various companies in the Group generate cash from the products they sell. The Group through its holding company is funded in general
through the receipt of dividends paid by operating subsidiaries from profits generated by those subsidiaries. Sibanye Stillwater Limited is also
a participant in the Group’s US Dollar and Rand RCF’s and has access to those facilities and it also has access and the ability to borrow
funds from subsidiaries with cash holdings, such as Stillwater Mining Company. Sibanye Stillwater Limited also has access to all products and
sources as noted above in the working capital and going concern assessment. Group Treasury prepares a cash forecast for periods longer
than 12 months and considers the projected cash required compared to the cash reserves and all available treasury products it intends to
use to meet its long term funding requirements and if additional funding is likely to be required then Group Treasury will proceed with a plan
to access the cash that will be required.
Off balance sheet arrangements and contractual commitments
At 31 December 2025, Sibanye-Stillwater had no off balance sheet items. For a description of Sibanye-Stillwater’s contractual commitments,
see the following notes to the consolidated financial statements:
| |
| Note to the consolidated financial statements |
Environmental rehabilitation obligation and other provisions | 29 - Environmental rehabilitation obligation and other provisions |
Occupational healthcare obligation | 30 - Occupational healthcare obligation |
| |
Other receivables and other payables | 21 - Other receivables and other payables |
| |
| 27 - Borrowings and derivative financial instrument |
| 27 - Borrowings and derivative financial instrument |
| |
These contractual commitments for expenditure will be met from internal cash flow and, to the extent necessary, from the existing facilities.
Critical accounting policies and estimates
Sibanye-Stillwater’s material accounting policies are fully described in the various notes to its consolidated financial statements. Some of the
Group’s accounting policies require the application of significant judgements and estimates by management that can affect the amounts
reported in the consolidated financial statements.
These judgements and estimates are based on management’s best knowledge of the relevant facts and circumstances, having regard to
previous experience, but actual results may differ from the amounts included in the consolidated financial statements.
For Sibanye-Stillwater’s material accounting policies that are subject to significant judgements, estimates and assumptions, see the following
notes to the consolidated financial statements:
| |
| Note to the consolidated financial statements |
Unconsolidated structured entities | |
| |
Cash-settled share-based payment obligation | |
Royalties, mining and income tax, and deferred tax | 11 - Royalties, mining and income tax, and deferred tax |
Property, plant and equipment | 14 - Property, plant and equipment |
| |
| 17 - Goodwill and other intangibles |
Equity-accounted investments | 18 - Equity-accounted investments |
| |
Other receivables and other payables | 21 - Other receivables and other payables |
| |
Borrowings and derivative financial instrument | 27 - Borrowings and derivative financial instrument |
Environmental rehabilitation obligation | 29 - Environmental rehabilitation obligation and other provisions |
Occupational healthcare obligation | 30 - Occupational healthcare obligation |
| |
MANAGEMENT’S DISCUSSION AND ANALYSIS OF THE FINANCIAL STATEMENTS CONTINUED
Non-IFRS measures
Sibanye-Stillwater presents certain non-IFRS figures to provide readers with additional financial information that is regularly reviewed by
management to assess the operational performance of the Group and is the responsibility of the Group's Board of Directors. These non-IFRS
measures should not be considered as alternatives to IFRS Accounting Standards measures, including cost of sales, net operating profit,
profit before taxation, cash from operating activities or any other measure of financial performance presented in accordance with IFRS
Accounting Standards, and may not be comparable to similarly titled measures of other companies.
The non-IFRS financial measures discussed in this document are listed below:
| | | |
| | Purpose why these non-IFRS measures are reported | |
| | | |
| Adjusted earnings before interest, tax, depreciation and amortisation, and is reported based on the formula included in Sibanye- Stillwater’s facility agreements for compliance with the debt covenant formula and involves eliminating the effects of various one-time, irregular, and non-recurring items from the standard EBITDA calculation | Used in the calculation of the debt covenant ratio: net debt/(cash) to adjusted EBITDA | |
Notional free cash flow (FCF) | Adjusted EBITDA, less non cash revenue relating to streaming transactions and deferred prepayments, non cash government grants and accrued taxes and royalties, and includes other non-routine cash items such as legal dispute settlements and realised hedges. | Report one of the drivers considered by management to illustrate cash available for dividends and other investing activities | |
All-in sustaining costs (AISC) | Cost of sales before amortisation and depreciation plus additional costs which include community costs, inventory change (PGM operations only), share-based payments, royalties, carbon tax, rehabilitation, leases, ore reserve development (ORD), sustaining capital expenditure and deducting the by-product credit | Developed by the World Gold council for the purpose of the gold mining industry, AISC provides metrics and aims to reflect the full cost to sustain the production and sale of our commodities, and reporting this metric allows for a meaningful comparisons across our operations and different mining companies | |
| AISC plus additional costs relating to corporate and major capital expenditure associated with growth | Developed by the World Gold council for the purpose of the gold mining industry, AIC provides metrics and aims to reflect the full cost to sustain the production and sale of our commodities, after including growth capital, and reporting this metric allows for a meaningful comparisons across our operations and different mining companies | |
| AISC/AIC divided by the total PGM produced/ gold sold/zinc produced (payable) | Developed by the World Gold council for the purpose of the gold mining industry, AISC/AIC per unit provides a metric that aims to reflect the full cost to sustain the production and sale, after including growth capital (AIC), of an ounce/ kilogram/tonne of commodity and reporting this metric allows for a meaningful comparisons across our operations and different mining companies | |
| Calculated based on the requirements set out in SAICA Circular 1/2023 | Reported in compliance with the Johannesburg Stock Exchange (JSE) Listings Requirements | |
Headline earnings per share (HEPS) | Headline earnings divided by the weighted average number of ordinary shares in issue during the year | Reported in compliance with the JSE Listings Requirements | |
Diluted headline earnings per share | Headline earnings divided by the diluted weighted average number of ordinary shares in issue during the year | Reported in compliance with the JSE Listings Requirements | |
| Adjusted EBITDA divided by net contractual finance charges/(income) settled in cash during the period | Report compliance with the debt covenant: interest coverage ratio | |
| Borrowings and bank overdraft less cash and cash equivalents, excluding Burnstone debt, bank overdraft and cash | Used in the calculation of the debt covenant ratio: net debt/(cash) to adjusted EBITDA | |
Net debt/(cash) to adjusted EBITDA (ratio) | Net debt/(cash) as of the end of a reporting period divided by adjusted EBITDA of the last 12 months ended on the same reporting date | Report compliance with the debt covenant: net debt/(cash) to adjusted EBITDA ratio | |
MANAGEMENT’S DISCUSSION AND ANALYSIS OF THE FINANCIAL STATEMENTS CONTINUED
| | | |
| | Purpose why these non-IFRS measures are reported | |
| Earnings attributable to the owners of Sibanye- Stillwater excluding gains and losses on financial instruments and foreign exchange differences, impairments, gain/loss on disposal of PPE, occupational healthcare expense, restructuring costs, transactions costs, share-based payment on BEE transactions, gain on acquisition, net other business development costs, share of results of equity-accounted investees, all after tax and the impact of NCI, and changes in estimated deferred tax rate | Report the measure used by the Group to determine dividend payments in line with our dividend policy | |
| The average cost of production, and operating cost per tonne is calculated by dividing the cost of sales, before amortisation and depreciation and change in inventory in a period by the tonnes milled/treated in the same period, and operating cost per ounce (and kilograms) is calculated by dividing the cost of sales, before amortisation and depreciation and change in inventory in a period by the gold kilograms produced or PGM 2E and 4E ounces produced in the same period | Report a measure that aims to reflect the operating cost to produce our commodities, and reporting this metric allows for a meaningful comparisons across our operations and different mining companies | |
Pro-forma financial information
Certain financial information, including non-IFRS measures, presented in these consolidated results constitutes pro forma financial
information. The responsibility for preparing and presenting the pro forma financial information for the completeness and accuracy of the
pro forma financial information is that of the directors of Sibanye-Stillwater. This pro forma financial information is presented for illustrative
purposes only.
Because of its nature, the pro forma financial information may not fairly present Sibanye-Stillwater’s financial position, changes in equity, and
results of operations or cash flows.
STATEMENT OF RESPONSIBILITY BY THE BOARD OF DIRECTORS
The directors are responsible for the preparation and fair presentation of the consolidated annual financial statements of Sibanye-Stillwater,
comprising the consolidated statement of financial position as at 31 December 2025, consolidated income statement and consolidated
statements of other comprehensive income, changes in equity and cash flows for the year then ended, and the notes to the consolidated
financial statements, which include a summary of material accounting policies, and other explanatory notes. The consolidated financial
statements have been prepared on a going concern basis in accordance with IFRS Accounting Standards, as issued by the International
Accounting Standards Board (IASB), the South African Institute of Chartered Accountants Financial Reporting Guides issued by the Accounting
Practices Committee and Financial Reporting Pronouncements issued by the Financial Reporting Standards Council, as well as the requirements
of the South African Companies Act and JSE Listings Requirements. The consolidated financial statements have been prepared under the
historical cost convention, except for certain financial assets and financial liabilities (including derivative instruments) which are measured at fair
value through profit or loss or other comprehensive income.
In addition, the directors are responsible for preparing the directors’ report.
The directors consider that, in preparing the consolidated financial statements, they have used the most appropriate accounting policies,
consistently applied and supported by reasonable and prudent judgements and estimates, and that all IFRS Accounting Standards that they
consider to be applicable have been complied with for the financial year ended 31 December 2025. The directors are satisfied that the
information contained in the consolidated financial statements fairly presents the results of operations for the year and the financial position of
the Group at year end. The directors are responsible for the information included in the Annual financial report, and are responsible for both its
accuracy and its consistency with the consolidated annual financial statements.
The directors have a responsibility for ensuring that accounting records are kept. The accounting records should disclose with reasonable
accuracy the financial position of the Group to enable the directors to ensure that the consolidated annual financial statements comply with the
relevant legislation.
The Group operated in a well-established control environment, which is well documented and regularly reviewed. This incorporates risk
management and internal control procedures, which are designed to provide reasonable assurance that assets are safeguarded and that the
material risks facing the business are being controlled.
The directors have made an assessment of the ability of the Company and its subsidiaries to continue as going concerns and based on this
assessment concluded that the basis for preparation of the consolidated annual financial statements is appropriate to that of a going concern.
The Group’s external auditors, BDO South Africa Inc. audited the consolidated annual financial statements. For their report, see – Independent
Auditor’s Report.
The consolidated annual financial statements were approved by the Board of Directors and are signed on its behalf by:
24 April 2026
COMPANY SECRETARY’S CONFIRMATION
In terms of section 88(2)(e) of the Companies Act, as amended, I certify that to the best of my knowledge, the Company has lodged with the
Companies and Intellectual Property Commission all such returns as are required to be lodged by a public company in terms of the Companies
Act, and that all such returns are true, correct and up to date.
REPORT OF THE AUDIT COMMITTEE
Introduction
The Audit Committee has formal terms of reference which are updated on an annual basis. The Board is satisfied that the Audit Committee has
complied with these terms, and with its legal and regulatory responsibilities as set out in the South African Companies Act (Companies Act), King
IVTM, the JSE Listings Requirements (JSE LR) and the requirements of the Securities and Exchange Commission (SEC).
There were some resignations, retirements and appointments of independent non-executive directors during the 2025 year which affected the
Audit Committee membership and Terence Nombembe assumed the role of Chairman of the audit committee from the 2025 annual general
meeting (AGM) (29 May 2025). The Audit Committee maintained a minimum of four independent non-executive directors for the period from 1
January 2025 to 31 December 2025. For membership, see – Integrated report - About Sibanye-Stillwater and our leadership - Board and executive
leadership.
The Board believes that the members collectively possess the knowledge and experience to supervise Sibanye-Stillwater’s financial
management, internal and external auditors, the quality of Sibanye-Stillwater’s financial controls, the preparation and evaluation of Sibanye-
Stillwater’s audited consolidated financial statements and Sibanye-Stillwater’s periodic financial reporting.
The Board has established and maintains internal controls and procedures, which are reviewed on a continuous basis. Controls are designed to
manage the risk of business failures and to provide reasonable assurance against such failures. However, despite having these measures, this is
not a guarantee that such risks are eliminated.
Responsibility
It is the duty of the Audit Committee, inter alia, to monitor and review on a Company and Group (Company, Group or Company and Group)
basis:
•the effectiveness of the internal audit function and by extension, the effectiveness of Group internal controls, see – Internal Audit (below)
•external auditor suitability and recommendation for appointment, see – External Auditor suitability review (below)
•external auditor independence and fees, see – Auditor independence and fees (below)
•reports of both internal and external auditors
•evaluation of the expertise and experience of the Chief Financial Officer (CFO)
•financial reporting systems and ensure that Group reporting procedures are functioning properly
•the governance of information technology (IT) and the effectiveness of the Group’s information systems
•interim results and report (Interim Report), quarterly operating reports, company and consolidated financial statements and all other widely
distributed financial documents
•the Form 20-F filing with the SEC
•accounting policies of the Company and Group and proposed revisions
•compliance with applicable legislation, requirements of appropriate regulatory authorities and Sibanye-Stillwater’s Code of Ethics
•policies and procedures for preventing and detecting fraud
•the integrity of the content of the Interim Report, consolidated financial statements and the integrated report and associated reports
(Integrated report) and then recommending same to the Board for approval
Access and meetings
Internal and external auditors have unrestricted access to the Audit Committee, the Audit Committee Chairman and the Chairman of the Board,
ensuring that both internal and external auditors are able to maintain their independence. Both the internal and external auditors report at Audit
Committee meetings. The Audit Committee meets with internal audit and the SOX departments on a quarterly basis, without other invitees being
present, and the Audit Committee Chairman meets with the external auditors on a quarterly basis without other invitees being present.
Management attend Audit Committee meetings by invitation.
Annual financial statements
The Committee has reviewed and is satisfied that the consolidated financial statements (this term includes reference to "annual report", a term
newly defined in the JSE LR which includes consolidated and company separate financial statements), including accounting policies, are
appropriate and comply with IFRS Accounting Standards, as issued by the International Accounting Standards Board (IASB), the South African
Institute of Chartered Accountants (SAICA) Financial Reporting Guides issued by the Accounting Practices Committee and Financial Reporting
Pronouncements issued by the Financial Reporting Standards Council, as well as the requirements of the Companies Act, JSE LR and the
requirements of the SEC.
The significant audit and accounting matters in respect of the Group considered by the Committee during the financial year were:
•the physical quantities of Western Platinum Proprietary Limited's (WPL) platinum group metals (PGM) in process
•the impairment assessment of property, plant and equipment, right-of-use assets, goodwill, other intangible assets and equity-accounted
investments
•the Reldan business combination
REPORT OF THE AUDIT COMMITTEE continued
The above matters were addressed by management and by the Audit Committee on a review basis as follows:
| |
The physical quantities of WPL's PGM in process | For the year ended 31 December 2025, management determined the physical quantities of PGMs in process at WPL as follows: •performed physical inventory counts at the metal processing areas, attended by management and a management appointed third party metallurgical specialist •determined an allowance for estimation uncertainty depending on the degree to which the nature and state of material allows for accurate measurement and sampling •reconciled quantities per the physical inventory count to theoretical inventory quantities and adjust to physical inventory quantities •performed a mass balance reconciliation of inventory from the beginning of the year to the closing balance of inventory Management concluded that the PGMs in process are accurate and exist at 31 December 2025. Significant accounting judgements and estimates are appropriately disclosed in note 22 to the consolidated financial statements. |
The impairment assessment of property, plant and equipment, right-of- use assets, goodwill, other intangible assets and equity-accounted investments | For the year ended 31 December 2025, management performed an impairment assessment over the property, plant and equipment, right-of-use assets, goodwill, other intangible assets and equity-accounted investments as follows: •assessed whether there is an indication, based on either internal or external sources of information, that an asset or cash-generating unit (CGU) may be impaired •where indications of impairment were identified and where the CGU has allocated goodwill, calculated the recoverable amount of the CGU, based on expected discounted net forecast cash flows arising from the expected mining of the ore reserves •considered the excess of recoverable amount over the carrying value for each CGU Management concluded that the carrying value of the Keliber project, US PGM operation and Kloof cash generating units exceed their estimated recoverable amounts. As disclosed in note 10 to the consolidated financial statements, total impairment and reversal of impairment losses of R14,007 million were recognised. |
The Metallix Refining business combination | For the year ended 31 December 2025, management prepared a provisional purchase price allocation of the Metallix Refining business combination as follows: •engaged an external valuation expert to determine the fair value of the property, plant and equipment mainly based on the depreciated replacement costs method, and comparable transactions where appropriate •engaged an external valuation expert to determine the fair value of identifiable intangible assets based on appropriate methods supported by the expected discounted net cash flows •determined the fair value of the remaining assets acquired and liabilities assumed using appropriate valuation techniques Management recognised goodwill on acquisition of R9 million, attributable to human capital and the premium paid for the synergies and benefits expected to be derived from the Group's recycling business across the US. |
External Auditor suitability review
In terms of section 90(1) of the Companies Act, each year at its AGM, the Company must appoint an external audit firm and designated
individual partner in compliance with the requirements of the Companies Act and the JSE LR, respectively.
In terms of the JSE LR, the Audit Committee has the responsibility to review the Company’s appointed audit firm and designated individual
partner for appointment. After such review, the Audit Committee makes a recommendation to the Board, and the Board in turn considers same
and then makes a recommendation to shareholders in the notice of AGM.
Accordingly, in compliance with paragraph 5.7(h)(iii) the Simplified JSE LR, the Audit Committee assessed the suitability of BDO South Africa Inc.
for appointment as external auditors of the Group, and appointment of Servaas Kranhold as the designated individual partner (Auditor Suitability
Review).
The Auditor Suitability Review performed by the Audit Committee included an examination and review of
•the results of the most recent Independent Regulatory Board for Auditors (IRBA) inspections of BDO South Africa Inc., including the responses
of the firm on observations/findings on the firm and on selected audit files raised by IRBA
•the results of the most recent IRBA inspection of the designated individual audit partner
•a summary of the audit firms ISQM 1 internal inspection process and the process to analyse and conclude on the results of the internal
inspection (Internal Quality Review)
•a summary of the outcome of the designated individual partner’s latest Internal Quality Review
•the results of the most recent Public Company Accounting Oversight Board (PCAOB) inspection review of BDO South Africa Inc.
•a summary and results of all legal and disciplinary proceedings, completed or pending, within the past five years, which were instituted in
terms of any legislation or by any professional body of which the audit firm and/or designated individual partner are a member or regulator to
whom they are accountable, including where the matter is settled by consent order or payment of a fine.
REPORT OF THE AUDIT COMMITTEE continued
Based on the results of the Auditor Suitability Review and a review of the independence of BDO South Africa Inc. and the designated individual
partner, the Audit Committee has satisfied itself in terms of the JSE LR and recommended to the Board that BDO South Africa Inc. be re-
appointed as the auditors of the Company and that Servaas Kranhold be re-appointed as the designated individual partner. The Board
concurred with the recommendation.
Auditor independence and fees
The Audit Committee is also responsible for determining that the external audit firm and designated individual partner have the necessary
independence, experience, qualifications and skills, and that audit and other fees are reviewed and approved.
The Audit Committee has reviewed and assessed the independence of the external auditor, that has confirmed in writing that the criteria for
independence, as set out in the companies Act, the rules of IRBA, the PCAOB, and other relevant international bodies, have been followed. The
Audit Committee is satisfied that BDO South Africa Inc. is independent of the Company and Group. The audit fees, audit-related fees, tax fees
and all other non-audit fees were approved by the Audit Committee. The audit fees are disclosed below, as well as the audit-related fees billed
by BDO South Africa Inc. for 2025 (Ernst & Young Inc. for 2024 and 2023):
| | | |
Figures in million - SA rand | | | |
| | | |
| | | |
| | | |
| | | |
1Audit fees consist of the aggregate fees for the annual audit of Sibanye-Stillwater’s respective Company and Group consolidated financial statements, audit of the Group’s
internal control over financial reporting in accordance with section 404 of the Sarbanes-Oxley Act (SOX Act) and the audit of statutory financial statements of the Company’s
subsidiaries, including fees billed for assurance and related services that are reasonably related to the performance of the audit or reviews of the Company’s financial statements
that are services that only an external auditor can reasonably provide. The 2025 audit fees include an inflationary increase and fees for the review of the audit of the Metallix
Group of Companies and additional statutory audits
2The 2025 audit fees includes the aggregate fees for the annual audit of DRDGOLD Limited who are also audited by the same auditors, BDO South Africa Inc. The DRDGOLD Limited
audit fees for 2024 and 2023 were not included in the table above, as DRDGOLD Limited were audited by different auditors than Sibanye-Stillwater for those years.
3Audit-related fees consist of the aggregate fees billed in each fiscal year for factual findings reports and the review of documents filed with regulatory authorities. Also included for
2025 were fees in respect of providing limited assurance by BDO Advisory Services Proprietary Limited on specified items in the Integrated Report for DRDGOLD Limited
4Tax fees include the aggregate fees billed in each fiscal year for tax compliance, tax advice, tax planning and other tax-related services
5All fees quoted are exclusive of VAT
The Audit Committee determines the nature and extent of non-audit services that the auditor can provide and pre-approves all permitted non-
audit assignments by the Group’s external auditor. In accordance with the SEC rules regarding auditor independence, the Audit Committee has
established policies and procedures for audit and non-audit services provided by the Group’s external auditor. The rules apply to Sibanye-
Stillwater and it’s legally controlled unlisted subsidiaries engaging any accounting firms for audit services and the auditor who audits the
accounts filed with the SEC (the Group’s independent external auditor) for permissible non-audit services. When engaging the Group’s external
auditor for permissible non-audit services (audit related services, tax services, and all other services), pre-approval is obtained prior to the
commencement of the services.
The Audit Committee approves the respective annual audit plans presented by both the internal and external auditors and monitors progress
against the plans. These audit plans provide the Audit Committee with the necessary assurance on risk management, internal control
environments and IT governance.
Internal Audit
The internal control systems of the Group are monitored by the in-house Internal Audit function, which reports findings and recommendations to
the Audit Committee and to senior management. The Audit Committee determines the purpose, authority and responsibility of the Internal Audit
function in an Internal Audit Charter. The Internal Audit function is headed by the Vice President: Internal Audit, who may be appointed or
dismissed by the Audit Committee. The Audit Committee is satisfied that the incumbent Vice President: Internal Audit has the requisite skills and
experience and is supported by a sufficient staff complement with appropriate skills and training.
Sibanye-Stillwater’s Internal Audit operates in accordance with the International Standards for the Professional Practice of Internal Auditing as
prescribed by the Institute of Internal Auditors. Internal Audit activities carried out during the year were identified and planned through a
combination of the Sibanye-Stillwater Risk Management framework and the risk-based methodologies adopted by Internal Audit. The Audit
Committee approves the annual internal audit assurance plan presented by Internal Audit and monitors progress against the plan.
Internal Audit reports deficiencies to the Audit Committee every quarter together with recommended remedial actions, which are then followed
up. Internal Audit provided the Audit Committee with a written report, which assessed the governance, risk management and control processes,
including internal controls over financial reporting, as generally adequate and effective during 2025.
REPORT OF THE AUDIT COMMITTEE continued
JSE LR
In accordance with the JSE LR, the Audit Committee reports and confirms that it has:
•evaluated the expertise, experience and performance of the Group CFO during 2025 and is satisfied that he has the appropriate expertise
and experience to carry out his duties, and is supported by qualified and competent senior staff
•ensured that the Group has established appropriate financial reporting procedures and that those procedures are operating, this included
consideration of all entities consolidated into the group financial statements, ensuring that management had access to all the required
financial information to allow the effective preparation and report on the consolidated financial statements
•has performed the Auditor Suitability Review of both the appointed external audit firm and designated individual audit partner as detailed
above
•notwithstanding the provisions of Section 90(6) of the Companies Act, ensured that the proposed appointment of the audit firm and
designated individual partner is presented and included as a resolution in the notice of annual general meeting pursuant to Section 61(8) of
the Companies Act
•ensured that the Chief Executive Officer and Chief Financial Officer have complied with the requirements of the attestation statement as as
required by the JSE LR
•considered the JSE’s report on proactive monitoring and implemented changes to the annual financial statements, as appropriate, based on
the findings
IT and Cyber Security Governance
The Audit Committee is responsible for IT governance on behalf of the Board and reviews the report of the Vice President: Group ICT at each
Audit Committee meeting. The Vice President: Group ICT reports to this committee quarterly, specifically on matters relating to IT risk and
cybersecurity.
Following the cyberattack experienced in July 2024, the Group continued to implement further enhancements during 2025, focussing on
strengthening its cybersecurity control environment, resilience and incident response capabilities. Management, together with the Audit
Committee and the Board, maintained active oversight of progress, with cybersecurity remaining a standing agenda item for relevant
governance forums.
Ongoing cybersecurity awareness and training programmes continued to be conducted across the Group during 2025, reinforcing employee
vigilance and preparedness. The Board continues to retain appropriate cybersecurity expertise and oversight structures to support effective
governance of cyber risk.
Audit Committee statement
Based on information from, and discussions with, management and external auditors, the Audit Committee has no reason to believe that there
were any material breakdowns in the design and operating effectiveness of internal financial controls of the Group during the year and is of the
opinion that the financial records may be relied upon as the basis for preparation of the consolidated financial statements.
With respect to the financial year ended 31 December 2025, no material weakness was identified due to control deficiencies. Management
strives to continuously improve the diligence in the identification and documentation of key controls.
The Audit Committee has considered and discussed the consolidated financial statements and associated reports with both management and
the external auditors. During this process, the Audit Committee
•evaluated significant judgements and reporting decisions
•determined that the going-concern basis of reporting is appropriate
•evaluated the material factors and risks that could impact on the consolidated financial statements
•evaluated the completeness of the financial and sustainability discussion and disclosures
•discussed the treatment of significant and unusual transactions with management and the external auditors
The Audit Committee considers that the Integrated report and consolidated financial statements comply in all material respects with all
compliance requirements detailed earlier in this report. In addition, the Audit Committee considers whether the company separate financial
statements comply in all material respects with all compliance requirements relevant to those financial statements (refer to the company
financial statements which include the Report of the Audit Committee dealing with the responsibilities of the Audit Committee relevant to the
Company financial statements). The Audit Committee recommended to the Board that the Integrated report and consolidated financial
statements be adopted and approved by the Board. The Board subsequently adopted and approved the Integrated report and consolidated
financial statements.
Terence Nombembe CA(SA)
Chairman: Audit Committee
24 April 2026
The directors have pleasure in submitting this report and the consolidated annual financial statements of Sibanye-Stillwater for the year ended 31
December 2025.
Nature of business
The company’s primary listing is in South Africa on the JSE under the ticker symbol SSW. Sibanye-Stillwater’s American Depositary Shares (ADSs) are
listed on the New York Stock Exchange under the ticker symbol SBSW.
For information on the nature of the Group's business see – Consolidated Financial Statements – Notes to the consolidated financial statements –
Note 1.1: Reporting entity.
Financial affairs
Results for the year
For a review of the results for the year see – Annual Financial Report – Management’s discussion and analysis of the financial statements – 2025
financial performance compared with 2024 and for confirmation of the financial statements see – Annual Financial Report – Chief Executive
Officer and Chief Financial Officer responsibility statement.
Dividends
Sibanye-Stillwater’s dividend policy is to return at least 25% to 35% of normalised earnings to shareholders and after due consideration of future
requirements the dividend may be increased beyond these levels. The Board, therefore, considers normalised earnings in determining what value
will be distributed to shareholders. The Board believes normalised earnings provides useful information to investors regarding the extent to which
results of operations may affect shareholder returns.
For the calculation of normalised earnings see – Consolidated financial statements – Notes to the consolidated financial statements – Note 13:
Dividends
Consistent with Sibanye-Stillwater’s dividend policy and Capital Allocation Framework, the Board of Directors resolved to declare a final dividend
for the year ended 31 December 2025 of 131 cents per share and did not declare an interim dividend for 2025 (no dividend was declared for the
year ended 2024).
Borrowing powers
In terms of Clause 4 of the Company’s Memorandum of Incorporation, the borrowing powers of the Sibanye Stillwater Limited (the Company) are
unlimited. As at 31 December 2025, the borrowings of the Group, excluding the Burnstone Debt was R39,252 million (2024: R39,426 million), see –
Consolidated financial statements – Notes to the consolidated financial statements – Note 27: Borrowings and derivative financial instrument.
Sibanye-Stillwater is subject to financial and other covenants and restrictions under its credit facilities from time to time. Such covenants may
include restrictions on Sibanye-Stillwater incurring additional financial indebtedness and obligations to maintain certain financial covenant ratios
for as long as any amount is outstanding under such facilities.
At 31 December 2025, Sibanye-Stillwater had committed undrawn facilities of R21,255 million (31 December 2024: R26,743 million) available under
the US$1 billion RCF, the R6.5 billion RCF and on other short-term borrowing facilities.
Working capital and going concern assessment
The consolidated financial statements have been prepared using appropriate accounting policies, supported by reasonable judgements and
estimates. The directors believe that the Group has adequate resources to continue as a going concern, and therefore realise its assets and
settle its liabilities in the ordinary course of business for the foreseeable future.
The directors believe that the cash generated by its operations, cash on hand, the committed unutilised debt facilities as well as additional
funding opportunities will enable the Group to continue to meet its obligations as they fall due in the ordinary course of business for a period of at
least eighteen months after the reporting date. The consolidated financial statements for the year ended 31 December 2025, have been
prepared on a going concern basis, see – Consolidated financial statements – Notes to the consolidated financial statements – Note 36.2: Risk
management activities – Working capital and going concern assessment.
Changes to board Committees
On 12 March 2026, Sibanye-Stillwater advised shareholders of the following governance developments approved by the Board which will be
effective on 28 May 2026:
•board committees reduced to five, including a combined Audit and Risk Committee to enhance integrated oversight of financial,
operational and strategic risks
•investment committee dissolved with material investment or divestment decisions moved directly to the Board
•remuneration committee chair changed following the retirement of director Timothy Cummings
•these committee changes are effective from AGM (28 May 2026)
•age‑based retirement limit removed from governance framework for non‑executive directors
•all directors will be subject to annual fit, proper and capability assessments, consistent with good corporate governance and the JSE Listings
Requirements
•the director retirement policy is effective immediately
DIRECTORS’ REPORT continued
Directorate
* | | | |
| | | |
| Chairman and independent non-executive director | | |
| | | |
| | | |
| | | |
| Independent non-executive director | | |
| Lead Independent and non-executive director | | |
| | | |
| | | |
| Independent non-executive director | | |
| Independent non-executive director | | |
| Independent non-executive director | | |
| | | |
| Independent non-executive director | | |
| Independent non-executive director | | |
| | | |
Achieved 12-year tenures and with effect from 24 March 2025 no longer regarded as independent and classified as non-executive directors
1 Appointed as CEO with effect from 1 October 2025
2 Retirement from the Board effective at the next AGM on 28 May 2026 and is not available for re-election
Rotation of directors
In accordance with Sibanye-Stillwater’s Memorandum of Incorporation (MOI), one third of the directors shall retire from office at each annual
general meeting (AGM) and stand for election. The first to retire is the director appointed as an additional member of the Board, followed by the
longest-serving members. Retiring directors can be immediately re-elected by the shareholders at the AGM. The Board conducted a formal
fit‑and‑proper evaluation for all directors standing for election and re‑election through an external board evaluation process. Dr L Mthimunye will
stand for election at the AGM and Dr V Maphai, Mr C Keyter, Mr R Menell and Prof J Vilakazi are to be re-elected at the AGM. These directors
were confirmed to be fit and proper to serve.
Director changes
The following director retirement have been announced since 31 December 2025:
•Timothy Cumming will retire from the Board at the next AGM and is not available for re-election
Directors’ and officers’ disclosure of interest in contracts
As of the date of this report, none of the directors, officers or major shareholders of Sibanye-Stillwater or, to the knowledge of Sibanye-Stillwater’s
management, their families, had any interest, direct or indirect, in any transaction during the last fiscal year or in any proposed transaction which
has or will materially affect Sibanye-Stillwater or its investment interests or subsidiaries.
None of the directors or officers of Sibanye-Stillwater or any associate of such director or officer is currently or has been at any time during the
past fiscal year materially indebted to Sibanye-Stillwater.
For related party information, see – Consolidated financial statements – Notes to the consolidated financial statements – Note 37: Related-party
transactions.
Subsidiary companies
For details of major subsidiary companies in which the Company has a direct or indirect interest, see – Consolidated financial statements – Notes
to the consolidated financial statements – Note 1.3: Consolidation.
Special resolutions passed by subsidiary companies
Special resolutions were passed by certain subsidiary companies during the year in the ordinary course of business, including resolutions
authorising the provision of financial assistance in terms of section 45 of the Companies Act. These resolutions were passed in accordance with
applicable legal requirements.
Litigation
Appian Capital legal settlement
On 10 November 2025, before the Quantum Trial commenced, Sibanye-Stillwater and Appian agreed a commercial settlement of the dispute for
a total payment of US$215 million (R3,607 million) (including legal fees).
See – Consolidated financial statements – Notes to the consolidated financial statements – Note 29.2: Other provisions.
Company Secretary
Lerato Matlosa was appointed Company Secretary of Sibanye-Stillwater with effect from 1 June 2018.
DIRECTORS’ REPORT continued
Auditors
The Audit Committee has recommended to the Board that BDO South Africa Inc. continues in office in accordance with section 90(1) of the
Companies Act and in terms of the JSE Listings Requirements, subject to shareholders approving the resolution at the next annual general
meeting. For additional information see – Accountability – Report of the Audit Committee – External Auditor suitability review.
REPORT OF INDEPENDENT REGISTERED PUBLIC
ACCOUNTING FIRM
Shareholders and Board of Directors
Sibanye Stillwater Limited
Johannesburg, Republic of South Africa
Opinion on the Consolidated Financial Statements
We have audited the accompanying consolidated statement of financial position of Sibanye Stillwater Limited (the “Company”) as of
December 31, 2025, the related consolidated income statement, consolidated statements of other comprehensive income, changes in equity,
and cash flows for the year then ended, and the related notes (collectively referred to as the “consolidated financial statements”). In our
opinion, the consolidated financial statements present fairly, in all material respects, the financial position of the Company at December 31,
2025, and the results of its operations and its cash flows for the year then ended, in conformity with IFRS Accounting Standards, as issued by the
International Accounting Standards Board (IASB).
We also have audited, in accordance with the standards of the Public Company Accounting Oversight Board (United States) (PCAOB), the
Company's internal control over financial reporting as of December 31, 2025, based on criteria established in Internal Control – Integrated
Framework (2013) issued by the Committee of Sponsoring Organizations of the Treadway Commission (COSO) and our report dated April 24, 2026
expressed an unqualified opinion thereon.
Basis for Opinion
These consolidated financial statements are the responsibility of the Company’s management. Our responsibility is to express an opinion on the
Company’s consolidated financial statements based on our audit. We are a public accounting firm registered with the Public Company
Accounting Oversight Board (United States) (PCAOB) and are required to be independent with respect to the Company in accordance with the
U.S. federal securities laws and the applicable rules and regulations of the Securities and Exchange Commission and the PCAOB.
We conducted our audit in accordance with the standards of the PCAOB. Those standards require that we plan and perform the audit to obtain
reasonable assurance about whether the consolidated financial statements are free of material misstatement, whether due to error or fraud.
Our audit included performing procedures to assess the risks of material misstatement of the consolidated financial statements, whether due to
error or fraud, and performing procedures that respond to those risks. Such procedures included examining, on a test basis, evidence regarding
the amounts and disclosures in the consolidated financial statements. Our audit also included evaluating the accounting principles used and
significant estimates made by management, as well as evaluating the overall presentation of the consolidated financial statements. We believe
that our audit provides a reasonable basis for our opinion.
Critical Audit Matters
The critical audit matters communicated below are matters arising from the current period audit of the consolidated financial statements that
were communicated or required to be communicated to the audit committee and that: (1) relates to accounts or disclosures that are material
to the consolidated financial statements and (2) involved our especially challenging, subjective, or complex judgments. The communication of
the critical audit matters does not alter in any way our opinion on the consolidated financial statements, taken as a whole, and we are not, by
communicating the critical audit matters below, providing a separate opinions on the critical audit matters or on the accounts or disclosures to
which they relate.
Impairment assessment of Cash Generating Units (CGUs)
As described in Notes 10 and 14 to the consolidated financial statements, significant accounting judgments and estimates are made in relation
to the impairment assessment of CGUs. Management performs an impairment assessment for CGUs, whenever events or changes in
circumstances indicate that such carrying value may not be recoverable. Impairment indicators were identified in the current year in the
Stillwater, Keliber and Kloof (CGUs) and an aggregate impairment loss of R15,813m was recognized for the year ended December 31, 2025.
We identified the evaluation of CGUs related to Stillwater, Keliber and Kloof (the CGUs) impairment assessment as a critical audit matter. Auditing
management’s CGU impairment assessments was complex due to the significant judgement required in determining the recoverable amounts of
the CGUs, including significant assumptions used to calculate the estimated future cash flows. The estimated future cash flows are sensitive to
changes in significant assumptions such as expected commodity prices, discount rates, life of mine plans and foreign exchange rates. The life of
mine plans include projected operating cash flows, sustaining capital expenditures and developmental capital expenditure, based on reserves
estimates and estimates of future production. Auditing these estimates and assumptions involved especially challenging and subjective auditor
judgement due to the nature and extent of audit effort required, including the extent of specialised skill or knowledge needed.
The primary procedures we performed to address this critical audit matter included:
•Testing the design and operating effectiveness of controls over the Company’s CGU impairment assessment process, including controls
over management’s review of the significant assumptions used in determining the recoverable amount.
•Assessing the reasonableness of management’s methodologies used in the impairment assessments and cash flow models. Testing
management’s projected operating cash flows, sustaining and developmental capital expenditures included in the life of mine plans,
against historical trends and other relevant data and performing trend analysis to evaluate the correlation of future production against
projected operating costs and capital expenditures.
•Utilising professionals with specialised skills and knowledge in valuation to assist in assessing the reasonableness of the discount rates
used in the CGU impairment assessments by calculating an independent range using available market information and comparing it
against management’s discount rates and performing sensitivity analyses thereon. In addition, with the assistance of our valuation
REPORT OF INDEPENDENT REGISTERED PUBLIC ACCOUNTING FIRM continued
specialists, we compared management’s projected future commodity price assumptions and foreign currency exchange rates to
observable market data and current industry and economic forecasts.
•Utilising professionals with specialised skills and knowledge in mining to assist in evaluating the impairment assessment of the CGUs and
evaluating the reasonableness of management’s reserve estimation procedures, including application of management’s
methodology and assessing the reasonableness of certain inputs used in the quantification of reserves, by comparing them against
industry practices and the regulatory reserves reporting requirements.
Physical quantities of Marikana’s Platinum Group Metals (PGM) inventory in process
As described in Note 22 to the consolidated financial statements, the quantity of PGM inventory in process is determined by both metal content
and physical quantities. Marikana’s PGM inventory in process amounted to R6,436 million as of December 31, 2025. PGM inventory in process is
sampled and assayed to determine the metal content. Due to inherent limitations in monitoring of recoverability levels, the process of
metallurgically balancing inputs and outputs is regularly monitored and metallurgical estimates are refined through reference to actual results.
Periodic inventory counts are conducted at refineries to assess the accuracy of inventory quantities. Where required, changes in metallurgical
estimates are factored into the measurement of metal inventory. Due to expected levels of estimation uncertainty, reasonable tolerances of
total metals are accepted in the measurement of PGM in process quantities.
We identified the auditing of the physical quantities of Marikana’s PGM inventory in process as a critical audit matter because of the complex
judgments and assumptions used due to the technical nature of the management’s process, the estimation uncertainty and the specialized
knowledge required in performing such procedures. Auditing these judgments and assumptions involved especially challenging and subjective
auditor judgement due to the nature and extent of audit effort required, including the extent of specialized skill or knowledge needed.
The primary procedures we performed to address this critical audit matter included:
•Assessing the reasonableness of the Company’s estimation methodology and testing the data used by the Company from the
weighing, tank readings and assaying results to estimate the total amount of PGM inventory in process against relevant supporting
details.
•Utilising professionals with specialised skills and knowledge in mining to assist in testing inventory in process quantities, including
assistance of our metallurgical specialists with the following procedures: (i) observing inventory counts held at the interim date at the
metal inventory processing areas and evaluating management’s sampling and assaying of the carrier material and quantity readings,
(ii) evaluating the reasonableness of the measurements performed by the Company during the stock count procedures and the
engineering estimates applied by comparing the methodologies used to industry practice and standards, and (iii) performing an
analysis on assay results during the period, including the roll forward period to assess if the results were within industry standards, within
acceptable standard deviation ranges and consistent with other results during the year.
•Performing roll-forward procedures from the interim inventory count date to December 31, 2025 including testing movements of inputs
received, and quantities produced and dispatched to relevant supporting details.
BDO South Africa Incorporated
We have served as the Company’s auditor since 2025.
Johannesburg, Republic of South Africa
April 24, 2026
REPORT OF INDEPENDENT REGISTERED PUBLIC ACCOUNTING FIRM continued
Shareholders and Board of Directors
Sibanye Stillwater Limited
Johannesburg, Republic of South Africa
Opinion on Internal Control Over Financial Reporting
We have audited Sibanye Stillwater Limited’s (the “Company’s”) internal control over financial reporting as of December 31, 2025, based on
criteria established in Internal Control – Integrated Framework (2013) issued by the Committee of Sponsoring Organizations of the Treadway
Commission (the “COSO criteria”). In our opinion, the Company maintained, in all material respects, effective internal control over financial
reporting as of December 31, 2025, based on the COSO criteria.
We also have audited, in accordance with the standards of the Public Company Accounting Oversight Board (United States) (PCAOB), the
consolidated statement of financial position of the Company as of December 31, 2025, the related consolidated income statement,
consolidated statements of other comprehensive income, changes in equity, and cash flows for the year then ended, and the related notes and
our report dated April 24, 2026 expressed an unqualified opinion thereon.
Basis for Opinion
The Company’s management is responsible for maintaining effective internal control over financial reporting and for its assessment of the
effectiveness of internal control over financial reporting, included in the accompanying Item 15(b), Management’s Report on Internal Control
over Financial Reporting. Our responsibility is to express an opinion on the Company’s internal control over financial reporting based on our audit.
We are a public accounting firm registered with the PCAOB and are required to be independent with respect to the Company in accordance
with U.S. federal securities laws and the applicable rules and regulations of the Securities and Exchange Commission and the PCAOB.
We conducted our audit of internal control over financial reporting in accordance with the standards of the PCAOB. Those standards require
that we plan and perform the audit to obtain reasonable assurance about whether effective internal control over financial reporting was
maintained in all material respects. Our audit included obtaining an understanding of internal control over financial reporting, assessing the risk
that a material weakness exists, and testing and evaluating the design and operating effectiveness of internal control based on the assessed risk.
Our audit also included performing such other procedures as we considered necessary in the circumstances. We believe that our audit provides
a reasonable basis for our opinion.
As indicated in the accompanying Item 15(b), Management’s Report on Internal Control over Financial Reporting, management’s assessment of
and conclusion on the effectiveness of internal control over financial reporting did not include the internal controls of Metallix Refining Inc. group
of entities (Metallix) which was acquired on September 4, 2025, and which is included in the consolidated statement of financial position of the
Company as of December 31, 2025, consolidated income statement, consolidated statements of other comprehensive income, changes in
equity, and cash flows for the year then ended. Metallix constituted 1.38% of consolidated total assets as of December 31, 2025, 1.28% and 7.05%
of consolidated revenues and loss for the year, respectively, for the year then ended. Management did not assess the effectiveness of internal
control over financial reporting of Metallix because of the timing of the acquisition which was completed on September 4, 2025. Our audit of
internal control over financial reporting of the Company also did not include an evaluation of the internal control over financial reporting of
Metallix.
Definition and Limitations of Internal Control Over Financial Reporting
A company’s internal control over financial reporting is a process designed to provide reasonable assurance regarding the reliability of financial
reporting and the preparation of financial statements for external purposes in accordance with generally accepted accounting principles. A
company’s internal control over financial reporting includes those policies and procedures that (1) pertain to the maintenance of records that, in
reasonable detail, accurately and fairly reflect the transactions and dispositions of the assets of the company; (2) provide reasonable assurance
that transactions are recorded as necessary to permit preparation of financial statements in accordance with generally accepted accounting
principles, and that receipts and expenditures of the company are being made only in accordance with authorizations of management and
directors of the company; and (3) provide reasonable assurance regarding prevention or timely detection of unauthorized acquisition, use, or
disposition of the company’s assets that could have a material effect on the financial statements.
Because of its inherent limitations, internal control over financial reporting may not prevent or detect misstatements. Also, projections of any
evaluation of effectiveness to future periods are subject to the risk that controls may become inadequate because of changes in conditions, or
that the degree of compliance with the policies or procedures may deteriorate.
BDO South Africa Incorporated
Johannesburg, Republic of South Africa
April 24, 2026
REPORT OF INDEPENDENT REGISTERED PUBLIC ACCOUNTING FIRM continued
Report of Independent Registered Public Accounting Firm
To the Shareholders and the Board of Directors of Sibanye Stillwater Limited
Opinion on the Financial Statements
We have audited the accompanying consolidated statements of financial position of Sibanye Stillwater Limited (the Company) as of 31
December 2024 and 2023, the related consolidated income statements, consolidated statements of other comprehensive income, changes in
equity and cash flows for each of the two years in the period ended 31 December 2024, and the related notes (collectively referred to as the
“consolidated financial statements”). In our opinion, the consolidated financial statements present fairly, in all material respects, the financial
position of the Company at 31 December 2024 and 2023, and the results of its operations and its cash flows for each of the two years in the
period ended 31 December 2024, in conformity with IFRS Accounting Standards as issued by the International Accounting Standards Board.
Basis for Opinion
These financial statements are the responsibility of the Company's management. Our responsibility is to express an opinion on the Company’s
financial statements based on our audits. We are a public accounting firm registered with the PCAOB and are required to be independent with
respect to the Company in accordance with the U.S. federal securities laws and the applicable rules and regulations of the Securities and
Exchange Commission and the PCAOB.
We conducted our audits in accordance with the standards of the PCAOB. Those standards require that we plan and perform the audit to
obtain reasonable assurance about whether the financial statements are free of material misstatement, whether due to error or fraud. Our audits
included performing procedures to assess the risks of material misstatement of the financial statements, whether due to error or fraud, and
performing procedures that respond to those risks. Such procedures included examining, on a test basis, evidence regarding the amounts and
disclosures in the financial statements. Our audits also included evaluating the accounting principles used and significant estimates made by
management, as well as evaluating the overall presentation of the financial statements. We believe that our audits provide a reasonable basis
for our opinion.
Ernst & Young Incorporated
We have served as the Company’s auditor from 2019 to 2025.
Johannesburg, Republic of South Africa
25 April 2025, except as to Note 2 and Note 16.2, which is as of 24 April 2026.
CONSOLIDATED INCOME STATEMENT
For the year ended 31 December 2025
| | | | |
Figures in million – SA rand | | | | |
| | | | |
| | | | |
| | | | |
| | | | |
Share-based payment expenses | | | | |
(Loss)/gain on financial instruments | | | | |
Gain/(loss) on foreign exchange differences | | | | |
Share of results of equity-accounted investees after tax | | | | |
| | | | |
| | | | |
(Loss)/gain on disposal of property, plant and equipment | | | | |
Impairments and reversal of impairments | | | | |
| | | | |
Occupational healthcare (loss)/gain | | | | |
| | | | |
Transaction and project costs | | | | |
Profit/(loss) before royalties, carbon tax and tax | | | | |
| | | | |
| | | | |
| | | | |
| | | | |
| | | | |
| | | | |
Owners of Sibanye-Stillwater | | | | |
Non-controlling interests (NCI) | | | | |
Earnings per share attributable to owners of Sibanye-Stillwater | | | | |
Basic earnings per share — cents | | | | |
Diluted earnings per share — cents | | | | |
CONSOLIDATED STATEMENT OF OTHER
COMPREHENSIVE INCOME
For the year ended 31 December 2025
| | | |
Figures in million – SA rand | | | |
| | | |
Other comprehensive income (OCI), net of tax | | | |
Foreign currency translation adjustments1 | | | |
Fair value adjustment on other investments2 | | | |
Re-measurement of defined benefit plan2 | | | |
Total comprehensive income | | | |
| | | |
Owners of Sibanye-Stillwater | | | |
Non-controlling interests | | | |
1 These gains and losses will be reclassified to profit or loss in accordance with the accounting policy in note 1.4.
2 These gains and losses will never be reclassified to profit or loss
CONSOLIDATED STATEMENT OF FINANCIAL POSITION
As at 31 December 2025
| | | | |
Figures in million – SA rand | | | | |
| | | | |
| | | | |
Property, plant and equipment | | | | |
| | | | |
Goodwill and other intangibles | | | | |
Equity-accounted investments | | | | |
| | | | |
Environmental rehabilitation obligation funds | | | | |
| | | | |
| | | | |
| | | | |
| | | | |
Trade and other receivables | | | | |
| | | | |
| | | | |
Cash and cash equivalents | | | | |
| | | | |
| | | | |
| | | | |
Equity attributable to owners of Sibanye-Stillwater | | | | |
| | | | |
| | | | |
| | | | |
Non-controlling interests | | | | |
| | | | |
| | | | |
Borrowings and derivative financial instrument | | | | |
| | | | |
Environmental rehabilitation obligation and other provisions | | | | |
Occupational healthcare obligation | | | | |
Cash-settled share-based payment obligations | | | | |
| | | | |
| | | | |
Tax, carbon tax and royalties payable | | | | |
| | | | |
| | | | |
Borrowings and derivative financial instrument | | | | |
| | | | |
Environmental rehabilitation obligation and other provisions | | | | |
Occupational healthcare obligation | | | | |
Cash-settled share-based payment obligations | | | | |
| | | | |
| | | | |
| | | | |
Tax, carbon tax and royalties payable | | | | |
Liabilities associated with assets held for sale | | | | |
Total equity and liabilities | | | | |
1Amount for 31 December 2024 was revised (see note 16.2)
CONSOLIDATED STATEMENT OF CASH FLOWS
For the year ended 31 December 2025
| | | | |
Figures in million – SA rand | | | | |
Cash flows from operating activities | | | | |
Cash generated by operations | | | | |
Deferred revenue advance received | | | | |
Cash-settled share-based payments paid | | | | |
Payment of Marikana dividend obligation | | | | |
Additional deferred/contingent payments relating to acquisition of a business | | | | |
Change in working capital | | | | |
| | | | |
| | | | |
| | | | |
Royalties and carbon tax paid | | | | |
Royalties and carbon tax refunded | | | | |
| | | | |
| | | | |
| | | | |
Net cash from operating activities | | | | |
Cash flow from investing activities | | | | |
Additions to property, plant and equipment | | | | |
Proceeds on disposal of property, plant and equipment | | | | |
Acquisition of subsidiaries, net of cash acquired | | | | |
| | | | |
Additions to other investments | | | | |
Disposals of other investments | | | | |
Loans advanced to investee | | | | |
Repayment of loan from investee | | | | |
Proceeds on sale of assets held for sale | | | | |
Acquisition of equity-accounted investment | | | | |
Contributions to environmental rehabilitation funds | | | | |
Payment of deferred/contingent payment | | | | |
Proceeds from environmental rehabilitation funds | | | | |
Net cash used in investing activities | | | | |
Cash flow from financing activities | | | | |
| | | | |
| | | | |
| | | | |
| | | | |
Proceeds from NCI on rights issue | | | | |
Net cash from financing activities | | | | |
Net increase/(decrease) in cash and cash equivalents | | | | |
Effect of exchange rate fluctuations on cash held | | | | |
Cash and cash equivalents at beginning of the year | | | | |
Cash and cash equivalents at end of the year | | | | |
CONSOLIDATED STATEMENT OF CHANGES IN EQUITY
For the year ended 31 December 2025
| | | | | | | | | | |
Figures in million – SA rand | | | | Share-based payment reserve | | Foreign currency translation reserve | Accumulated profit/(loss) | Equity attributable to owners of Sibanye- Stillwater | Non- controlling interests | |
Balance at 31 December 2022 | | | | | | | | | | |
Total comprehensive income for the year | | | | | | | | | | |
| | | | | | | | | | |
Other comprehensive income, net of tax | | | | | | | | | | |
Equity-settled share-based payments | | | | | | | | | | |
| | | | | | | | | | |
Century business combination | | | | | | | | | | |
Transaction with Keliber Oy (Keliber) shareholders | | | | | | | | | | |
Keliber dividend obligation | | | | | | | | | | |
Transaction with Century shareholders | | | | | | | | | | |
Balance at 31 December 2023 | | | | | | | | | | |
Total comprehensive income for the year | | | | | | | | | | |
| | | | | | | | | | |
Other comprehensive income, net of tax | | | | | | | | | | |
Equity-settled share-based payments | | | | | | | | | | |
| | | | | | | | | | |
Recognition of derivative financial instrument in equity | | | | | | | | | | |
Transfer between reserves | | | | | | | | | | |
Balance at 31 December 2024 | | | | | | | | | | |
Total comprehensive income for the year | | | | | | | | | | |
| | | | | | | | | | |
Other comprehensive income, net of tax | | | | | | | | | | |
Equity-settled share-based payments | | | | | | | | | | |
| | | | | | | | | | |
Transactions with DRDGOLD shareholders | | | | | | | | | | |
Balance at 31 December 2025 | | | | | | | | | | |
NOTES TO THE CONSOLIDATED FINANCIAL STATEMENTS
For the year ended 31 December 2025
1. Accounting policies
The material accounting policies applied in the preparation of these consolidated financial statements are set out below. Where an
accounting policy is specific to a note, the policy is described in the note to which it relates. These policies have been consistently applied
to all the periods presented.
1.1 Reporting entity
Sibanye Stillwater Limited (the Company) and its subsidiaries (together referred to as the Group or Sibanye-Stillwater) is a multinational
mining and metals processing Group with a diverse portfolio of mining and processing operations, projects and investments across five
continents. The Group is also one of the foremost global recyclers of PGM autocatalysts and has interests in leading mine tailings
retreatment operations. Sibanye-Stillwater has established itself as one of the world’s largest primary producers of platinum, palladium and
rhodium and is also a top tier gold producer. It also produces and refines iridium and ruthenium, nickel, chrome, copper and cobalt. The
Group also built and diversified its asset portfolio into battery metals and green metals mining and processing, and increased its presence in
the circular economy by growing and diversifying its recycling and tailings reprocessing operations globally. Domiciled in South Africa,
Sibanye-Stillwater currently owns and operates a portfolio of high-quality operations and projects, which are grouped into four regions,
namely, Southern Africa (SA region), Americas, Europe and Australia.
The SA region houses the gold and PGM operations and projects located in South Africa and Zimbabwe. The underground and surface
gold mining operations in South Africa are the Driefontein, Kloof and Cooke operations in the West Witwatersrand (West Wits) region,
DRDGOLD Limited (DRDGOLD) with a surface tailings treatment plant in the East of Johannesburg in Gauteng and in the West Wits, and the
Beatrix operation in the southern Free State. Sibanye-Stillwater also owns and manages significant gold extraction and processing facilities
where ore is treated and beneficiated to produce gold doré. In addition, several organic projects currently underway are aimed at
sustaining these gold mining operations into the long term. Burnstone is a shallow developmental stage gold mine and processing
operation located in the South Rand Goldfield of the Witwatersrand Basin in the Mpumalanga province, and comprises two established
shaft complexes, a carbon-in-leach gold processing plant, tailings storage facility and related surface infrastructure and mining rights. In
line with the Group's capital allocation framework, it was decided to delay the Burnstone project, which is currently under care-and-
maintenance. The Southern Free State project is an advanced exploration stage project that includes the Bloemhoek, De Bron-Merriespruit,
Robijn and Hakkies areas. It is located adjacent to the Beatrix operation in the Free State province.
Beatrix, a conventional mining operation, comprises two operating vertical shafts and one metallurgical plant mining the Beatrix/VS5 reef,
the Aandenk/Kalkoenkrans reef as well as some historical surface rock dump material. During 2024, the Group agreed to sell the Beatrix 4
shaft which includes the Beisa uranium project. Driefontein is an established mine consisting of four operating vertical shaft complexes and
one metallurgical plant mining three different reefs as well as some historical surface rock dump material. Kloof is also an ongoing mine with
two operating vertical shaft complexes. Four reefs are extracted at Kloof, together with the mining of some historical surface rock dump
material. The Cooke underground operations consist of four vertical shafts, which currently are under care-and-maintenance. The surface
mining section, known as Randfontein Surface Operations, mines historical surface tailings facilities and surface rock dumps, processing
them at the Cooke and Ezulwini metallurgical plants.
The PGM assets in the SA region are the Kroondal operation, the Rustenburg operation (SRPM), the Marikana operation (Marikana) and the
tailings retreatment entity, Platinum Mile in the North West Province, and Mimosa (50%) in Zimbabwe. Marikana currently has five
contributing shafts namely K3, K4 (commenced production in 2023), Rowland, Saffy and E3 and the ore mined at the Marikana operations
is processed through four of the eight concentrators on site. The PGM concentrate produced is dispatched to the smelter where a sulphide-
rich matte is produced for further processing at the base metal refinery (BMR). At the BMR, base metals are removed and the resulting
PGM-rich product is sent to the precious metal refinery (PMR) for final treatment. Marikana therefore sells refined metals to customers. In
addition to underground operations, there is one tailings retreatment operation (Bulk Tailings Treatment (BTT) plant), which transitioned from
hydraulic remining to mechanical remining of a dormant tailings storage facility during the period and the tailings are retreated at the BTT
plant for the recovery of coarse chrome and PGMs.
The Rustenburg operation comprise of three operating vertical shafts (Siphumelele 1, Khuseleka 1 and Thembelani 1), two declines at
Bathopele, a concentrating plant at the Waterval UG2 concentrator and a chrome recovery plant, the Western Limb tailings retreatment
plant and related surface infrastructure and assets. In addition, remining operations are carried out on one dormant tailings storage facility
(Waterval West dam). Fresh ore is processed through the Waterval UG2 concentrator. Tailings are treated at the Western Limb Tailings
Retreatment Plant, Platinum Mile and at the Chrome retreatment plant where a saleable chromite concentrate is recovered. Tailings from
the Rustenburg operation are piped to Platinum Mile for further beneficiation and recovery of chrome and PGMs. The tailings from Platinum
Mile are pumped to an active tailings storage facility for final disposal. The Rustenburg operation has a tolling agreement with a third party
and currently sells refined metals as well as PGM concentrate to customers. In addition, Platinum Mile successfully commissioned a coarse
chrome recovery plant in 2023.
Kroondal, which now forms part of and reported under the Rustenburg operation, comprises of four operating decline shafts. Fresh ore is
processed at Kroondal through two concentrator plants (K1 and K2). Tailings from the K1 and K2 plants are piped to three adjacent tailings
storage facilities and at a fourth tailings storage facility at Marikana. Platinum Mile is a tailings retreatment facility located on the
Rustenburg lease area adjacent to our Kroondal operations. This facility recovers PGMs and chrome from the live tailings at our Rustenburg
operations. Kroondal and Platinum Mile currently only sells PGM concentrate and chrome to customers.
The US region houses the PGM operations located in the US and exploration-stage projects located in Canada and Argentina. The US PGM
operations include the East Boulder and Stillwater mining operations (including the Blitz project) in Montana. The assets in Montana also
include the Metallurgical complex in Columbus, Montana. This complex houses the smelter, BMR and an analytical laboratory which
NOTES TO THE CONSOLIDATED FINANCIAL STATEMENTS continued
For the year ended 31 December 2025
produces a PGM-rich filter cake that is further refined by a third-party precious metal refinery. These processing and metallurgical facilities
are also used to process recycled material such as spent autocatalytic convertors and petroleum refinery catalysts. The US region also
includes the Reldan Group of Companies (Reldan) (see note 16.2) which is a precious metals recycling group with facilities in Pennsylvania,
USA, as well as Mexico and India, processing primarily e-scrap to produce both green precious and base metals. Also included in the US
region is the newly acquired Metallix Refining (Metallix) which produces recycled precious metals, including gold, silver and PGMs, primarily
from industrial waste streams. It operates two processing and recycling operations in Greenville, North Carolina. Metallix has a global
customer base, which it services from the United Kingdom and South Korea, in addition to its customers in the United States (US).
Keliber, a Finnish mining and battery chemical company, owns the Keliber project, an advanced lithium hydroxide project located in the
Kaustinen region of Finland. Since the Sibanye-Stillwater Board of Directors approved the Keliber project and the immediate construction of
the Keliber Lithium Refinery in 2022, construction activities thereof have continued successfully after commencing in March 2023. Similarly,
the earthworks and selected infrastructure works commenced at the Päiväneva concentrator site in late 2023. Once developed, the
Keliber project will sustainably produce battery-grade lithium hydroxide. Following a detailed multidisciplinary assessment of various project
start up scenarios for Keliber during H2 2025, Sibanye-Stillwater and its partner, Finnish Minerals Group, agreed that a staged startup for the
Keliber lithium project was the most responsible approach, as staged commissioning of the mine, concentrator, and refinery reduces ramp-
up risk by prioritising operational readiness in the mining and concentrating stages before determining the appropriate timing for refinery
commissioning. The first stage of the project start up began during Q1 2026. The Group holds a 79.82% shareholding interest in Keliber. In
2022, the Group also acquired French mining group Eramet SA's Sandouville hydrometallurgical nickel processing facilities near Le Havre,
France's second largest industrial port. Sandouville's production was severely hampered by plant availability in 2023 and in 2025, the
production of nickel cathodes at the Sandouville nickel refinery ceased. The pre-feasibility study to assess the potential conversion of the
Sandouville plant to produce pCAM (the GalliCam project) is underway. The study will continue into 2026, with a decision on progressing on
the project to be evaluated by the end of H1 2026.
The Group's green metals investments also include the acquisition of a 100% stake in the Australian based entity, New Century Resources
Limited (Century), which owns a zinc tailings retreatment operation. The Group has also exercised an option to acquire a 100%
shareholding in Copper Mines of Tasmania Proprietary Limited, who owns the Mt Lyell Copper Mine in Australia .
1.2 Basis of preparation
The consolidated financial statements for the year ended 31 December 2025 have been prepared on a going concern basis in
accordance with IFRS Accounting Standards, as issued by the International Accounting Standards Board (IASB), the South African Institute
of Chartered Accountants Financial Reporting Guides issued by the Accounting Practices Committee and Financial Reporting
Pronouncements issued by the Financial Reporting Standards Council, as well as the requirements of the South African Companies Act and
JSE Listings Requirements. The consolidated financial statements have been prepared under the historical cost convention, except for
certain financial assets and financial liabilities (including derivative instruments) which are measured at fair value through profit or loss or
other comprehensive income.
NOTES TO THE CONSOLIDATED FINANCIAL STATEMENTS continued
For the year ended 31 December 2025
Standards, interpretations and amendments to published standards effective for the year ended 31 December 2025
During the financial year, the following amendments to standards applicable to the Group became effective and had no material impact
on the Group’s consolidated financial statements:
| | |
| | |
Lack of Exchangeability (Amendments to IAS 21) | Under IAS 21 The Effects of Changes in Foreign Exchange Rates (IAS 21), a spot exchange rate is used when translating a foreign currency transaction. In some rare circumstances, it is possible that one currency cannot be exchanged into another. Consequently, market participants are unable to buy and sell currency to meet their needs at the official exchange rate and turn instead to unofficial, parallel markets. The IASB amended IAS 21 to clarify when a currency is exchangeable to another currency and how a spot rate can be estimated when a currency lacks exchangeability. This amendment is applicable to the Group's investment in Mimosa (domiciled in Zimbabwe), however no material impact was identified. | |
Amendments to Illustrative Examples on IFRS 7, IFRS 18, IAS 1, IAS 8, IAS 36 and IAS 37- Disclosures about Uncertainties in the Financial Statements | These amendments include examples illustrating how an entity applies the requirements in IFRS Accounting Standards to disclose the effects of uncertainties in its financial statements. The examples do not add to or change requirements in IFRS Accounting Standards and therefore there are no transition requirements. | The examples do not have an effective date, but may be considered for December 2025 year-ends. |
1Effective date refers to annual period beginning on or after the effective date
NOTES TO THE CONSOLIDATED FINANCIAL STATEMENTS continued
For the year ended 31 December 2025
Standards, interpretations and amendments to published standards which are not yet effective
Certain new standards, amendments and interpretations to existing standards have been published that apply to the accounting periods
beginning on or after 1 January 2026 but have not been early adopted by the Group. The standards, amendments and interpretations that
are applicable to the Group are:
| | |
| | |
Amendments to the classification and measurement of financial instruments (Amendments to IFRS 9 Financial Instruments (IFRS 9) and IFRS 7 Financial Instruments: Disclosures (IFRS 7))2 | The amendments provide guidance on the classification of financial assets with contingent features. Under IFRS 9, it was unclear whether the contractual cash flows of some financial assets with ESG-linked features represented the solely payments of principal and interest (SPPI) criterion, which is a condition for measurement at amortised cost. The amendments apply to all contingent features, not just ESG-linked features and introduce an additional SPPI test for financial assets with contingent features that are not related directly to a change in basic lending risks or costs. The amendments also include additional disclosures for all financial assets and financial liabilities that have certain contingent features that are not related directly to a change in basic lending risks or costs, and are not measured at fair value through profit or loss. The amendments to IFRS 9 also clarifies when a financial asset and financial liability is recognised and derecognised and provides an exception for certain financial liabilities settled using an electronic payment system. The exception allows for financial liabilities to be derecognised before the settlement date if certain criteria are met. | |
Annual improvements to IFRS Accounting Standards (Amendments to IFRS 7, IFRS 9, IFRS 10 Consolidated Financial Statements, and IAS 7 Statement of Cash Flows)2 | The IASB published annual improvements to IFRS Accounting Standards relating to various standards applied by the Group in the consolidated financial statements. The amendments are primarily clarifications, internal referencing updates and editorial changes to IFRS Accounting Standards. | |
Contracts Referencing Nature-dependent Electricity (Amendments to IFRS 9 and IFRS 7)2 | The amendments address challenges in contracts referencing nature-dependent electricity, referred to as renewable power purchase agreements (PPAs). The amendments include the own-use exemption for purchasers in PPAs and hedge accounting requirements for purchasers and sellers in PPAs. To apply the own-use exemption to a PPA, IFRS 9 currently requires the contract to be for receipt of electricity in line with the entity’s expected purchase or usage requirements. The amendments allow an entity to apply the own-use exemption to PPAs if the entity is, and expects to be, a net-purchaser of electricity for the contract period. | |
IFRS 18 Presentation and Disclosure in Financial Statements (IFRS 18) | IFRS 18 was issued to address the need for more relevant information in financial statements. IFRS 18 will have no impact on net profit, however it will change how the Group's results are presented on the consolidated income statement and information disclosed in the notes to the consolidated financial statements. This also includes disclosure of certain non-GAAP measures, which will form part of the audited consolidated financial statements. IFRS 18 introduces a more structured income statement such as a newly defined subtotal for operating profit and a requirement for entities to allocate all income and expenses between three new distinct categories based on the entity’s main business activities (operating, investing, and financing activities). IFRS 18 also requires entities to analyse their operating expenses directly on the income statement, which is either by nature, by function or using a mixed presentation. IFRS 18 also requires entities to report some of their non-GAAP measures in the financial statements. It introduces a narrow definition for management performance measures (MPM) and requires MPMs to be a subtotal of income and expenses that is used in public communications outside of the financial statements and reflective of management’s view of financial performance of an entity as a whole. Management is in the process of assessing the potential impact on the Group's consolidated financial statements. | |
1Effective date refers to annual period beginning on or after said date
2No material impact expected
NOTES TO THE CONSOLIDATED FINANCIAL STATEMENTS continued
For the year ended 31 December 2025
Significant accounting judgements and estimates
The preparation of the consolidated financial statements requires the Group’s management to make estimates and assumptions that
affect the reported amounts of assets and liabilities and disclosure of contingent assets and liabilities at the date of the consolidated
financial statements, and the reported amounts of revenues and expenses during the reporting period. The determination of estimates
requires the exercise of judgement based on various assumptions and other factors such as historical experience, current and expected
economic conditions, and in some cases valuation techniques. Actual results could differ from those estimates.
For material accounting policies that are subject to significant judgement, estimates and assumptions, see the following notes to the
consolidated financial statements:
| |
| Note to the consolidated financial statements |
Unconsolidated structured entities | |
| |
Cash-settled share-based payment obligation | |
Royalties, mining and income tax, and deferred tax | 11 - Royalties, mining and income tax, and deferred tax |
Property, plant and equipment | 14 - Property, plant and equipment |
| |
| 17 - Goodwill and other intangibles |
Equity-accounted investments | 18 - Equity-accounted investments |
| |
Other receivables and other payables | 21 - Other receivables and other payables |
| |
Borrowings and derivative financial instrument | 27 - Borrowings and derivative financial instrument |
Environmental rehabilitation obligation | 29 - Environmental rehabilitation obligation and other provisions |
Occupational healthcare obligation | 30 - Occupational healthcare obligation |
| |
Estimates and judgements are continually evaluated and are based on historical experience and other factors, including expectations of
future events that are believed to be reasonable under the circumstances.
The estimates and assumptions that have a significant risk of causing a material adjustment to the carrying amounts of assets and liabilities
within the financial period are discussed under the relevant note of the item affected.
NOTES TO THE CONSOLIDATED FINANCIAL STATEMENTS continued
For the year ended 31 December 2025
NOTES TO THE CONSOLIDATED FINANCIAL STATEMENTS continued
For the year ended 31 December 2025
1The NCI in the statement of changes in equity at 31 December 2025, relates to the attributable share of accumulated profits of DRDGOLD, Group Technical Security
Management Proprietary Limited (GTSM) and Keliber OY (see note 26)
2Witwatersrand Consolidated Gold Resources Proprietary Limited (Wits Gold) has ceded and pledged its shares in K2013164354 Proprietary Limited (K2013) (a dormant
entity) and K2013 has ceded and pledged it shares in Sibanye Gold Eastern Operations Proprietary Limited (SGEO) in favour of the lenders of the Burnstone Debt (see note
27.6)
3Rand Uranium Proprietary Limited (Rand Uranium) and Ezulwini Mining Company Proprietary Limited (Ezulwini) together own a number of underground and surface mining
operations
4A 26% stake in Sibanye Rustenburg Platinum Mines Proprietary Limited (SRPM) was acquired through Newshelf 1335 Proprietary Limited (B-BBEE SPV) in terms of the
Rustenburg operation transaction, The shareholders of B-BBEE SPV are Rustenburg Mine Employees Trust (30.4%), Rustenburg Mine Community Development Trust (24.8%),
Bakgatla-Ba-Kgafela Investment Holdings (24.8%) and Siyanda Resources Proprietary Limited (20.0%). The Rustenburg Mine Employees Trust and the Rustenburg Mine
Community Development Trust are controlled and consolidated by Sibanye-Stillwater and cash-settled share-based payment obligations amounting to R986 million and
R804 million, respectively, are eliminated upon consolidation. During H2 2023, the sale transaction between Rustenburg Platinum Mines Limited (subsidiary of Anglo
Platinum Mines Limited) and SRPM became effective, which resulted in SRPM assuming full ownership of Kroondal. Following the intercompany transfer of the Kroondal
operations to SRPM in 2025, Kroondal is reported as part of the Rustenburg operation
5The Group has no current or contractual obligation to provide financial support to any of its structured entities
6Sibanye-Stillwater recognises no NCI in Western Platinum Proprietary Limited (WPL) and Eastern Platinum Proprietary Limited (EPL). The shareholding of Lonplats Employee
Share Ownership Trust (Employee Trust) (3.8%,) the Bapo Ba Mogale Local Economic Development Trust (Bapo Trust) (0.9%) and Lonplats Marikana Community
Development Trust (Community Trust) (0.9%) (together Marikana Trusts) is not considered since these trusts are controlled and consolidated by Sibanye-Stillwater. Cash-
settled share-based payment obligations amounting to R905 million relating to the Marikana Trusts are eliminated upon consolidation. In addition, as a result of the
Marikana broad-based black economic empowerment (B-BBEE) transaction (see note 6.4), the equity interests of shareholders in WPL and EPL, including all non-
controlling shareholders, were replaced with the right to receive dividends. As a result, the effective shareholding interests were replaced by a share-based payment
obligation and dividend obligation for entities not forming part of the Group (see note 6.4 and 21.2)
7Sibanye-Stillwater recognises no NCI in Akanani on a similar basis as described for WPL and EPL below (see footnote 6 above), since a revised shareholders' agreement
replaced the equity interests with a right to receive dividends
8The effective shareholding at 31 December 2025 was 50.10% (2024: 50.23% and 2023: 50.28%) after considering treasury shares held by DRDGOLD and new share issues
and subscriptions during 2025 (see note 26.1)
9At 31 December 2025, the Group had a 20% legal interest in Peregrine Metals Limited (Peregrine), as a result of completion of the Initial Earn-in arrangement of 80% by
Aldebaran Resources Inc. (Aldebaran) during 2025 (see note 18.3)
10The Group has a 76% legal interest in the Newshelf 1114 Proprietary Limited (Newshelf 1114) group and the NCI can acquire a further 2% legal shareholding once they
have implemented the necessary funding structure. However, no accounting NCI is recognised, since the NCI’s vendor loan financing exceeds their proportionate
interest in Newshelf 1114 and therefore no effective shareholding exists
11The Group has an effective shareholding of 79.82% (2024: 79.82%, 2023: 79.82%) in Keliber OY at 31 December 2025. Keliber Oy is incorporated in Finland
12The Group acquired a 100% shareholding in the Century on 10 May 2023 and also exercised its option to acquire a 100% shareholding in Copper Mines of Tasmania
Proprietary Limited which owns the Mt Lyell copper mine
13The Group, through Sibanye Reldan Holdco Inc., acquired a 100% shareholding in the Reldan Group of Companies (Reldan) on 15 March 2024 (see note 16.2)
14The Group, through Sibanye Reldan Holdco Inc., acquired a 100% shareholding in Metallix Refining (Metallix) on 4 September 2025 (see note 16.1)
15During 2025, the Group disposed of its interest in Blue Ridge Platinum (Proprietary) Limited
NOTES TO THE CONSOLIDATED FINANCIAL STATEMENTS continued
For the year ended 31 December 2025
Subsidiaries
Subsidiaries are all entities over which the Group exercises control. The Group controls an entity when it is exposed to, or has rights to,
variable returns from its involvement with the entity and has the ability to affect those returns through its power over the entity. Subsidiaries
are consolidated from the date on which control is obtained by the Group until the date on which control ceases. Control is reassessed if
facts and circumstances indicate that there are changes to one or more of the elements of control.
Inter-company transactions, balances and unrealised gains or losses on transactions between Group companies are eliminated on
consolidation. Accounting policies of subsidiaries have been changed where necessary to ensure consistency with the policies adopted by
the Group.
Unconsolidated structured entities
In assessing whether the Group controls a special purpose vehicle (SPV), significant judgements include the extent of the Group's
involvement in the setup and design of the power purchase agreement (PPA) including decisions related to the underlying infrastructure,
whether there is any financial recourse to the Group in relation to financing the SPV or any project-related risk, as well as terms and
conditions of any options to acquire the underlying power generating infrastructure.
During 2023, the Group entered into two substantially similar wind energy power purchase agreements. The PPA is a 89-megawatt (MW)
project entered into by Sibanye Energy Proprietary Limited (Sibanye Energy). This clean energy will be generated by the Castle Wind Farm
(Castle), located near the town of De Aar in the Northern Cape province of South Africa, and will supply the SA operations via a wheeling
agreement with Eskom. Under the terms of the 15-year PPA, Castle is funded, built, and operated by a project consortium. The Group has
an option to acquire the project company or plant at the end of the 15-year PPA in exchange for an additional payment incorporated into
the energy tariff as well as a nominal exercise price. Alternatively, the PPA can be extended for an additional period of five years,
whereafter it can be further extended for a period agreed between the parties. Other than in the event of default on electricity payments
to be made by the Group, there is no recourse to the Group for funding or project-related risk. Castle became operational during Q1 2025.
The Group will pay for all electricity produced based on a pre-determined tariff, adjusted for inflation over the term of the PPA. The
arrangement does not contain any fixed or minimum payments.
The second PPA is the Witberg wind energy project, located near Matjiesfontein in the Western Cape province with a contracted capacity
of 103MW (Witberg), also entered into by Sibanye Energy. The terms of the Witberg PPA are similar to Castle. Witberg will also supply the SA
operations via a wheeling agreement with Eskom. The project cost will be fully funded by Red Rocket, a South African Independent Power
Producer developing the project, together with its lenders. Similar to the Castle project, the Group committed to a 15-year PPA and also
has a purchase option on the same terms as the Castle project. There is also no recourse to the Group, except in the event of electricity
payment default. When Witberg becomes operational, the Group will also pay a pre-determined tariff for electricity produced, adjusted
for inflation over the term of the PPA. Similar to Castle, there are no fixed or minimum payments.
During 2024, Sibanye-Stillwater concluded an additional 140MW wind energy project, the Umsinde Emoyeni Wind Farm, located on the
border between the Northern Cape Province and the Western Cape Province near Murraysburg, South Africa. Commercial operation is
scheduled for Q4 2026. The project will supply Sibanye-Stillwater’s SA operations utilising the national grid through a secured wheeling
agreement with Eskom. Under the terms of a twenty-year PPA with Sibanye-Stillwater, the project will be fully funded by a project
consortium which will build, own and operate the project. The arrangement does not contain any fixed or minimum payments and the
Group does not have an option to purchase the wind farm.
The Group holds no shareholding or voting interest in the project companies and did not provide a guarantee for any of the obligations of
these companies towards their shareholders or funders. Management concluded that the Group does not control the project companies
under IFRS 10 Consolidated Financial Statements (IFRS 10) since it does not have power over the relevant activities as contemplated in IFRS
10. At the reporting date, there were no assets or liabilities recognised by the Group relating to the project companies and no financial or
other support had been provided. There is also no intention to provide financial or other support to the project companies, other than
payment of the electricity tariff in future periods when electricity is produced.
Transactions with shareholders
Transactions with owners in the capacity as equity participants are not recognised in profit or loss, but instead are recognised in equity with
a corresponding change in assets or liabilities. Changes in a parent’s ownership interest in a subsidiary that does not result in the parent
losing control of the subsidiary are equity transactions.
1.4 Foreign currencies
Functional and presentation currency
Items included in the financial statements of each of the Group’s entities are measured using the currency of the primary economic
environment in which the entity operates (the functional currency). The consolidated financial statements are presented in South African
rand (SA rand), which is the Group’s presentation currency.
Transactions and balances
Foreign currency transactions are translated into the functional currency using the exchange rates prevailing at the dates of the
transactions. Monetary assets and liabilities are translated into the functional currency at each reporting date. Foreign exchange gains and
losses resulting from the settlement of such transactions and from the translation of monetary assets and liabilities denominated in foreign
currencies, are recognised in profit or loss.
NOTES TO THE CONSOLIDATED FINANCIAL STATEMENTS continued
For the year ended 31 December 2025
Foreign operations
The results and financial position of all the Group entities that have a functional currency different from the presentation currency are
translated into the presentation currency as follows:
•Assets and liabilities are translated at the exchange rate ruling at the reporting date. Equity items are translated at historical rates. The
income and expenses are translated at the average exchange rate for the year, unless this average is not a reasonable approximation
of the rates prevailing on the transaction dates, in which case these items are translated at the rate prevailing on the date of the
transaction. Exchange differences on translation are accounted for in other comprehensive income and accumulated in the foreign
currency translation reserve (FCTR) in the consolidated statement of changes in equity. These differences are recognised in profit or loss
upon realisation of the underlying operation
•Exchange differences arising from the translation of the net investment in foreign operations, which includes certain long-term
borrowings (i.e. the reporting entity’s interest in the net assets of that operation), are taken to other comprehensive income. When a
foreign operation is sold, exchange differences that were recorded in other comprehensive income are recognised in profit or loss as
part of the gain or loss on disposal. If the Group disposes of part of its interest in a subsidiary but retains control, then the relevant
proportion of the cumulative amount is reattributed to NCI. When the Group disposes of only part of an associate or joint venture while
retaining significant influence or joint control, the relevant proportion of the cumulative amount is reclassified to profit or loss. If a
company in the Group repays a portion of long-term borrowings forming part of a net investment in foreign operations, amounts
previously recorded in other comprehensive income are only recognised in profit or loss upon disposal of the relevant operation. These
amounts are reclassified to profit or loss through OCI, consistent with where the amounts were previously included
•Goodwill and fair value adjustments arising on the acquisition of a foreign operation are treated as assets and liabilities of the foreign
operation and are translated at each reporting date at the closing rate
1.5 Assets and associated liabilities classified as held for sale
During H2 2024, the Group agreed to sell the Beatrix 4 shaft which forms part of the Beatrix gold operations and includes the Beisa uranium
project, to Neo Energy Metals Plc. (Neo Energy). The transaction will allow the Beisa project to be developed by Neo Energy, while Sibanye-
Stillwater will retain exposure to future uranium production. The Beatrix 4 shaft was placed on care and maintenance by Sibanye-Stillwater
in 2023 primarily due to declining gold reserves and a depressed uranium price, which has subsequently recovered. The transaction
includes total consideration of R500 million, comprising R250 million cash and R250 million in newly issued shares in Neo Energy (equalling
approximately 40% shareholding in Neo Energy at the time of signing the sale agreement). The transaction was subject to certain
outstanding conditions precedent at the reporting date, however the assets and liabilities associated with the transaction were classified as
held for sale in accordance with the requirements of IFRS 5 Non-current Assets Held for Sale and Discontinued Operations (IFRS 5). Neo
Energy will assume responsibility for all Beatrix 4 shaft rehabilitation and environmental liabilities, which amounts to a carrying value of
R480 million (2024: R451 million) at 31 December 2025. Property, plant and equipment of R30 million (2024: R30 million) relating to the Beatrix
4 shaft disposal, which is measured at the lower of its carrying value and fair value less cost to sell, is included in assets held for sale at 31
December 2025 and 31 December 2024.
During H1 2025, following the Group's decision to withdraw from the Rhyolite Ridge joint venture agreement, it was decided to sell its
investment in ioneer Limited (ioneer). The Group held 145,862,742 shares in ioneer representing 6.19% of their share capital. At 30 June 2025,
the investment (R164 million) was classified as held for sale in accordance with the requirements of IFRS 5. The sale of ioneer was effective
during H2 2025 with the proceeds on the sale amounting to R186 million. The initial fair value of the investment was R1,134 million when it
was acquired.
During H1 2025, DRDGOLD decided to sell its 50.25% share in Stellar, a renewable energy company developing a solar plant in Limpopo,
South Africa. The decision was based on DRDGOLD's decision to focus on its core operating activities. DRDGOLD's investment in Stellar was
classified as held for sale in accordance with the requirements of IFRS 5. Property, plant and equipment and capital prepayments of
R105 million and other net assets of R6 million was included in assets held for sale. The sale of Stellar was effective during H2 2025 with the
proceeds on the sale amounting to R132 million. At 31 December 2025, no other assets are classified as assets held for sale (2024:
R40 million).
NOTES TO THE CONSOLIDATED FINANCIAL STATEMENTS continued
For the year ended 31 December 2025
2. Segment reporting
|
Accounting Policy Operating segments are reported in a manner consistent with the internal reporting provided to the chief operating decision maker and is based on individual mining operations (operating segments) per geographic area. The chief operating decision maker, who is responsible for allocating resources and assessing performance of the operating segments, has been identified as the executive management team that makes strategic decisions. |
During 2025, management updated the internal financial reporting to the chief operating decision maker by reporting adjusted EBITDA (previously net profit/loss) as the main and only measure of financial performance for operating segments. The Group therefore updated the structure of the segment reporting, including representation of all comparative information, to reflect this change in
internal reporting. See note 27.10 for a reconciliation of profit/(loss) before royalties, carbon tax and tax to adjusted EBITDA.
The table below summarises the segmental information disclosed in note 2.1 and 2.2:
| | | | | | | | | | | | | | | | | | | | | | | | | | | |
| | | |
| | SOUTHERN AFRICA OPERATIONS | INTERNATIONAL AND RECYCLING OPERATIONS | | | SOUTHERN AFRICA OPERATIONS | INTERNATIONAL AND RECYCLING OPERATIONS | | | SOUTHERN AFRICA OPERATIONS | INTERNATIONAL AND RECYCLING OPERATIONS | |
Figures in million – SA rand | | | | | Total internation al operations | | | | | | | | | Total internation al operations | | | | | | | | | Total internation al operations | | | | |
| | | | | | | | | | | | | | | | | | | | | | | | | | | |
| | | | | | | | | | | | | | | | | | | | | | | | | | | |
| | | | | | | | | | | | | | | | | | | | | | | | | | | |
| | | | | | | | | | | | | | | | | | | | | | | | | | | |
Cost of sales, before amortisation and depreciation | | | | | | | | | | | | | | | | | | | | | | | | | | | |
| | | | | | | | | | | | | | | | | | | | | | | | | | | |
| | | | | | | | | | | | | | | | | | | | | | | | | | | |
| | | | | | | | | | | | | | | | | | | | | | | | | | | |
| | | | | | | | | | | | | | | | | | | | | | | | | | | |
| | | | | | | | | | | | | | | | | | | | | | | | | | | |
| | | | | | | | | | | | |
1Group corporate includes items to reconcile segment data to consolidated financial statement totals, such as intercompany eliminations, the Wheaton Stream and Franco-Nevada transactions and mainly includes, corporate tax, interest and transaction costs
NOTES TO THE CONSOLIDATED FINANCIAL STATEMENTS continued
For the year ended 31 December 2025
2.1 SA operations
| | | | | | | | | | | | | |
| | | | |
Figures in million – SA rand | | | | | | | Corporate and reconciling items1 | | | | | | Corporate and reconciling items1 |
| | | | | | | | | | | | | |
| | | | | | | | | | | | | |
| | | | | | | | | | | | | |
| | | | | | | | | | | | | |
| | | | | | | | | | | | | |
Cost of sales, before amortisation and depreciation | | | | | | | | | | | | | |
| | | | | | | | | | | | | |
| | | | | | | | | | | | | |
| | | | | | | | | | | | | |
| | | | | | | | | | | | | |
| | | | | | | | | | | | | |
| | | | | | | | | | | | | |
| | | | | | | | | | | | | |
Sustaining capital expenditure | | | | | | | | | | | | | |
| | | | | | | | | | | | | |
| | | | | | | | | | | | | |
Total capital expenditure | | | | | | | | | | | | | |
| | | | | | | | | | | | | |
The following items are disclosed per segment in accordance with IFRS Accounting Standards |
| | | | | | | | | | | | | |
Cost of sales before amortisation and depreciation consists of the following: | | | | | | | | | | | | | |
| | | | | | | | | | | | | |
| | | | | | | | | | | | | |
| | | | | | | | | | | | | |
| | | | | | | | | | | | | |
| | | | | | | | | | | | | |
| | | | | | | | | | | | | |
Total cost of sales before amortisation and depreciation | | | | | | | | | | | | | |
| | | | | | | | | | | | | |
Amortisation and depreciation | | | | | | | | | | | | | |
| | | | | | | | | | | | | |
(Impairments)/reversal of impairments | | | | | | | | | | | | | |
1Corporate and reconciling items represent the items to reconcile segment data to consolidated financial statement totals, such as intercompany eliminations. This does not represent a
separate segment as it does not generate revenue
NOTES TO THE CONSOLIDATED FINANCIAL STATEMENTS continued
For the year ended 31 December 2025
| | | | | | | | | | | | | | |
| | | | |
Figures in million – SA rand | | | | | | | | Corporate and reconciling items1 | | | | | | Corporate and reconciling items1 |
| | | | | | | | | | | | | | |
| | | | | | | | | | | | | | |
| | | | | | | | | | | | | | |
| | | | | | | | | | | | | | |
| | | | | | | | | | | | | | |
Cost of sales, before amortisation and depreciation2 | | | | | | | | | | | | | | |
| | | | | | | | | | | | | | |
| | | | | | | | | | | | | | |
| | | | | | | | | | | | | | |
| | | | | | | | | | | | | | |
| | | | | | | | | | | | | | |
| | | | | | | | | | | | | | |
| | | | | | | | | | | | | | |
Sustaining capital expenditure | | | | | | | | | | | | | | |
| | | | | | | | | | | | | | |
| | | | | | | | | | | | | | |
Total capital expenditure | | | | | | | | | | | | | | |
| | | | | | | | | | | | | | |
The following items are disclosed per segment in accordance with IFRS Accounting Standards |
| | | | | | | | | | | | | | |
Cost of sales before amortisation and depreciation consists of the following: | | | | | | | | | | | | | | |
| | | | | | | | | | | | | | |
| | | | | | | | | | | | | | |
| | | | | | | | | | | | | | |
| | | | | | | | | | | | | | |
| | | | | | | | | | | | | | |
| | | | | | | | | | | | | | |
Total cost of sales before amortisation and depreciation | | | | | | | | | | | | | | |
| | | | | | | | | | | | | | |
Amortisation and depreciation | | | | | | | | | | | | | | |
| | | | | | | | | | | | | | |
Reversal of impairments/(impairments) | | | | | | | | | | | | | | |
1Corporate and reconciling items represent the items to reconcile segment data to consolidated financial statement totals, such as intercompany eliminations and share of results of
equity-accounted investees after tax. This does not represent a separate segment as it does not generate revenue
2Included in cost of sales, before amortisation and depreciation is total write-down of inventory to net realisable value amounting to R954 million. This write-down mainly relates to PGM
in process and PGM finished goods of R728 million and R185 million, respectively, of which R588 million, R264 million and R61 million relates to Rustenburg, Kroondal and Marikana,
respectively, as a result of the lower commodity price environment
NOTES TO THE CONSOLIDATED FINANCIAL STATEMENTS continued
For the year ended 31 December 2025
| | | | | | | | | | | | | | |
| | | | |
Figures in million – SA rand | | | | | | | | Corporate and reconciling items1 | | | | | | Corporate and reconciling items1 |
| | | | | | | | | | | | | | |
| | | | | | | | | | | | | | |
| | | | | | | | | | | | | | |
| | | | | | | | | | | | | | |
| | | | | | | | | | | | | | |
Cost of sales, before amortisation and depreciation | | | | | | | | | | | | | | |
| | | | | | | | | | | | | | |
| | | | | | | | | | | | | | |
| | | | | | | | | | | | | | |
| | | | | | | | | | | | | | |
| | | | | | | | | | | | | | |
| | | | | | | | | | | | | | |
| | | | | | | | | | | | | | |
Sustaining capital expenditure | | | | | | | | | | | | | | |
| | | | | | | | | | | | | | |
| | | | | | | | | | | | | | |
Total capital expenditure | | | | | | | | | | | | | | |
| | | | | | | | | | | | | | |
The following items are disclosed per segment in accordance with IFRS Accounting Standards |
| | | | | | | | | | | | | | |
Cost of sales before amortisation and depreciation consists of the following: | | | | | | | | | | | | | | |
| | | | | | | | | | | | | | |
| | | | | | | | | | | | | | |
| | | | | | | | | | | | | | |
| | | | | | | | | | | | | | |
| | | | | | | | | | | | | | |
| | | | | | | | | | | | | | |
Total cost of sales before amortisation and depreciation | | | | | | | | | | | | | | |
| | | | | | | | | | | | | | |
Amortisation and depreciation | | | | | | | | | | | | | | |
| | | | | | | | | | | | | | |
| | | | | | | | | | | | | | |
1Corporate and reconciling items represent the items to reconcile segment data to consolidated financial statement totals, such as intercompany eliminations and share of results of
equity-accounted investees after tax. This does not represent a separate segment as it does not generate revenue
NOTES TO THE CONSOLIDATED FINANCIAL STATEMENTS continued
For the year ended 31 December 2025
2.2 International and recycling operations
| | | | | | | | | | | | | |
| | | | | | | | | | | |
Figures in million – SA rand | Total international operations | | | | | | Pennsylvania site and North Carolina site1 | | Sandouville nickel refinery | Corporate and reconciling items2 | | Century zinc retreatment operation | Corporate and reconciling items2 |
| | | | | | | | | | | | | |
| | | | | | | | | | | | | |
| | | | | | | | | | | | | |
| | | | | | | | | | | | | |
| | | | | | | | | | | | | |
Cost of sales, before amortisation and depreciation3 | | | | | | | | | | | | | |
| | | | | | | | | | | | | |
| | | | | | | | | | | | | |
| | | | | | | | | | | | | |
| | | | | | | | | | | | | |
| | | | | | | | | | | | | |
| | | | | | | | | | | | | |
| | | | | | | | | | | | | |
Sustaining capital expenditure | | | | | | | | | | | | | |
| | | | | | | | | | | | | |
| | | | | | | | | | | | | |
Total capital expenditure | | | | | | | | | | | | | |
| | | | | | | | | | | | | |
The following items are disclosed per segment in accordance with IFRS Accounting Standards |
| | | | | | | | | | | | | |
Cost of sales before amortisation and depreciation consists of the following: | | | | | | | | | | | | | |
| | | | | | | | | | | | | |
| | | | | | | | | | | | | |
| | | | | | | | | | | | | |
| | | | | | | | | | | | | |
| | | | | | | | | | | | | |
| | | | | | | | | | | | | |
Total cost of sales before amortisation and depreciation | | | | | | | | | | | | | |
| | | | | | | | | | | | | |
Amortisation and depreciation | | | | | | | | | | | | | |
| | | | | | | | | | | | | |
| | | | | | | | | | | | | |
1Metallix's results are included for the four months ended 31 December 2025 since the effective date of acquisition (see note 16.1)
2Corporate and reconciling items represent the items to reconcile segment data to consolidated financial statement totals. This does not represent a separate segment as it does not
generate revenue. Corporate and reconciling items for total EU operations includes Keliber. The capital expenditure for Keliber relates to expenditure incurred in the course of
construction of the Keliber mine, concentrator and refinery
3Included in cost of sales, before amortisation and depreciation is total write-down of inventory to net realisable value amounting to R1,477 million. This write-down mainly relates to PGM
in process and PGM finished goods of R1,171 million and R306 million, respectively, all relating to the US PGM operations as a result of the lower commodity price environment
NOTES TO THE CONSOLIDATED FINANCIAL STATEMENTS continued
For the year ended 31 December 2025
| | | | | | | | | | | | | |
| | | | | | | | | | | |
Figures in million – SA rand | Total international operations | | | | | | | | Sandouville nickel refinery | Corporate and reconciling items2 | | Century zinc retreatment operation | Corporate and reconciling items2 |
| | | | | | | | | | | | | |
| | | | | | | | | | | | | |
| | | | | | | | | | | | | |
| | | | | | | | | | | | | |
| | | | | | | | | | | | | |
Cost of sales, before amortisation and depreciation3 | | | | | | | | | | | | | |
| | | | | | | | | | | | | |
| | | | | | | | | | | | | |
| | | | | | | | | | | | | |
| | | | | | | | | | | | | |
| | | | | | | | | | | | | |
| | | | | | | | | | | | | |
| | | | | | | | | | | | | |
Sustaining capital expenditure | | | | | | | | | | | | | |
| | | | | | | | | | | | | |
| | | | | | | | | | | | | |
Total capital expenditure | | | | | | | | | | | | | |
The following items are disclosed per segment in accordance with IFRS Accounting Standards |
|
| | | | | | | | | | | | | |
Cost of sales before amortisation and depreciation consists of the following: | | | | | | | | | | | | | |
| | | | | | | | | | | | | |
| | | | | | | | | | | | | |
| | | | | | | | | | | | | |
| | | | | | | | | | | | | |
| | | | | | | | | | | | | |
| | | | | | | | | | | | | |
Total cost of sales before amortisation and depreciation | | | | | | | | | | | | | |
| | | | | | | | | | | | | |
Amortisation and depreciation | | | | | | | | | | | | | |
| | | | | | | | | | | | | |
| | | | | | | | | | | | | |
1Reldan's results are included for the nine and a half months ended 31 December 2024 since the effective date of acquisition (see note 16.2)
2Corporate and reconciling items represent the items to reconcile segment data to consolidated financial statement totals. This does not represent a separate segment as it does not
generate revenue. Corporate and reconciling items for total EU operations includes Keliber
3Included in cost of sales, before amortisation and depreciation is total write-down of inventory to net realisable value amounting to R3,774 million. This write-down mainly relates to PGM
in process and PGM finished goods of R3,115 million and R659 million, respectively, all relating to the US PGM operations, as a result of the lower commodity price environment
NOTES TO THE CONSOLIDATED FINANCIAL STATEMENTS continued
For the year ended 31 December 2025
| | | | | | | | | | |
| | | | | | | | | | |
Figures in million – SA rand | Total international operations | | | | | Sandouville nickel refinery | Corporate and reconciling items1 | | Century zinc retreatment operation | Corporate and reconciling items1 |
| | | | | | | | | | |
| | | | | | | | | | |
| | | | | | | | | | |
| | | | | | | | | | |
| | | | | | | | | | |
Cost of sales, before amortisation and depreciation2 | | | | | | | | | | |
| | | | | | | | | | |
| | | | | | | | | | |
| | | | | | | | | | |
| | | | | | | | | | |
| | | | | | | | | | |
| | | | | | | | | | |
| | | | | | | | | | |
Sustaining capital expenditure | | | | | | | | | | |
| | | | | | | | | | |
| | | | | | | | | | |
Total capital expenditure | | | | | | | | | | |
| | | | | | | | | | |
The following items are disclosed per segment in accordance with IFRS Accounting Standards |
| | | | | | | | | | |
Cost of sales before amortisation and depreciation consists of the following: | | | | | | | | | | |
| | | | | | | | | | |
| | | | | | | | | | |
| | | | | | | | | | |
| | | | | | | | | | |
| | | | | | | | | | |
| | | | | | | | | | |
Total cost of sales before amortisation and depreciation | | | | | | | | | | |
| | | | | | | | | | |
Amortisation and depreciation | | | | | | | | | | |
| | | | | | | | | | |
| | | | | | | | | | |
1Corporate and reconciling items represent the items to reconcile segment data to consolidated financial statement totals. This does not represent a separate segment as it does not
generate revenue. Corporate and reconciling items for total EU operations includes Keliber
2Included in cost of sales, before amortisation and depreciation is total write-down of inventory to net realisable value amounting to R1,374 million. This write-down mainly relates to PGM
in process and PGM finished goods of R996 million and R378 million, respectively, which relates to the US PGM operations as a result of the lower commodity price environment
NOTES TO THE CONSOLIDATED FINANCIAL STATEMENTS continued
For the year ended 31 December 2025
3. Revenue
|
Significant accounting judgements and estimates Revenue from PGM and zinc retreatment mining activities The determination of PGM and zinc concentrate sales revenue from the time of initial recognition of the sale on a provisional basis through to final pricing requires management to continuously re-estimate the fair value of the price adjustment features. Management determines this with reference to estimated forward prices using consensus forecasts. These adjustments are included in revenue as adjustments to sale of PGM and zinc concentrate. Streaming and other forward sale and prepayment transactions Upon entering into a streaming or other forward sale/prepayment transaction, management applies judgement to determine the most appropriate IFRS Accounting Standard applicable to the transaction. This includes an assessment of whether the transaction is revenue, debt, a lease or the disposal of a portion of an operation. In performing this assessment, management also considers whether the transaction will be settled through physical delivery of metals, including metal credits, and whether there are any embedded derivative features to be accounted for separately. Accounting policy Revenue from mining activities Revenue from gold sales is measured and recognised based on the consideration specified in a contract with a customer. The Group recognises revenue from gold sales when the customer obtains control of the gold. These criteria are typically met when the gold is credited to the customer’s bullion account by Rand Refinery Proprietary Limited (Rand Refinery) and in the case of DRDGOLD, when the gold is transferred to the bullion bank and the sales price is fixed per deal confirmation. The transaction price is determined based on the agreed upon market price and number of ounces delivered. Revenue from PGM concentrate and metal sales is recognised when the buyer, pursuant to a sales contract, obtains control of the mined product, which is typically upon delivery. The sales price is determined on a provisional basis at the date of delivery (related to sale of concentrate). Adjustments to the selling price occur based on changes in the metal content quantities and penalties, which represents variable transaction price components, as well as changes in the metal market price up to the date of final pricing. Final pricing is based on the monthly average market price in the month of settlement. For PGM metal sales, pricing is finalised within the month of sale. For PGM concentrate sales, the period between provisional invoicing and final pricing is typically between one and four months. Revenue on provisionally priced sales is initially recognised at the amount of consideration that the Group expects to be entitled to. Revenue from zinc concentrate sales is recognised when the buyer, pursuant to a sales contract, obtains control of the mined product which is typically upon receipt of the bill of lading when the goods are loaded for shipment under Cost, Insurance and Freight (CIF) Incoterms. The sales price is determined on a provisional basis at the date of loading. Adjustments to the selling price occur based on changes in the metal market price up to the date of final pricing. Final pricing is based on the monthly average market price in the month of settlement. For zinc concentrate sales, the period between provisional invoicing and final pricing is typically between one and four months. Revenue on provisionally priced sales is initially recognised at the amount of consideration that the Group expects to be entitled to. The revenue adjustment mechanism relating to changes in metal market prices, embedded within provisionally priced PGM and zinc concentrate sale arrangements, has the characteristics of a commodity derivative. Accordingly, the fair value of the final sales price adjustment is re- estimated continuously and changes in fair value are recognised as an adjustment to revenue in profit or loss and trade receivables in the statement of financial position. In all cases, fair value is determined with reference to estimated forward prices using consensus forecasts. Revenue arising from these price adjustments is disclosed separately from revenue from contracts with customers. Revenue from PGM recycling consists of the sales of recycled palladium, platinum and rhodium derived from spent catalytic material and is recognised when control is transferred, which is when metal is transferred from the Group’s metal account to the third party’s metal account. Revenue from PGM recycling also includes revenue from toll processing, which is recognised at the time the returnable metals are returned to the supplier at a third-party refinery. Revenue from e-scrap recycling consists primarily of the sale of precious metals to customers, typically downstream refiners, in the form of bullion as well as partially refined or refined metals. Sales include low-grade and high-grade precious metals bearing material shipped from the Group's refining facilities to downstream refiners, for which the Group is compensated by either returnable metal and/or cash. The transaction price is determined with reference to market prices of the underlying precious metals, adjusted for refining and other applicable charges where appropriate. In certain arrangements, the Group may receive advance payments from customers prior to final settlement. Where such payments are received before control of the material transfers, the amounts received are recognised as deferred revenue (see note 31). Revenue is recognised when control of the material transfers to the customer at the consideration that the Group expects to be entitled to. In assessing the transfer of control, the Group considers, amongst other factors, the point at which the customer obtains the ability to direct the use of the material and obtain its economic benefits, including whether the Group retains exposure to price fluctuations in the underlying metals and substantive decision-making rights over the ultimate sale of the material. |
NOTES TO THE CONSOLIDATED FINANCIAL STATEMENTS continued
For the year ended 31 December 2025
|
Revenue from sale of other metals produced in Europe, USA and Australia is measured and recognised based on the consideration specified in a contract with a customer. The Group recognises revenue from these metal sales when the customer obtains control of the product, which is typically upon delivery. Streaming revenue The Group enters into long-term metal streaming transactions whereby it receives advance payments as well as additional cash payments for delivery of future ounces to streaming entities, typically over the entire life-of-mine of the operations subject to the stream. These contracts are typically settled by the Group transferring metal credits, representing underlying refined metals, to the streaming entity's metal account. These transactions provide for settlement in physical commodity ounces or metal credits. Each ounce is identified as a separate performance obligation. The transaction price under IFRS 15 Revenue from Contracts with Customers (IFRS 15), being the advance payment (see note 31) and future cash payments to be received, is recognised as revenue each month when the commodity ounces or metal credits are transferred to the streaming entity's account. It is from this date that the streaming entity has effectively accepted the metal, has physical control of the related metal and has the risk and reward of the respective metal (i.e. control has transferred). Revenue is recognised over the life-of-mine of the relevant operations in line with the timing of control transfer discussed above. To the extent that the life-of-mine changes or other key inputs are changed (see note 31), these changes are recognised prospectively as a cumulative catch-up in revenue in the year that the change occurs. Other forward sale and prepayment transactions The Group also enters into other forward sale or prepayment transactions with counterparties in which a cash payment is received in advance for future delivery of metals to the relevant counterparty. Each metal unit is identified as a separate performance obligation. The transaction price under IFRS 15, being the advance payment and further cash payments received, is recognised as revenue when the metals are delivered or credited to the customer’s account and Sibanye-Stillwater no longer has physical control of the metal, which is also when the risk and rewards are transferred (i.e. control has transferred). |
The Group’s sources of revenue are:
| | | |
Figures in million – SA rand | | | |
| | | |
| | | |
| | | |
Nickel refining activities | | | |
| | | |
Zinc retreatment operation2 | | | |
Gold tailings retreatment | | | |
| | | |
Pennsylvania site and North Carolina site recycling activities | | | |
Columbus site recycling activities | | | |
| | | |
| | | |
Total revenue from contracts with customers | | | |
Adjustments relating to sales of PGM concentrate provisional pricing3 | | | |
Adjustments relating to Zinc operation provisional pricing3 | | | |
| | | |
1The difference between revenue from PGM mining activities presented above and total revenue from PGM mining activities presented on the segment
report relates to the separate disclosure of revenue from the gold and palladium streaming arrangement with Wheaton Precious Metals International
(Wheaton International) (Wheaton Stream) and the gold and platinum streaming arrangement with Franco-Nevada (Franco-Nevada stream) in the above.
Revenue relating to the Wheaton Stream and Franco-Nevada stream is incorporated in the Group corporate segment as described in the segment report
(see note 2)
2The difference between revenue from the zinc retreatment operation presented above and total revenue from zinc retreatment operation presented on the
segment report relates to the separate disclosure of revenue related to adjustments on the provisional pricing on zinc sales
3These adjustments relate to provisional pricing arrangements resulting from subsequent changes to the amount of revenue recognised
NOTES TO THE CONSOLIDATED FINANCIAL STATEMENTS continued
For the year ended 31 December 2025
Revenue per geographical region of the relevant operations:
| | | |
Figures in million – SA rand | | | |
| | | |
| | | |
| | | |
| | | |
| | | |
Percentage of revenue per segment based on the geographical location of customers purchasing from the Group
SA Gold
US and SA PGM
NOTES TO THE CONSOLIDATED FINANCIAL STATEMENTS continued
For the year ended 31 December 2025
Nickel refining (Europe)
Zinc retreatment (Australia)
Pennsylvania site and North Carolina site recycling (US)
NOTES TO THE CONSOLIDATED FINANCIAL STATEMENTS continued
For the year ended 31 December 2025
Revenue generated per product:
| | | |
Figures in million – SA rand | | | |
| | | |
| | | |
| | | |
| | | |
| | | |
| | | |
| | | |
| | | |
| | | |
| | | |
| | | |
| | | |
| | | |
1Other primarily includes revenue from cobalt and copper sales
Major customers
The table below illustrates the Group's major customers for the year ended:
| | | | | | | | | |
Figures in million – SA rand | | | |
| | | |
| | | | | | | | | |
US PGM, SA PGM and Pennsylvania site recycling and North Carolina site recycling | | | | | | | | | |
| | | | | | | | | |
| | | | | | | | | |
Market risk
Foreign currency sensitivity
The US, European and Australian regions' revenue (and expenses) are translated from their functional currencies (US dollars, Euros and
Australian dollars, respectively) to the Group’s presentation currency (SA rand) and, therefore, the Group’s “presentation currency”
earnings are sensitive to changes in the exchange rate. A one percentage point change in the SA rand average exchange rate for the
year ended 31 December 2025 of R17.88/US$, R20.17/EUR and R11.52/AUD would have changed profit or loss by approximately R80 million.
NOTES TO THE CONSOLIDATED FINANCIAL STATEMENTS continued
For the year ended 31 December 2025
4. Cost of sales
|
Accounting policy Cost of sales include all costs generally associated with the production of inventory whereas other expenses are disclosed separately or included in other costs. The carrying amount of metal inventory is recognised in cost of sales when the related sale is recognised. The cost of consumable stores is included in cost of sales when consumed. The accounting policy relating to inventory is included in note 23 and amortisation and depreciation in note 14 and note 15. The following accounting policies relate to employee costs that are included in cost of sales: |
Short-term employee benefits Short-term employee benefits are expensed as the related service is provided. A liability is recognised for the amount expected to be paid if the Group has a present legal or constructive obligation to pay this amount as a result of past service provided by the employee and the obligation can be reliably estimated. |
Pension and provident funds The Group operates a defined contribution retirement plan and contributes to a number of industry-based defined contribution retirement plans. The retirement plans are funded by payments from employees and Group companies. Contributions to defined contribution funds are expensed as incurred. Government grants Government grants are recognised once there is reasonable assurance that the Group will comply with the conditions attached to them and the grant will be received. For government grants compensating for expenditure incurred by the Group, the related expense is presented net of the grant income. |
| | | | |
Figures in million – SA rand | | | | |
| | | | |
| | | | |
| | | | |
| | | | |
| | | | |
Section 45X credit (relating to 2023 and 2024) | | | | |
Section 45X credit (relating to 2025 primary mining) | | | | |
Section 45X credit (relating to 2025 recycling) | | | | |
| | | | |
Ore reserve development costs capitalised | | | | |
Cost of sales, before amortisation and depreciation2 | | | | |
Amortisation and depreciation | | | | |
| | | | |
1Recycling cost consists of cost relating to the purchasing of spent catalytic material and the cost incurred to convert the spent catalytic material into finished PGMs.
Recycling costs also includes the purchase of electronic waste and other materials and the cost to convert the waste and materials into finished product at the
Pennsylvania and North Carolina recycling sites
2Included in cost of sales, before amortisation and depreciation for the year ended 31 December 2025 is total write-down of inventory to net realisable value amounting to
R1,477 million (2024: R4,784 million and 2023: R1,694 million). The write-down mainly relates to PGM in process and PGM finished goods of R1,171 million (2024: R3,843 million,
2023: R1,179 million) and R306 million (2024: R844 million, 2023: R423 million), respectively, as a result of the lower commodity prices during specific months
The SA and European operations' employees are members of various defined contribution retirement plans. The cost of providing
retirement benefits for the year amounted to R1,769 million (2024: R1,774 million and 2023: R1,752 million).
Section 45X Advance Manufacturing Production Credit
The US PGM operations qualifies for an Advanced Manufacturing Production credit amount, equal to 10 percent of the costs incurred with
respect to production of certain qualifying critical minerals under the Inflation Reduction Act (IRA) in the US, more specifically the Section
45X Advanced Manufacturing Production (“AMP”) credit. Due to the fact that the US PGM operations outsources the purification of
platinum, palladium and rhodium to an unrelated third party refinery, it is required that the US PGM operations must enter into an
agreement with the third party that identifies the US PGM operations as the sole party that may claim the credit and both the third party
and the US PGM operations signs a certification statement reflecting this agreement.
During June 2025, the certification statements relating to the 31 December 2023 and 31 December 2024 financial years were signed by the
US PGM operations and the third party refinery. The refining agreement was also amended to address the certification for the remainder of
the contract period. Accordingly, R2,472 million and R1,931 million were recognised as income during the year ended 31 December 2025,
but in respect of the 2023 and 2024 Section 45X credits, respectively. The related receivable is included in other receivables on the
consolidated statement of financial position. The Section 45X credits for 2023 amounted to R1,245 million and R1,227 million for primary
NOTES TO THE CONSOLIDATED FINANCIAL STATEMENTS continued
For the year ended 31 December 2025
mining operations (underground mining) and recycling operations, respectively, and the Section 45X credits for 2024 amounted to
R1,220 million and R711 million for primary mining operations and recycling operations, respectively.
5. Interest income and finance expense
|
Accounting policy Interest income comprises interest income on cash deposits, rehabilitation obligation funds, the S45X grant receivable, the right of recovery asset and other assets. Interest income is recognised using the effective interest method. Interest income on funds specifically borrowed for the purpose of constructing a qualifying asset is offset against the related interest expense capitalised to the relevant item. Finance expense comprises interest on borrowings, lease liabilities, environmental rehabilitation obligation, occupational healthcare obligation, deferred payment, deferred revenue, deferred consideration, Marikana dividend obligation and other interest and is offset by borrowing costs capitalised on qualifying assets where applicable. Interest payable on borrowings is recognised in profit or loss over the term of the borrowings using the effective interest method. Cash flows from interest paid are classified under operating activities in the statement of cash flows. The difference between interest income and finance expense in this note and the statement of cash flows is due to the exclusion of the non-cash items. |
5.1 Interest income
| | | | |
Figures in million – SA rand | | | | |
Interest received on cash deposits | | | | |
Interest received on rehabilitation obligation funds | | | | |
| | | | |
Interest on right of recovery asset | | | | |
| | | | |
| | | |
5.2 Finance expense
| | | | |
Figures in million – SA rand | | | | |
| | | | |
| | | | |
Borrowings (unwinding of amortised cost) | | | | |
| | | | |
Environmental rehabilitation obligation | | | | |
Occupational healthcare obligation | | | | |
Deferred payment (related to the Rustenburg operation acquisition) | | | | |
| | | | |
Deferred consideration (related to Pandora acquisition) | | | | |
Marikana dividend obligation | | | | |
| | | | |
| | | |
1For the year ended 31 December 2025, interest expense includes non-cash interest of R993 million (2024: R291 million, 2023: R299 million) relating to the Wheaton Stream
and from 2025, also the Franco-Nevada Stream. Although there is no cash financing cost related to these arrangements, IFRS 15 requires the Group to recognise a
notional financing charge due to the significant time delay between receiving the upfront streaming payment and satisfying the related performance obligations (see
note 31 for more information relating to the streaming transactions)
Net interest paid
The table below provides a summary of the cash interest paid and received:
| | | | |
Figures in million – SA rand | | | | |
| | | | |
| | | | |
| | | |
1Interest paid primarily consist of accrued interest paid on borrowed funds (see note 27) and lease liabilities
2Interest received primarily consists of interest on cash deposits
NOTES TO THE CONSOLIDATED FINANCIAL STATEMENTS continued
For the year ended 31 December 2025
6. Share-based payments
|
Significant accounting judgements and estimates For cash-settled share-based payment instruments issued to B-BBEE shareholders, the measurement of the share-based payment obligations depend on various key inputs. These include estimates of future cash flows, which depend on inputs such as production profiles, future metal prices, exchange rates, loan repayments as well as estimates of appropriate discount rates. The valuations relating to the Group's cash-settled compensation plans make use of inputs such as the Sibanye-Stillwater share price and volatility estimates, risk free interest rates and dividend yields. Changes in key inputs may result in changes in the recognised share-based payment obligations and are therefore regarded as significant judgements and estimates. Accounting policy Cash-settled share-based payments The Group operates cash-settled compensation plans in which certain employees of the Group participate. These awards entitle the participants to cash payments based on a relevant share price. The fair value of the cash-settled instruments is measured by reference to the fair value of the underlying shares using appropriate valuation models and assumptions, taking into account the terms and conditions upon which the instruments were granted. The fair value of the cash-settled instruments is recognised as share-based payment expenses over the vesting period based on the Group’s estimate of the number of instruments that will eventually vest, with a corresponding increase in the share-based payment obligation. At each reporting date, the obligation is remeasured to the fair value of the instruments, to reflect the potential outflow of cash resources to settle the liability, with a corresponding adjustment to the share-based payment expense. Vesting assumptions for service and non-market performance conditions are reviewed at each reporting date to ensure they reflect current expectations. The Group also issued cash-settled instruments to B-BBEE shareholders in terms of the Rustenburg operation B-BBEE transaction (see note 6.3) and the Marikana B-BBEE transaction (see note 6.4). The fair value of these instruments are determined using appropriate valuation models and assumptions, taking into account the terms and conditions upon which the instruments were granted. At each reporting date, the obligation is remeasured to the fair value of the instruments, to reflect the potential outflow of cash resources to settle the liability. There are no vesting conditions and fair value changes are recognised as part of gains or losses on financial instruments in profit or loss. Equity-settled share-based payments In prior periods, the Group operated equity-settled compensation plans in which certain employees of the Group participated. These plans have subsequently been amended to cash-settled schemes, except for the DRDGOLD equity-settled scheme, as outlined in note 6.2. The fair value of DRDGOLD’s equity-settled instruments is measured by reference to the fair value of the relevant equity instruments granted, taking into account the terms and conditions upon which those equity-settled instruments were granted. The fair value of DRDGOLD’s equity-settled instruments granted is estimated using appropriate valuation models and appropriate assumptions at the grant date. Service and non-market performance conditions are not taken into account when estimating the fair value of the equity- settled instruments at grant date. Market conditions are taken into account in determining the fair value at grant date. The grant date fair value of the equity-settled instruments is recognised as share-based payment expenses over the vesting period based on the DRDGOLD’s estimate of the number of instruments that will eventually vest, with a corresponding increase in the share-based payment reserve. Vesting assumptions for service and non-market performance conditions are reviewed at each reporting date until vesting to ensure they reflect current expectations. Modifications to share-based payment schemes Where the terms of an equity-settled or a cash-settled award are modified, the originally determined expense is recognised as if the terms had not been modified. In addition, an expense is recognised for any modification, which increases the total fair value of the share- based payment arrangement, or is otherwise beneficial to the participant as measured at the date of the modification. |
6.1 Cash-settled share-based payments — Sibanye-Stillwater
2020 Share Plan
From the March 2020 remuneration cycle, long-term incentive awards are made on a cash-settled basis rather than equity-settled
(excluding DRDGOLD). This includes awards of both Forfeitable Share Units (FSUs) and Conditional Share Units (CSUs). The last awards issued
under the 2020 Share Plan, vested in 2024.
FSUs
The Remuneration Committee approved an annual award of FSUs to eligible participants as a share-based component of the short-term
incentive scheme. Annual FSU awards are granted to each eligible participant in March, valued at two-thirds of the cash Short-Term
Incentive (STI) paid in respect of the preceding incentive cycle for Vice President (VP) levels and above. The number of FSUs awarded is
determined by dividing the monetary value by the three-day volume-weighted average price (VWAP) of a Sibanye-Stillwater share listed
on the Johannesburg Stock Exchange (for South African participants), or the three-day VWAP of the Group’s American Depositary Shares
(ADS) listed on the New York Stock Exchange (for United States participants) calculated immediately preceding the award date. For
participants employed in other jurisdictions, the award value is converted into South African rand using a representative exchange rate for
the three trading days preceding the award date before applying the relevant VWAP. FSUs vest in two equal tranches, nine months and 18
months after the award date and have the right to receive dividend equivalents.
NOTES TO THE CONSOLIDATED FINANCIAL STATEMENTS continued
For the year ended 31 December 2025
CSUs
The Remuneration Committee also approved an annual award of CSUs to eligible participants as part of its long-term incentive (LTI)
scheme. The value of each CSU award is determined with reference to the participant’s deemed guaranteed remuneration, applicable LTI
participation percentage (linked to job grade) and an individual performance modifier based on the preceding year’s assessed
performance rating. The number of CSUs awarded is calculated by dividing this award value by the three-day VWAP immediately
preceding the award date of Sibanye-Stillwater’s ordinary share listed on the JSE (for South African participants), or the ADS listed on the
New York Stock Exchange (for United States participants). For participants employed in other jurisdictions, the award value is converted into
South African rand using a representative exchange rate for the three trading days preceding the award date before applying the
relevant VWAP. The vesting of CSU awards under the 2020 Share Plan were subject to performance conditions as approved by the
Remuneration Committee. In particular, the number of cash-settled shares that vested depended on the extent to which Sibanye-Stillwater
performed over the intervening three-year period relative to two performance criteria, being a market vesting condition referred to as the
Total Shareholder Return (TSR), and a non-market vesting condition, the Return on Capital Employed (ROCE). In addition, at the sole
discretion of the Remuneration Committee, up to 20% of the determined number of vested shares using the two performance criteria was
liable to forfeiture in the event of any extreme environmental, social, and governance (ESG) incidents occurring during the vesting period.
The TSR and ROCE performance conditions for CSUs under the 2020 Share Plan are summarised below.
Total Shareholder Return (TSR) — 70% Weighting
The TSR performance condition was measured against a benchmark of eight peer group mining and resource companies that were
deemed to collectively represent an alternative investment portfolio for Sibanye-Stillwater’s shareholders (Peer Group). The Peer Group
comprised similar market capitalisation companies that were reflective of the expected positioning of Sibanye-Stillwater over the medium
term as a value driven multi-commodity resources company with a specific focus on gold and platinum.
The Peer Group for the 2020 Share Plan was as follows:
|
Peer group companies for TSR comparison |
AngloGold Ashanti Limited |
Anglo American Platinum Limited (now known as Valterra Platinum Limited) |
|
Impala Platinum Holdings Limited |
|
|
Harmony Gold Mining Company Limited |
African Rainbow Minerals Limited |
Sibanye-Stillwater’s TSR over the vesting period was compared with the Peer Group TSR curve constructed on a market capitalisation
weighted basis. The annualised TSR over the vesting period (TSRANN) was determined for each of the companies in the Peer Group. The Peer
Group companies were sorted from lowest to highest TSRANN. The average market capitalisation based on daily closing price was
determined for each company, and each peer company was assigned its proportion of the overall average market capitalisation of the
Peer Group. The peer company TSR curve was plotted at the midpoint of each company’s percentage of Peer Group market
capitalisation on a cumulative basis above the worst performing companies in the Peer Group. In the event that one or more of the Peer
Group companies became ineligible for comparison, the curve would be based on the companies remaining in the Peer Group.
The cumulative position of Sibanye-Stillwater’s TSRANN was then mapped onto the TSR curve for the Peer Group to determine the percentile
at which Sibanye-Stillwater performed over the vesting period. The performance curve that governed vesting is set out in the table below
with linear interpolation applied between the indicated levels.
| |
TSR element of performance conditions Percentile on peer group TSR curve | |
| |
| |
| |
| |
| |
| |
| |
| |
| |
| |
| |
NOTES TO THE CONSOLIDATED FINANCIAL STATEMENTS continued
For the year ended 31 December 2025
Return On Capital Employed (ROCE) — 30% Weighting
ROCE is a profitability metric that measures how efficiently a company generated profits from its capital employed. For Sibanye-Stillwater,
ROCE was evaluated against the company’s cost of equity (Ke). A minimum threshold on the performance scale for ROCE was set as
equalling Ke, which would lead to the ROCE element contributing 0% towards the performance condition. Delivering a return that exceeds
Ke by 6% or more would be regarded as a superior return representing the maximum 100% on the performance scale and full vesting in
respect of the ROCE element. The performance curve that governed vesting is set out in the table below, with linear interpolation between
the indicated levels.
| |
ROCE element of performance condition Annual ROCE | |
| |
| |
| |
| |
| |
| |
| |
The overall vesting was determined by applying the TSR performance condition to 70% of awarded shares element and the ROCE
performance condition to 30% of awarded shares – plus any further discretionary reduction in the award based on the Remuneration
Committee’s judgement regarding ESG matters mentioned above.
2021 to 2025 Share Plans
Revisions were introduced to cash-settled awards from the March 2021 remuneration cycle for new awards granted (2021 Share Plan). The
2021 Share Plan was similar to the 2020 Share Plan as it remained cash-settled, consisted of FSU and CSU awards and had the same service
conditions as the 2020 Share Plan. The last awards issued under the 2021 Share Plan, vested during 2025.
The key revisions in the 2021 Share Plan included:
•an updated peer company group
•changes in the assessment of the TSR performance condition, now referred to as a relative TSR (rTSR)
•introduction of an ESG performance condition and a change from return on capital employed (ROCE) to a return on invested capital
(ROIC) performance condition
•the weighting of the performance conditions for the rTSR, ESG and ROIC measures are 50%, 20% and 30%, respectively
•the performance conditions also have super-stretch targets that could result in vesting of up to 250% of the relevant weighting
depending on the target achieved
NOTES TO THE CONSOLIDATED FINANCIAL STATEMENTS continued
For the year ended 31 December 2025
The key terms of each performance condition relating to the 2021 Share Plan are as follows:
•rTSR: The performance condition is similar to the 2020 Share Plan, except that it is measured on a weighted average basis following an
index-like approach. Both platinum and gold companies are included in the peer group and performance is measured over the three-
year measurement period. In selecting the appropriate peer companies, factors such as market capitalisation, geographical exposure,
listing on multiple exchanges as well as gold and platinum commodity exposure are considered
•ROIC: Like ROCE, ROIC is a capital efficiency measure which calculates how efficiently the Group allocates its controllable capital to
profitable investments. It provides an indication of the Group’s quality of earnings with reference to the risk categorisation of its
underlying asset portfolio. ROIC is calculated on an annualised basis over the three-year vesting period as net operating profit after tax
divided by invested capital, which is defined as total assets less current liabilities less cash
•ESG: Performance is assessed over the three-year performance period using an ESG scorecard, applicable to each year of the
performance period. The outcome of the performance condition on vesting is determined as the average performance over the three
years
Further revisions were introduced to new cash-settled awards granted from the March 2022 remuneration cycle (2022 Share Plan). The 2022
Share Plan is similar to the 2021 Share Plan. Key revisions included the replacement of the ESG override with additional malus and clawback
triggers and the deferral of the settlement of FSU dividend equivalents until vesting. In addition, for CSU awards, trailing years were phased
into the performance period with awards in 2022 having one trailing year for measurement purposes, which increased to two trailing years
from the 2023 award cycle. For example, performance conditions relating to the 2022 award cycle included 2021, 2022, 2023 and 2024 as
the performance period to measure the value of the awards upon vesting.
The 2023 to 2025 Share Plans are similar to the 2022 Share Plan, with key revisions such as FSU dividend equivalents no longer being deferred,
the share price used for making the awards changing from three-day VWAP to thirty-day VWAP as listed on the JSE and the NYSE
respectively, immediately preceding the award date and the introduction of a volatility adjustment to the VWAP used for making awards
and determining the settlement value of awards. The volatility adjustment incorporates a cap and floor price, which is to be applied to the
relevant VWAP and is calculated as 1.5 standard deviations in the average closing share prices over a trailing two hundred-day period.
From 2024, E-band employees, other than VPs and above, also receive FSU awards based on one third of their STIs paid in respect of the
preceding incentive cycle. The vesting conditions applied to these awards are the same as other FSUs, however the awards are not eligible
for dividend equivalent payments.
Minimum Shareholding Requirement Plan
The Minimum Shareholding Requirement Plan (MSR Plan) is aimed at encouraging executive leadership and senior management (Senior
Vice President level and above) to have personal exposure to the Group’s share price through the holding of shares and/or ADSs in the
Group, thus reinforcing the alignment to shareholder interests. The MSR Plan will reward commitment of personal shares through the award
of Matching Share Units (MSUs).
To qualify for the award of MSUs, participants must achieve the target minimum shareholding of between 100% and 200% of their deemed
guaranteed remuneration expressed in shares and/or ADSs. The target minimum shareholding must be satisfied through committed shares.
Each committed share qualifies for one MSU once the target minimum shareholding is reached (1:1 ratio). Other than the requirement to
hold committed shares for the vesting period, the MSR Plan has the same terms as the 2022 to 2025 Share Plans. With effect from 1 April
2024, the MSR Plan ceased admitting new participants. Existing participants retain the five-year period to build up to the target minimum
shareholding, after which they may qualify for an award of MSUs based on their committed shareholding.
Total Shareholder Return (rTSR) — 50% Weighting
The peer companies under the 2021 to 2025 Share Plans and MSR Plan relating to the rTSR performance condition are as follows:
|
Peer group companies for rTSR comparison |
AngloGold Ashanti Limited |
Valterra Platinum Limited (previously Anglo American Platinum Limited) |
|
Impala Platinum Holdings Limited |
|
|
Harmony Gold Mining Company Limited |
|
NOTES TO THE CONSOLIDATED FINANCIAL STATEMENTS continued
For the year ended 31 December 2025
Awards granted, exercised and forfeited under the 2020 Share Plan
| | | | | | |
| | |
| | | | | | |
| | | Outstanding at beginning of the year | | | |
| | | Movement during the year: | | | |
| | | | | | |
| | | | | | |
| | | Outstanding at end of the year | | | |
Awards granted, exercised and forfeited under the 2021 Share Plan
| | | | | | |
| | |
| | | | | | |
| | | Outstanding at beginning of the year | | | |
| | | Movement during the year: | | | |
| | | | | | |
| | | | | | |
| | | | | | |
| | | Outstanding at end of the year | | | |
Awards granted, exercised and forfeited under the 2022 Share Plan and the MSR plan
| | | | | | |
Conditional and matching Share Units1 | | |
| | | | | | |
| | | Outstanding at beginning of the year | | | |
| | | Movement during the year: | | | |
| | | | | | |
| | | | | | |
| | | | | | |
| | | Outstanding at end of the year | | | |
1Includes matching share units under the MSR plan with effect from the March 2022 remuneration cycle
Awards granted, exercised and forfeited under the 2023 Share Plan and the MSR plan
| | | | | | |
Conditional and matching Share Units1 | | |
| | | | | | |
| | | Outstanding at beginning of the year | | | |
| | | Movement during the year: | | | |
| | | | | | |
| | | | | | |
| | | | | | |
| | | Outstanding at end of the year | | | |
1Includes matching share units under the MSR plan with effect from the March 2023 remuneration cycle
NOTES TO THE CONSOLIDATED FINANCIAL STATEMENTS continued
For the year ended 31 December 2025
Awards granted, exercised and forfeited under the 2024 Share Plan and the MSR plan
| | | | | | |
Conditional and Matching Share Units1 | | |
| | | | | | |
| | | Outstanding at beginning of the year | | | |
| | | Movement during the year: | | | |
| | | | | | |
| | | | | | |
| | | | | | |
| | | Outstanding at end of the year | | | |
1Includes matching share units under the MSR plan with effect from the March 2024 remuneration cycle
Awards granted, exercised and forfeited under the 2025 Share Plan and the MSR plan
| | | | | | |
Conditional and Matching Share Units1 | | |
| | | | | | |
| | | Outstanding at beginning of the year | | | |
| | | Movement during the year: | | | |
| | | | | | |
| | | | | | |
| | | | | | |
| | | Outstanding at end of the year | | | |
1Includes matching share units under the MSR plan with effect from the March 2025 remuneration cycle
Valuation model and inputs
At each reporting date, vesting date and settlement date, the liability for the cash payment relating to the FSUs, CSUs and MSUs awarded is
measured/remeasured at fair value. A Monte Carlo Simulation model is used to value cash-settled share-based payment awards. The
inputs to the valuation model for share awards granted were as follows:
| | | | | | |
Conditional and Matching Share Units | | |
| | | | | | |
| | | Weighted average historical volatility1 % | | | |
| | | | | | |
| | | Expected dividend yield (US/SA) % | | | |
| | | Risk-free interest rate (US/SA) % | | | |
| | | Weighted average share price (ADSs/JSE) | | | |
| | | Weighted average fair value (SA rand) | | | |
1Based on a statistical analysis of the share price on a weighted moving average basis for the expected term of the option
NOTES TO THE CONSOLIDATED FINANCIAL STATEMENTS continued
For the year ended 31 December 2025
Directors' and prescribed officers’ cash-settled instruments
The directors and prescribed officers of Sibanye-Stillwater held the following cash-settled instruments as at 31 December 2025:
| | | | | | | |
| | | Cash-settled instruments vested during the year | | |
| | | | | | | |
| | | | | | | |
| | | | | | | |
| | | | | | | |
| | | | | | | |
| | | | | | | |
| | | | | | | |
| | | | | | | |
| | | | | | | |
| | | | | | | |
| | | | | | | |
| | | | | | | |
| | | | | | | |
| | | | | | | |
| | | | | | | |
1Amounts represents pre-tax earnings paid to participants. For South African participants, these amounts were calculated by taking the Company’s VWAP share price on
vesting date multiplied by the number of vested units
2Numbers include ADSs and JSE listed shares as a result of the dual service contract
3The balance at 31 December 2024 includes instruments prior to appointment as a prescribed officer on 1 July 2025
6.2 Equity-settled share-based payments - DRDGOLD
On 2 December 2019, the shareholders of DRDGOLD approved an equity-settled long-term incentive scheme (DRDGOLD ELTI Scheme).
Under the DRDGOLD ELTI Scheme, qualifying employees are awarded conditional shares on an annual basis, comprising performance
shares (80% of the total conditional shares awarded) and retention shares (20% of the total conditional shares awarded). Conditional shares
will vest three years after grant date and will be settled in the form of DRDGOLD shares at a zero-exercise price. The last grant in terms of
the DRDGOLD ELTI Scheme was made on 22 October 2024 which will vest in October 2027.
The key conditions are as follows:
•Retention shares: 100% of the retention shares will vest if the employee remains in the employ of DRDGOLD at vesting date, is not under
notice period and individual performance criteria are met.
•Performance shares: 50% of the performance shares vests based on the total shareholder return measured against a hurdle rate of 15%
referencing DRDGOLD's weighted average cost of capital and 50% vests based on total shareholder return measured against peer
group companies.
The DRDGOLD ELTI Scheme is replaced by the Single Incentive Plan ("DRDGOLD SIP"), incorporating the Deferred Share Plan ("DRDGOLD
DSP"), which was approved by the shareholders on 29 November 2023. The first grant under the DRDGOLD DSP was made on 13 August
2025.
The DRDGOLD SIP comprises a cash payment (short-term incentive component) and a deferred share award (long-term incentive
component). Deferred Shares granted are registered in the name of the participant, the vesting of which is subject to continued
employment with the company (Employment Condition) until the vesting date. Deferred Shares vest over five years at 20% per annum for F-
band participants and over three years at 33% per annum for E and D band participants. Dividends declared on shares granted per the
DRDGOLD DSP accrue and are paid to the employees.
6.3 Cash-settled share-based payments — Rustenburg B-BBEE transaction
In terms of the Rustenburg operation transaction, a 26% equity stake in SRPM was acquired by B-BBEE SPV (the Rustenburg B-BBEE
Transaction) by a vendor financed facility from Sibanye Platinum Proprietary Limited (Sibanye Platinum), on the following terms:
•Interest at up to 0.2% above Sibanye-Stillwater’s highest cost of debt. Once the capped amount is reached, interest ceases to accrue
so that the capped amount is not exceeded. However, once the facility reduces below R3.5bn, interest starts to accrue again
•Post payment of the annual deferred payment to Rustenburg Platinum Mines Limited (RPM) and in respect of any repayment by SRPM
of shareholder loans or the distribution of dividends, 74% will be paid to Sibanye Platinum and 26% to B-BBEE SPV
•Of the 26% payment to B-BBEE SPV, 85% will be used to service the facility owing by B-BBEE SPV to Sibanye Platinum
•The remaining 15% of any such payment or 100%, once the facility owing by B-BBEE SPV to Sibanye Platinum is repaid, will be declared
by B-BBEE SPV as a dividend to the B-BBEE SPV shareholders
•The facility was capped at R3,500 million (fully settled by the dividend payment made by SRPM in H1 2023)
NOTES TO THE CONSOLIDATED FINANCIAL STATEMENTS continued
For the year ended 31 December 2025
On 31 January 2025, the Group entered into an amalgamation transaction, whereby the assets of Kroondal Operations Proprietary Limited
(Kroondal) were transferred to SRPM in exchange for SRPM assuming the liabilities of Kroondal. Since 26% of SRPM is held by B-BBEE parties
through the B-BBEE SPV, the transfer of Kroondal’s net assets to SRPM resulted in a value increase for the relevant B-BBEE parties. In order to
fund the additional value attributable to the B-BBEE parties, Sibanye Platinum, being the holding company of SRPM, subscribed for new
class B preference shares in the B-BBEE SPV at a nominal subscription price of R100. Until the payment of a capped preference dividend of
R350 million, the lesser of 85% of any dividends paid by SRPM and R175 million will be paid as preference dividends by the B-BBEE SPV,
whereafter the preference shares will be fully redeemed. The capped preference dividend of R350 million increases annually based on an
agreed rate.
The IFRS 2 expense is based on 44.8% of the 26% interest relating to Bakgatla-Ba-Kgafela Investment Holdings and Siyanda Resources
Proprietary Limited, as the Rustenburg Mine Community Trust and Rustenburg Mine Employees Trust are controlled and consolidated by
Sibanye-Stillwater. Cash-settled share-based payment obligations to the Rustenburg Mine Community Trust and Rustenburg Mine
Employees Trust amounting to R804 million (2024: R705 million and 2023: R1,365 million) and R986 million (2024: R864 million and 2023:
R1,673 million), respectively, are eliminated upon consolidation. The calculation of the expense and obligation relating to 44.8% of the 26%
interest is based on the expected discounted future cash flows of the expected PGM reserves and costs to extract the PGMs.
6.4 Cash-settled share-based payments — Marikana B-BBEE transaction
Effective 13 April 2021, the Group restructured the previously highly indebted Lonmin Limited (changed to Sibanye UK Limited on 25 March
2021) B-BBEE structure in relation to WPL and EPL (collectively referred to as “Marikana”), so as to ensure the sustainability of the B-BBEE
shareholding in Marikana and facilitate the realisation of value to the B-BBEE shareholders (Restructuring Transaction).
The Restructuring Transaction resulted in the cancellation of the previous preference share funding provided to a special purpose vehicle
(Phembani SPV) held by the Phembani Group Proprietary Limited group (Phembani Group). As replacement, the Group subscribed for new
preference shares at a nominal amount in Phembani SPV. These preference shares will earn dividends capped to R2.6 billion and will be
funded through 90% of the dividends attributable to the Phembani Group as and when paid by Marikana. In addition, while the Sibanye UK
Limited (Sibanye UK) loans to WPL are still outstanding, REO will subscribe for additional preference shares as an additional funding
mechanism to ensure Phembani SPV receives a minimum level of cash flows (as determined in terms of a formula).
The new arrangement provides the Marikana shareholders with access to distributable Marikana profits in the short and medium term
through the introduction of a 10% trickle dividend while any Marikana shareholder loans or loans from Sibanye UK to WPL are outstanding.
Once the loans from Sibanye UK have been settled and while there are no Marikana shareholder loans outstanding, the Marikana
shareholders will have a right to participate fully in their attributable portion of Marikana’s dividends over the remaining life-of-mine.
However, a 90% portion of the Phembani Group’s attributable dividends will continue to be applied against the preference dividends until
the preference shares have been redeemed.
The obligations to pay dividends to entities controlled by the Group, being REO and the Marikana Trusts, eliminate on consolidation.
Cash-settled share-based payment obligations amounting to R905 million (2024: R631 million and 2023: R1,481 million) relating to the
Marikana Trusts are eliminated upon consolidation.
Marikana’s obligation to pay dividends to the Phembani Group through an intermediate company holding structure, is recognised as a
cash-settled share-based payment liability measured at fair value. Changes in fair value is recognised in profit or loss.
The following assumptions were applied in the 31 December 2025 calculation:
| | | | |
| | | | |
Long-term PGM (4E) basket price | | | | |
Real discount rate — South Africa | | | | |
Inflation rate — South Africa | | | | |
| | | | |
NOTES TO THE CONSOLIDATED FINANCIAL STATEMENTS continued
For the year ended 31 December 2025
6.5 Cash-settled share-based payment obligations
The following table shows a reconciliation of the total cash-settled share-based payment obligation of the Group for the year ended 31
December 2025:
| | | | |
Figures in million – SA rand | | | | |
Reconciliation of the cash-settled share-based payment obligations | | | | |
Balance at beginning of the year | | | | |
Share-based payment obligation on acquisition of subsidiary | | | | |
Derecognition with deemed disposal of interest in joint operation | | | | |
Cash-settled share-based payments expense1 | | | | |
Cash-settled share-based payments expense capitalised | | | | |
Fair value loss/(gain) on obligations2 | | | | |
Cash-settled share-based payments paid3 | | | | |
Foreign currency translation | | | | |
Balance at end of the year | | | | |
Reconciliation of the cash-settled share-based payment obligations in the Group | | | | |
Cash-settled share-based payment — Rustenburg B-BBEE transaction | | | | |
Cash-settled share-based payment — Marikana B-BBEE transaction | | | | |
Cash-settled share-based payment — Employee incentive schemes | | | | |
Balance at end of the year | | | | |
Current portion of cash-settled share-based payment obligations | | | | |
Non-current portion of cash-settled share-based payment obligations | | | | |
1Included in the amount is a cash-settled share-based payment expense for the year ended 31 December 2025 relating to the 2021 to 2025 and MSR Share Plans
amounting to R2,074 million (2024: R224 million relating to the 2020 to 2024 and MSR Share Plans, 2023: R88 million relating to the 2020 to 2023 and MSR Share Plans)
2The fair value loss relates to the Rustenburg and Marikana B-BBEE transactions amounting to a loss of R167 million (2024: gain of R649 million, 2023: gain of R346 million) and
a loss of R253 million (2024: gain of R165 million, 2023: gain of R1,243 million), respectively, and is included in the loss/gain on financial instruments in profit or loss
3Payments made during the year relate to vesting of cash-settled awards to employees and payments made on the Rustenburg and Marikana B-BBEE transactions
6.6 Share-based payment expenses
Share based payment expenses for the year consisted of the following:
| | | | |
Figures in million – SA rand | | | | |
Sibanye-Stillwater 2020 to 2025 Share Plans (cash-settled scheme) | | | | |
DRDGOLD (equity-settled scheme) | | | | |
Total share-based payment expense | | | | |
Reconciliation of the cash-settled and equity-settled share-based payment expense: | | | | |
Cash-settled share-based payment expense1 | | | | |
Equity-settled share-based payment expense | | | | |
Total share-based payment expense | | | | |
1Included in the cash-settled share-based payment expense for the year ended 31 December 2025 is the grant date fair value portion of the expense amounting to
R327 million (2024: R558 million, 2023: R372 million) and fair value loss after grant date of R1,746 million (2024: gains of R341 million, 2023: gains of R293 million) relating to the
2020 to 2025 Share Plans and MSR Share Plans
NOTES TO THE CONSOLIDATED FINANCIAL STATEMENTS continued
For the year ended 31 December 2025
7. (Loss)/gain on financial instruments
| | | | |
Figures in million – SA rand | | | | |
Fair value loss on gold hedge contracts1 | | | | |
Fair value gain/(loss) on palladium hedge contract | | | | |
Fair value gain/(loss) on zinc hedge contracts2 | | | | |
Fair value (loss)/gain on cash-settled share-based payment obligations (Rustenburg and Marikana B-BBEE transactions) | | | | |
Loss on the revised cash flow of the Rustenburg operation deferred payment | | | | |
Fair value gain/(loss) on derivative instrument | | | | |
(Loss)/gain on the revised cash flow of the Burnstone Debt | | | | |
Gain on the revised cash flow of the Marikana dividend obligation | | | | |
Fair value gain/(loss) on contingent consideration (Kroondal acquisition) | | | | |
Fair value gain/(loss) on Keliber dividend obligation | | | | |
Fair value gain/(loss) on other investments | | | | |
| | | | |
Total (loss)/gain on financial instruments3 | | | | |
1On 3 May 2023, Sibanye Gold Proprietary Limited (SGL) concluded a gold hedge agreement which commenced on 4 May 2023. The agreement is structured at monthly
average prices, comprising the delivery of 154,320 ounces of gold over 12 months (12,860 ounces per month) with a zero cost collar which establishes a floor and cap of
R34,214 and R46,050 per ounce, respectively. The hedge agreement concluded in April 2024. On 17 November 2023, SGL concluded two additional gold hedge
agreements which commenced on 17 November 2023. The agreements are structured at monthly average prices, comprising the delivery of 120,000 and 240,000 ounces
of gold over 12 months, respectively. The agreements have a zero cost collar which establishes a floor of R34,214 per ounce for both agreements and cap of R43,545 and
R43,800 per ounce, respectively. On 4 November 2024, SGL concluded a new gold hedge agreement which commenced on 2 December 2024. The agreement is
structured at monthly average prices, comprising the delivery of 182,000 ounces of gold over 13 months (14,000 ounces per month) with a zero cost collar which
establishes a floor and cap of R45,000 and R58,500 per ounce, respectively. On 9 December 2024, SGL concluded an additional gold hedge agreement, which
commenced on 2 January 2025. The agreement is structured at monthly average prices, comprising the delivery of 168,000 ounces of gold over 12 months (14,000 ounces
per month) with a zero cost collar which establishes a floor and cap of R45,000 and R54,400 per ounce, respectively. As hedge accounting is not applied, resulting gains
or losses are accounted for as gains or losses on financial instruments in profit or loss. The fair value loss is included in the corporate and reconciling items of the SA gold
section of the segment report
2Century mine concluded a hedge agreement on 15 June 2021 for 90,000 tonnes of payable zinc over three years which commenced July 2021 to June 2024 in equal
monthly deliveries (2,500 tonnes per month) at a fixed monthly price of A$3,717/t net of all fees and costs. In November 2021, Century mine concluded an additional
hedge agreement for 90,000 tonnes of payable zinc for two years (3,750 tonnes per month) which commenced January 2022 to December 2023 at a fixed price of
A$3,938/t net of all fees and costs. During June 2024, Century concluded two additional zinc hedge agreements, which both commenced on 1 July 2024. The first
agreement is structured at monthly average prices, comprising the delivery of 5,940 tonnes of zinc over 18 months (330 tonnes per month) with a zero cost collar which
establishes a floor and cap of A$4,300 and A$4,830 per tonne, respectively. The second zinc hedge agreement is structured at monthly average prices, comprising the
delivery of 30,060 tonnes of zinc over 18 months (1,670 tonnes per month) with a zero cost collar which establishes a floor and cap of A$4,100 and A$4,340 per tonne,
respectively. During November 2024, Century concluded two additional zinc hedge agreements, which both commenced in January 2025. The first agreement
comprises the delivery of 6,000 tonnes of zinc in January 2025 with a zero cost collar which establishes a floor and cap of A$4,150 and A$4,500 per tonne, respectively. The
second zinc hedge agreement is structured at monthly average prices, comprising the delivery of 12,000 tonnes of zinc over 12 months (1,000 tonnes per month) with a
zero cost collar which establishes a floor and cap of A$4,200 and A$4,780 per tonne, respectively. During March 2025, Century concluded an additional zinc hedge
agreement, which commenced in April 2025. The agreement comprises the delivery of 5,112 tonnes of zinc over 9 months (568 tonnes per month) with a zero cost collar
which establishes a floor and cap of A$4,200 and A$4,950 per tonne, respectively. During H2 2025, Century concluded four additional hedge agreements which all
commenced on 1 January 2026. The first agreement comprises the delivery of 3,300 tonnes of zinc over 6 months (550 tonnes per month) with a zero cost collar which
established a floor and cap of A$4,250 and A$4,800 per tonne. The second agreement comprises the delivery of 6,000 tonnes of zinc over 6 months (1,000 tonnes per
month) with a zero cost collar which established a floor and cap of A$4,200 and A$4,750 per tonne. The third agreement comprises the delivery of 2,700 tonnes of zinc
over 6 months (450 tonnes per month) with a zero cost collar which established a floor and cap of A$4,250 and A$4,800 per tonne. The fourth agreement comprises the
delivery of 12,000 tonnes of zinc over 6 months (2,000 tonnes per month) with a zero cost collar which established a floor and cap of A$4,300 and A$4,900 per tonne. As
hedge accounting is not applied, resulting gains or losses are accounted for as gains or losses on financial instruments in profit or loss
3The unrealised loss for the purpose of the statement of cash flows amounted to R2,509 million (2024: gain of R5,574 million and 2023: gain of R101 million)
NOTES TO THE CONSOLIDATED FINANCIAL STATEMENTS continued
For the year ended 31 December 2025
8. Other costs and other income
8.1 Other costs
| | | | |
Figures in million – SA rand | | | | |
| | | | |
Change in estimate of environmental rehabilitation obligation, and right of recovery receivable and payable | | | | |
Corporate and social investment costs | | | | |
Cost incurred on employee and community trusts | | | | |
Onerous contract provision | | | | |
| | | | |
| | | | |
| | | | |
| | | | |
| | | | |
| | | | |
1Care and maintenance costs mainly includes Cooke (included in the gold corporate and reconciling segment) amounting to R1,132 million (2024: R970 million, 2023:
R883 million), Burnstone (included in the gold corporate and reconciling segment) amounting to R206 million (2024: R194 million) and Sandouville amounting to
R194 million. Care and maintenance costs for the year ended 31 December 2024 also included R340 million (2023: R117 million) and R69 million (2023: R103 million) related
to Kloof and Marikana, respectively
8.2 Other income
| | | | |
Figures in million – SA rand | | | | |
Change in estimate of environmental rehabilitation obligation, and right of recovery receivable and payable | | | | |
| | | | |
Gain on remeasurement of previous interest in Kroondal | | | | |
| | | | |
| | | | |
Onerous contract provision utilisation/change in estimate | | | | |
Gain on assets held for sale | | | | |
Gain on increase in equity-accounted investment | | | | |
| | | | |
1Insurance claims for 2025 relates mainly to business interruption and property damage claims lodged at the Australian operations (R139 million), Kloof (R64 million) and the
US PGM operations (R46 million). The total value of the property damage claim for the Group amounts to R142 million. Insurance claims for 2024 related mainly to the
business interruption insurance claim lodged by the Group at its US PGM operations resulting from the flood event which occurred during June 2022 amounting to
R838 million, also included R26 million received as compensation for losses incurred in respect of a property damage claim lodged by the Group
9. Restructuring costs
Restructuring costs of R247 million (2024: R550 million, 2023: R515 million) were incurred in 2025 and included voluntary separation packages.
The restructuring costs at the SA gold operations and the SA PGM operations amounted to R60 million (2024: R43 million, 2023: R113 million)
and R8 million (2024: R269 million, 2023: R351 million), respectively. Restructuring costs incurred at Sandouville amounted to R170 million.
Also included in the restructuring costs for the year ended 31 December 2024 was restructuring costs incurred at Stillwater and Burnstone
amounting to R126 million and R77 million, respectively.
NOTES TO THE CONSOLIDATED FINANCIAL STATEMENTS continued
For the year ended 31 December 2025
10. Impairments and reversal of impairments
| | | | |
Figures in million – SA rand | | | | |
Impairment of mining assets | | | | |
Impairment of right-of-use assets — mining assets | | | | |
Impairment reversal of mining assets | | | | |
Impairment of intangible assets | | | | |
| | | | |
Impairment of investment in equity-accounted investee1 | | | | |
Impairment of loan to equity-accounted investee | | | | |
| | | | |
Total impairments and reversal of impairments | | | | |
1Mimosa's updated life-of-mine at 30 June 2025 indicated above US dollar inflationary increases in working costs and capital costs, and included a Zimbabwean
beneficiation tax which resulted in a decrease in the expected future net cash flows from Mimosa. The lower value in use led to an after tax equity-accounted
impairment of property, plant and equipment amounting to R535 million and the impairment of the investment in the equity-accounted investee of R64 million, before the
impact of deferred tax (net an impairment of R461 million) (see note 12.3) (included in SA PGM on the segment report — see note 2). The weighted average PGM (4E)
basket price, nominal discount rate and life-of-mine used in the Mimosa impairment assessment was R25,745/4Eoz, 20.67% and 8 years, respectively. The recoverable
amount at 30 June 2025 was determined as R2,208 million
31 December 2025
The carrying value of the Kloof cash-generating unit (CGU) was impaired by R3,779 million and the carrying value of the Keliber CGU was
impaired by R2,460 million at 31 December 2025 in addition to the R5,344 million recognised at 30 June 2025.
•The impairment recognised at Kloof was due to a decrease in the life of mine as a result of logistical constraints, seismicity and safety
concerns to access higher grade areas, that resulted in a decrease in the recoverable amount at 31 December 2025.
•The impairment of Keliber was due to a further decrease in the consensus long-term forecasted lithium hydroxide price compared to 30
June 2025 and the decision to proceed with an extended start-up profile resulting in a decrease in the recoverable amount as at 31
December 2025.
At 30 June 2025, an impairment of R4,230 million was recognised at the US PGM operations (Stillwater CGU) from the One Big Beautiful Bill
Act that was signed into US law and indicates a phase out and termination of Section 45X credits. Under the phase out and termination
rules, any applicable critical mineral produced after 31 December 2030 is phased out with 25% over a period of 4 years commencing from
2031. This resulted in decreased future net cash flows from the US PGM operations and a reduction in value in use at 30 June 2025, and
consequently to an impairment of property, plant and equipment of R4,230 million. The impairment recognised on Keliber at 30 June 2025
was due to a decrease in the consensus long-term forecasted lithium hydroxide price and an increased discount rate that resulted in a
decrease in the expected future net cash flows from Keliber and the value in use at 30 June 2025, and resulted in an impairment of
property, plant and equipment.
The carrying values of Beatrix, Driefontein and Burnstone were increased at 31 December 2025 by a reversal of previously recognised
impairment losses of R449 million, R168 million and R1,307 million, respectively. The reversals of impairment resulted from the higher gold
price outlook and sustained operational improvements at the Beatrix and Driefontein operations and translated to an increase in the
expected future net cash flows and recoverable amounts at Beatrix, Driefontein and Burnstone.
The impairment of mining assets for the year ended 31 December 2025 related to the following classes of assets:
| | | | | |
Figures in million – SA rand | | | | | |
Mine development, infrastructure and other | | | | | |
Land, mineral rights and rehabilitation | | | | | |
| | | | | |
| | | | | |
The impairment reversals of mining assets for the year ended 31 December 2025 related to the following classes of assets:
| | | | |
Figures in million – SA rand | | | | |
Mine development, infrastructure and other | | | | |
Land, mineral rights and rehabilitation | | | | |
Total impairment reversals | | | | |
The assumptions applied in the 30 June 2025 and 31 December 2025 recoverable amount calculations for each of the CGU impacted by
the impairments are set out below:
NOTES TO THE CONSOLIDATED FINANCIAL STATEMENTS continued
For the year ended 31 December 2025
| | | | | | | | |
| | | |
| | | | | | | | |
Average PGM (2E) basket price1 | | | | | | | | |
Average lithium hydroxide price1 | | | | | | | | |
| | | | | | | | |
| | | | | | | | |
| | | | | | | | |
| | | | | | | | |
| | | | | | | | |
1The weighted average commodity prices and exchange rate were derived by considering various bank and commodity broker consensus forecasts
2The inflation rate is based on the expected forecast inflation rate for the geographic region which most affects the CGU's cash flows
3The nominal discount rate is calculated as the weighted average cost of capital of the respective CGUs
4Periods longer than five years are considered appropriate based on the nature of the operations since a formally approved life-of-mine plan is used to determine cash
flows over the life of each mine based on the available reserves
5 In respect of Keliber, if the life-of-mine is not extended meaningfully, it is estimated that the concentrator and refinery will continue with external purchases of spodumene
concentrate. A minimum of 6 years post life-of-mine were assumed for external purchase of spodumene concentrate
6 The recoverable amount (fair value less cost of disposal) was estimated using discounted cash flows. The fair value measurement was categorised as a Level 3 fair value
based on the inputs in the valuation technique used
31 December 2024
The carrying value of the US PGM operations was impaired by R1,292 million at 31 December 2024, in addition to the R7,499 million
recognised at 30 June 2024. The impairment is due to the resulting recoverable amount determined from the updated life-of-mine plan
which incorporates the restructure of the US PGM operations announced after 30 June 2024, and includes suspending the operations at the
Stillwater West Mine for a period of time and reducing mining at East Boulder Mine. Many of the actions relating to the restructure were
implemented towards the end of the financial year. There was also a further decrease in the expected long-term palladium and platinum
prices which resulted in a decrease in the expected future net cash flows from the Stillwater CGU, and contributed to the reduced value in
use at 31 December 2024. The impairment recognised at 30 June 2024 was due to the decrease in medium to long-term forecast palladium
and platinum prices which also resulted in a decrease in the expected future net cash flows from the Stillwater CGU.
Specific asset impairment for the year ended 31 December 2024 related to the Sandouville nickel refinery which was impaired by
R221 million resulting from the settlement agreement concluded during the six months ended 31 December 2024, in terms of which the last
nickel matte was delivered early January 2025 and the remaining inventory was scheduled to be processed by the end of March 2025. The
outcome of the pre-feasibility study to assess the potential conversion of the Sandouville plant to produce pCAM is expected by the end of
2025. A further R34 million specific asset impairment was recognised at Stillwater related to assets classified as held for sale and written
down to fair value. Specific asset impairments recognised for the six months ended 30 June 2024 related to shaft 4B at Marikana which was
impaired by R112 million due to closure and the Klipfontein open cast assets by R11 million due to the mining area not being economically
viable.
The impairment of mining assets for the year ended 31 December 2024 related to the following classes of assets:
| | | |
Figures in million – SA rand | | | |
Mine development, infrastructure and other | | | |
| | | |
| | | |
The assumptions applied in the 30 June 2024 and 31 December 2024 value in use impairment calculation as well as the recoverable
amount for each of the CGU impacted by the impairments are set out below:
| | | |
| | |
| | | |
Weighted average PGM (2E) basket price1 | | | |
| | | |
| | | |
| | | |
| | | |
1The weighted average commodity prices and exchange rate were derived by considering various bank and commodity broker consensus forecasts
2The inflation rate is based on the expected forecast inflation rate for the geographic region which most affects the CGU's cash flows
3The nominal discount rate is calculated as the weighted average cost of capital of the respective CGUs
4Periods longer than five years are considered appropriate based on the nature of the operations since a formally approved life-of-mine plan is used to determine cash
flows over the life of each mine based on the available reserves
NOTES TO THE CONSOLIDATED FINANCIAL STATEMENTS continued
For the year ended 31 December 2025
31 December 2023
The impairment of mining assets and goodwill for the year ended 31 December 2023 related to the following classes of assets:
| | | | | | | |
Figures in million – SA rand | | Sandouville nickel refinery2 | Century retreatment operation3 | | | | |
Mine development, infrastructure and other | | | | | | | |
Land, mineral rights and rehabilitation | | | | | | | |
Exploration and evaluation assets | | | | | | | |
| | | | | | | |
| | | | | | | |
| | | | | | | |
1Various operational constraints, as previously reported, in the ramp-up of the Blitz project, coupled with higher than inflation increases in operating costs and a decrease
in medium to long-term forecast palladium prices, resulted in a decrease in the expected future net cash flows from the US PGM operation. The higher weighted average
cost of capital, driven by a higher beta, in combination with the aforementioned factors, contributed to the reduced value in use at 31 December 2023, which led to an
impairment of property, plant and equipment and goodwill amounting to R38,900 million. In addition, goodwill allocated to the US PGM operation amounting to
R60 million pertaining to the acquisition of SFA (Oxford) was impaired
2An onerous supply contract (see note 29.2), higher fixed and variable costs, significantly reduced expected sustainable production volumes and higher than initially
expected sustaining capital expenditure, resulted in the decrease in expected future net cash flows from the Sandouville nickel refinery. This, together with lower nickel
prices, reduced the value in use at 31 December 2023 and led to an impairment of property, plant and equipment, intangible assets and goodwill amounting to
R1,606 million
3Lower than expected production volumes, above inflationary increases in operating costs, higher sustaining capital, the approaching end of life-of-mine and the
diminishing window of opportunity to develop and operate the expansion projects concurrent with the ongoing operation, resulted in a decrease in the expected future
net cash flows from the Century zinc retreatment operation. The lower value in use at 31 December 2023 led to an impairment of property, plant and equipment
amounting to R3,689 million
4Consistent with the requirements of the Group’s capital allocation framework, the Burnstone project (included in the SA Gold corporate and reconciling items reportable
segment) was delayed and was expected to ramp-up again during 2025. The additional costs during the delay, the deferral of mine ramp-up and higher weighted
average cost of capital due to an increase in the beta, risk free rate and cost of debt, resulted in a decrease in the expected future net cash flows from Burnstone. The
lower value in use at 31 December 2023 led to an impairment of property, plant and equipment amounting to R1,115 million
5Operational constraints, including seismicity and cooling, at the Kloof 4 shaft, compounded by the shaft incident during H2 2023 that damaged the shaft infrastructure,
resulted in a severe deterioration in productivity that negatively impacted the financial viability of the Kloof 4 shaft. Consequently, during 2023, following a consultative
process, the Group announced the closure of Kloof 4 shaft, which led to the specific impairment of property, plant and equipment amounting to R1,616 million
The assumptions applied in the 31 December 2023 value in use impairment calculation as well as the recoverable amount for each of the
CGU impacted by the impairments are set out below:
| | | | | |
| | | Sandouville nickel refinery | Century zinc retreatment operation | |
Weighted average PGM (2E) basket price1 | | | | | |
Weighted average nickel price1 | | | | | |
Weighted average cobalt price1 | | | | | |
Weighted average zinc price1 | | | | | |
Weighted average gold price1 | | | | | |
| | | | | |
| | | | | |
Life-of-mine4 (life-of-refinery) | | | | | |
| | | | | |
1The weighted average commodity prices and exchange rate were derived by considering various bank and commodity broker consensus forecasts
2The inflation rate is based on the expected forecast inflation rate for the geographic region which most affects the CGU's cash flows
3The nominal discount rate is calculated as the weighted average cost of capital of the respective CGUs
4Periods longer than five years are considered appropriate based on the nature of the operations since a formally approved life-of-mine plan is used to determine cash
flows over the life of each mine based on the available reserves
Impairment of investment in equity-accounted investee
A 5.3% decrease in the expected life-of-mine average recovered grade due to plant recoveries being affected by a change in the
mineralogy of the ore, combined with above inflationary increases in working costs, resulted in a decrease in the expected future net cash
flows from Mimosa. The lower value in use at 31 December 2023 led to an after tax equity accounted impairment of property, plant and
equipment amounting to R1,384 million (see note 12.3) and the further impairment of the investment in the equity-accounted investee of
R423 million (included in SA PGM in the segment report — see note 2). The weighted average PGM (4E) basket price, nominal discount rate
and life-of-mine used in the 31 December 2023 Mimosa impairment assessment was R26,632/4Eoz, 31.2% and 11 years, respectively. The
recoverable amount at 31 December 2023 was determined as R2,757 million.
NOTES TO THE CONSOLIDATED FINANCIAL STATEMENTS continued
For the year ended 31 December 2025
11. Royalties, mining and income tax, and deferred tax
|
Significant accounting judgements and estimates The Group, directly and indirectly, is subject to income tax in South Africa, Zimbabwe, the United Kingdom (UK), France, Finland, Australia, India, Mexico, South Korea and the US. Significant judgement is required in determining the liability for income tax due to the complexity of legislation. During the ordinary course of business, transactions and calculations may occur for which the ultimate tax determination is uncertain. The Group recognises liabilities for anticipated tax audit issues based on the best estimates of whether additional taxes will be due. The Group reassesses its judgements and estimates if facts and circumstances change. To the extent required, these transactions are disclosed in accordance with management's probability assessment. Where the facts and circumstances change or when the final tax outcome of these matters are different from the amounts that were initially recorded, such differences will impact the income tax and deferred tax provisions in the period in which such determination is made. The Group recognises the net future tax benefit related to deferred tax assets to the extent that it is probable that the deductible temporary differences will reverse in the foreseeable future. Assessing the recoverability of deferred tax assets requires the Group to make significant estimates related to expectations of future taxable income. Estimates of future taxable income are based on forecast cash flows from operations and the application of existing tax laws. To the extent that future cash flows and taxable income differ significantly from estimates, the ability of the Group to realise the net deferred tax assets recorded at the reporting date could be impacted. The Group’s gold mining operations are taxed on a variable rate that increases as the profitability of the operation increases. The deferred tax rate used to calculate deferred tax is based on the current estimate of future profitability when the temporary differences will reverse based on tax rates and laws that have been enacted or substantively enacted at the reporting date. Depending on the profitability of the operations, the deferred tax rate can consequently be significantly different from year to year. Calculating the future profitability of the operations is inherently uncertain and could materially change over time. Additionally, future changes in tax laws in South Africa, Zimbabwe, the UK, France, Finland, Australia, India, Mexico, South Korea and the US could limit the ability of the Group to obtain tax deductions in future periods. Accounting policy Income tax comprises current and deferred tax. Current tax and deferred tax is recognised in profit or loss except to the extent that it relates to a business combination, or items recognised directly in equity or in other comprehensive income. Current tax is measured on taxable income at the applicable statutory rate enacted or substantively enacted at the reporting date and is the best estimate of the tax amount expected to be paid or received that reflects uncertainty related to income taxes, if any. Deferred tax is provided on temporary differences existing at each reporting date between the tax values of assets and liabilities and their carrying amounts and reflects uncertainty related to income taxes, if any. Enacted and substantively enacted tax rates are used to determine future anticipated effective tax rates which in turn are used in the determination of deferred tax. These temporary differences are expected to result in taxable or deductible amounts in determining taxable profits for future periods when the carrying amount of the asset is recovered or the liability is settled. The principal temporary differences arise from depreciation of property, plant and equipment, provisions, unutilised capital allowances and tax losses carried forward. Deferred tax is not recognised for: •temporary differences on the initial recognition of assets or liabilities in a transaction that is not a business combination, that affects neither accounting nor taxable profit or loss and at the time of the transaction does not give rise to equal taxable and deductible temporary differences •temporary differences related to investments in subsidiaries, and interests in associates and joint ventures to the extent that the Group is able to control the timing of the reversal of the temporary differences and it is probable that these will not reverse in the foreseeable future •taxable temporary differences arising on the initial recognition of goodwill Deferred tax assets and liabilities are offset if there is a legally enforceable right to offset current tax liabilities and assets, and relate to taxes levied by the same tax authority on the same taxable entity, or on different tax entities, but intend to settle current tax liabilities and assets on a net basis or their tax assets and liabilities will be realised simultaneously. Deferred tax assets relating to the carry forward of unutilised tax losses and/or unutilised capital allowances are recognised to the extent it is probable that future taxable profit will be available against which the unutilised tax losses and/or unutilised capital allowances can be recovered. Deferred tax assets are reviewed at each reporting date and are adjusted if recovery is no longer probable. Unrecognised deferred tax assets are reassessed at each reporting date and recognised to the extent that it has become probable that future taxable profits will be available against which they can be utilised. |
NOTES TO THE CONSOLIDATED FINANCIAL STATEMENTS continued
For the year ended 31 December 2025
11.1 Royalties
Revenue from mineral resources in South Africa are subject to the Mineral and Petroleum Resource Royalty Act 2008 (Royalty Act).
The Royalty Act imposes a minimum 0.5% royalty on refined (mineral resources that have undergone a comprehensive level of
beneficiation such as smelting and refining as defined in Schedule 1 of the Royalty Act) and unrefined (mineral resources that have
undergone limited beneficiation as defined in Schedule 2 of the Royalty Act) minerals payable to the State. The royalty percentage in
respect of refined and unrefined minerals (which includes gold refined to 99.5% and above, and PGMs refined to 99.9%) is calculated by
dividing earnings before interest and taxes (EBIT) by the product of 12.5 times, in respect of refined, and 9 times, in respect of unrefined,
gross revenue calculated as a percentage, plus an additional 0.5%. EBIT refers to taxable mining income (with certain exceptions such as
no deduction for interest payable and foreign exchange gains or losses not relating to the sale of the mineral) before assessed losses but
after capital expenditure. A maximum royalty of 5% of mining revenue has been introduced on refined minerals and 7% on unrefined
minerals. The Group is also exposed to a royalty tax in Queensland, Australia on sales of Zinc from the Century mine depending on average
metal prices. The Group is not exposed to royalty taxes in the US, France and Finland, however the Finnish government has introduced a
mineral royalty tax which became effective in 2024. Since the Group does not yet produce minerals from the Keliber operations, no
royalties were paid for the years ended 31 December 2024 and 31 December 2025.
| | | | |
Figures in million – SA rand | | | | |
| | | | |
| | | | |
| | | | |
| | | | |
Prior year royalty tax adjustment | | | | |
| | | | |
11.2 Mining and income tax
South African statutory tax rates
Gold mining, mining and non-mining tax
Gold mining tax is determined according to a formula which takes into account the profit and revenue attributable to gold mining
operations. Mining taxable income (SA PGM and SA gold) is determined after the deduction of all mining capital expenditure, with the
provision that this cannot result in an assessed loss. Capital expenditure amounts not deducted in a particular year are carried forward as
unredeemed capital expenditure to be deducted from future mining income. Accounting depreciation is disregarded for the purpose of
calculating mining tax. In the gold mining tax formula, the percentage rate of tax payable and the ratio of gold mining profit, after the
deduction of redeemable capital expenditure, to gold mining revenue is expressed as a percentage.
Non-mining income consists primarily of interest income, third party gold processing and rental income and was taxed at the South African
company tax rate of 27%.
Company tax rate
Companies, other than gold mining companies, are subject to the maximum South African company tax rate of 27%.
US statutory tax rates
The US PGM operations are subject to tax at the statutory tax rate in the states of Montana (6.75%), Pennsylvania (8.49%) and Florida (5.5%)
as well as the federal statutory rate (21%). Effective 1 January 2025, all apportionable income in Montana is apportioned using a single sales
factor formula, while it previously used a three-factor apportionment formula. The estimated impact of this change was incorporated in the
Group's mining and income tax provision to the extent appropriate, which includes any related deferred tax impacts. The Recycling
operations are subject to tax at the statutory tax rate in the state of Pennsylvania (7.99%), in the state of North Carolina (2.25%) as well as
the federal statutory tax rate (21%).
France, Finland and Australia statutory tax rates
Sandouville, Keliber and Century mine are subject to tax at a corporate income tax rate of 25%, 20% and 30%, respectively.
International tax reform - Pillar Two Model Rules exposure
The Organisation for Economic Co-operation and Development (OECD) published the Pillar Two model rules designed to address the tax
challenges arising from the digitalisation of the global economy. It is unclear if the Pillar Two model rules will create additional temporary
differences, whether it will result in the remeasurement of deferred taxes and which tax rate should be used to measure deferred taxes. The
Group applied the temporary exception issued as part of the amendments to IAS 12 Income Taxes to not recognise or disclose information
about deferred tax assets and liabilities related to the proposed Pillar Two model rules.
Pillar Two legislation is enacted or substantively enacted in certain jurisdictions where the Group operates, namely, South Africa, Australia,
Barbados, Canada, France, Finland, Gibraltar, Guernsey, Mauritius, South Korea, the United Kingdom and Zimbabwe and was effective in
these jurisdictions for the Group’s financial year beginning 1 January 2025 for purposes of the Income Inclusion Rule (IIR), Undertaxed Profits
Rule (UTPR) and/or Qualified Domestic Minimum Top-up Tax (QDMTT). The Group performed an assessment of the potential exposure arising
from Pillar Two legislation for jurisdictions where Pillar Two requirements are effective for the year ended 31 December 2025. Based on the
assessment performed by the Group and application of the available transitional safe harbours, there is no impact on mining and income
tax for jurisdictions where Pillar Two legislation is effective.
NOTES TO THE CONSOLIDATED FINANCIAL STATEMENTS continued
For the year ended 31 December 2025
In the remaining jurisdictions where the Group operates, Pillar Two legislation is not yet effective for the year ended 31 December 2025. The
Group performed an assessment of the potential exposure to Pillar Two income taxes based on the financial information for 2025 and
based on the assessment performed, the Pillar Two effective tax rates in all jurisdictions in which the Group operates are above 15%, being
the minimum proposed tax rate, or the jurisdiction will meet one of the transitional safe harbours and management is not currently aware of
any circumstances under which this might change. Therefore, the Group does not expect a potential significant exposure to Pillar Two top-
up taxes for the year ended 31 December 2025.
Mining and income tax
The components of mining and income tax are as follows:
| | | | |
Figures in million – SA rand | | | | |
| | | | |
| | | | |
| | | | |
Company and withholding tax | | | | |
| | | | |
| | | | |
| | | | |
Deferred tax rate adjustment1 | | | | |
Total mining and income tax | | | | |
1The deferred tax rate adjustment in South Africa and the US was:
| | | | |
Figures in million – SA rand | | | | |
| | | | |
| | | | |
Deferred tax rate adjustment | | | | |
The change in the estimated long-term deferred tax rate at which the temporary differences are expected to reverse as a result of applying the mining tax formula at the
SA gold operations amounted to a deferred tax charge of R102 million for the year ended 31 December 2025 (2024: benefit of R570 million, 2023: charge of R731 million,
which included a partial offset resulting from the change in the South African corporate tax rate from 28% to 27% from 1 January 2023)
NOTES TO THE CONSOLIDATED FINANCIAL STATEMENTS continued
For the year ended 31 December 2025
Reconciliation of the Group’s mining and income tax to the South African statutory company tax rate of 27%.
| | | | |
Figures in million – SA rand | | | | |
Tax on loss/(profit) before tax at maximum South African statutory company tax rate (27%) | | | | |
South African gold mining tax formula rate adjustment | | | | |
| | | | |
US statutory tax rate adjustment | | | | |
Non-taxable Section 45X credit | | | | |
Non-deductible amortisation and depreciation | | | | |
Non-taxable dividend received | | | | |
Non-deductible finance expense | | | | |
Non-deductible share-based payments | | | | |
Non taxable gain/(non-deductible loss) on fair value of financial instruments | | | | |
Non-taxable gain on acquisition | | | | |
(Non-deductible loss)/non-taxable gain on foreign exchange differences | | | | |
Non-taxable share of results of equity-accounted investees | | | | |
(Non-deductible impairments)/non-taxable reversal of impairments | | | | |
Non-deductible transaction and project costs | | | | |
Tax adjustment in respect of prior periods | | | | |
Net other non-taxable income and non-deductible expenditure | | | | |
Change in estimated deferred tax rate | | | | |
Unrecognised or derecognised deferred tax assets1 | | | | |
| | | | |
| | | | |
1The amount for the year ended 31 December 2025 relates mainly to unrecognised deferred tax assets at the Stillwater of R1,709 million, Keliber of R2,189 million,
Sandouville of R447 million, Burnstone of R304 million and Cooke of R319 million. The amount for the year ended 31 December 2024 related mainly to unrecognised
deferred tax assets at the US PGM operations of R3,503 million and Cooke of R344 million. The amount for the year ended 31 December 2023 related mainly to
unrecognised deferred tax assets at Sandouville nickel refinery of R1,358 million, Century of R1,319 million, Burnstone of R436 million, Cooke of R278 million and SGL of
R384 million
11.3 Deferred tax
| | | | |
Figures in million – SA rand | | | | |
Included in the statement of financial position as follows: | | | | |
| | | | |
| | | | |
Net deferred tax liabilities | | | | |
Reconciliation of the deferred tax balance: | | | | |
Balance at beginning of the year | | | | |
Deferred tax on acquisition of subsidiaries | | | | |
Loss on remeasurement of previous interest in joint operation | | | | |
Derecognition with deemed disposal of interest in joint operation | | | | |
Deferred tax recognised in profit or loss | | | | |
Deferred tax recognised in other comprehensive income | | | | |
Foreign currency translation | | | | |
Balance at end of the year | | | | |
The detailed components of the net deferred tax liabilities which result from the differences between the amounts of assets and liabilities
recognised for financial reporting and tax purposes are:
NOTES TO THE CONSOLIDATED FINANCIAL STATEMENTS continued
For the year ended 31 December 2025
| | | | |
Figures in million – SA rand | | | | |
| | | | |
| | | | |
Environmental rehabilitation obligation funds | | | | |
| | | | |
| | | | |
Gross deferred tax liabilities1 | | | | |
| | | |
Environmental rehabilitation obligation | | | | |
Occupational healthcare obligation | | | | |
Other payables and provisions2 | | | | |
Derivative financial instrument | | | | |
| | | | |
Tax losses and unredeemed capital expenditure | | | | |
Share-based payment obligation | | | | |
Gross deferred tax assets3 | | | | |
Net deferred tax liabilities | | | | |
1The aggregate amount of temporary differences associated with investments in subsidiaries, for which no deferred tax liabilities have been recognised under the IAS 12.39
exemption at 31 December 2025, amounts to zero (2024: R956 million and 2023: R811 million)
2This includes other payables such as lease liabilities as well as employee-related liabilities. No deferred tax asset was recognised for the onerous contract provision due to
the low probability of future taxable profits for the Sandouville nickel refinery
3The amount of deductible temporary differences, unused tax losses as well as unredeemed capital expenditure for which no deferred tax asset is recognised, amounted
to R99,496 million (2024: R87,331 million and 2023: R68,868 million ). The amount of capital losses for which no deferred tax asset was recognised amounted to R7,425 million
(2024: R5,686 million, 2023: R6,157 million). Tax losses are available to be utilised against income generated by the relevant tax entity and do not expire unless the tax entity
concerned ceases to operate for a period of longer than one year for the South African operations. Under South African mining tax ring-fencing legislation, each tax
entity is treated separately and as such these deductions can only be utilised by the tax entities in which the deductions have been generated. Tax losses are also
available to be utilised against income generated by the relevant tax entity in France and Australia and do not expire. In Canada, tax losses expire after 20 years
11.4 Net tax, carbon tax and royalties payable/(receivable)
| | | | |
Figures in million – SA rand | | | | |
Included in the statement of financial position as follows: | | | | |
Tax, carbon tax and royalties receivable | | | | |
Tax, carbon tax and royalties payable | | | | |
Non-current portion of tax, carbon tax and royalties payable | | | | |
Current portion of tax, carbon tax and royalties payable | | | | |
Net tax, carbon tax and royalties receivable | | | | |
| | | | |
Reconciliation of the net tax, carbon tax and royalties receivable balance: | | | | |
Balance at beginning of the year | | | | |
Royalties, carbon tax and current tax | | | | |
Royalties, carbon tax and tax paid | | | | |
Royalties and carbon tax paid | | | | |
Royalties and carbon tax refunded | | | | |
| | | | |
| | | | |
Tax payable on acquisition of subsidiaries | | | | |
| | | | |
Foreign currency translation | | | | |
Balance at end of the year | | | | |
NOTES TO THE CONSOLIDATED FINANCIAL STATEMENTS continued
For the year ended 31 December 2025
12. Earnings per share
|
Accounting policy Headline earnings is presented as an additional earnings number allowed by IAS 33 Earnings per Share (IAS 33) and is calculated based on the requirements set out in SAICA Circular 1/2023. Earnings, as determined in IAS 33, is the starting point and certain remeasurements net of related tax (current and deferred) and NCI are excluded. A remeasurement is an amount recognised in profit or loss relating to any change (whether realised or unrealised) in the carrying amount of an asset or liability that arose after the initial recognition of such asset or liability. |
12.1 Basic earnings per share
Basic earnings per share (EPS) is calculated by dividing the profit or loss attributable to owners of Sibanye-Stillwater by the weighted
average number of ordinary shares in issue during the year.
| | | | |
| | | | |
Weighted average number of shares | | | | |
Ordinary shares in issue (’000) | | | | |
Adjustment for weighting of ordinary shares in issue (’000) | | | | |
Weighted average number of shares (’000) | | | | |
Loss attributable to owners of Sibanye-Stillwater (SA rand million) | | | | |
| | | | |
12.2 Diluted earnings per share
Diluted EPS is calculated by dividing the profit attributable to owners of Sibanye-Stillwater by the diluted number of ordinary shares in issue
during the year.
Dilutive shares are the number of potentially dilutive ordinary shares that could be issued. The vesting of equity-settled share options issued
by DRDGOLD and the assumed conversion of the US$ Convertible Bond could potentially dilute basic earnings per share in future through
the dilution of earnings attributable to the Group and the increase in ordinary shares in issue, respectively. However, these instruments were
anti-dilutive for all years presented.
| | | | |
| | | | |
Diluted weighted average number of shares | | | | |
Weighted average number of shares (’000) | | | | |
Potential ordinary shares (’000)1 | | | | |
Diluted weighted average number of shares (’000) | | | | |
Diluted basic EPS (cents) | | | | |
1This related to a historical equity-settled share-based payment scheme of which the last awards vested in Q1 2023
NOTES TO THE CONSOLIDATED FINANCIAL STATEMENTS continued
For the year ended 31 December 2025
12.3 Headline earnings per share
Headline EPS is calculated by dividing the headline earnings attributable to owners of Sibanye-Stillwater by the weighted average number
of ordinary shares in issue during the year.
Reconciliation of profit attributable to owners of Sibanye-Stillwater to headline earnings:
| | | |
Figures in million – SA rand unless otherwise stated | | | |
| | | |
Loss attributable to owners of Sibanye-Stillwater | | | |
Loss on disposal of property, plant and equipment | | | |
Impairments and reversal of impairments | | | |
Impairment recognised by equity-accounted investee, net of tax | | | |
Compensation for losses incurred | | | |
Gain on assets held for sale | | | |
Foreign exchange movement recycled through profit or loss | | | |
| | | |
Weighted average number of shares (’000) | | | |
| | | |
| | | |
Loss attributable to owners of Sibanye-Stillwater | | | |
Gain on disposal of property, plant and equipment | | | |
Impairments and reversal of impairments | | | |
Impairment recognised by equity-accounted investee, net of tax | | | |
Compensation for losses incurred | | | |
Foreign exchange movement recycled through profit or loss | | | |
Re-measurement items, attributable to NCI | | | |
| | | |
Weighted average number of shares (’000) | | | |
| | | |
| | | |
Loss attributable to owners of Sibanye-Stillwater | | | |
Gain on disposal of property, plant and equipment | | | |
Impairments and reversal of impairments | | | |
| | | |
Gain on remeasurement of previous interest in Kroondal | | | |
Impairment recognised by equity-accounted investee, net of tax | | | |
Foreign exchange movement recycled through profit or loss | | | |
Re-measurement items, attributable to NCI | | | |
| | | |
Weighted average number of shares (’000) | | | |
| | | |
NOTES TO THE CONSOLIDATED FINANCIAL STATEMENTS continued
For the year ended 31 December 2025
12.4 Diluted headline earnings per share
Diluted headline EPS is calculated by dividing the headline earnings attributable to owners of Sibanye-Stillwater by the diluted weighted
average number of ordinary shares in issue during the year. The assumed conversion of the US$ Convertible Bond was dilutive in respect of
headline earnings per share for the year ended 31 December 2025, however the convertible bonds were anti-dilutive for all other years
presented.
| | | | |
Figures in million – SA rand unless otherwise stated | | | | |
| | | | |
Adjusted for impact of the US$ Convertible bond: | | | | |
Interest charge and unwinding of amortised cost | | | | |
| | | | |
Diluted headline earnings | | | | |
| | | | |
Adjusted weighted average number of shares ('000) | | | | |
Potential ordinary shares - US$ Convertible bond ('000) | | | | |
Diluted ordinary shares - US$ Convertible bond ('000) | | | | |
Diluted headline EPS (cents) | | | | |
13. Dividends
|
Accounting policy Dividends are recognised as a liability on the date on which such dividends are declared. Dividend withholding tax is a tax on shareholders receiving dividends and is applicable to all dividends paid which are subject to dividend withholding tax based on the relevant tax requirements. The Group withholds dividend tax on behalf of its shareholders at a rate of 20% on dividends paid. Amounts withheld are not recognised as part of the Group’s tax charge but rather as part of the dividend paid, recognised in equity. Cash flows from dividends paid are classified under operating activities in the statement of cash flows. |
The table below illustrates the dividends declared and paid:
| | | | |
Figures in million – SA rand unless stated otherwise | | | | |
Dividend declared and paid (interim) | | | | |
Dividend declared after 31 December (final) | | | | |
Total dividends declared for the year | | | | |
Dividend per share (interim) — cents | | | | |
Dividend per share (final) — cents | | | | |
Dividends paid during the financial year | | | | |
Dividends paid to NCI of subsidiaries during the financial year | | | | |
Total dividends paid for the year1 | | | | |
1The dividends paid is impacted by the number of shares in issue at the time of payment
Dividend policy
Sibanye-Stillwater’s dividend policy is to return at least 25% to 35% of normalised earnings to shareholders and after due consideration of
future requirements the dividend may be increased beyond these levels. The Board, therefore, considers normalised earnings in
determining what value will be distributed to shareholders. The Board believes normalised earnings provides useful information to investors
regarding the extent to which results of operations may affect shareholder returns.
Normalised earnings is defined as earnings attributable to the owners of Sibanye-Stillwater excluding gains and losses on financial
instruments and foreign exchange differences, impairments and related compensation, gain/loss on disposal of property, plant and
equipment, occupational healthcare expenses, restructuring costs, transactions costs, share-based payment expenses on B-BBEE
transactions, gain on acquisitions, net other business development costs, share of results of equity-accounted investees, all after tax and
the impact of NCI, and changes in estimated deferred tax rate.
Consistent with Sibanye-Stillwater’s dividend policy and Capital Allocation Framework, the Board of Directors resolved to declare a final
dividend of 131 SA cents per share for the year ended 2025. Other than an interim dividend in 2023, no dividend was declared for the years
ended 2024 and 2023. The dividend amounts to a payout of 35% of normalised earnings for the year ended 31 December 2025.
NOTES TO THE CONSOLIDATED FINANCIAL STATEMENTS continued
For the year ended 31 December 2025
Reconciliation of profit attributable to the owners of Sibanye-Stillwater to normalised earnings
| | | | |
Figures in million – SA rand | | | | |
Loss attributable to the owners of Sibanye-Stillwater | | | | |
| | | | |
Loss/(gain) on financial instruments | | | | |
(Gain)/loss on foreign exchange differences | | | | |
Loss/(gain) on disposal of property, plant and equipment | | | | |
Impairments and reversal of impairments | | | | |
| | | | |
| | | | |
| | | | |
Occupational healthcare loss/(gain) | | | | |
Gain on remeasurement of previous interest in Kroondal | | | | |
Gain on increase in equity-accounted investment | | | | |
Change in estimated deferred tax rate | | | | |
Share of results of equity-accounted investees after tax | | | | |
Provision for community costs post closure | | | | |
Section 45X credits recognised for 2023 and 2024 | | | | |
| | | | |
Compensation for losses incurred | | | | |
Corporate leadership costs | | | | |
Gain on assets held for sale | | | | |
Tax effect of the items adjusted above | | | | |
NCI effect of the items listed above | | | | |
| | | | |
1Non-IFRS measures such as normalised earnings is the responsibility of the Group’s Board of Directors and presented for illustration purposes only, and because of its
nature, normalised earnings should not be considered as a representation of financial performance under IFRS Accounting Standards
NOTES TO THE CONSOLIDATED FINANCIAL STATEMENTS continued
For the year ended 31 December 2025
14. Property, plant and equipment
|
Significant accounting judgements and estimates Carrying value of property, plant and equipment All mining assets are amortised using the units-of-production method where the mine operating plan calls for production from proved and probable mineral reserves. Mobile and other equipment are depreciated over the shorter of the estimated useful life of the asset or the estimate of mine life based on proved and probable mineral reserves. The calculation of the units-of-production rate of amortisation could be impacted to the extent that actual production in the future is different from current forecast production based on proved and probable mineral reserves. This would generally result from the extent that there are significant changes in any of the factors or assumptions used in estimating mineral reserves. These factors could include: •changes in proved and probable mineral reserves •differences between actual commodity prices and commodity price assumptions •unforeseen operational issues at mine sites •conversion of resources into proven and probable mineral reserves •changes in capital, operating, mining, processing and reclamation costs, discount rates and foreign exchange rates •changes in mineral reserves could similarly impact the useful lives of assets depreciated on a straight-line basis, where those lives are limited to the life of the mine The recoverable amounts of CGUs and individual assets are determined based on the higher of value in use calculations and fair value less cost to sell. These calculations require the use of estimates and assumptions. It is reasonably possible that the gold, PGM, nickel, zinc and cobalt price assumptions may change which may then impact the Group estimated life-of-mine determinant and may then require a material adjustment to the carrying value of property, plant and equipment. The Group reviews and tests the carrying value of assets when events or changes in circumstances suggest that the carrying amount may not be recoverable by comparing expected future cash flows to these carrying values. Assets are grouped at the lowest level for which identifiable cash flows are largely independent of cash flows of other assets and liabilities. If there are indications that impairment may have occurred, estimates are prepared of expected future cash flows of each group of assets. Expected future cash flows used to determine the value in use and fair value less costs to sell of property, plant and equipment are inherently uncertain and could materially change over time. They are significantly affected by a number of factors including reserves and production estimates, together with economic factors such as spot and future gold, PGM, nickel, zinc and cobalt prices, discount rates, foreign currency exchange rates, estimates of costs to produce reserves and future capital expenditure (see note 10). Pre-production The Group assesses the stage of each mine construction project to determine when a mine moves into the production stage. The criteria used to assess the start date are determined based on the unique nature of each mine construction project. The Group considers various relevant criteria to assess when the mine is substantially complete, ready for its intended use and moves into the production stage. Some of the criteria would include, but are not limited to the following: •the level of capital expenditure compared to the construction cost estimates •ability to produce metal in saleable form (within specifications) •ability to sustain commercial levels of production of metal When a mine construction project moves into the production stage, the capitalisation of certain mine construction costs ceases and costs are expensed, except for capitalisable costs related to mining asset additions or improvements, underground mine development or ore reserve development. Mineral reserves estimates Mineral reserves are estimates of the amount of product that can be economically and legally extracted from the Group’s properties. In order to calculate the reserves, estimates and assumptions are required about a range of geological, technical and economic factors, including but not limited to quantities, grades, production techniques, recovery rates, production costs, transport costs, commodity demand, commodity prices and exchange rates. Estimating the quantity and grade of the mineral reserves requires the size, shape and depth of ore bodies to be determined by analysing geological data such as the logging and assaying of drill samples. This process may require complex and difficult geological judgements and calculations to interpret the data. The Group is required to determine and report, inter alia, on the mineral reserves in accordance with the South African Code for Reporting of Exploration Results, mineral resources and mineral reserves (SAMREC Code). |
NOTES TO THE CONSOLIDATED FINANCIAL STATEMENTS continued
For the year ended 31 December 2025
|
Estimates of mineral reserves may change from period to period due to the change in economic assumptions used to estimate mineral reserves and due to additional geological data becoming available during the course of operations. Changes in reported proven and probable reserves may affect the Group’s financial results and position in a number of ways, including the following: •asset carrying values may be affected due to changes in estimated cash flows •depreciation and amortisation charges to profit or loss may change where these are calculated on the units-of production method, or where the useful lives of assets change •decommissioning site restoration and environmental provisions may change where changes in ore reserves affect expectations about the timing or cost of these activities •the carrying value of deferred tax assets may change due to changes in estimates of the likely recovery of the tax benefits Accounting policy Mineral and surface rights Mineral and surface rights are recorded at cost less accumulated amortisation and accumulated impairment losses. When there is little likelihood of a mineral right being exploited, or the carrying amount has exceeded its recoverable amount, impairment is recognised in profit or loss in the year that such determination is made. Mine development and infrastructure Mining assets, including mine development and infrastructure costs and mine plant facilities, are recorded at cost, which includes capitalised borrowing costs for qualifying assets, less accumulated depreciation and accumulated impairment losses. Costs include the purchase price of assets used in the construction of the mine, expenditure incurred to evaluate and develop new ore bodies, as well as expenditure to define mineralisation in existing ore bodies and to establish or expand productive capacity. These costs are capitalised until commercial levels of production are achieved, at which times the costs are amortised as set out below. Development of ore bodies includes the development of shaft systems and waste rock removal that allows access to reserves that are economically recoverable in the future. Subsequent to this, costs are capitalised if the criteria for recognition as an asset are met. Access to individual ore bodies exploited by the Group is limited to the time span of the respective mining leases. Land Land is shown at cost and is not depreciated. Other assets Non-mining assets are recorded at cost less accumulated depreciation and accumulated impairment losses. These assets include the assets of the mining operations that are not included in mine development and infrastructure. It also includes borrowing costs for qualifying assets, mineral and surface rights, land and all the assets of the non-mining operations. Amortisation and depreciation of mining assets Amortisation and depreciation is determined to give a fair and systematic charge in profit or loss taking into account the nature of a particular ore body and the method of mining that ore body. To achieve this, the following calculation methods are used: •Mining assets, including mine development and infrastructure costs, mine plant facilities and evaluation costs, are amortised over the life of the mine using the units-of-production method, based on estimated proved and probable mineral reserves •Proved and probable mineral reserves reflect estimated quantities of economically recoverable reserves, which can be recovered in future from known mineral deposits •Certain mining plant and equipment included in mine development and infrastructure is depreciated on a straight-line basis over their estimated useful lives •For certain shafts, which have a short life and/or are marginal, the depreciation is accelerated based on an adjustment to the reserves for accounting purposes |
NOTES TO THE CONSOLIDATED FINANCIAL STATEMENTS continued
For the year ended 31 December 2025
|
Depreciation of non-mining assets Non-mining assets are recorded at cost and depreciated on a straight-line basis over their current expected useful lives to their residual values as follows: •Vehicles: 5 years •Computers: 3 - 5 years •Furniture and equipment: 1 - 10 years •Buildings and improvements: 5 - 39 years The assets’ useful lives, depreciation methods and residual values are reassessed at each reporting date and adjusted if appropriate. Impairment Recoverability of the carrying values of long-term assets or CGUs of the Group are reviewed whenever events or changes in circumstances indicate that such carrying value may not be recoverable. To determine whether a long-term asset or CGU may be impaired, the higher of value in use (defined as: the present value of future cash flows expected to be derived from an asset or CGU) or fair value less costs to sell (defined as: the price that would be received to sell an asset in an orderly transaction between market participants at the measured rate, less the costs of disposal) is compared to the carrying value of the CGU. A CGU is defined by the Group as the smallest identifiable group of assets that generates cash inflows that are largely independent of the cash inflows from other assets or groups of assets. Generally for the Group this represents an individual operating mine, including mines which are part of a larger mine complex. The costs attributable to individual shafts of a mine are impaired if the shaft is closed. Impairment losses are recognised in profit or loss. Impairment recognised in respect of a CGU is allocated first to goodwill allocated/ attributable to that particular CGU and thereafter to the individual assets in the CGU. When any infrastructure is closed down or placed on care and maintenance during the year, any carrying value attributable to that infrastructure is tested for impairment and any impairment loss attributable to infrastructure is recognised. Expenditure incurred on care and maintenance is recognised in profit or loss. When the review of the events or changes in circumstances of an asset or CGU that was previously impaired indicate that such historical carrying value is recoverable, the impairment is reversed. The reversal is limited so that the carrying value of the asset does not exceed its recoverable amount, nor exceed what the historical carrying amount would have been should the asset not have been impaired. Reversal of impairment losses are recognised in profit or loss. Reversal of impairment recognised in respect of a CGU is allocated to the individual assets in the CGU. Derecognition of property, plant and equipment Property, plant and equipment is derecognised on disposal or closure of a shaft when no future economic benefits are expected from its use or disposal. Any gain or loss on derecognition of an item of property, plant and equipment (calculated as the net proceeds from disposal and the carrying amount of the item) is recognised in profit or loss. Exploration and evaluation expenditure All exploration and evaluation expenditure, prior to obtaining the legal rights to explore a specific area, is recognised in profit or loss. After the legal rights to explore are obtained, exploration and evaluation expenditure, comprising the costs of acquiring prospecting rights and directly attributable exploration expenditure, is capitalised as a separate class of property, plant and equipment or intangible assets, on a project-by-project basis, pending determination of the technical feasibility and commercial viability. The technical feasibility and commercial viability of extracting a mineral resource is generally considered to be determinable through a feasibility study and when proven reserves are determinable to exist. Upon determination of proven reserves, exploration and evaluation assets attributable to those reserves are first tested for impairment and then reclassified from exploration and evaluation assets to another appropriate class of property, plant and equipment. Subsequently, all cost directly incurred to prepare an identified mineral asset for production is capitalised to mine development assets. Amortisation of these assets commences once these assets are available for use, which is expected to be when the mine is in commercial production. These assets will be measured at cost less accumulated amortisation and impairment losses. |
NOTES TO THE CONSOLIDATED FINANCIAL STATEMENTS continued
For the year ended 31 December 2025
| | | | | |
Figures in million – SA rand | | | Mine development, infrastructure and other | Land, mineral rights and rehabilitation | Exploration and evaluation assets |
| | | | | |
| | | | | |
Balance at beginning of the year | | | | | |
| | | | | |
Borrowings costs capitalised | | | | | |
Change in estimates of rehabilitation assets | | | | | |
| | | | | |
Derecognition of property, plant and equipment1 | | | | | |
Transfers between classes of property, plant and equipment | | | | | |
Transfer from assets held for sale | | | | | |
Assets acquired on acquisition of subsidiaries | | | | | |
Foreign currency translation | | | | | |
Balance at end of the year | | | | | |
Accumulated depreciation, amortisation and impairment | | | | | |
Balance at beginning of the year | | | | | |
Amortisation and depreciation | | | | | |
Impairment and reversal of impairment | | | | | |
| | | | | |
Derecognition of property, plant and equipment1 | | | | | |
Depreciation capitalised to inventory | | | | | |
Foreign currency translation | | | | | |
Balance at end of the year | | | | | |
Carrying value at end of the year | | | | | |
1Included in the derecognition during the year, is short-term ore reserve development, which was capitalised up to 31 December 2022 and fully depreciated by 2024, and
was derecognised, as well as other items of property, plant and equipment derecognised as no future economic benefits are expected from these assets' use
NOTES TO THE CONSOLIDATED FINANCIAL STATEMENTS continued
For the year ended 31 December 2025
| | | | | |
Figures in million – SA rand | | | Mine development, infrastructure and other | Land, mineral rights and rehabilitation | Exploration and evaluation assets |
| | | | | |
| | | | | |
Balance at beginning of the year | | | | | |
Borrowings costs capitalised | | | | | |
| | | | | |
Change in estimates of rehabilitation assets | | | | | |
| | | | | |
Derecognition of property, plant and equipment1 | | | | | |
Transfers between classes of property, plant and equipment | | | | | |
Transfers to/from right-of-use assets | | | | | |
Transfer to assets held for sale | | | | | |
Assets acquired on acquisition of subsidiaries | | | | | |
Foreign currency translation | | | | | |
Balance at end of the year | | | | | |
Accumulated depreciation, amortisation and impairment | | | | | |
Balance at beginning of the year | | | | | |
Amortisation and depreciation | | | | | |
| | | | | |
| | | | | |
Derecognition of property, plant and equipment1 | | | | | |
Transfer to asset held for sale | | | | | |
Depreciation capitalised to inventory | | | | | |
Foreign currency translation | | | | | |
Balance at end of the year | | | | | |
Carrying value at end of the year | | | | | |
1Included in the derecognition during the year, is short-term ore reserve development, which was capitalised up to 31 December 2021 and fully depreciated by 2024, and
was derecognised, as well as other items of property, plant and equipment as no future economic benefits are expected from its use
NOTES TO THE CONSOLIDATED FINANCIAL STATEMENTS continued
For the year ended 31 December 2025
| | | | | |
Figures in million – SA rand | | | Mine development, infrastructure and other | Land, mineral rights and rehabilitation | Exploration and evaluation assets |
| | | | | |
| | | | | |
Balance at beginning of the year | | | | | |
| | | | | |
Change in estimates of rehabilitation assets | | | | | |
| | | | | |
Derecognition of property, plant and equipment1 | | | | | |
Transfers between classes of property, plant and equipment | | | | | |
Transfers to right-of-use assets | | | | | |
Gain on remeasurement of previous interest in joint operation | | | | | |
Derecognition with deemed disposal of interest in joint operation2 | | | | | |
Assets acquired on acquisition of subsidiaries | | | | | |
Foreign currency translation | | | | | |
Balance at end of the year | | | | | |
Accumulated depreciation, amortisation and impairment | | | | | |
Balance at beginning of the year | | | | | |
Amortisation and depreciation | | | | | |
| | | | | |
| | | | | |
Derecognition of property, plant and equipment2 | | | | | |
Derecognition with deemed disposal of interest in joint operation3 | | | | | |
Depreciation capitalised to inventory | | | | | |
Foreign currency translation | | | | | |
Balance at end of the year | | | | | |
Carrying value at end of the year | | | | | |
1Included in the derecognition during the year, is short-term ore reserve development, which was capitalised up to 31 December 2022 and fully depreciated by 2023, and
was derecognised, as well as other items of property, plant and equipment as no future economic benefits are expected from its use
2The carrying value of property, plant and equipment derecognised with disposal of interest in a joint operation amounts to R1,027 million
NOTES TO THE CONSOLIDATED FINANCIAL STATEMENTS continued
For the year ended 31 December 2025
15. Right-of-use assets
|
Accounting policy Right-of-use assets comprise land and related infrastructure, mining equipment, vehicles and office rentals (included in the mine development, infrastructure and other asset class) of which none meet the definition of investment property. These right-of-use assets comprise the initial measurement of the corresponding lease liability, any initial direct costs incurred by the lessee, and an estimate of costs to be incurred by the lessee in dismantling and removing the underlying asset, restoring the site on which it is located or restoring the underlying asset. Right-of-use assets are subsequently measured at cost less accumulated depreciation and impairment losses if applicable. The assets are depreciated over the shorter period of the lease term and useful life of the underlying asset. If a lease transfers ownership of the underlying asset, or the cost of the right-of-use asset reflects that the Group expects to exercise a purchase option, the related right-of-use asset is depreciated over the useful life of the underlying asset. The depreciation starts at the commencement date of the lease. See note 28 for additional detail. |
| | | | |
Figures in million – SA rand | | | | |
Balance at beginning of the year | | | | |
Additions and modifications | | | | |
Right-of-use assets acquired on acquisition of subsidiaries | | | | |
Assets derecognised with deemed disposal of interest in joint operation | | | | |
Impairment of right-of-use assets - mining assets | | | | |
| | | | |
Transfers and other movements | | | | |
Foreign currency translation | | | | |
Balance at end of the year | | | | |
NOTES TO THE CONSOLIDATED FINANCIAL STATEMENTS continued
For the year ended 31 December 2025
16. Acquisitions
|
Significant accounting judgements and estimates Expected future cash flows used to determine the fair value of, inter alia, property, plant and equipment and contingent consideration are inherently uncertain and could materially change over time. The fair value is significantly affected by a number of factors including reserves and production estimates, together with economic factors such as the expected commodity price, foreign currency exchange rates, and estimates of production costs, future capital expenditure and discount rates. Acquisitions are assessed to determine if they qualify as business combinations or asset acquisitions in terms of the requirements of IFRS 3 Business Combinations (IFRS 3) where the Group obtains control over an entity. In order to apply IFRS 3, the assets acquired and liabilities assumed, should constitute a business as defined in IFRS 3. Accordingly, management assesses whether the activities consist of inputs and processes applied to those inputs that have the ability to contribute to the creation of outputs. If a transaction is not deemed to be a business combination, it is accounted for as an asset acquisition outside of the scope of IFRS 3. The IFRS 3 scope assessment could significantly impact the accounting treatment applied. Accounting policy Business combinations The acquisition method of accounting is used to account for business combinations by the Group. The consideration transferred for the acquisition of a business is the fair value of the assets transferred, the liabilities incurred and the equity interests issued by the Group. The consideration transferred includes the fair value of any asset or liability resulting from a contingent consideration arrangement. Any contingent consideration is measured at fair value at the date of acquisition. Acquisition-related costs are expensed as incurred. Identifiable assets acquired and liabilities and contingent liabilities assumed in a business combination are measured initially at their fair values at the acquisition date. If a business combination is achieved in stages, any previously held equity interest is re-measured at its acquisition-date fair value, and any resulting gain or loss is recognised in profit or loss or other comprehensive income, as appropriate. The fair value of the previously held interest is then considered in the determination of goodwill. The same approach is applied where the previous interest was held in a joint operation. On an acquisition-by-acquisition basis, the Group recognises any NCI in the acquiree either at fair value or at the NCI’s proportionate share of the acquiree’s net assets. Subsequently, the carrying amount of NCI is the amount of the interest at initial recognition plus the NCI’s share of the subsequent changes in equity, plus or minus changes in the portion of interest of the equity of the subsidiary not attributable, directly or indirectly, to Sibanye-Stillwater shareholders. The excess of the consideration transferred, the amount of any NCI in the acquiree and the acquisition-date fair value of any previous equity interest in the acquiree over the fair value of the identifiable net assets acquired is recorded as goodwill. If this is less than the fair value of the net assets of the subsidiary acquired in the case of a bargain purchase, the difference is a gain recognised directly in profit or loss. Asset acquisitions For acquisitions outside the scope of IFRS 3, the purchase consideration is allocated to identifiable assets and liabilities based on their relative fair values. Assets and liabilities that are initially measured at an amount other than cost are recognised at their respective carrying amounts as specified in the applicable accounting standards. To the extent that contingent consideration is payable in an asset acquisition based on future production, such variable payments are only recognised as expenses as and when incurred. |
NOTES TO THE CONSOLIDATED FINANCIAL STATEMENTS continued
For the year ended 31 December 2025
16.1 Metallix Refining (Metallix) business combination
Sibanye-Stillwater concluded the acquisition of Metallix on 4 September 2025 (effective date) by acquiring 100% of the Metallix group of
entities for a cash consideration of US$129 million. Metallix operates two processing and recycling operations in Greenville, North Carolina
and produces recycled precious metals, including gold, silver and platinum group metals, primarily from industrial waste streams. Metallix
has a global customer base, which it services from the UK and South Korea, in addition to its customers in the US. Metallix will complement
the Group’s US recycling operations in Montana and Reldan in Pennsylvania, adding processing capacity, proprietary technology and
knowledge and experience.
Metallix's financial results were consolidated from the effective date. For the four months ended 31 December 2025, Metallix contributed
revenue of R1,658 million and a loss of R334 million to the Group's results. Ignoring the depreciation of fair value adjustments relating to
property, plant and equipment and intangible assets, as well as the fair value adjustment relating to inventory recognised in cost of sales for
the four months ended 31 December 2025, Metallix would have contributed approximately R50 million profit. Total revenue and total net
loss of the Group for the year ended 31 December 2025 would have been R132,810 million and R4,513 million had the acquisition been
effective from 1 January 2025, after taking into account amortisation of fair value adjustments to property, plant and equipment, intangible
assets and the cost of sales adjustment relating to inventory. In determining these amounts, management assumed that the fair value
adjustments that arose on the date of acquisition would be the same if the acquisition occurred on 1 January 2025. The functional currency
of Metallix is the US dollar.
The purchase price allocation (PPA) on the effective date was prepared on a provisional basis in accordance with IFRS 3 for, amongst
others, inventory, accounts receivable and accounts payable, contingent liabilities, provisions, as well as any resultant deferred tax
implications. If new information obtained within one year of the acquisition date, about facts and circumstances that existed at the
acquisition date, identifies adjustments to the below amounts or any additional provisions that existed at the date of acquisition, then the
accounting for the acquisition will be revised.
Consideration
The fair value of the consideration is as follows:
| | |
Figures in million – SA rand | | |
| | |
| | |
Metallix acquisition related costs
The Group incurred total acquisition related costs of R175 million for the year ended 31 December 2025 on advisory and legal fees. These
costs are recognised as transaction costs in profit or loss during the period in which incurred.
Identified assets acquired and liabilities assumed
The following table summarises the recognised amounts of assets acquired and liabilities assumed at the acquisition date:
| | |
Figures in million – SA rand | | |
Property, plant and equipment2 | | |
| | |
| | |
| | |
Trade and other receivables | | |
Cash and cash equivalents3 | | |
| | |
| | |
Tax and royalties payable | | |
| | |
Fair value of identifiable net assets acquired1 | | |
1Carrying value approximates fair value, except as detailed in footnote 2 below
2 Fair value of assets and liabilities for which the carrying value does not approximate fair value, excluding those not within the IFRS 3 measurement scope, were
determined as follows:
•The fair value of property, plant and equipment was determined based on a combination of valuation approaches for specific asset classes. The valuation techniques
includes using a market approach (sales comparables)and an indirect cost approach based on indexed historical costs (depreciated replacement cost)
•The fair value of intangible assets was determined based on the relief-from-royalty method which considers the discounted estimated royalty payments that are
avoided as a result of ownership as well as an income approach (multi-period excess earnings method) which considers the present value of future net cash flows to
value the vendor relationships. A cost approach was used for the valuation of Metallix software as it does not generate cash flows independently
•The fair value of inventories was based on an assessment of net realisable value
3 The transaction results in net cash paid of R1,894 million based on cash and cash equivalents acquired of R383 million and cash consideration paid of R2,277 million
NOTES TO THE CONSOLIDATED FINANCIAL STATEMENTS continued
For the year ended 31 December 2025
Goodwill
Goodwill arising from the business combination is as follows:
| | |
Figures in million – SA rand | | |
| | |
Fair value of identifiable net assets acquired | | |
| | |
The goodwill is attributable to the human capital and the premium paid for the synergies and benefits expected to be derived from the
Group's recycling business across the US.
The table below provides a summary of the net cash paid on the acquisition of Metallix during the year ended 31 December 2025:
| | |
Figures in million – SA rand | | |
Metallix acquisition, net of cash acquired | | |
| | |
Cash and cash equivalents acquired | | |
16.2 Reldan business combination (revised)
Sibanye-Stillwater successfully concluded the acquisition of the Reldan on 15 March 2024 by acquiring 100% of the shares and voting
interest. Reldan is a recycling group which reprocesses various waste streams to recycle precious metals and is based in Pennsylvania, US. In
addition to Reldan's US operations, it has also established a presence in Mexico and India where it has forged strategic joint ventures with
local partners. The acquisition complements the Group's US PGM recycling business in Montana and enhances its exposure to the circular
economy. Reldan's financial results were consolidated from the effective date and the functional currency of Reldan is the US dollar.
The PPA for the six months ended 30 June 2024, and year ended 31 December 2024, was prepared on a provisional basis in accordance
with IFRS 3. During the 12-month measurement period commencing on the acquisition date, management provisionally revised the initial
PPA previously recognised at 30 June 2024 and at 31 December 2024 due to new information obtained in accordance with IFRS 3. During
the six months ended 30 June 2025, a final payment amounting to US$5 million (R96 million) was made to the sellers. This relates to a process
completed by March 2025, whereby the sellers determined that an additional amount was due to them in terms of the purchase and sales
agreement relating to their tax obligations. Goodwill and other payables was revised for 31 December 2024 as a result of the additional
payment.
The following table summarises the differences from amounts reported at 31 December 2024 due to the final revised PPA:
| | | | |
Figures in million – SA rand | | |
| | | | |
Fair value of identifiable net assets acquired | | | | |
| | | | |
| | | | |
Fair value of NCI put liability2 | | | | |
| | | | |
| | | | |
| | | | |
1 Cash consideration amounted to US$155.9 million (R2,920 million) paid in 2024. Due to new information obtained, cash consideration paid on the Reldan acquisition
increased by US$5 million (R96 million) which was paid by 31 March 2025
2 Related to an NCI put option in respect of an intermediate Reldan holding company which holds an interest in the Indian joint venture operations, and may require the
Group to purchase shares from the non-controlling shareholders of Reldan if exercised by the NCI. The put option can be exercised by the NCI between three and five
years after the effective date at market price
3 The goodwill is attributable to the human capital and the premium paid for the synergies and benefits expected to be derived from enhancing the Group's recycling
business across the US, Mexico and India
4 US tax legislation requires the purchase consideration to be allocated in order to determine future tax deduction. An amount of R1,188 million (US$63 million) is estimated
to be deductible for tax purposes in the future
5 The calculation of goodwill, previously amounting to R283 million as revised at 31 December 2024, was finalised at 31 March 2025 based on new information obtained
before the 12 months remeasurement period in terms of IFRS 3 was completed. The net adjustments based on the new information obtained resulted in additional
goodwill of R96 million recognised in the prior year
NOTES TO THE CONSOLIDATED FINANCIAL STATEMENTS continued
For the year ended 31 December 2025
17. Goodwill and other intangibles
|
Significant accounting judgements and estimates Goodwill is tested for impairment on an annual basis and whenever impairment indicators are identified. Expected future cash flows used to determine the recoverable amount of property, plant and equipment and goodwill are inherently uncertain and could materially change over time. The recoverable amount is significantly affected by a number of factors including reserves and production estimates, together with economic factors such as the expected commodity price, foreign currency exchange rates, and estimates of production costs, future capital expenditure and discount rates (see note 10). An individual operating mine does not have an indefinite life because of the finite life of its reserves. The allocation of goodwill to an individual mine will result in an eventual goodwill impairment due to the depleting nature of the mine. Accounting policy Goodwill is stated at cost less accumulated impairment losses. Goodwill is not amortised. In accordance with the requirements of IAS 36 Impairment of Assets, the Group performs its annual impairment review of goodwill at each financial year end or whenever there are impairment indicators to establish whether there is any indication of impairment to goodwill. Goodwill is allocated to CGUs for the purpose of impairment testing. The allocation is made to those CGUs or groups of CGUs that are expected to benefit from the business combination in which the goodwill arose. An impairment is made if the carrying amount exceeds the recoverable amount. The recoverable amount is determined as the higher of “value in use” and “fair value less cost to sell”, based on the cash flows over the life of the CGUs and discounted to a present value at an appropriate discount rate. Impairment losses on goodwill are not reversed. Gains and losses on the disposal of an entity include the carrying amount of goodwill allocated to the entity sold. Other intangible assets, including customer relationships, software, patents and trademarks that are acquired by the Group and have finite useful lives, are measured at cost less accumulated amortisation and any accumulated impairment losses. Amortisation on intangible assets is calculated on a straight-line method over the estimated useful lives, and is generally recognised in profit or loss. The estimated useful lives for intangible assets are as follows: •Vendor relationships - 5 - 10 years •Brand: 5 years •Software: 3 years |
| | | | |
Figures in million – SA rand | | | | |
| | | | |
Balance at beginning of the year | | | | |
Goodwill on acquisition of subsidiaries | | | | |
| | | | |
Foreign currency translation | | | | |
Carrying value at end of the year1 | | | | |
| | | | |
| | | | |
Balance at beginning of the year | | | | |
Intangible assets acquired on acquisition of subsidiaries | | | | |
| | | | |
Foreign currency translation | | | | |
Balance at end of the year | | | | |
| | | | |
Accumulated amortisation and impairment | | | | |
Balance at beginning of the year | | | | |
| | | | |
Foreign currency translation | | | | |
| | | | |
Balance at end of the year | | | | |
Carrying value at end of the year2 | | | | |
Total goodwill and other intangibles | | | | |
1The goodwill arose on the acquisition of the below subsidiaries:
•SFA (Oxford), amounting to R123 million allocated to the Stillwater (R60 million), Rustenburg (R44 million) and Kroondal (R18 million) CGUs, where it is tested for
impairment. During 2023, the R60 million goodwill allocated to Stillwater was impaired (see note 10). The remaining carrying value of goodwill related to the SFA (Oxford)
acquisition amounts to R63 million at 31 December 2023
•Qinisele Resources, amounting to R54 million and fully impaired by 31 December 2020
•Cooke, amounting to R737 million which was fully impaired by 31 December 2020
•Aquarius Platinum (South Africa) Proprietary Limited (Aquarius), amounting to R401 million allocated to the Kroondal (R134 million) and the Rustenburg operation (R267
million) CGUs, where it is tested for impairment. No impairment has been recognised
•Stillwater, amounting to US$450 million (R5,874 million), at the exchange rate on the acquisition effective date) allocated to the Stillwater CGU. During 2023, the entire
goodwill amount allocated to the Stillwater CGU with a carrying value of R8,352 million was impaired (see note 10)
•DRDGOLD, amounting to R35 million allocated to the DRDGOLD CGU, where it is tested for impairment. No impairment has been recognised
NOTES TO THE CONSOLIDATED FINANCIAL STATEMENTS continued
For the year ended 31 December 2025
•Sandouville, amounting to R23 million allocated to the Sandouville CGU. During 2023, the entire goodwill amount allocated to the Sandouville CGU was impaired (see
note 10)
•Reldan, amounting to R283 million allocated to the Reldan CGU, where it is tested for impairment. During 2025, the PPA was revised which resulted in additional
goodwill of R96 million, resulting in a total goodwill R379 million (see note 16.2). Additional goodwill of R9 million was recognised on the acquisition of Metallix (see note
16.1) which is reported with Reldan
2Included in the balance at 31 December 2025, is an intangible asset at the Pennsylvania recycling operation in respect of vendor relationships - manufacturers amounting
to R902 million (2024: R1,146 million) with a remaining amortisation period of approximately eight years. Also included is an intangible asset at the North Carolina recycling
operation in respect of vendor relationships amounting to R106 million with a remaining amortisation period of approximately eight years
The recoverable amount of goodwill was calculated based on the fair value less cost of disposal of the CGUs to which to goodwill was
allocated.
Goodwill amounting to R1,188 million (US$63 million) is estimated to be deductible for tax purposes in respect of the Reldan acquisition (see
note 16.2).
The Group’s estimates and assumptions used in the 31 December 2025 impairment testing include:
| | | | | | | | | | | |
| | | | Europe (Sandouville nickel refinery)2 | | Pennsylvania site recycling |
| | | | | | | | | | | |
| | | | | | | | | | | |
Average PGM (4E) basket price4,5 | | | | | | | | | | | |
Average PGM (2E) basket price5 | | | | | | | | | | | |
| | | | | | | | | | | |
| | | | | | | | | | | |
| | | | | | | | | | | |
| | | | | | | | | | | |
| | | | | | | | | | | |
Nominal discount rate — South Africa6,7 | | | | | | | | | | | |
Nominal discount rate — US7 | | | | | | | | | | | |
Nominal discount rate — Europe7 | | | | | | | | | | | |
Nominal discount rate — Australia7 | | | | | | | | | | | |
Inflation rate — South Africa3,8 | | | | | | | | | | | |
| | | | | | | | | | | |
| | | | | | | | | | | |
Inflation rate — Australia8 | | | | | | | | | | | |
| | | | | | | | | | | |
*No impairment assessment performed at 31 December 2024 and 2025 as carrying values reduced to nil due to change in the rehabilitation provision
1Includes the operating gold mines Driefontein, Kloof and Beatrix
2The Keliber impairment assessment at 31 December 2025 applied an average lithium hydroxide price of US$17,475/t (2024: US$18,640/t, 2023: US$22,933/t), nominal
discount rate of 10.1% (2024: 9.9%, 2023: 10.1%), inflation rate of 2% (2024: 2%, 2023: 2%) and a life-of-mine of 20 years (2024: 23 years, 2023:24 years)
3The estimates and assumptions used in the impairment assessment of the Burnstone project include an average gold price of R1,670,512/kg (2024: R1,189,493/kg, 2023:
R1,012,625/kg), inflation rate of 3.5% (2024: 5.0%, 2023: 6.0%) and life-of-mine of 23 years (2024: 25 years, 2023: 25 years)
4No impairment assessment was performed for Mimosa at 31 December 2025. The average PGM basket price used on the Mimosa equity-accounted joint venture at 31
December 2024 was R25,433/4Eoz (2023: R26,632/4Eoz)
5The average prices and the exchange rate were derived by considering various bank and commodity broker consensus forecasts
6Nominal discount rate for the Burnstone project is 15.2% (2024: 17.5%, 2023: 18.9%) and for the equity-accounted joint venture Mimosa at 31 December 2024 was 22.7%
(2023: 31.2%)
7The nominal discount rate is calculated as the weighted average cost of capital of the respective CGUs
8The inflation rate is based on the expected forecast inflation rate in the geographical region which most affects the CGU's cash flows
9Periods longer than five years are considered appropriate based on the nature of the operations since a formally approved life-of-mine plan is used to determine cash
flows over the life of each mine based on the available reserves
NOTES TO THE CONSOLIDATED FINANCIAL STATEMENTS continued
For the year ended 31 December 2025
The cash flows are based on the annual life-of-mine plans that takes into account the following:
•Proved and probable ore reserves of the CGU and conversion of resources where appropriate
•Revenue based on the consensus forecast commodity prices and operating costs
•Sustaining capital expenditure estimates over the life-of-mine plan
•Developmental capital expenditure, where applicable
Results of impairment assessments for the Group's CGUs and goodwill allocated to CGUs
Other than the impairment recognised in note 10, no further impairment was recognised at 31 December 2025 for the Group's CGUs, or any
CGUs with allocated goodwill.
NOTES TO THE CONSOLIDATED FINANCIAL STATEMENTS continued
For the year ended 31 December 2025
18. Equity-accounted investments
|
Significant accounting judgements and estimates Joint arrangements Judgement is required to determine when the Group has joint control, which requires an assessment of the relevant activities and when the decisions in relation to those activities require unanimous consent. The Group has determined that the relevant activities for its joint arrangements are those relating to the operating and capital decisions of the arrangement, such as the approval of the budget and the capital expenditure programme for each year, and appointing, remunerating and terminating the key management personnel or service providers of the joint arrangement. The considerations made in determining joint control are similar to those necessary to determine control over subsidiaries. Judgement is also required to classify a joint arrangement as either a joint operation or a joint venture. Classifying the arrangement requires the Group to assess their rights and obligations arising from the arrangement. Specifically, it considers: •The structure of the joint arrangement – whether it is structured through a separate vehicle •When the arrangement is structured through a separate vehicle, the Group also considers the rights and obligations arising from: –the legal form of the separate vehicle –the terms of the contractual arrangement This assessment often requires significant judgement, and a different conclusion on joint control and also whether the arrangement is a joint operation or a joint venture may materially impact the accounting. Carrying value of Mimosa and related mineral reserves and mineral resources estimates The Group reviews and tests the carrying value when events or changes in circumstances suggest that the carrying amount may not be recoverable by comparing expected future cash flows to the carrying value. Expected future cash flows used to determine the value in use and fair value less costs to sell of Mimosa are inherently uncertain and could materially change over time. These are significantly affected by a number of factors including reserves and production estimates, together with economic factors such as spot and future PGM prices, discount rates, foreign currency exchange rates, estimates of costs to produce reserves and future capital expenditure. Mimosa functional currency The functional currency of Mimosa, which is domiciled in Zimbabwe, has been determined as US dollar. During 2024, the Zimbabwean government introduced a new gold-backed currency replacing the Zimbabwean dollar, referred to as the Zimbabwe Gold (ZiG). As a result of this change, management reassessed whether there is a change in the functional currency of Mimosa. This assessment depends on the primary economic environment in which the company operates, which is considered to be the environment in which it generates and expends cash. These considerations include the currency primarily influencing sales prices, the country whose competitive forces and regulations mainly determine sales prices and the currency that influences labour, material and other costs of production. Judgements and assumptions made in determining the functional currency may have a significant impact on the results presented for the Group. The determining factors in the above assessment were: •The currency that mainly influences sales prices: Sales are invoiced and settled in US dollar •The currency of the country whose competitive forces and regulations mainly determine the sales prices: The competitive forces and regulations of the US primarily influences sales prices •The currency that mainly influences labour, material and other costs: The majority of operating costs are settled in US dollar Accounting policy The Group’s interest in equity-accounted investees comprise interests in associates and joint ventures. Associates are those entities in which the Group has significant influence, but not control or joint control, over the financial and operating policies. Joint ventures are arrangements in which the Group has joint control, whereby the Group has rights to the net assets of the arrangement, rather than rights to its assets and obligations for its liabilities. Interests in associates and joint ventures are accounted for using the equity method. The interests are initially recognised at cost using the same principles as with business combinations. Subsequent to initial recognition, the consolidated financial statements include the Group’s share of profit or loss and other comprehensive income of equity-accounted investees until the date on which significant influence or joint control ceases. For so-called farm-in/farm-out arrangements where another party is earning into a joint venture, the Group does not recognise any expenses incurred by the other participant to the arrangement and no equity accounted earnings are recognised until the farm-in/farm-out arrangement is completed. |
NOTES TO THE CONSOLIDATED FINANCIAL STATEMENTS continued
For the year ended 31 December 2025
|
Results of associates and joint ventures are equity-accounted using the results of their most recent audited annual financial statements or unaudited management accounts. Any losses from associates are brought to account in the consolidated financial statements until the interest in such associates is written down to zero. The interest includes any long-term interests that in substance form part of the entity’s net investment in the equity-accounted investee, for example long-term receivables for which settlement is neither planned nor likely to occur in the foreseeable future. Thereafter, losses are accounted for only insofar as the Group is committed to providing financial support to such associates. The carrying value of an equity-accounted investment represents the cost of the investment, including goodwill, the proportionate share of the post-acquisition retained earnings and losses, any other movements in reserves, any impairment losses and loans to or from the equity- accounted investee. The carrying value together with any long-term interests that in substance form part of the net investment in the equity-accounted investee is assessed annually for existence of indicators of impairment and if such exist, the carrying amount is compared to the recoverable amount, being the higher of value in use or fair value less costs to sell. If an impairment in value has occurred, it is recognised in the period in which the impairment arose. Indicators of impairment include a significant or prolonged decline in the investments fair value below its carrying value. |
The Group holds the following equity-accounted investments:
| | | | |
Figures in million – SA rand | | | | |
| | | | |
| | | | |
| | | | |
Other equity-accounted investments3 | | | | |
Total equity-accounted investments | | | | |
1Associate
2Joint venture
3Includes the Group's investment in Glint Incorporated (associate) acquired during 2022. The investment has a carrying value of R77 million (2024: R118 million, 2023:
R92 million) at 31 December 2025. The balance also includes the Group's equity-accounted investments in Mexico and India, acquired through the Reldan business
combination (see note 16.2) which has a combined carrying value of R223 million (2024: R258 million) at 31 December 2025
18.1 Rand Refinery
Sibanye-Stillwater has a 44.4% interest in Rand Refinery Proprietary Limited (Rand Refinery), a company incorporated in South Africa, which
is involved in the refining of bullion and by-products sourced from, inter alia, South African and foreign gold producing mining companies.
Rand Refinery is accounted for using the equity method.
The movement in the equity-accounted investment in Rand Refinery for the year is as follows:
| | | | |
Figures in million – SA rand | | | | |
Balance at beginning of the year | | | | |
Share of results of equity-accounted investee after tax1 | | | | |
| | | | |
Balance at end of the year | | | | |
1Since Rand Refinery has a 31 August year end, it is equity-accounted based on its latest management accounts for the period ended 30 November
NOTES TO THE CONSOLIDATED FINANCIAL STATEMENTS continued
For the year ended 31 December 2025
The Group’s interest in the summarised financial statements of Rand Refinery is as follows:
| | | | |
Figures in million – SA rand | | | | |
| | | | |
Total comprehensive income | | | | |
| | | | |
| | | | |
| | | | |
| | | | |
| | | | |
Reconciliation of the total investment in Rand Refinery with attributable net assets: | | | | |
| | | | |
| | | | |
| | | | |
| | | | |
Total investment in Rand Refinery | | | | |
1The dividend received relates to the dividend received from Rand Refinery after 30 November. The total dividend received for 2024 amounted to R221 million (2023:
R233 million)
2The investment in equity-accounted investee was fair valued at 1 July 2002, the date when significant influence was obtained
3Reconciling items relate to adjustments on consolidation of DRDGOLD’s interest in Rand Refinery
18.2 Mimosa
Sibanye-Stillwater has a 50% interest in Mimosa Investments Limited (Mimosa), which owns and operates the Mimosa mine. The mine
produces platinum and is situated in Zimbabwe.
The movement in the equity-accounted investment in Mimosa for the year is as follows:
| | | | |
Figures in million – SA rand | | | | |
Balance at the beginning of the year | | | | |
Share of results of equity-accounted investee after tax | | | | |
| | | | |
| | | | |
Foreign currency translation | | | | |
Balance at end of the year | | | | |
NOTES TO THE CONSOLIDATED FINANCIAL STATEMENTS continued
For the year ended 31 December 2025
The Group’s interest in the summarised financial statements of Mimosa is as follows:
| | | | |
Figures in million – SA rand | | | | |
| | | | |
Amortisation and depreciation | | | | |
| | | | |
| | | | |
| | | | |
| | | | |
| | | | |
| | | | |
Other comprehensive income | | | | |
Total comprehensive income | | | | |
| | | | |
Property, plant and equipment1 | | | | |
| | | | |
| | | | |
Cash and cash equivalents | | | | |
| | | | |
| | | | |
Non-current financial liabilities2 | | | | |
Other non-current liabilities | | | | |
| | | | |
Current financial liabilities2 | | | | |
Other current liabilities | | | | |
| | | | |
Reconciliation of the total investment in Mimosa with attributable net assets: | | | | |
| | | | |
Impairment of investment in Mimosa | | | | |
| | | | |
Total investment in Mimosa | | | | |
1The Group impaired the property, plant and equipment of Mimosa at 31 December 2025 (see note 10) which amounted to R1,071 million (2023: R3,728 million of which the
Group's 50% share amounted to R535 million (2023: R1,864 million) amounting to R461 million (2023:R1,384 million) net of tax (see note 12.3))
2Non-current and current financial liabilities (excluding trade and other payables and provisions) were zero for all periods presented
3The reconciling items include the difference between the carrying amount and fair value of the Mimosa’s identifiable assets and liabilities on acquisition less accumulated
amortisation, and foreign exchange differences on translation of assets and liabilities of the foreign joint venture
Repatriation of funds from Zimbabwe is subject to regulatory approval in Zimbabwe.
18.3 Peregrine
On 29 June 2018, Sibanye-Stillwater announced that it had entered into an agreement with Regulus Resources Inc. (Regulus) and a newly
formed subsidiary of Regulus, Aldebaran, creating a strategic partnership in order to unlock value at its Altar copper-gold project in San
Juan Province, Argentina (Altar Project), currently held in the US PGM operations. Under the terms of the agreement, Stillwater Canada LLC,
an indirect, wholly-owned subsidiary of Sibanye-Stillwater (Stillwater Canada), entered into an option and joint venture agreement with
Aldebaran, whereby Aldebaran has the option to earn into a maximum 80% interest in a wholly-owned subsidiary of Stillwater Canada,
Peregrine Metals Limited (Peregrine) which owns the Altar Project (Arrangement Agreement).
The consideration for Aldebaran to acquire up to an 80% interest in the Altar Project, included:
•An upfront cash payment of US$15 million to Sibanye-Stillwater on closing of the Arrangement Agreement
•19.9% of the shares of Aldebaran
•A commitment from Aldebaran to carry the next US$30 million of exploration spend at the Altar Project over a maximum of five
years(inclusive of 2018 drilling that was conducted between February and May of 2018) as an initial earn-in of a 60% interest in the Altar
Project (the Initial Earn-in)
Pursuant to the Arrangement Agreement, Aldebaran also received the right to elect to earn-in an additional 20% interest in the Altar
Project by spending an additional US$25 million exploration expenditure over a three-year period following the Initial Earn-in.
NOTES TO THE CONSOLIDATED FINANCIAL STATEMENTS continued
For the year ended 31 December 2025
Peregrine was a subsidiary of Stillwater Canada. On 25 October 2018, Aldebaran issued an aggregate of 15,449,555 Aldebaran shares to
Sibanye-Stillwater, representing 19.9% of the current 77,635,957 issued and outstanding Aldebaran shares, and made an upfront cash
payment of US$15 million to Sibanye-Stillwater in accordance with the Arrangement Agreement. From this date, Stillwater Canada and
Aldebaran act together to direct the relevant activities of and, therefore, collectively control Peregrine. As a result of the loss of control,
Peregrine was derecognised as a subsidiary and accounted for as an equity-accounted investment. On 14 August 2023, Aldebaran
successfully completed the Initial Earn-in and elected to earn-in an additional 20% in Peregrine over a three-year period for an additional
exploration expenditure of US$25 million. On 15 April 2025, the additional earn-in process was completed which meant that the farm-in/
farm-out arrangement ceased and the Group commenced equity-accounting its remaining 20% share in Peregrine prospectively from this
date.
On 7 November 2024, Aldebaran announced that they have entered into a joint venture agreement with Nuton Holdings Limited (Nuton),
which has subsequently been terminated at the end of 2025. Under the terminated agreement, Nuton could have acquired a 20% indirect
interest in the Altar Project by making staged payments totalling US$250 million. Final payment in terms of the agreement was expected to
be made in 2026 if Nuton agreed to proceed. At 31 December 2025, the Group had a 20% (2024: 40%, 2023: 40%) legal interest in Peregrine.
The equity-accounted investment in Peregrine movement for the year is as follows:
| | | | |
Figures in million – SA rand | | | | |
Balance at the beginning of the year | | | | |
| | | | |
Share of results of equity-accounted investee after tax | | | | |
Impairment of loan to Peregrine | | | | |
Foreign currency translation | | | | |
Balance at end of the year | | | | |
The Group’s interest in the summarised financial statements of Peregrine is as follows:
| | | | |
Figures in million – SA rand | | | | |
| | | | |
| | | | |
| | | | |
| | | | |
| | | | |
Reconciliation of the total investment in Peregrine with attributable net assets: | | | | |
| | | | |
| | | | |
Total investment in Peregrine | | | | |
1For comparative periods, disclosed on the basis that Aldebaran would successfully complete their earn-in obligation in terms of the agreement as described above. The
earn-in was successfully completed during 2025
2The reconciling items include the difference between the carrying amount and fair value of the Peregrine’s identifiable assets and liabilities on acquisition less
accumulated amortisation, and foreign exchange differences on translation of assets and liabilities of the foreign equity-accounted investment. This also includes the
dilution in the interest resulting from the earn-in requirements as well as movements in net assets during the farm-in/farm-out period during which equity-accounting was
suspended
18.4 Cash additions to equity-accounted investments
The table below summarises the cash paid during the year for investments in equity-accounted investees:
| | | | |
Figures in million – SA rand | | | | |
| | | | |
| | | | |
| | | | |
| | | | |
NOTES TO THE CONSOLIDATED FINANCIAL STATEMENTS continued
For the year ended 31 December 2025
19. Other investments
|
Significant accounting judgements Where the Group holds less than 20% interest in a company, the assessment of whether there is significant influence and hence an equity- accounted investment may involve judgement. These judgements typically include the extent of representation on the board of directors, other involvement in the company such as technical committee, any other contractual arrangements as well as the effective influence that the particular shareholding interest provides. A different conclusion could have a significant impact on the measurement, presentation and disclosure of the particular investment. |
Accounting policy On initial recognition of an equity investment that is not held for trading, the Group may make an irrevocable election to present subsequent changes in the investment’s fair value in other comprehensive income (FVTOCI). This election is made on an investment-by- investment basis. These investments are subsequently measured at fair value, with dividends recognised in profit or loss unless the dividend clearly represents a recovery of part of the cost of the investment. Other net gains and losses are recognised in OCI (in the mark-to-market reserve) and are never reclassified to profit or loss. Investments, other than investments in equity instruments, are measured at amortised cost if not measured at fair value through profit or loss (FVTPL), and is held with the objective to collect contractual cash flows and its contractual terms give rise on specified dates to cash flows that are solely payments of principal or interest on the principal amount outstanding. All investments not classified as measured at amortised cost or at FVTOCI as described above are measured at FVTPL, with subsequent changes in the investment's fair value recognised in profit or loss. In addition, on initial recognition, the Group may irrevocably designate an investment that otherwise meets the requirements to be measured at amortised cost as measured at FVTPL if doing so eliminates or significantly reduces an accounting mismatch that would otherwise arise. |
The Group holds the following investments:
| | | | |
Figures in million – SA rand | | | | |
Designated at FVTOCI investments: | | | | |
Rand Mutual Assurance Company Limited | | | | |
Furuya Metal Company Limited1 | | | | |
| | | | |
Generation Mining Limited3 | | | | |
| | | | |
| | | | |
Mandatorily measured at FVTPL investments: | | | | |
| | | | |
| | | | |
| | | | |
Amortised cost investments | | | | |
| | | | |
1The Group holds approximately 4.88% in Furuya Metal Company Limited which is incorporated in Japan and listed on the Tokyo Stock Exchange. Its main business is the
manufacture/sale of industrial-use precious metals
2The Group holds 14.34% in Aldebaran which is incorporated in Canada and listed on the Toronto Stock Exchange (TSX). Aldebaran is a mineral exploration company.
Subsequent to the reporting date, the Group's shareholding in Aldebaran reduced to 13.2% due to a capital raising transaction executed by Aldebaran
3The Group holds 12.14% in Generation Mining Limited which is incorporated in Canada and listed on the TSX. Generation Mining Limited is in the process of developing the
Marathon copper-palladium project. Subsequent to the reporting date, the Group's shareholding in Generation Mining Limited reduced to 10.2% due to a capital raising
4During 2025, the Group successfully disposed of its investment in ioneer through a block trade on the Australian Stock Exchange at AUD0.11 per share with total proceeds
amounting to R186 million
5On 22 March 2022, the Group, through its wholly-owned subsidiary, Sibanye Battery Metals Proprietary Limited, invested in Verkor by subscribing for a €25 million
(R409 million) convertible bond. Verkor is a French Gigafactory project aiming to enter the European battery materials market as a manufacturer of low-carbon footprint
batteries for application in electric vehicles and large-scale stationary storage markets. The convertible bond was converted into preference shares during September
2023. The convertible bond was recognised as an investment measured at fair value, with net gains and losses recognised in profit or loss. Subsequent to conversion, the
preference shares continue to be measured at fair value through profit or loss. During September 2023, the Group also subscribed for a further €15 million (R303 million)
preference share investment, which is measured at fair value through profit or loss. The fair value of the total investment in Verkor amounted to R933 million at 31
December 2025 (2024: R904 million, 2023: R951 million), with R29 million (2024: R46 million loss, 2023: R93 million gain) recognised as a fair value gain for the year ended 31
December 2025
Fair value of other investments
Other investments consists primarily of listed investments and other short-term investment products, which are measured at fair value or
have carrying amounts that approximates fair value. The fair values of non-listed investments included in other investments are determined
through valuation techniques that include inputs that are not based on observable market data. Fair value measurements of listed
investments are categorised as level 1 under the fair value hierarchy and non-listed investments as level 3 (see note 35.1).
Other market price risk
The primary goal of the Group's investments in equity securities is to hold the investments for long-term strategic purposes in line with the
Group's investment strategy. These investments are continuously assessed by management, assisted by the Group's business development
processes, to determine the appropriate outcome in respect of these investments based on changes in share prices and other available
NOTES TO THE CONSOLIDATED FINANCIAL STATEMENTS continued
For the year ended 31 December 2025
information (see note 35.2 for further market risk information). A one percentage point change in the various stock exchange prices would
have impacted other comprehensive income by R22 million.
NOTES TO THE CONSOLIDATED FINANCIAL STATEMENTS continued
For the year ended 31 December 2025
20. Environmental rehabilitation obligation funds
In order to offset the environmental effects of the Group's mining activities, the Group sets aside funds for rehabilitation of the
environmental impacts of its operations, in order to fund rehabilitation according to the expected closure and rehabilitation plans.
|
Accounting policy The Group’s rehabilitation obligation funds consist of investments measured at FVTPL and those measured at amortised cost. Rehabilitation obligation funds measured at fair value include a fixed income portfolio of bonds, rehabilitation policies and cell captive investments. These funds are measured at fair value at each reporting date. The fair value is determined with reference to underlying bond prices using industry valuation techniques and appropriate models. Rehabilitation obligation funds measured at amortised cost mainly comprise term and notice deposits. These financial instruments are measured at amortised cost, using the effective interest method. Contributions are made to dedicated environmental rehabilitation obligation funds to fund the estimated cost of rehabilitation during and at the end of the life of the relevant mine. The amounts contributed to these funds are included under non-current assets and are measured at fair value through profit or loss. Interest earned on monies paid to rehabilitation funds is accrued on a time proportion basis and is recorded as interest income where relevant. In addition, funds are set aside to serve as collateral against the guarantees made to regulatory authorities for environmental rehabilitation obligations. |
| | | | |
Figures in million – SA rand | | | | |
Balance at beginning of the year | | | | |
Assets acquired on acquisition of subsidiary | | | | |
Assets derecognised with deemed disposal of interest in joint operation | | | | |
| | | | |
| | | | |
| | | | |
Transfer to other financial assets | | | | |
| | | | |
Foreign currency translation | | | | |
Balance at end of the year | | | | |
| | | | |
Environmental rehabilitation obligation funds are measured as follows: | | | | |
| | | | |
| | | | |
| | | | |
Environmental rehabilitation obligation funds comprise of the following: | | | | |
| | | | |
| | | | |
1The environmental rehabilitation trust fund includes a fixed income portfolio of bonds that are fair valued at each reporting date
2The funds are set aside to serve as collateral against the guarantees made to the Department of Minerals, Resources and Energy for environmental rehabilitation
obligations
Fair value of environmental rehabilitation obligation funds
Environmental rehabilitation obligation funds comprise fixed income portfolio of bonds, rehabilitation policies, investment in a cell captive
as well as fixed and notice deposits. A portion of the environmental rehabilitation obligation funds are measured at FVTPL as stated above,
while the carrying values of those measured at amortised cost, approximate fair value based on the nature and terms of the investments
(see note 35.1).
Credit risk
The Group is exposed to credit risk on the total carrying value of the investments held in the environmental rehabilitation obligation funds.
The Group has reduced its exposure to credit risk by investing in funds with a limited number of major financial institutions.
NOTES TO THE CONSOLIDATED FINANCIAL STATEMENTS continued
For the year ended 31 December 2025
21. Other receivables and other payables
|
Significant accounting judgements and estimates Expected future cash flows used to determine the carrying value of the other payables (namely the Rustenburg operation deferred payment, right of recovery payable, Marikana dividend obligation and contingent consideration), the right of recovery receivable and the fair value of hedge instruments are inherently uncertain and could materially change over time. The expected future cash flows are significantly affected by a number of factors including reserves and production estimates, together with economic factors such as the expected commodity price, currency exchange rates, and estimates of production costs, future capital expenditure and discount rates. Accounting policy Financial instruments included in other receivables are categorised as financial assets measured at amortised cost and those included in other payables are categorised as other financial liabilities as applicable. These assets and liabilities are initially recognised at fair value. Subsequent to initial recognition, financial instruments included in other receivables and other payables are measured at amortised cost, except where fair value through profit or loss measurement is appropriate. Contingent consideration, and derivative financial instruments such as the metals borrowings liability and hedges are measured at fair value through profit or loss. Reimbursements, such as rehabilitation reimbursements from other parties are not financial instruments, and are recognised as a separate asset where recovery is virtually certain. The amount recognised is limited to the amount of the relevant rehabilitation provision. If the party that will make the reimbursement cannot be identified, then the reimbursement is generally not virtually certain and cannot be recognised. If the only uncertainty regarding the recovery relates to the amount of the recovery, the reimbursement amount often qualifies to be recognised as an asset. Other receivables and payables that do not arise from contractual rights and obligations, such as receivables on rates and taxes, are recognised and measured at the amount expected to be received or paid. Statement of cash flows The acquisition date fair value of deferred payments and contingent consideration relating to business combinations is part of the aggregate consideration for obtaining control of the underlying net assets. Therefore, unless the obligations are clearly part of the borrowing structure of the group, repayments of the acquisition date fair value are classified as investing activities. Additional deferred/ contingent payments in excess of the acquisition date fair value are considered to be operating activity cash flows by nature. |
21.1 Other receivables
| | | | |
Figures in million – SA rand | | | | |
Rates and taxes receivable | | | | |
| | | | |
Section 45X credit receivable | | | | |
| | | | |
| | | | |
Reconciliation of the non-current and current portion of the other receivables: | | | | |
| | | | |
Current portion of other receivables | | | | |
Non-current portion of other receivables | | | | |
21.2 Other payables
| | | |
Figures in million – SA rand | | | |
Contingent consideration (Kroondal acquisition) | | | |
Deferred/contingent consideration (Pandora acquisition) | | | |
Marikana dividend obligation | | | |
Keliber dividend obligation | | | |
Metals borrowings liability | | | |
| | | |
Gold and zinc hedge derivative liability | | | |
| | | |
| | | |
Reconciliation of the non-current and current portion of the other receivables: | | | |
| | | |
Current portion of other payables | | | |
Non-current portion of other payables | | | |
1The revised 2024 balance includes the additional payment in respect of the Reldan business combination amounting to R96 million (see note 16.2)
NOTES TO THE CONSOLIDATED FINANCIAL STATEMENTS continued
For the year ended 31 December 2025
Contingent consideration (Kroondal acquisition)
The Group (through SRPM) assumed full ownership of Kroondal on 1 November 2023 (effective date) by acquiring RPM's 50% in the
Kroondal PSA. The Group agreed to pay RPM a contingent consideration based on a percentage of the cumulative pre-tax cash flows of
the Kroondal PSA until a total of 1,350,000 4E ounces (on a 100% basis) was delivered to RPM (agreed PSA ounces). At the effective date,
approximately 204,517 4E ounces were still outstanding in terms of the Kroondal PSA and continued to be delivered under the terms of the
PoC arrangement. The percentage was determined based on a sliding scale/specific ranges of the PGM basket price included in the sale
agreement. The Group would not make any payment to RPM if the cumulative pre-tax cash flows of the Kroondal PSA was negative. The
remaining ounces were delivered during 2024 and resulted in the Group settling this portion of the contingent consideration amounting to
cash payments of R292 million. The Group also agreed to pay RPM an amount equal to 50%of the amount receivable from RPM at the end
of the final measurement period in respect of the agreed PSA ounces (agreed PSA ounces receivable). The Group determined the
contingent consideration at the effective date as 50% of the agreed PSA ounces receivable. RPM withheld 50% of each payment of the
agreed PSA ounces receivable until the payment of R882 million was paid in full. This payment is a non-cash transaction for the Group, as
the contingent consideration was offset with the 50% of the PSA ounces. During 2025, the assets and liabilities of Kroondal were transferred
to SRPM (see note 1.1).
The Kroondal contingent consideration movement for the year is as follows:
| | | | |
Figures in million – SA rand | | | | |
Balance at the beginning of the year | | | | |
Contingent consideration on acquisition of subsidiary | | | | |
| | | | |
(Gain)/loss on revised estimated cash flows | | | | |
Balance at end of the year | | | | |
Deferred/contingent consideration (Pandora acquisition)
The Lonmin group acquired the remaining 50% stake in Pandora Joint Venture in 2017. The purchase price included a deferred and
contingent consideration element. The deferred payment element represented a minimum consideration of R400 million, which was settled
through a cash payment based on 20% of the distributable free cash flows generated from the Pandora E3 operations on an annual basis
for a period of 6 years, ended on 30 November 2023. The fair value of the deferred consideration at acquisition of Lonmin by the Group
was determined using the present value of the future cash flows at a discount rate of 12.5%. The contingent consideration element was
based on the extent to which 20% of the distributable free cash flows exceeded R400 million. This element was valued at R44 million at 31
December 2023. The distributable free cash flow was derived from forecast cash flow models. These models used several key assumptions,
including estimates of future sales volumes, PGM prices, operating costs and capital expenditure. The Group settled the remaining
R44 million liability on 1 February 2024.
The Pandora deferred consideration movement for the year is as follows:
| | | | |
Figures in million – SA rand | | | | |
Balance at the beginning of the year | | | | |
| | | | |
Loss on revised estimated cash flows | | | | |
| | | | |
Balance at end of the year | | | | |
Marikana dividend obligation
The Marikana dividend obligation relates to amounts payable to external shareholders through an intermediate company holding
structure. The obligation is classified as a financial liability measured at amortised cost. At year end, the dividend obligation was measured
applying the same assumptions as set out in note 6.4, except for the discount rates of 11.64% (EPL) and 11.71% (WPL), which remains
consistent over the life of the obligation (see note 6.4 for additional detail regarding the Marikana B-BBEE transaction).
The following table summarises the changes in the Marikana dividend obligation:
| | | | |
Figures in million – SA rand | | | | |
Balance at the beginning of the year | | | | |
Interest — unwinding of amortised cost | | | | |
Gain on revised estimated cash flows | | | | |
| | | | |
Balance at end of the year | | | | |
NOTES TO THE CONSOLIDATED FINANCIAL STATEMENTS continued
For the year ended 31 December 2025
Keliber dividend obligation
During April 2023, Sibanye-Stillwater (through its wholly-owned subsidiary, Keliber Lithium Proprietary Limited) signed a revised shareholders'
agreement with the Finnish Minerals Group, which resulted in a contractual obligation to declare dividends amounting to 40% of the free
cash flow of Keliber. A dividend obligation was recognised for the NCI of Keliber on the effective date of the agreement (25 April 2023) at
R792 million, with a corresponding reduction in NCI (see note 26.1 for other NCI changes). The Group's attributable portion of the dividend
obligation eliminates on consolidation. The dividend obligation is a financial liability and was initially measured at fair value less any directly
attributable costs, and subsequently measured at amortised cost.
At 31 December 2025 the following assumptions were applied in measuring the Keliber dividend obligation:
| | | | |
| | | | |
Average lithium hydroxide price | | | | |
| | | | |
| | | | |
| | | | |
The following table summarises the changes in the Keliber dividend obligation:
| | | | |
Figures in million – SA rand | | | | |
Balance at the beginning of the year | | | | |
Initial recognition of the Keliber dividend obligation | | | | |
(Gain)/loss on revised estimated cash flows1 | | | | |
Interest — unwinding of amortised cost | | | | |
Foreign currency translation reserve | | | | |
Balance at end of the year | | | | |
1The gain on revised estimated cash flow for the year ended 31 December 2025 is primarily as a result of a decrease in the long term lithium hydroxide price, which resulted
in decreased expected future cash flows from Keliber
NOTES TO THE CONSOLIDATED FINANCIAL STATEMENTS continued
For the year ended 31 December 2025
Metals borrowings liability
The metals borrowings liability relates to precious metals that are borrowed and repaid under a consignment arrangement with a financial
institution for working capital cash management purposes, by the Pennsylvania recycling site. The precious metals traded are gold, silver,
platinum and palladium, and transactions with the lender are recorded at the daily market prices on the day the metals are traded.
Settlement of transactions is usually within two to three business days after the trade date. The liability is measured at fair value according to
the market borrowing position, with fair value movements recognised in profit or loss.
The following table summarises the changes in the metals borrowings liability:
| | | | |
Figures in million – SA rand | | | | |
Balance at the beginning of the year | | | | |
Initial recognition on acquisition of subsidiary | | | | |
| | | | |
Non-cash advances received | | | | |
| | | | |
Settlements through delivery of metals (non-cash) | | | | |
Loss/(gain) on commodity price movements | | | | |
Foreign currency translation reserve | | | | |
Balance at end of the year | | | | |
Deferred/contingent payments made
The table below summarises the cash deferred/contingent payments made during the year on the obligations set out above:
| | | | |
Figures in million – SA rand | | | | |
Deferred payment (Rustenburg operation) | | | | |
Deferred/contingent consideration (Pandora acquisition) | | | | |
Contingent consideration (Kroondal acquisition) | | | | |
| | | | |
Payments in excess of the original fair value (operating cash flows) | | | | |
Payments up to initial fair value (investing cash flows) | | | | |
Fair value of other receivables and other payables
Due to the approaches applied in calculating the carrying values as described above, the fair values approximate the respective carrying
values, except for the Marikana dividend obligation and the Keliber dividend obligation. At 31 December 2025, the fair value (level 3) of
the Marikana dividend obligation amounted to R777 million (2024: R559 million, 2023: R1,257 million) and the fair value of the Keliber
dividend obligation (level 3) at 31 December 2024 amounted to R532 million (2023: R1,434 million). The fair values were calculated by
applying a market-related discount rate to expected future cash flows available for dividends at each year end (see note 35.1).
Market risk
The deferred/contingent consideration relating to Pandora (up to 31 December 2023), Kroondal contingent consideration (up to 31
December 2023) and the Marikana dividend obligation are sensitive to changes in the 4E basket price. A one percentage point increase in
the 4E basket price would have impacted profit/loss before tax by R38 million (2024: R34 million, 2023: R70 million). The Keliber dividend
obligation (up to 31 December 2024) was sensitive to changes in the lithium hydroxide price. A one percentage point increase in the lithium
hydroxide price would have impacted profit/loss before tax by R26 million at 31 December 2024 (2023: R27 million).
Credit risk
The carrying value of the other receivables represents the maximum credit risk exposure of the Group in relation to these receivables. The
Group has reduced its exposure to credit risk by dealing with a limited number of approved counterparties (see note 35.2).
NOTES TO THE CONSOLIDATED FINANCIAL STATEMENTS continued
For the year ended 31 December 2025
22. Inventories
|
Significant accounting judgements and estimates Inventory is held in a wide variety of forms across the value chain reflecting the stage of refinement. Prior to production as final metal, the inventory is always contained within a carrier material. As such, inventory is typically sampled and assays taken to determine the metal content and how this is split by metal. Measurement and sampling accuracy can vary quite significantly depending on the nature of the vessels and the state of the material. An allowance for estimation uncertainty is applied to the various categories of inventory and is dependent on the degree to which the nature and state of material allows for accurate measurement and sampling. The range used for the estimation allowance varies based on the stage of refinement. The range is based on independent metallurgists’ level of confidence obtained from the outcome of the stocktake. Those results are applied in arriving at the appropriate quantities of inventory. Metals in process quantities Recoverable metal quantities are reconciled to ore input and actual metal recoveries. Due to inherent limitations on precise monitoring of recoverability levels, the process of metallurgically balancing inputs and outputs is regularly monitored and metallurgical estimates are refined through reference to actual results. Periodic inventory counts are conducted at refineries to assess the accuracy of inventory quantities. Where required, changes in metallurgical estimates are factored into the measurement of metal inventory. Due to expected levels of estimation uncertainty, reasonable tolerances of total metals are accepted in the measurement of PGM in process quantities. Accounting policy Inventory is measured at the lower of cost and net realisable value. Net realisable value is the estimated selling price in the ordinary course of business, less estimated costs of completion and the estimated costs necessary to make the sale. Prior to physical separation and while metals are still in the production process, the combined net realisable value of the metals in process is compared to the combined costs of the metals in process for purposes of measuring "in process" inventory at the lower of cost and net realisable value. The Group recognises the cost of ore stockpiles and metal-in-process when it can be reliably measured. Production cost is allocated to these inventories from the stage where the cost becomes reliably measurable. Cost is determined on the following basis: •Gold reef ore stockpiles and gold-in-process are valued using weighted average cost. Cost includes production, amortisation, depreciation and related administration costs •PGM and battery metals inventory is valued using weighted average cost by allocating cost, based on the joint cost of production, apportioned according to the relative sales value of each of the PGMs and battery metals produced. The Group recognises the metal produced in each development phase in inventory with an appropriate proportion of cost. Cost includes production, amortisation, depreciation and related administration costs •By-product metals are identified based on the relative importance and materiality of the relevant metals in relation to the basket of metals mined or produced at each operation. By-product metals are generally valued at the incremental cost of production from the point of split-off from the joint products in the relevant processing stream, considering the nature and objective of the operation •Consumable stores are valued at weighted average cost after appropriate provision for surplus and slow-moving items •Scrap metal acquired for processing and resale are valued using the weighted average cost method. Cost includes purchase price and other directly attributable costs incurred to bring the inventory to its present location and condition, including transport, sampling and assay costs |
| | | |
Figures in million – SA rand | | | |
| | | |
PGM ore and mill inventory | | | |
| | | |
| | | |
| | | |
| | | |
Sandouville metals in process | | | |
Sandouville raw materials | | | |
Sandouville finished goods | | | |
Zinc concentrate inventory | | | |
| | | |
| | | |
1The cost of consumable stores consumed during the year and included in operating cost amounted to R20,772 million (2024: R24,685 million and 2023:R25,778 million)
Inventories were reduced during 2025 by R1,477 million (2024: R4,784 million and 2023: R1,694 million) due to write-down to net realisable
value. The write-downs mainly relate to PGM in process and PGM finished goods of R1,171 million (2024: R3,843 million, 2023: R1,179 million)
and R306 million (2024: R844 million, 2023: R423 million), respectively, as a result of the lower commodity price environment. The write-downs
are included in cost of sales (see note 4).
NOTES TO THE CONSOLIDATED FINANCIAL STATEMENTS continued
For the year ended 31 December 2025
23. Trade and other receivables
|
Accounting policy Trade and other receivables, excluding trade receivables for PGM and zinc concentrate sales, prepayments and value added tax, are non-derivative financial assets categorised as financial assets measured at amortised cost. The above non-derivative financial assets are initially recognised at fair value and subsequently carried at amortised cost less allowance for impairment. Estimates made for impairment are based on a review of all outstanding amounts at year end in line with the impairment policy described in note 35. Irrecoverable amounts are written off during the period in which they are identified based on the write-off policy included in note 35. In addition to other types of PGM sales, trade receivables include actual invoiced sales of PGM concentrate, as well as sales not yet invoiced for which deliveries have been made and the control has transferred. This is similar for sales of zinc concentrate also included in trade receivables. The PGM and zinc concentrate receivables are financial assets measured at fair value through profit or loss, as the solely payments of principle and interest criteria is not met. The receivable amount calculated for the PGM and zinc concentrate delivered but not yet invoiced is recorded at the fair value of the consideration receivable at the date of delivery. At each subsequent reporting date the receivable is remeasured to reflect the fair value movements in the pricing mechanism which are recognised in revenue. Foreign exchange movements on foreign currency denominated receivables are recognised as a foreign exchange gain or loss in profit or loss subsequent to the recognition of a sale. |
| | | |
Figures in million – SA rand | | | |
Trade receivables — gold operations | | | |
Trade receivables — PGM operations | | | |
| | | |
| | | |
Trade receivables — zinc concentrate sales | | | |
Trade receivables — Sandouville metals sales | | | |
Trade receivables — e-scrap recycling | | | |
Other trade and non-trade receivables1 | | | |
| | | |
| | | |
| | | |
| | | |
| | | |
Total trade and other receivables | | | |
1These receivables arise from the Group's non-core activities such as services rendered by service entities to third parties, scrap metal and diesel sales, recovery of water
and electricity and other miscellaneous items, and therefore do not include the Group's proceeds from the sale of products
2Prepayments for the year ended 31 December 2024 includes prepayments of DRDGOLD made towards capital projects amounting to R113 million (2023: R610 million)
Fair value of trade and other receivables
The fair value of trade receivables for PGM concentrate sales are determined based on ruling market prices, volatilities and interest rates,
and constitutes level 2 on the fair value hierarchy (see note 35.1).
The fair value of trade and other receivables measured at amortised cost approximate the carrying value due to the short maturity.
Credit risk
The Group is exposed to credit risk on the total carrying value of trade and other receivables (see note 35.2).
Trade receivables measured at amortised cost are reviewed on a regular basis and an allowance for impairment is raised when they are
not considered recoverable based on an expected credit loss assessment. The Group transacts exclusively with a limited number of large
international institutions and other organisations with strong credit ratings and the negligible historical level of customer default. Trade
receivables, including trade receivables from metal sales such as chrome, silver, cobalt, zinc and copper, are currently in a sound financial
position and no impairment allowance has been recognised.
NOTES TO THE CONSOLIDATED FINANCIAL STATEMENTS continued
For the year ended 31 December 2025
The table below summarises the impairment allowance raised on other non-trade receivables that are considered to be impaired:
| | | |
Figures in million – SA rand | | | |
Balance at beginning of the year | | | |
Impairment allowance recognised in profit or loss for the year | | | |
Financial assets written off | | | |
Impaired financial assets recovered during the year | | | |
Balance at end of the year1 | | | |
1The impairment allowance mainly relates to payroll receivables, property rentals and certain supplier loans. During 2024, an impairment allowance related to a receivable
balance from Blue Ridge Platinum Proprietary Limited (Blue Ridge) was recognised amounting to R118 million. The remaining impairment allowance recognised for 2024
also relates to non-core activity receivables of the Group
Commodity price risk
The Group is exposed to commodity price risk on PGM concentrate receivables that are still subject to provisional pricing adjustments after
the reporting date. A change in the 4E basket price of one percent would impact revenue and the related PGM concentrate receivables
by R10 million.
Foreign currency sensitivity
Certain of the Group’s components with SA rand as their functional currency have trade and other receivables which are settled in
US dollars. The balances are sensitive to changes in the rand/US dollar exchange rate. A one percentage point change in the SA rand
closing exchange rate of R16.57/US$ would have impacted profit/loss before tax by R18 million.
24. Cash and cash equivalents
|
Accounting policy Cash comprises cash on hand and demand deposits. Cash equivalents are short-term, highly liquid investments readily convertible to known amounts of cash and which are subject to an insignificant risk of changes in value. Cash equivalents are held to meet short-term cash commitments. Cash and cash equivalents are measured at amortised cost, which is deemed to be fair value due to its short maturity. |
| | | |
Figures in million – SA rand | | | |
Cash at the bank, on hand and cash equivalents | | | |
Total cash and cash equivalents | | | |
Fair value of cash and cash equivalents
The carrying value of cash and cash equivalents approximates fair value due to the short-term nature of the balances.
Credit risk
The Group is exposed to credit risk on the total carrying value of cash and cash equivalents. The Group has reduced its exposure to credit
risk by dealing and investing with a number of major financial institutions (see note 35.2).
NOTES TO THE CONSOLIDATED FINANCIAL STATEMENTS continued
For the year ended 31 December 2025
25. Stated share capital
|
Accounting policy Ordinary shares are classified as equity. Incremental costs directly attributable to the issue of ordinary shares are recognised as a deduction from equity, net of any tax effects. |
Authorised and issued
The roll forward below shows the movement of the legally issued shares of the Company for the periods indicated.
| | | |
| | | |
Authorised number of shares | | | |
| | | |
Reconciliation of issued number of shares: | | | |
Number of shares in issue at beginning of the year | | | |
Shares issued under Sibanye-Stillwater/SGL share plan | | | |
Number of shares in issue at end of the year | | | |
The Company’s ordinary no par value shares rank pari passu in all respects, there being no conversion or exchange rights attached
thereto, and all of the ordinary shares will have equal rights to participate in capital, dividend and profit distributions by the Company.
26. Non-controlling interests
|
Accounting policy Non-controlling interests The Group recognises any NCI in an acquiree either at fair value or at the NCI's proportionate share of the acquiree’s net assets on an acquisition-by-acquisition basis. Subsequently, the carrying amount of NCI is the amount of the interest at initial recognition plus the NCI’s subsequent share of changes in equity. Transactions with non-controlling interests The Group treats transactions with NCI as transactions with equity owners of the Group. For purchases from NCI, the difference between any consideration paid and the relevant share of the carrying value of the net assets acquired, is recognised in equity. Gains or losses on disposals of NCI where control is not lost are also recognised in equity. Where control over a subsidiary is lost, the gains or losses are recognised in profit or loss. |
The Group’s NCI relates to the following subsidiaries:
| | | | |
Figures in million – SA rand | | | | |
| | | | |
| | | | |
NCI of Group Technical Security Management | | | | |
| | | | |
The summarised financial information of DRDGOLD and Keliber is provided below. This information is based on amounts before
intercompany eliminations.
NOTES TO THE CONSOLIDATED FINANCIAL STATEMENTS continued
For the year ended 31 December 2025
| | | | |
Figures in million – SA rand | | | | |
| | | | |
| | | | |
| | | | |
Total comprehensive income | | | | |
Profit attributable to NCI | | | | |
Net increase/(decrease) in cash and cash equivalents | | | | |
| | | | |
| | | | |
| | | | |
| | | | |
| | | | |
| | | | |
| | | | |
Figures in million – SA rand | | | | |
| | | | |
| | | | |
(Loss)/profit for the year | | | | |
Total comprehensive income | | | | |
(Loss)/profit attributable to NCI | | | | |
Net (decrease)/increase in cash and cash equivalents | | | | |
| | | | |
| | | | |
| | | | |
| | | | |
| | | | |
| | | | |
26.1 Subsequent NCI transactions
DRDGOLD transaction
DRDGOLD is a company incorporated in South Africa with its head office in Johannesburg. DRDGOLD’s primary listing is on the JSE Limited
and its secondary listing is on the New York Stock Exchange. DRDGOLD's production is derived from retreatment of surface tailings in South
Africa. Following Sibanye-Stillwater’s exercise of its option to acquire an additional 12.05% in DRDGOLD effective 10 January 2020, NCI held
a 49.90% at 31 December 2025 (2024: 49.90% and 2023: 49.90%) with an effective holding of 49.90% at 31 December 2025 (2024: 49.77% and
2023: 49.72%) after considering the impact of treasury shares held by DRDGOLD. In calculating the reattribution to NCI, the Group used the
net asset value of DRDGOLD at the effective date of the option exercise, including the consideration paid for the subscription, and
determined a reattribution between NCI and the Group.
During 2025, the Group subscribed for 1,400,000 newly issued shares by DRDGOLD at an average price of R32.18 per share, amounting to a
total purchase consideration of R45 million.
Keliber transactions
2023
On 25 April 2023 the Finnish Minerals Group increased its holding in Keliber from 14% to 20% by subscribing for EUR53.9 million (R1,096 million)
of a EUR104 million rights issue. The Group's portion of the subscription (through wholly-owned subsidiary, Keliber Lithium Proprietary Limited)
amounted to EUR50.2 million (R1,009 million), which is eliminated on a Sibanye-Stillwater Group level. In addition to the rights issue, other
minority shareholders in Keliber (which held 0.79% of the total Keliber shareholding) for which the Group previously recognised an
accelerated put option liability at 31 December 2022, received and accepted voluntary offers at the same share price (EUR157.28 per
share) as the voluntary offer that concluded in 2022. A total payment of EUR5.2 million (R103 million) was made by the Group to all the
shareholders who accepted the voluntary offers during June 2023. Following these transactions, the Finnish Minerals Group holds 20% in
Keliber, the Group retained 79.82%, while other minority shareholders hold the balance of the shares in Keliber.
The table below summarises the above transactions that occurred during 2023 and the impact thereof on the equity attributable to the
owners of Sibanye-Stillwater:
NOTES TO THE CONSOLIDATED FINANCIAL STATEMENTS continued
For the year ended 31 December 2025
| | |
Figures in million – SA rand | | |
| | |
Rights issue and voluntary offers | | |
Cash consideration paid on rights issue subscription by the Group | | |
Payment eliminated on consolidation | | |
Cash consideration received from rights issue subscription by NCI | | |
Cash consideration paid by the Group to NCI on voluntary offer | | |
Net cash received by the Group | | |
Net reattribution of equity (accumulated profit and foreign currency translation reserve) | | |
Net increase in equity attributable to the owners of Sibanye-Stillwater as a result of the transactions with Keliber shareholders | | |
Increase in accumulated profit | | |
Decrease in foreign currency translation reserve | | |
| | |
Net increase in total equity as a result of the transactions with Keliber shareholders | | |
Effective 25 April 2023, the Group also recognised a dividend obligation of R792 million with a corresponding reduction of the NCI of Keliber
as a result of the revised shareholders agreement (see note 21.2). This transaction did not result in a cash flow.
Century transactions
Sibanye-Stillwater acquired additional shares in Century through its original take-over offer subsequent to the effective date of the
acquisition. On 10 May 2023, Sibanye-Stillwater, through on-and off-market trades, obtained a 100% interest in Century through cash
consideration paid of A$74 million (R906 million) for the additional 49.85% interest in Century.
The table below illustrates the effect of the remaining interest acquired in Century on equity attributable to the owners of Sibanye-Stillwater
for the year ended 31 December 2023:
| | |
Figures in million – SA rand | | |
| | |
Consideration paid for acquiring the remaining 49.85% interest in Century | | |
| | |
Total impact on equity attributable to owners of Sibanye-Stillwater1 | | |
1The amount includes R13 million increase on accumulated profit and R5 million decrease on other reserves in respect of foreign currency translation reserve
NOTES TO THE CONSOLIDATED FINANCIAL STATEMENTS continued
For the year ended 31 December 2025
27. Borrowings and derivative financial instrument
|
Significant accounting judgements and estimates Borrowings Expected future cash flows used to determine the carrying amount of the Burnstone Debt are inherently uncertain and could materially change over time. They are significantly affected by a number of factors including reserves and production estimates, together with economic factors such as the expected commodity price, foreign currency exchange rates, and estimates of production costs, future capital expenditure and discount rates, and ultimately the timing and amount of capital and interest that are expected to be repaid, as well as the timing and repayment on Sibanye-Stillwater funding provided to date. Derivative financial instrument Gains and losses on the derivative financial instrument are attributable to changes in various valuation inputs, including the movement in the Company's share price, change in US dollar/rand exchange rate, the volatility of the Company's shares, the Company's credit risk spreads, and the market value of the US$ Convertible Bond. Although many inputs into the valuation are observable, the valuation method separates the fair value of the derivative from the quoted fair value of the US$ Convertible Bond by adjusting certain observable inputs. These adjustments require the application of judgement and certain estimates. Changes in the relevant inputs impact the fair value gains and losses recognised. Accounting policy Borrowings Borrowings are non-derivative financial liabilities categorised as other financial liabilities. Borrowings are recognised initially at fair value, net of transaction costs incurred, where applicable and subsequently measured at amortised cost using the effective interest method. Borrowings are classified as current liabilities unless the Group has an unconditional right to defer settlement of the liability for at least 12 months after the reporting date. For borrowings that can be settled in shares, the Group disregards conversion options that are recognised as equity when assessing the host liability's classification as current or non-current. Derivative financial instruments Derivatives are initially recognised at fair value that is determined by using appropriate option pricing methodologies. Any directly attributable transaction costs are recognised in profit or loss as incurred. Subsequent to initial recognition, derivatives are measured at fair value, and changes are recognised in profit or loss. For assets and liabilities that are recognised at fair value in the financial statements on a recurring basis, the Group determines whether transfers have occurred between levels in the fair value hierarchy by re-assessing categorisation (based on the lowest level input that is significant to the fair value measurement as a whole) at the end of each reporting period. |
| | | | |
Figures in million – SA rand | | | | |
| | | | |
Derivative financial instrument | | | | |
Balance at end of the year | | | | |
Current portion of borrowings and derivative financial instrument | | | | |
Non-current portion of borrowings and derivative financial instrument | | | | |
NOTES TO THE CONSOLIDATED FINANCIAL STATEMENTS continued
For the year ended 31 December 2025
Borrowings
| | | | |
Figures in million – SA rand | | | | |
| | | | |
| | | | |
| | | | |
| | | | |
| | | | |
| | | | |
| | | | |
| | | | |
| | | | |
Stillwater Convertible Debentures | | | | |
| | | | |
Reconciliation of the non-current and current portion of the borrowings: | | | | |
| | | | |
Current portion of borrowings | | | | |
Non-current portion of borrowings | | | | |
The current portion of borrowings will be repaid out of operational cash flows or it will be refinanced by utilising available Group facilities.
Included in the current portion of borrowings at 31 December 2023 is the US$ Convertible Bond, which was subject to approval by a
general meeting of Sibanye-Stillwater shareholders to be convertible into ordinary shares of Sibanye-Stillwater. Following the shareholder
approval in 2024, the bond component of the US$ Convertible Bond was reclassified to non-current and the derivative component
derecognised (see note 27.5).
The roll forward of borrowings in the current year is as follows:
| | | | |
Figures in million - SA rand | | | | |
Balance at beginning of the year | | | | |
Borrowings acquired on acquisition of subsidiary | | | | |
| | | | |
| | | | |
Unwinding of loans recognised at amortised cost | | | | |
| | | | |
| | | | |
Borrowing costs capitalised | | | | |
Loss/(gain) on the revised cash flow of the Burnstone Debt | | | | |
Loss on foreign exchange differences and foreign currency translation | | | | |
Balance at end of the year | | | | |
1Total loans raised per the statement of cash flows for the year ended 31 December 2023 included the initial recognition of the derivative element of the US$ Convertible
Bond of R1,673 million (see note 27.5)
2Relates to the 2022 and 2025 Notes, 2026 and 2029 Notes, US$ Convertible Bond and the RCFs
NOTES TO THE CONSOLIDATED FINANCIAL STATEMENTS continued
For the year ended 31 December 2025
27.1 US$1 billion RCF
Sibanye-Stillwater concluded the refinancing of its undrawn US$600 million RCF on 6 April 2023. The facility will be used in financing of the
Group's ongoing capital expenditure, working capital and general corporate expenditure requirements, which may include the financing
of future acquisitions or business combinations. The RCF is linked to a Secured Overnight Financing Rate (SOFR), which is a recently effective
interest rate published as part of the interbank offered rate (IBOR) reform initiative.
Terms of the US$1 billion RCF
| |
| |
| |
| 1.60% if net debt to adjusted EBITDA is equal to or less than 1.0x |
| 1.80% if net debt to adjusted EBITDA is greater than 1.0x and less than or equal to 2.0x |
| 2.00% if net debt to adjusted EBITDA is greater than 2.0x and less than or equal to 3.0x |
| 2.20% if net debt to adjusted EBITDA is greater than 3.0x |
| Three years, subject to two optional one-year extensions depending on lenders' approval. During April 2025, all facility lenders approved the second extension with the facility now maturing on 6 April 2028 |
| The Company, SGL, Stillwater, Kroondal, SRPM, EPL, WPL and Sibanye Stillwater UK Financing PLC (Sibanye UK Financing) |
Security and/or guarantors: | The facility is unsecured and guaranteed by the Company, SGL, Stillwater, Kroondal, SRPM, EPL, WPL, Sibanye UK Financing, Keliber Technology Oy and Keliber |
| | | | |
Figures in million – SA rand | | | | |
Balance at beginning of the year | | | | |
| | | | |
| | | | |
| | | | |
| | | | |
Loss on foreign exchange differences | | | | |
Balance at end of the year | | | | |
Current portion of balance | | | | |
Non-current portion of balance | | | | |
1Includes commitment fees
27.2 R5.5 billion RCF
The purpose of the facility was to refinance facilities, finance ongoing capital expenditure and general corporate expenditure
requirements. This facility was refinanced by the Group through a new R6.5 billion RCF (see note 27.3).
| |
Terms of the R5.5 billion RCF |
| |
| |
| 2.4% if net debt to adjusted EBITDA is equal to or less than 2.0x |
| 2.6% if net debt to adjusted EBITDA is greater than 2.0x |
| Three years, subject to two optional one-year extensions depending on lenders' approval. All facility lenders have approved the first and second extension with the loan facility matured on 11 November 2024. |
| The Company, SGL, Kroondal, SRPM, EPL and WPL |
Security and/or guarantors: | The facility was unsecured and guaranteed by the Company, SGL, Stillwater, Kroondal, SRPM, EPL and WPL |
NOTES TO THE CONSOLIDATED FINANCIAL STATEMENTS continued
For the year ended 31 December 2025
| | | | |
Figures in million –SA rand | | | | |
Balance at beginning of the year | | | | |
| | | | |
| | | | |
| | | | |
| | | | |
| | | | |
Balance at end of the year | | | | |
Current portion of balance | | | | |
Non-current portion of balance | | | | |
1Includes commitment fees
27.3 R6.5 billion RCF
Sibanye-Stillwater refinanced its R5.5 billion RCF on 16 August 2024, which was to mature on 11 November 2024, by entering into a new
R6 billion RCF including an option for Sibanye-Stillwater to increase the RCF by a further R1 billion during the term through inclusion of
additional lenders. The Group executed a R500 million increase in the facility on 6 December 2024. The purpose of the facility is to refinance
facilities, finance ongoing capital expenditure and general corporate expenditure requirements.
Terms of the R6.5 billion RCF
| | |
| | |
| | |
| 2.2% if net debt to adjusted EBITDA is equal to or less than 1.0x |
| 2.4% if net debt to adjusted EBITDA is greater than 1.0x but less than or equal to 2.0x |
| 2.6% if net debt to adjusted EBITDA is greater than 2.0x but less than or equal to 3.0x |
| 2.8% if net debt to adjusted EBITDA is greater than 3.0x |
| Three years, subject to two optional one-year extensions depending on lenders' approval. During H2 2025, all facility lenders have approved the first one-year extension resulting in the facility now maturing in August 2028 |
| The Company, SGL, Kroondal, SRPM, EPL and WPL | |
Security and/or guarantors: | The facility is unsecured and guaranteed by the Company, SGL, Stillwater, Kroondal, SRPM, EPL, WPL, Sibanye UK Financing, Keliber and Keliber Technology Oy |
1The facility will transfer to the newly published interest rate ((South African Rand Overnight Index Average) (ZARONIA)) in accordance with IBOR reform amendments prior
to the date on which the JIBAR will no longer be available for use
| | | | |
Figures in million – SA rand | | | | |
Balance at beginning of the year | | | | |
| | | | |
| | | | |
| | | | |
| | | | |
| | | | |
Balance at end of the year | | | | |
Current portion of balance | | | | |
Non-current portion of balance | | | | |
1Includes commitment fees
NOTES TO THE CONSOLIDATED FINANCIAL STATEMENTS continued
For the year ended 31 December 2025
27.4 2026 and 2029 Notes
On 16 November 2021 the Group completed a two-tranche corporate bond offering 4.0% Notes (US$675 million) due 16 November 2026
(the 2026 Notes) and 4.5% Notes (US$525 million) due 16 November 2029 (the 2029 Notes) (together the 2026 and 2029 Notes). The
proceeds were applied towards the redemption of the 2025 Notes and will also be applied for general corporate purposes, including
advancing the Group’s green metals strategy through investments and accretive acquisitions. The bonds were issued through the Group's
wholly-owned subsidiary Stillwater.
Terms of the 2026 and 2029 Notes
| | |
| US$675 million 4.0% Senior Notes due 2026 | |
| US$525 million 4.5% Senior Notes due 2029 | |
| | |
| | |
| | |
| | |
| Stillwater Mining Company | |
| Each of the Notes are fully and unconditionally guaranteed, jointly and severally by the Guarantors (the Company, SGL, Kroondal, SRPM, EPL, WPL, Sibanye UK Financing, Keliber Technology Oy and Keliber). The guarantees rank equally in right of payment to all existing and future senior debt of the Guarantors. |
| | | | |
Figures in million – SA rand | | | | |
Balance at beginning of the year | | | | |
| | | | |
Unwinding of amortised cost | | | | |
| | | | |
(Gain)/loss on foreign exchange differences | | | | |
Balance at end of the year | | | | |
Current portion of balance | | | | |
Non-current portion of balance | | | | |
27.5 US$ Convertible Bond
Sibanye-Stillwater (through its wholly-owned subsidiary Stillwater) launched an offering of US$500 million senior, unsecured, guaranteed
bonds, due in November 2028 and subject to the receipt of the requisite approval by a general meeting of the shareholders of Sibanye-
Stillwater, will be convertible into new and/or existing Sibanye-Stillwater ordinary shares (Convertible Bonds). Prior to, and/or absent of such
approval, holders of the Convertible Bonds would, on conversion, receive a cash amount equal to the value of the underlying ordinary
shares. The proceeds of the bonds will be applied to the advancement of the Group's growth strategy including the funding of future
acquisitions, whilst preserving the current balance sheet for funding existing operations and projects through a lower commodity price
environment.
Terms of the US$500 million Convertible Bond
| |
| |
| |
| 28 November 2028 (five years) |
| |
| US$1.0088 (R18.55), being the volume weighted average price of Sibanye-Stillwater's shares listed on the JSE Limited between opening of trading and close of trading on 21 November 2023, converted into US$ at R18.388/US$ |
Initial conversion price: | |
| Stillwater Mining Company |
| The Company, SGL, Kroondal, SRPM, EPL, WPL |
The US$ Convertible Bond consisted of two components. The option component was recognised as a derivative financial instrument
(financial liability), measured at fair value, with changes in fair value recognised in profit or loss. The non-derivative host instrument (i.e.
bond component) was recognised as a financial liability measured at amortised cost using the effective interest method. On 28 May 2024,
Sibanye-Stillwater shareholder approval was obtained for the US$ Convertible Bond to be convertible into ordinary shares of the Company
at the option of the holders. The share conversion start date was 28 June 2024, with the last day that cash conversion could be requested
being 26 June 2024. The derivative element was transferred to equity on 26 June 2024 as a result of the removal of the cash conversion
option. At 31 December 2023, the bond component and derivative financial instrument was fully classified as current liabilities while
shareholder approval for the conversion option remained outstanding. Upon removal of the cash conversion option, the bond component
was reclassified as a non-current liability.
NOTES TO THE CONSOLIDATED FINANCIAL STATEMENTS continued
For the year ended 31 December 2025
Convertible bond at amortised cost
| | | | |
Figures in million – SA rand | | | | |
Balance at beginning of the year | | | | |
| | | | |
| | | | |
| | | | |
Unwinding of amortised cost | | | | |
(Gain)/loss on foreign exchange differences | | | | |
Balance at end of the year | | | | |
Current portion of balance | | | | |
Non-current portion of balance | | | | |
Derivative financial instrument
| | | | |
Figures in million – SA rand | | | | |
Balance at beginning of the year | | | | |
Initial recognition of derivative instrument | | | | |
| | | | |
(Gain)/loss on financial instruments1 | | | | |
Loss on foreign exchange differences | | | | |
Balance at end of the year | | | | |
Current portion of balance | | | | |
Non-current portion of balance | | | | |
1The fair value gain for 2024 on the derivative financial instrument is mainly due to a decrease in the Sibanye-Stillwater share price since the previous reporting date
27.6 Burnstone Debt
Sibanye Gold Eastern Operations (SGEO) has bank debt of US$178 million (the Burnstone Debt) outstanding as part of the net assets
acquired on 1 July 2014.
Terms of the Burnstone Debt
| |
| |
| |
| |
| |
| |
| A3 and A4: Interest free until 1 July 2017, then at term Secured Overnight Financing Rate (SOFR) |
| A3 and A4: 4% from 1 July 2017 |
| |
| A1: Repaid on 1 July 2014 |
| A2: From 1 July 2017 the first 50% of Burnstone’s free cash flow (as defined in the settlement agreement) will be used to repay the intercompany Wits Gold Shareholder Loan and the balance of 50% to repay A2. |
| A3 and A4: On settlement of A2, 90% of Burnstone’s free cash flow will be used to repay the intercompany Wits Gold Shareholder Loan and the balance of 10% to repay the Burnstone Debt. On settlement of the intercompany Wits Gold Shareholder Loan and interest, 30% of Burnstone’s free cash flow will be used to repay the Burnstone Debt and the balance will be distributed to Wits Gold. |
| The Bank Lenders will continue to participate in 10% of Burnstone’s free cash flow after the Burnstone Debt has been repaid in full to a maximum amount of US$63.0 million under a revenue participation agreement. |
| The Burnstone Debt is fully secured against the assets of Burnstone (of R2.0 billion) and there is no recourse to the Group. The security package includes a cession over the bank accounts, insurance policies’ proceeds, special and general notarial bonds over movable assets and mortgage bonds over property. Wits Gold has ceded and pledged its shares in K2013 (a dormant entity) and K2013 has ceded and pledged it shares in SGEO in favour of the lenders of the Burnstone Debt. |
NOTES TO THE CONSOLIDATED FINANCIAL STATEMENTS continued
For the year ended 31 December 2025
| | | | |
Figures in million – SA rand | | | | |
Balance at beginning of the year | | | | |
Unwinding of amortised cost | | | | |
Loss/(gain) on revised estimated cash flows1 | | | | |
(Gain)/loss on foreign exchange differences | | | | |
Balance at end of the year | | | | |
Current portion of balance | | | | |
Non-current portion of balance | | | | |
1.At 31 December 2024, the expected free cash flows to repay the loan as detailed above were revised as a result of updated estimated cash flows over the life-of-mine
plan due to a change in the allocation between SGL and the financial institutions in terms of the shareholder loan agreement and the terms of the loan agreement. The
cash flows over the life of mine were also revised at 31 December 2025 due to:
•Revised forecast costs and capital expenditure
•Revised weighted average gold prices 2025: R1,670,512/kg (2024: R1,189,493/kg and 2023: R1,012,625/kg) and long term exchange rates 2025: R17.25/US$ (2024:
R18.00/US$ and 2023: R18.50/US$) based on a LOM of 23 years. A2 is discounted using a 5.9% discount rate and A3 and A4 is discounted at 9.5%
•In line with the Group's Capital Allocation Framework, the Burnstone project was delayed and a decision to complete the development is expected to later in the 2026
financial year. The loss recognised in 2025 results from a significantly higher gold price outlook which resulted in increased expected future cash flows from Burnstone.
The gain recognised in 2024 resulted from the additional costs during the delay and the deferral of mine ramp-up which resulted in a decrease in the expected future
net cash flows from Burnstone, offsetting the impact of the increase in the weighted average gold price. The amount is included in the corporate and reconciling items
of the SA gold section of the segment report
27.7 Keliber loan facilities
Sibanye-Stillwater executed a EUR500 million green loan financing facility (Green loan) for the Keliber lithium project, through the Group's
subsidiary, Keliber Technology Oy. The Green loan secures capital expenditure funding required for the construction and development
Keliber's lithium mining, processing and refining facilities. The Green loan is a distinctive credit facility, comprising a bank financed
EUR250 million export credit agency (ECA) guaranteed tranche, a EUR150 million tranche provided by the European Investment Bank (EIB)
and a EUR100 million syndicated commercial bank tranche.
Terms of the EUR250 million ECA facility
| | |
| | |
| | |
| |
| Seven years, with final payment on 20 August 2031 |
| | |
Security and/or guarantors: | The facility is unsecured and guaranteed by the Company, SGL, Stillwater, Kroondal, SRPM, EPL, WPL, Keliber and Sibanye UK Financing |
Terms of the EUR150 million EIB facility
| | |
| | |
| | |
| |
| Eight years, with final payment on 20 August 2032 |
| | |
Security and/or guarantors: | The facility is unsecured and guaranteed by the Company, SGL, Stillwater, Kroondal, SRPM, EPL, WPL, Keliber and Sibanye UK Financing |
Terms of the EUR100 million commercial bank facility
| | |
| | |
| | |
| 2.1% if net debt to adjusted EBITDA is less than 2.5x |
| 2.3% if net debt to adjusted EBITDA is greater than 2.5x but less than or equal to 3.0x |
| 2.5% if net debt to adjusted EBITDA is greater than 3.0x |
| Seven years, with final payment on 20 August 2031 |
| | |
Security and/or guarantors: | The facility is unsecured and guaranteed by the Company, SGL, Stillwater, Kroondal, SRPM, EPL, WPL, Keliber and Sibanye UK Financing |
NOTES TO THE CONSOLIDATED FINANCIAL STATEMENTS continued
For the year ended 31 December 2025
| | | | |
Figures in million – SA rand | | | | |
Balance at beginning of the year | | | | |
| | | | |
Unwinding of amortised cost | | | | |
| | | | |
| | | | |
(Gain)/loss on foreign exchange differences | | | | |
Balance at end of the year | | | | |
Current portion of balance | | | | |
Non-current portion of balance | | | | |
27.8 Other borrowings
Short-term credit facilities and other borrowings
Sibanye-Stillwater has committed and uncommitted short term loan facilities with various banks to fund capital expenditure, general
corporate expenses as well as provide financing flexibility at its operations. These facilities have no fixed terms, are short-term in nature and
interest rates are market related. Other borrowings also include borrowings acquired on and after acquisition of Sandouville, Keliber,
Century and Reldan.
| | | | |
Figures in million – SA rand | | | | |
Balance at beginning of the year | | | | |
| | | | |
| | | | |
| | | | |
| | | | |
Borrowings acquired on acquisition of subsidiary | | | | |
(Gain)/loss on foreign exchange differences | | | | |
Balance at end of the year | | | | |
Current portion of balance | | | | |
Non-current portion of balance | | | | |
NOTES TO THE CONSOLIDATED FINANCIAL STATEMENTS continued
For the year ended 31 December 2025
27.9 Fair value of financial instruments and risk management
Fair value of borrowings
The carrying amounts of variable interest rate borrowings approximates fair value as the interest rates charged are considered market
related. The fair value of fixed interest rate borrowings was determined through reference to ruling market prices and interest rates.
The table below shows the fair value and carrying amount of borrowings where the carrying amount does not approximate fair value:
| | | | |
| | |
Figures in million - SA rand | | | | |
| | | | |
| | | | |
| | | | |
| | | | |
| | | | |
| | | | |
| | | | |
| | | | |
| | | | |
| | | | |
| | | | |
| | | | |
| | | | |
| | | | |
| | | | |
1The fair value is based on the quoted market prices of the notes
2The fair value of the Burnstone Debt is derived from discounted cash flow models. These models use several key assumptions, including estimates of future sales volumes,
gold prices, operating costs, capital expenditure and discount rate. See note 27.6 for the key assumptions used, except for the discount rate applied in the fair value
disclosure above of 8.69% (2024: 9.55%, 2023: 10.74%), which was adjusted to a market-related rate. The fair value estimate is sensitive to changes in the key assumptions,
for example, increases in the market related discount rate would decrease the fair value if all other inputs remain unchanged. The extent of the fair value changes would
depend on how inputs change in relation to each other
3The fair value at 31 December 2025 represents the quoted price of the US$ Convertible Bond. The fair value of the amortised cost component amounts to R7,990 million
(2024: R8,231 million) (level 2) at 31 December 2025 and is calculated by deducting the fair value of the share conversion option from the quoted price. Following the
transfer of the derivative component to equity (see note 27.5), it is no longer remeasured to fair value through profit or loss. The fair value at 31 December 2023 represents
the fair value of the amortised cost component of the US$ Convertible Bond, which was calculated based on the quoted price of the instrument after separating the fair
value of the derivative component
Liquidity risk
The Group's liquidity risk management and maturity analysis of financial liabilities are disclosed in note 35.2.
Market risk
Foreign currency sensitivity
Certain of the Group’s foreign currency borrowing facilities are repayable by companies with SA rand as their functional currency,
therefore some of the Group’s borrowings are sensitive to changes in the rand/US dollar exchange rate. The Group is also exposed to
foreign currency risk on intercompany loans denominated in USD, EUR and AUD to the extent that foreign exchange differences are
recognised in profit or loss. A one percentage point change in the SA rand closing exchange rate of R16.57/US$ (2024: R18.76/US$ and
2023: R18.57/US$), R19.44/€ (2024: R19.53/€, 2023: R20.53/€) and R11.05/A$ (2024: R11.67/A$, 2023: R12.66/A$) would have changed profit
or loss before tax by R31 million (2024: R13 million and 2023: R25 million).
Interest rate sensitivity
As at 31 December 2025, the Group’s total borrowings amounted to R43,257 million (2024: R41,687 million and 2023: R36,618 million). The
Group generally does not undertake any specific action to cover its exposure to interest rate risk, although it may do so in specific
circumstances.
The portion of Sibanye-Stillwater’s interest-bearing borrowings at period end that is exposed to interest rate fluctuations is R15,944 million
(2024: R10,898 million and 2023: R6,873 million). This debt is normally rolled for periods between one and three months and is therefore
exposed to the rate changes in this period. See the Group's exposure to interest rate changes presented further in this note.
NOTES TO THE CONSOLIDATED FINANCIAL STATEMENTS continued
For the year ended 31 December 2025
The Burnstone debt and the R6.5 billion RCF are affected by the amendments to IFRS 9 relating to interest rate benchmark reform, in
particular the replacement of IBORs, which came into effect on 1 January 2021. However, the R6.5 billion RCF is linked to JIBAR and is only
expected to be impacted by the IBOR reform at a later stage when it will transition to the ZARONIA prior to the last publication of the JIBAR.
Any impact thereof can only be considered when this occurs since it is unknown if the RCF will be drawn down at that stage. The Burnstone
Debt was linked to a US LIBOR at 31 December 2023 and on 1 March 2024, the Group transitioned the Burnstone Debt to a term SOFR
(consistent with the US$1 billion RCF). Management performed an assessment on the transition of the Burnstone Debt to the new interest
rate and there was no material impact on the Group.
The table below summarises the effect of a change in finance expense on the Group’s profit or loss before tax had JIBAR, term SOFR,
EURIBOR or LIBOR (up to 2023) differed as indicated. The analysis is based on the assumption that the applicable interest rate increased/
decreased with all other variables remaining constant. All financial instruments with fixed interest rates that are carried at amortised cost
are not subject to the interest rate sensitivity analysis.
Interest rate sensitivity analysis
| | | | | | |
| Change in interest expenses for a change in interest rate1 |
Figures in million - SA rand | | | | | | |
| | | | | | |
| | | | | | |
| | | | | | |
| | | | | | |
Change in finance expense | | | | | | |
| | | | | | |
| | | | | | |
| | | | | | |
| | | | | | |
Change in finance expense | | | | | | |
| | | | | | |
| | | | | | |
| | | | | | |
Change in finance expense | | | | | | |
1Interest rate sensitivity analysis is performed on the borrowings balance at 31 December
The exposure to interest rate changes and the contractual repricing dates
The exposure of the Group’s borrowings to interest rate changes and the contractual repricing dates at the reporting dates is as follows:
| | | | |
Figures in million - SA rand | | | | |
Floating rate with exposure to change in JIBAR | | | | |
Floating rate with exposure to change in term SOFR | | | | |
Floating rate with exposure to change in LIBOR | | | | |
Floating rate with exposure to change in EURIBOR | | | | |
Non-current borrowings exposed to interest rate changes | | | | |
The Group has the following undrawn borrowing facilities: | | | | |
| | | | |
| | | | |
| | | | |
All of the above facilities have floating rates. The undrawn committed facilities have the following expiry dates: | | | | |
| | | | |
- later than one year and not later than two years | | | | |
- later than two years and not later than three years | | | | |
| | | | |
Total undrawn committed facilities | | | | |
NOTES TO THE CONSOLIDATED FINANCIAL STATEMENTS continued
For the year ended 31 December 2025
27.10 Capital management
The Group’s primary objective relating to managing its capital, is to ensure that there is sufficient capital available to support the funding
requirements of the Group, including capital expenditure, in a way that: optimises the cost of capital; maximises shareholders’ returns; and
ensures that the Group remains in a sound financial position.
The Group manages and makes adjustments to the capital structure as and when borrowings mature or as and when funding is required.
This may take the form of raising equity, market or bank debt or hybrids thereof. Opportunities in the market are also monitored closely to
ensure that the most efficient funding solutions are implemented.
The Group monitors capital using the ratio of net debt/(cash) to adjusted earnings before interest, taxes, depreciation and amortisation
(EBITDA), but does not set absolute limits for this ratio.
| | | | |
Figures in million - SA rand | | | | |
| | | | |
Adjusted cash and cash equivalents2 | | | | |
| | | | |
| | | | |
Net debt to adjusted EBITDA (ratio)5 | | | | |
1Adjusted borrowings are only those borrowings that have recourse to Sibanye-Stillwater. Adjusted borrowings, therefore, exclude the Burnstone Debt and include the
derivative financial instrument relating to the US$ Convertible Bond, until it was derecognised on 26 June 2024
2Adjusted cash and cash equivalents exclude cash of Burnstone
3Net debt represents borrowings and bank overdraft less cash and cash equivalents. Borrowings are only those borrowings that have recourse to Sibanye-Stillwater and,
therefore, exclude the Burnstone Debt and include the derivative financial instrument relating to the US$ Convertible Bond, until it was derecognised on 26 June 2024. Net
debt excludes cash of Burnstone
4The adjusted EBITDA calculation is based on the definitions included in the facility agreements for compliance with the debt covenant formula, except for impact of new
accounting standards and acquisitions, where the facility agreements allow the results from the acquired operations to be annualised. Adjusted EBITDA may not be
comparable to similarly titled measures of other companies. Adjusted EBITDA is not a measure of performance under IFRS Accounting Standards and should be
considered in addition to, and not as a substitute for, other measures of financial performance and liquidity
5Net debt to adjusted EBITDA ratio is defined as net debt as of the end of a reporting period divided by adjusted EBITDA of the 12 months ended on the same reporting
date. Non-IFRS measures such as net debt to adjusted EBITDA is presented for illustration purposes only, and because of its nature, net debt to adjusted EBITDA should not
be considered as a representation of financial performance under IFRS Accounting Standards and should be considered in addition to, and not as a substitute for, other
measures of financial performance and liquidity
NOTES TO THE CONSOLIDATED FINANCIAL STATEMENTS continued
For the year ended 31 December 2025
Reconciliation of profit/(loss) before royalties, carbon tax and tax to adjusted EBITDA:
| | | | |
Figures in million - SA rand | | | | |
Profit/(loss) before royalties, carbon tax and tax | | | | |
| | | | |
Amortisation and depreciation | | | | |
| | | | |
| | | | |
| | | | |
Loss/(gain) on financial instruments | | | | |
(Gain)/loss on foreign exchange differences | | | | |
Share of results of equity-accounted investees after tax | | | | |
Change in estimate of environmental rehabilitation obligation, and right of recovery receivable and payable | | | | |
Gain on disposal of property, plant and equipment | | | | |
Impairments and reversal of impairments | | | | |
Onerous contract provision | | | | |
| | | | |
| | | | |
Provision for community costs post closure | | | | |
Corporate leadership costs | | | | |
Gain on remeasurement of previous interest in Kroondal | | | | |
Gain on increase in equity-accounted investment | | | | |
| | | | |
| | | | |
Gain on assets held for sale | | | | |
| | | | |
Compensation for losses incurred | | | | |
Occupational healthcare loss/(gain) | | | | |
| | | | |
NOTES TO THE CONSOLIDATED FINANCIAL STATEMENTS continued
For the year ended 31 December 2025
28. Lease liabilities
|
Accounting policy At the inception of a contract, the Group assesses whether a contract is, or contains, a lease. A contract is, or contains, a lease if the contract conveys the right to control the use of an identified asset for a period of time in exchange for consideration. Lease liabilities are initially measured at the present value of the future lease payments at the commencement date, discounted using the interest rate implicit in the lease or, if that rate cannot be readily determined, the relevant incremental borrowing rate. Subsequently, lease liabilities are measured at amortised cost using the effective interest method. Lease liabilities are remeasured when there is a change in future lease payments arising from a change in an index or rate, if there is a change in the Group’s estimate of the amount expected to be payable under a residual value guarantee, or if the Group changes its assessment of whether it will exercise a purchase, extension or termination option. When the lease liability is remeasured in this way, a corresponding adjustment is made to the carrying amount of the right-of-use asset, or is recorded in profit or loss if the carrying amount of the right-of-use asset has been reduced to zero. The Group also elected to apply the recognition exemptions for lease contracts that, at the commencement date, have a lease term of 12 months or less and do not contain a purchase option, and lease contracts for which the underlying asset is of low value. The Group recognises the lease payments associated with these leases as an expense on a straight-line basis over the lease term to the extent applicable. In addition, certain variable lease payments are not permitted to be recognised as lease liabilities and are expensed as incurred. |
| | | | |
Figures in million - SA rand | | | | |
Balance at beginning of the year | | | | |
New leases and modifications | | | | |
Lease liabilities on acquisition of subsidiaries | | | | |
Repayment of lease liabilities (including interest) | | | | |
| | | | |
Foreign currency translation | | | | |
Balance at end of the year | | | | |
Current portion of lease liabilities | | | | |
Non-current lease liabilities | | | | |
Lease payments not recognised as a liability but expensed during the year
| | | |
Figures in million - SA rand | | | |
| | | |
Leases of low value assets | | | |
| | | |
| | | |
Maturity Analysis
The lease liabilities are secured by the related underlying assets. The undiscounted maturity analysis of lease liabilities at 31 December is as
follows:
| | | | |
Figures in million - SA rand | | | Between one and five years | |
Contractual undiscounted cash flows — 2025 | | | | |
Contractual undiscounted cash flows — 2024 | | | | |
Contractual undiscounted cash flows — 2023 | | | | |
NOTES TO THE CONSOLIDATED FINANCIAL STATEMENTS continued
For the year ended 31 December 2025
29. Environmental rehabilitation obligation and other provisions
|
Significant accounting judgements and estimates Environmental rehabilitation obligation The Group’s mining and exploration activities are subject to various laws and regulations governing the protection of the environment. The Group recognises a provision for management’s best estimate for asset retirement and environmental obligations in the period in which they are incurred. Actual costs incurred in future periods could differ materially from the estimates. Additionally, future changes to environmental laws and regulations, life-of-mine estimates and discount rates could affect the carrying amounts of these provisions. The estimated cost of remediating environmental disturbances is based on the Group’s best estimate of the actual future expenditure to settle the present obligation at the end of the reporting period, as required by environmental regulations to remediate the current damage caused, and depends on the nature and management’s use of the relevant operation. |
| | | |
These provisions are calculated using the following assumptions: |
| | | |
| | | |
| | | |
| | | |
| | | |
| | | |
| | | |
| | | |
| | | |
| | | |
| | | |
| | | |
| | | |
| | | |
| | | |
| | | |
| | | |
| | | |
| | | |
| | | |
Onerous contract The measurement of the onerous contract provision is subject to various inputs such as estimated revenue to be generated from the contract, which is impacted by pricing and volume assumptions, as well as estimated costs to be incurred such as production costs, which include overheads, labour and manufacturing input cost. Changes to these inputs could materially impact the cash flows included in the measurement of the onerous contract provision. |
NOTES TO THE CONSOLIDATED FINANCIAL STATEMENTS continued
For the year ended 31 December 2025
|
Accounting Policy Provisions are recognised when the Group has a present obligation, legal or constructive, resulting from past events and it is probable that an outflow of resources embodying economic benefits will be required to settle the obligation and a reliable estimate can be made of the amount of the obligation. Provisions are measured by discounting the expected future cash flows at a pre-tax rate that reflects current market assessments of the time value of money and the risks specific to the liability. The unwinding of the discount is recognised as finance cost. Environmental rehabilitation obligation Long-term environmental obligations are based on the Group’s environmental management plans, in compliance with applicable environmental and regulatory requirements. The estimated costs of rehabilitation are reviewed annually and adjusted as appropriate for changes in legislation, technology or other circumstances. Cost estimates are not reduced by the potential proceeds from the sale of assets or from plant clean up at closure. Based on disturbances to date, the net present value of expected rehabilitation cost estimates is recognised and provided for in full in the financial statements. The estimates are reviewed annually and are discounted using a risk-free rate that is adjusted to reflect the current market assessments of the time value of money. Annual changes in the provision consist of notional finance costs relating to the change in the present value of the provision and inflationary increases in the provision estimate, as well as changes in estimated cost of rehabilitation, remediation and decommissioning. Changes in estimates are capitalised or reversed against the related asset to the extent that it meets the definition of dismantling and removing the item and restoring the site on which it is located. Costs that relate to an existing condition caused by past operations and do not have a future economic benefit are recognised in profit or loss. If a decrease in the liability exceeds the carrying amount of the asset, the excess is recognised immediately in profit or loss. The present value of environmental disturbances created are capitalised to mining assets against an increase in the environmental rehabilitation obligation. Rehabilitation projects undertaken, included in the estimates, are charged to the provision as incurred. The cost of ongoing current programmes to prevent and control environmental disturbances is recognised in profit or loss as incurred. The unwinding of the discount due to the passage of time is recognised as finance cost, and the capitalised cost is amortised over the remaining lives of the mines. Onerous contract provision Onerous contract provisions are measured at the present value of the lower of the expected cost of terminating the contract and the expected net cost of continuing with the contract, which is determined based on the incremental cost of fulfilling the obligation under the contract and an allocation of other cost directly related to fulfilling the contract. Before a provision is established, the Group recognises any impairment loss on the assets associated with the contract. |
| | | | |
Figures in million – SA rand | | | | |
Environmental rehabilitation obligation | | | | |
| | | | |
Balance at end of the year | | | | |
Current portion of environmental rehabilitation obligation and other provisions | | | | |
Non-current portion of environmental rehabilitation obligation and other provisions | | | | |
29.1 Environmental rehabilitation obligation
| | | | |
Figures in million - SA rand | | | | |
Balance at beginning of the year | | | | |
| | | | |
Utilisation of environmental rehabilitation obligation1 | | | | |
Change in estimates charged to profit or loss2 | | | | |
Change in estimates capitalised2 | | | | |
Environmental rehabilitation obligation on acquisition of subsidiaries | | | | |
Derecognition with deemed disposal of interest in joint operation | | | | |
Liabilities associated with assets held for sale | | | | |
Foreign currency translation | | | | |
Balance at end of the year | | | | |
Reconciliation of the non-current and current portion of the environmental rehabilitation obligation: | | | | |
Environmental rehabilitation obligation | | | | |
Current portion of environmental rehabilitation obligation | | | | |
Non-current portion of environmental rehabilitation obligation | | | | |
1The cost of ongoing current programmes to prevent and control environmental disturbances, including reclamation activities, is charged to cost of sales as incurred
2Changes in estimates result from changes in reserves and corresponding changes in life-of-mine, changes in discount rates, changes in closure cost estimates, including
new information obtained through further studies completed and changes in laws and regulations governing environmental matters
The Group’s mining operations are required by law to undertake rehabilitation works as part of their ongoing operations. The Group makes
contributions into environmental rehabilitation obligation funds (see note 20) and holds guarantees to fund the estimated costs.
NOTES TO THE CONSOLIDATED FINANCIAL STATEMENTS continued
For the year ended 31 December 2025
The Group's environmental rehabilitation obligation is sensitive to changes in certain assumptions applied in the calculation of the balance
of the obligation at 31 December 2025. The table below illustrates the impact of certain changes to the assumptions on the balance of the
obligation at 31 December 2025, holding all other assumptions constant:
| | |
| | Impact on the environmental rehabilitation obligation (SA rand millions) |
| | |
| | |
| | |
29.2 Other provisions
| | | | |
Figures in million - SA rand | | | | |
Balance at beginning of the year | | | | |
Onerous contract provision recognised1 | | | | |
Legal settlement provision raised | | | | |
| | | | |
Change in onerous contract provision recognised through profit or loss2 | | | | |
| | | | |
Foreign currency translation | | | | |
Balance at end of the year | | | | |
Other provisions consists of: | | | | |
Onerous contract provisions4 | | | | |
| | | | |
| | | | |
Reconciliation of the non-current and current portion of other provisions: | | | | |
| | | | |
Current portion of other provisions5 | | | | |
Non-current portion of other provisions | | | | |
1This is an onerous supply contract provision relating to the raw material used in the Sandouville nickel refinery's production process, which is purchased under a single
supply contract previously maturing on 31 December 2027. Due to sustained losses incurred at the operation, the Group assessed whether the supply contract is onerous
at 31 December 2023. Consequently, the Group determined whether the unavoidable costs of meeting the obligations under the contract exceed the economic
benefits expected to be received under it. The unavoidable costs under a contract reflect the least net cost of exiting from the contract, which is the lower of the cost of
fulfilling it and any compensation or penalties arising from failure to fulfil it. Based on this assessment, the Group recognised an onerous contract provision amounting to
R1,865 million, which represents the present value at 31 December 2023 of the penalty payable on early exiting the supply contract and the unavoidable losses to be
incurred in meeting Sandouville's obligations under the contract during the notice period. Before the separate provision for the onerous contract was established, the
Group recognised an impairment loss on assets, partially dedicated to the contract (see note 10). The onerous contract provision was calculated based on an
expectation of terminating the contract in line with the required notice period and discounted at a pre-tax rate of 5.75%, reflecting the risks specific to the provision.
During 2024, the Group agreed with the supplier to terminate this supply contract with final delivery made in January 2025. During 2024, additional provisions were raised
for onerous contracts amounting to R200 million in respect of the Sandouville nickel refinery's production process
2The provision, included in Sandouville segment, decreased due to the realisation of onerous contract losses provided for at 31 December 2023
3A payment made for R45 million (2024: R665 million) was in respect of a penalty resulting from early exiting the supply contract. The remaining payment was in respect of
the legal settlement with Appian
4Included in the 2024 balance is the onerous contract provision relating to the raw material used in the Sandouville nickel refinery's production amounting to R121 million
and the balance relates to additional provisions raised for onerous contracts in respect of the Sandouville nickel refinery's production process
5The current portion at 31 December 2025, 31 December 2024 and 31 December 2023 relates to the onerous contract provisions
Post closure water management liability
The Sibanye-Stillwater SA Region continues to monitor the potential risk of long-term acid and non-acidic mine impacted water and other
groundwater pollution challenges, also experienced by peer mining groups operating in similar geological settings.
Acid mine drainage (AMD) specifically relates to the acidification and contamination of naturally occurring water resources by pyrite-
bearing rock/ ore contained in underground mines, rock dumps, tailings facilities and pits on surface. The SA Region has made progress in
reliably determining the financial impact that AMD and groundwater pollution may have on the Group. The quantification of any post-
closure latent environmental impacts is affected by the proposed Financial Provisioning Regulations (2015, as amended), as well as
determining and finalising a workable solution, and approval of management’s plans and strategies to prepare a sufficiently reliable
estimate. The effective date of the regulations is yet to be announced.
All water-related risks, whether operational or post-closure, are dealt with as part of our enterprise risk management framework. As at 31
December 2025, closure liability assessments make financial provision of R3,123 million (undiscounted) for what it specifically termed “Post-
closure aspects”. This includes but is not limited to amongst others, post-closure water management aspects such as initial and post-decant
surface and groundwater monitoring, wetlands, biomonitoring and aquatics monitoring and care-and-maintenance monitoring.
This value also includes a revised post-closure water treatment scenario for the Marikana operations. During the operational life-of-mine,
pre-closure, the Group aims to investigate, identify and implement practical, sustainable and cost-effective solutions that, where possible,
reduces post-closure impacts as effectively as possible, whilst also promoting the establishment and implementation of self-sustaining
NOTES TO THE CONSOLIDATED FINANCIAL STATEMENTS continued
For the year ended 31 December 2025
ecosystems and processes, respectively, that would require very limited or no ongoing active management by the operation, in a post-
closure scenario. This is directly aligned to the Group’s long-term vision of full water stewardship maturity by 2033.
Appian Capital legal settlement
Included in the transaction and project costs of R4,543 million on the income statement, is the settlement amount of R3,607 million relating
to the Appian Capital legal settlement during 2025.
On 26 October 2021, Sibanye-Stillwater entered into share purchase agreements (the Atlantic Nickel SPA and the MVV SPA, respectively
(together, the SPAs)) to acquire the Santa Rita nickel mine and Serrote copper mine (together, the Assets) from affiliates of Appian Capital
Advisory LLP (Appian). On 9 November 2021, a geotechnical event occurred at the Santa Rita Mine. After becoming aware of the
geotechnical event, Sibanye-Stillwater assessed the event and its effect and concluded that the event was and was reasonably expected
to be material and adverse to the business, financial condition, results of operations, the properties, assets, liabilities or operations of the
Santa Rita Mine. Sibanye-Stillwater therefore considered that a condition to closing under the Atlantic Nickel SPA had not been satisfied.
Accordingly, Sibanye-Stillwater gave notice of termination of the Atlantic Nickel SPA on 24 January 2022. As the MVV SPA was conditional
on the closing of the Atlantic Nickel SPA, Sibanye-Stillwater also gave notice of termination of the MVV SPA on the same day. On 3 February
2022, Appian sent a letter to Sibanye-Stillwater indicating that it was terminating the SPAs by reason of Sibanye-Stillwater’s wrongful
repudiation and/or renunciation of the SPAs.
Legal proceedings commenced in 2024. The first phase of the proceedings related to whether the geotechnical event was, or could
reasonably be expected to be, material and adverse (the Liability Trial). In a judgment handed down on 10 October 2024, the Court ruled
that the geotechnical event was not, and was not reasonably expected to be, material and adverse, such that Sibanye-Stillwater was not
entitled to terminate the SPAs. However, the Court dismissed Appian's claim of wilful misconduct, ruling that the management of Sibanye-
Stillwater genuinely believed that it was entitled to terminate the SPAs in the best interests of Sibanye-Stillwater.
The second phase of the proceedings was scheduled to proceed to trial in November 2025 (the Quantum Trial), at which the Court would
have determined the damages that Sibanye-Stillwater may be required to pay to Appian. On 10 November 2025, before the Quantum Trial
commenced, Sibanye-Stillwater and Appian agreed a commercial settlement of the dispute for a total payment of US$215 million
(R3,607 million) (including legal fees). The Group recognised the settlement of the dispute under transaction and project costs of R4,543
million on the income statement and included it in Group corporate on the segment report. Some of the legal fees were already settled
after the Liability Trial, with the remaining payment, after foreign exchange movements, amounting to R3,565 million settled on 9 December
2025, after South African Reserve Bank approval.
NOTES TO THE CONSOLIDATED FINANCIAL STATEMENTS continued
For the year ended 31 December 2025
30. Occupational healthcare obligation
|
Significant accounting judgements and estimates The Group recognises management’s best estimates to settle any occupational healthcare claims against the Group’s operations. The ultimate outcome of the number, timing and amount of successful claims to be paid out remains uncertain. The provision is consequently subject to adjustment in the future and actual costs incurred in future periods could differ materially from the estimates. Estimates that were used in the assessment include value of benefits per claimant, disease progression rates, required contributions, timing of payments, tracing pattern, period discount rates, period inflation rates and a 60% take-up rate (2024: 60% and 2023: 66%). These estimates were informed by a professional opinion. Management discounted the possible cash outflows using a discount rate of 8.37% (2024: 10.31% and 2023: 9.44%). In assessing whether the Group has control, joint control or significant influence over the trust that administers the claim settlement process (see below), judgement was applied in determining whether voting rights are relevant to determine power over the key activities of the trust, as well as analysing the influence of the various parties. No control, joint control or significant influence was identified, however should any key considerations change in future periods, these conclusions will be reassessed. Accounting policy Provisions are recognised when the Group has a present obligation, legal or constructive resulting from past events and it is probable that an outflow of resources embodying economic benefits will be required to settle the obligation and a reliable estimate can be made of the amount of the obligation. The estimated costs of settlement claims are reviewed at least annually and adjusted as appropriate for changes in cash flow predictions or other circumstances. Based on estimates to date, the net present value of expected settlement claims is recognised and provided for in full in the financial statements. The estimated cash flows are discounted using a risk-free rate with similar terms to the obligation to reflect the current market assessments of the time value of money. Annual changes in the provision consist of finance costs relating to the change in the present value of the provision and changes in estimates. |
On 3 May 2018, the Occupational Lung Disease Working Group (the Working Group), including Sibanye-Stillwater, agreed to an
approximately R5 billion class action settlement with the claimants (Settlement Agreement). On 26 July 2019 the Gauteng High Court in
Johannesburg approved the R5 billion Settlement Agreement in the silicosis class action suit. This Settlement Agreement provides
compensation to all eligible workers suffering from silicosis and/or tuberculosis who worked in the Occupational Lung Disease Working
Group companies’ mines from 12 March 1965 to the date of the Settlement Agreement.
The Settlement Agreement required the formation of the Tshiamiso Trust (the Trust) to administer the claim settlement process, which
includes tracing claimants, assessing and processing submitted claims and paying benefits to eligible claimants. The Trust will be funded by
the participants to the Working Group through contributions determined in accordance with the Settlement Agreement. In addition, a
special purpose vehicle was created with the objective of performing certain functions on behalf of the Working Group as set out in the
deed of the Trust and Settlement Agreement. The special purpose vehicle and Trust are not controlled by the Group.
On 19 December 2019 Sibanye-Stillwater provided a guarantee for an amount not exceeding R1,372 million in respect of administration
contributions, initial benefit contributions and benefit contributions to the Trust as required by the trust deed. At 31 December 2025, the
value of the guarantee amounted to R400 million (2024: R958 million, 2023: R992 million).
Sibanye-Stillwater's current provision for its share of the settlement cost amounts to R384 million. The provision is subject to adjustment in the
future based on the number of eligible workers and changes in other assumptions.
| | | | |
Figures in million - SA rand | | | | |
Balance at beginning of the year | | | | |
| | | | |
Change in estimate recognised in profit or loss1 | | | | |
| | | | |
Balance at the end of the year | | | | |
Reconciliation of the non-current and current portion of the occupational healthcare obligation: | | | | |
Occupational healthcare obligation | | | | |
Current portion of occupational healthcare obligation | | | | |
Non-current portion of occupational healthcare obligation | | | | |
1The gain is mainly due to the decrease in the take-up rate and an increase in the discount rate
NOTES TO THE CONSOLIDATED FINANCIAL STATEMENTS continued
For the year ended 31 December 2025
DRDGOLD is not a party to the Working Group’s mediated settlement agreement and DRDGOLD maintains the view that it is too early to
consider settlement of the matter, mainly for the following reasons:
•the applicants have as yet not issued and served a summons (claim) in the matter to DRDGOLD
•there is no indication of the number of potential claimants that may join the class action against the DRDGOLD respondents
•many principles upon which legal responsibility may be founded, are required to be substantially developed by the trial court (and
possibly subsequent courts of appeal) to establish liability on the bases alleged by the applicants
In light of the above, there is inadequate information for DRDGOLD to determine if a sufficient legal and factual basis exists to establish
liability, and to quantify such potential liability.
31. Deferred revenue
|
Significant accounting judgements and estimates Upfront cash deposits received for streaming transactions have been accounted for as contract liabilities (deferred revenue) in the scope of IFRS 15. These contracts are not financial instruments because they will be satisfied through the delivery of non-financial items (i.e. delivering of metal ounces) as part of the Group’s expected sale requirements, rather than cash or financial assets. It is the intention to satisfy the performance obligations under these streaming arrangements through the Group’s production, and revenue will be recognised over duration of the contracts as the Group satisfies its obligation to deliver metal ounces. Where these contracts are of a long-term nature and the Group received a portion of the consideration at the inception, these contracts contain a significant financing component under IFRS 15. In these instances, the Group therefore makes a critical estimate of the discount rate that should be applied to the contract liabilities over the life of contracts where applicable. Inputs to the model to unwind the Wheaton International advance received to revenue The advance received has been recognised on the statement of financial position as deferred revenue. The deferred revenue will be recognised as revenue in profit or loss based on the metal ounces/credits in relation to the expected total amount of metal credits to be delivered over the term of the arrangement. |
| | |
Each period management estimates the cumulative amount of the deferred revenue obligation that has been satisfied and, therefore, recognised as revenue. Key inputs into the model are: |
| | |
Estimated financing rate over life of arrangement | | Rate applied to discount the palladium and gold stream |
| | The life of the stream is based on the approved life-of-mine for the US PGM operations, plus a determined number of resources. The resources included were determined based on an evaluation of specific mining areas and possible projects at the mining areas. |
Palladium entitlement percentage | | The palladium entitlement percentage will be either 4.5%, 2.25% or 1% over the life of the mine, depending on whether or not the advance has been fully reduced, and a certain number of contractual ounces have been delivered (375,000 ounces for the first trigger drop down to 2.25%and 550,000 ounces for the second trigger drop down rate to 1%). |
Gold entitlement percentage | | The gold entitlement percentage will be 100% over the life of the mine. |
| | The monthly cash payment to be received is 18%, 16%, 14% or 10% of the market price of the metal credit delivery to Wheaton International while the advance is not fully reduced. After the advance has been fully reduced, the cash percentage is 22%, 20%, 18% or 14%. The percentage applicable depends on the investment grade of the Group and its leverage ratio. As long as Sibanye-Stillwater’s current investment grade condition as stipulated in the contract remains, the monthly cash percentage decreases if the Group’s leverage ratio increases above 3.5:1. The balance of the ounces in the monthly delivery (i.e. 100%-18%= 82%) is then used to determine the utilisation of the deferred revenue balance. |
| Five day simple average calculated the day before delivery | The value of each metal credit delivery is determined in terms of the contract. |
NOTES TO THE CONSOLIDATED FINANCIAL STATEMENTS continued
For the year ended 31 December 2025
| | |
Inputs to the model to unwind the Franco-Nevada advance received to revenue |
| | |
Estimated financing rate over life of the arrangement | | Rate applied at initial recognition to discount the platinum and gold stream, based on the expected gold and platinum to be delivered (including a determined number of resources). |
| Marikana - 84 years Rustenburg - 106 years | The life of the stream is based on the approved life-of-mine for Marikana, Rustenburg (excluding Kroondal) and Kroondal plus a determined number of resources. The resources included were determined based on an evaluation of specific mining areas and possible projects at the mining areas. |
Platinum entitlement percentage | 1% of platinum production | 1% of refined platinum ounces up to delivery of 48,000 ounces, after which it increases to 2.1% of refined platinum ounces up to delivery of 294,000 ounces in aggregate, after which the platinum stream is completed. |
Gold entitlement percentage | 1.1% of 4E PGM production | 1.1% of 4E PGM ounces produced up to delivery of 87,500 ounces of refined gold, after which it decreases to 0.75% of 4E PGM ounces produced up to delivery of 237,000 ounces of refined gold in aggregate, after which it is 80% of refined gold production. |
| 5% of spot gold and spot platinum price | The gold cash payment is 5% until 237,000 refined ounces is delivered after which it increases to 10%. Platinum is fixed at 5% over the life of the stream. |
Allocation of stream between commodities over the expected life of the arrangement | | The US$500 million prepayment was allocated between gold and platinum at inception of the stream based on forward commodity consensus prices. |
| | The covenant reduction date is the date on which the aggregate gold and platinum deliveries under the terms of the stream exceeds US$600 million. Once the covenant reduction date is reached, certain limitations on incurring debt and encumbrances on assets fall away and instances where the production payments are limited to a nominal fixed amount per ounce no longer apply. |
| | |
Any changes to the above key inputs could significantly change the quantum of the cumulative revenue amount recognised in profit or loss. Any changes in the life-of-mine are accounted for prospectively as a cumulative catch-up in the year that the life-of-mine estimate above changes, or the inclusion of resources changes. |
|
Accounting policy Consideration received in advance is recognised as a contract liability (deferred revenue) under IFRS 15 as control has not yet transferred. Where a significant financing component is identified as a result of the difference in the timing of advance consideration received and when control of the metal promised transfers, interest expenses on the deferred revenue balance are recognised in finance costs. Where a contract has a period of a year or less between receiving advance consideration and when control of the metal promised transfers, the Group may elect on a contract-by-contract basis to apply the IFRS 15 practical expedient not to adjust for the effects of a significant financing component. |
Wheaton Stream
In July 2018, the Group entered into a gold and palladium supply arrangement with Wheaton International in exchange for an upfront
advance payment of R6,555 million (US$500 million) (Wheaton Stream). 100% of refined mined gold and currently 4.5% of refined mined
palladium from the Stillwater operations will be delivered to Wheaton International over the life-of-mine of the US PGM operations. In
addition to the advance payment, Wheaton International currently pays the Group 18% cash based on the value of gold and palladium
deliveries each month. The arrangement has been accounted for as a contract in the scope of IFRS 15 whereby the advance payment
has been recorded as deferred revenue. The revenue from the advance payment is recognised as the gold and palladium is allocated to
the appropriate Wheaton International account. An interest cost, representing the significant financing component of the upfront deposit
on the deferred revenue balance, is also recognised as part of finance costs. This finance cost increases the deferred revenue balance,
ultimately resulting in revenue when the deferred revenue is recognised over the life of the stream.
Franco-Nevada stream
On 19 December 2024 Sibanye-Stillwater entered into a US$500 million streaming agreement with Franco-Nevada in exchange for the sale
of gold and platinum streams with reference to the Marikana, Kroondal, and Rustenburg operations. The last condition precedent was
completed during February 2025, after which US$500 million (R9,215 million) upfront cash payment was received on 28 February 2025. The
arrangement is accounted as a contract in the scope of IFRS 15 whereby the advance payment has been recorded as deferred revenue.
The revenue from the advance payment is recognised as the gold and platinum is allocated to the appropriate Franco-Nevada account.
An interest cost, representing the significant financing component of the upfront deposit on the deferred revenue balance, is also
recognised as part of finance costs. This finance cost increases the deferred revenue balance, ultimately resulting in revenue when the
deferred revenue is recognised over the life of the stream.
NOTES TO THE CONSOLIDATED FINANCIAL STATEMENTS continued
For the year ended 31 December 2025
Gold prepay
On 21 August 2024, Sibanye-Stillwater, through its subsidiary SGL, concluded a gold prepayment arrangement whereby the Group received
a cash prepayment of R1,793 million in exchange for delivery of 1,497 kilograms of gold in equal monthly tranches (1,851 ounces per
month) from October 2024 to November 2026. The revenue from the prepayment will be recognised in equal parts on delivery of the gold.
The gold price delivered under the prepayment is hedged with a cap price of R1,736,000 per kilogram and a floor price of R1,350,000 per
kilogram. Sibanye-Stillwater receives, and recognises, the difference between the floor price and the spot price (subject to a maximum of
the cap price) on delivery of the gold.
Chrome prepay
On 1 December 2024, Sibanye-Stillwater, through its subsidiary SRPM, commenced a chrome prepayment arrangement whereby the
Group received a cash prepayment of US$50 million (R905 million) for delivery of chrome concentrate. The delivery will be made monthly of
minimum 40,000 tonnes (up to a maximum of 70,000 tonnes) of chrome concentrate until the prepaid amount (including interest) is settled
in full. The prepayment is amortised over an estimated period of six months in accordance with the chrome price per tonne stipulated in
the agreement.
The following table summarises the changes in deferred revenue:
| | | | |
Figures in million - SA rand | | | | |
Balance at beginning of the year | | | | |
Deferred revenue recognised on acquisition of subsidiary | | | | |
Deferred revenue advance received1 | | | | |
Deferred revenue recognised during the period2 | | | | |
| | | | |
Foreign currency translation | | | | |
Balance at the end of the year | | | | |
Reconciliation of the deferred revenue transactions balance at year end: | | | | |
| | | | |
| | | | |
| | | | |
| | | | |
Century deferred proceeds3 | | | | |
Reldan deferred proceeds3 | | | | |
Balance at the end of the year | | | | |
| | | | |
Reconciliation of the non-current and current portion of the deferred revenue: | | | | |
| | | | |
Current portion of deferred revenue | | | | |
Non-current portion of deferred revenue | | | | |
1The amount received for the year ended 31 December 2025 relates to the Franco-Nevada stream cash receipts amounting to R9,215 million, Century deferred proceeds,
amounting to cash receipts of R1,097 million (2024: R366 million, 2023: R935 million)) and Reldan deferred proceeds amounting R433 million (2024: R243 million). The
amount received in 2024 also includes the cash prepayments received in respect of the gold prepay and chrome prepay amounting to R1,793 million and R905 million,
respectively. The amount received for 31 December 2022 relates to the toll treatment arrangement entered into by Marikana, representing cash receipts of R24 million
2Revenue recognised during the year of R4,221 million relates to R281 million recognised on the Wheaton Stream (2024: R455 million, 2023: R392 million), R851 million related
to the Franco-Nevada stream, R1,001 million (2024: R662 million, 2023: R860 million) recognised in respect of Century deferred proceeds, R420 million (2024: R245 million)
recognised in respect of Reldan deferred proceeds, R935 million (2024: R234 million) recognised on the gold prepay and R733 million (2024: R172 million) recognised on
the chrome prepay
3The deferred proceeds relate to agreements with limited customers of Century and Reldan where proceeds for products are received in advance. Delivery of sold
product to customers is made between one and two months after receipt of the proceeds
NOTES TO THE CONSOLIDATED FINANCIAL STATEMENTS continued
For the year ended 31 December 2025
32. Trade and other payables
|
Accounting policy Trade and other payables, excluding payroll creditors, leave pay accruals and VAT payable are non-derivative financial liabilities categorised as other financial liabilities. Trade and other payables are recognised initially at fair value and subsequently measured at amortised cost using the effective interest method. Provision is made for employee entitlement benefits accumulated as a result of employees rendering services up to the reporting date. Liabilities arising in respect of wages and salaries, annual leave and other benefits due to be settled within 12 months of the reporting date are measured at rates which are expected to be paid when the liability is settled. Termination benefits are expensed and an accrual raised at the earlier of when the Group can no longer withdraw the offer of those benefits and when the Group recognises costs for a restructuring. If benefits are not expected to be settled wholly within 12 months of the reporting date, they are discounted. All other employee entitlement liabilities are measured at the present value of estimated payments to be made in respect of services rendered up to reporting date. |
| | | |
Figures in million - SA rand | | | |
| | | |
Accruals and other creditors | | | |
| | | |
| | | |
| | | |
| | | |
| | | |
Total trade and other payables | | | |
Fair value of trade and other payables
The carrying value of trade and other payables approximate the fair value due to the short maturity of the amounts payable.
Liquidity risk
Trade and other creditors are expected to be settled within 12 months from the reporting date (see note 35.2).
NOTES TO THE CONSOLIDATED FINANCIAL STATEMENTS continued
For the year ended 31 December 2025
33. Cash generated by operations
| | | | |
Figures in million - SA rand | | | | |
| | | | |
| | | | |
| | | | |
| | | | |
| | | | |
| | | | |
Profit/(loss) before interest, royalties, carbon tax and tax | | | | |
Non-cash adjusting items: | | | | |
Amortisation and depreciation | | | | |
| | | | |
| | | | |
Loss/(gain) on financial instruments | | | | |
Foreign currency exchange adjustment | | | | |
Share of results of equity-accounted investees after tax | | | | |
Impairments and reversal of impairments | | | | |
Provision for legal settlement cost | | | | |
| | | | |
Gain on remeasurement of previous interest in Kroondal | | | | |
Onerous contract provision | | | | |
Occupational healthcare loss/(gain) | | | | |
Change in estimate of environmental rehabilitation obligation | | | | |
Settlement of metals borrowings liability | | | | |
Deferred revenue recognised | | | | |
| | | | |
Early termination penalty relating to onerous contract provision | | | | |
Payment of settlement of dispute | | | | |
Payment of occupational healthcare liability | | | | |
Other non-cash and cash adjusting items | | | | |
Total cash generated by operations | | | | |
34. Change in working capital
| | | |
Figures in million - SA rand | | | |
| | | |
Trade and other receivables | | | |
| | | |
Total change in working capital | | | |
NOTES TO THE CONSOLIDATED FINANCIAL STATEMENTS continued
For the year ended 31 December 2025
35. Financial instruments and risk management
|
Accounting policy On initial recognition, a financial asset is classified as measured at either amortised cost, fair value through other comprehensive income, or fair value through profit or loss. The Group initially recognises debt instruments issued and trade and other receivables, on the date these are originated. All other financial assets and financial liabilities are recognised initially when the Group becomes a party to the contractual provisions of the instrument. The classification of financial assets at initial recognition that are debt instruments depends on the financial asset’s contractual cash flow characteristics and the Group’s business model for managing them. In order for a financial asset to be classified and measured at amortised cost, it needs to give rise to cash flows that are solely payments of principal and interest (SPPI) on the principal amount outstanding. This assessment is performed at an instrument level. Financial assets that are debt instruments with cash flows that are not SPPI are classified and measured at fair value through profit or loss, irrespective of the business model. The Group’s business model for managing financial assets that are debt instruments refers to how it manages its financial assets in order to generate cash flows. The business model determines whether cash flows will result from collecting contractual cash flows, selling the financial assets, or both. Financial assets classified and measured at amortised cost are held within a business model with the objective to hold financial assets in order to collect contractual cash flows. The Group recognises an allowance for expected credit losses (ECLs) on all debt instruments not held at fair value through profit or loss to the extent applicable. ECLs are based on the difference between the contractual cash flows due in accordance with the contract and all the cash flows that the Group expects to receive, discounted at an approximation of the original effective interest rate. ECLs are recognised in two stages. For credit exposures for which there has not been a significant increase in credit risk since initial recognition, ECLs are provided for credit losses that result from default events that are possible within the next 12-months (a 12-month ECL). For those credit exposures for which there has been a significant increase in credit risk since initial recognition, a loss allowance is required for credit losses expected over the remaining life of the exposure, irrespective of the timing of the default (a lifetime ECL). For trade and other receivables due in less than 12 months, the Group applies the simplified approach in calculating ECLs, as permitted by IFRS 9. The Group considers customers with balances 60 days past due an appropriate indicator of default. These balances are investigated to establish the probability that the funds will be received. The Group Legal Department determines whether to proceed with a collection process through external attorneys and where considered appropriate, a collection process is initiated to secure payment. Following this process, trade and other receivables are written off when there is no reasonable expectation of recovering the contractual cash flows. Impairment losses are recognised through profit or loss. The Group derecognises a financial asset when the contractual rights to the cash flows from the financial asset expire, or it transfers the rights to receive the contractual cash flows in a transaction in which substantially all the risks and rewards of the ownership of the financial asset are transferred. The gross carrying amount of a financial asset is written off when the Group has no reasonable expectations of recovering a financial asset in its entirety or a portion thereof. The Group derecognises a financial liability when its contractual obligations are discharged, cancelled or expired. Any interest in such transferred financial asset that is created or retained by the Group is recognised as a separate asset or liability. The particular recognition and measurement methods adopted are disclosed in the individual policy statements associated with each item. On derecognition of a financial liability, the difference between the carrying amount extinguished and the consideration paid is recognised in profit or loss. |
NOTES TO THE CONSOLIDATED FINANCIAL STATEMENTS continued
For the year ended 31 December 2025
35.1 Accounting classifications and measurement of fair values
The Group uses the following hierarchy for determining and disclosing the fair value of financial instruments:
•Level 1: unadjusted quoted prices in active markets for identical asset or liabilities
•Level 2: inputs other than quoted prices in level 1 that are observable for the asset or liability, either directly (as prices) or indirectly
(derived from prices)
•Level 3: inputs for the asset or liability that are not based on observable market data (unobservable inputs)
The following methods and assumptions were used to estimate the fair value of each class of financial instrument:
•Other receivables and other payables
Due to the methods applied in calculating the carrying values as described in note 21, the carrying values approximate fair value,
except for the Marikana dividend obligation and the Keliber dividend obligation (see note 21). The fair value at 31 December 2023 of
the contingent consideration relating to the Kroondal acquisition was derived from discounted cash flow models. The models used
several key assumptions, including estimates of future production volumes, PGM basket prices, operating costs, capital expenditure and
market related discount rate (see note 21). The extent of the fair value changes would depend on how inputs change in relation to
each other. The fair value of the metals borrowing liability was calculated based on spot prices of the relevant metals owed to the
financial institution.
•Trade and other receivables/payables, and cash and cash equivalents
The carrying amounts approximate fair values due to the short maturity and/or the method applied in calculating the carrying value of
these instruments for financial instruments measured at amortised cost. The fair value for trade receivables measured at fair value
through profit or loss (PGM concentrate sales and zinc provisional price sales) are determined based on ruling market prices, volatilities
and interest rates.
•Environmental rehabilitation obligation funds
Environmental rehabilitation obligation funds comprise a fixed income portfolio of bonds, rehabilitation policies, investment in a cell
captive as well as fixed and notice deposits. The environmental rehabilitation obligation funds, not measured at amortised cost, are
stated at fair value based on the nature of the fund’s investments. For investments measured at fair value classified as level 2, the fair
value is determined through valuation techniques that include inputs other than quoted prices in level 1 that are observable for the
asset, either directly or indirectly. The valuation techniques applied make reference to the net asset value of the underlying assets in
the relevant policy or cell captive, adjusted for any entity-specific risk. These underlying assets comprise predominantly money-market
and similar highly liquid investments for which the carrying values approximate fair value.
•Other investments
The fair values of listed investments are based on the quoted prices available from the relevant stock exchanges. The carrying amounts
of other short-term investment products with short maturity dates approximate fair value. The fair values of non-listed investments are
determined through valuation techniques that include inputs that are not based on observable market data. These inputs include
price/book ratios as well as marketability and minority shareholding discounts which are impacted by the size of the shareholding. The
level 3 balance consists primarily of an investment in Verkor, the value of which is supported by a range of values determined through
multi-criteria valuation analysis which includes valuation techniques such as an income valuation approach which indicates the value
of Verkor based on its expected future cash flows and trading multiples. These valuation techniques use several key assumptions,
including discount rate (8.8%), growth rate (2.5%) and EV multiples. The fair value estimate of Verkor is sensitive to changes in the key
assumptions, for example, increases in the market related discount rate and decreases in the growth rate and EV multiples would
decrease the fair value if all other inputs remain unchanged. The extent of the fair value changes would depend on how inputs change
in relation to each other. The difference between other investments in the statement of financial position and note 19, relates to
investments measured at amortised cost, with carrying amounts that approximate fair value.
•Borrowings
The carrying value of variable interest rate borrowings approximates fair value as the interest rates charged are considered marked
related. However, since there are also fixed interest rate borrowings, fair values are disclosed in note 27.
•Derivative financial instruments
The fair value of derivative financial instruments is estimated based on ruling market prices, volatilities and interest rates, and option
pricing methodologies based on observable quoted inputs. All derivatives are carried on the statement of financial position at fair
value. The fair value of the gold, platinum, palladium and silver hedges are determined using a Monte Carlo simulation model based
on market forward prices, volatilities and interest rates. Since the SA gold hedge contracts ceased in December 2025, majority of the
gold hedge value relates to the contract liability at 31 December 2025, rather than a valuation of existing hedge contracts. The fair
value of the zinc hedge is determined by using a Monte Carlo simulation model based on historical zinc market spot and forward
prices, volatilities and interest rates and the relevant foreign exchange forward curve data.
NOTES TO THE CONSOLIDATED FINANCIAL STATEMENTS continued
For the year ended 31 December 2025
The following table sets out the Group’s significant financial instruments measured at fair value by level within the fair value hierarchy:
| | | | | | | | | |
Figures in million - SA rand | | | |
| | | | | | | | | |
Financial assets measured at fair value | | | | | | | | | |
Environmental rehabilitation obligation funds | | | | | | | | | |
Trade receivables — PGM concentrate sales | | | | | | | | | |
Trade receivables — Zinc provisional price sales | | | | | | | | | |
| | | | | | | | | |
Financial liabilities measured at fair value | | | | | | | | | |
Derivative financial instrument | | | | | | | | | |
| | | | | | | | | |
| | | | | | | | | |
| | | | | | | | | |
Metals borrowing liability | | | | | | | | | |
| | | | | | | | | |
The table below summarises the movement in financial assets and financial liabilities classified as level 3 in the table above:
| | | |
Figures in million - SA rand | | | |
Financial assets measured at fair value | | | |
Balance at beginning of the year | | | |
Fair value movement recognised in profit or loss | | | |
Fair value movement recognised in other comprehensive income | | | |
| | | |
Foreign currency translation | | | |
Balance at end of the year | | | |
| | | |
Financial liabilities measured at fair value | | | |
Balance at beginning of the year | | | |
| | | |
Fair value movement recognised in profit or loss | | | |
| | | |
Balance at end of the year | | | |
35.2 Risk management activities
Controlling and managing risk in the Group
In the normal course of its operations, the Group is exposed to market risks, including commodity price, equity price risk, foreign currency,
interest rate, liquidity and credit risk associated with underlying assets, liabilities and anticipated transactions. In order to manage these risks,
the Group has developed a comprehensive risk management process to facilitate the control and monitoring of these risks.
Sibanye-Stillwater has policies in areas such as counterparty exposure, hedging practices and prudential limits, which are approved by
Sibanye-Stillwater’s Board of Directors (the Board) on an annual basis, or more frequent if changes are required. Management of financial
risk is centralised at Sibanye-Stillwater's treasury department (Treasury). Treasury manages financial risk in accordance with the policies and
procedures established by the Board and the Audit Committee.
The Board has approved dealing limits for money market, foreign exchange and commodity transactions, which Treasury is required to
adhere to. Among other restrictions, these limits describe which instruments may be traded and demarcate open position limits for each
category as well as indicating counterparty credit-related limits. The dealing exposure and limits are checked and controlled each day
and any breaches of these limits and exposures are reported to the CFO.
The objective of Treasury is to manage all significant financial risks arising from the Group’s business activities in order to protect profit and
cash flows. Treasury activities of Sibanye-Stillwater and its subsidiaries are guided by the Treasury Policy, the Treasury Framework as well as
domestic and international financial market regulations. Treasury activities are currently performed within the Treasury Framework with
appropriate resolutions from the Board, which are reviewed and approved annually by the Audit Committee.
NOTES TO THE CONSOLIDATED FINANCIAL STATEMENTS continued
For the year ended 31 December 2025
The financial risk management objectives of the Group are defined as follows:
•Counterparty exposure: the objective is to only deal with a limited number of approved counterparts that are of a sound financial
standing and who have an official credit rating. The Group is limited to a maximum investment of 2.5% of the financial institutions’
equity, which is dependent on the institutions’ credit rating. Credit ratings from reputable credit rating agencies are used for financial
institutions.
•Liquidity risk management: the objective is to ensure that the Group is able to meet its short-term commitments through the effective
and efficient management of cash and usage of credit facilities.
•Funding risk management: the objective is to meet funding requirements timeously and at competitive rates by adopting reliable
liquidity management procedures.
•Currency risk management: the objective is to maximise the Group’s profits by minimising currency fluctuations.
•Commodity price risk management: commodity risk management takes place within limits and with counterparts as approved in the
Treasury Framework.
•Interest rate risk management: the objective is to identify opportunities to prudently manage interest rate exposures.
•Investment risk management: the objective is to achieve optimal returns on surplus funds at acceptable risk.
Credit risk
Credit risk represents risk that an entity will suffer a financial loss due to the other party of a financial instrument not discharging its
obligations.
The Group manages its exposure to credit risk by dealing with a limited number of approved counterparties. The Group approves these
counterparties according to its risk management policy and ensures that they are of good credit quality.
The carrying value of the financial assets represents the combined maximum credit risk exposure of the Group. Concentration of credit risk
on cash and cash equivalents and non-current assets is considered minimal due to the above mentioned investment risk management
and counterparty exposure risk management policies (see notes 20, 21, 23 and 24).
The credit risk exposure on the Group’s financial assets is further expressed through the credit ratings of the Group's counterparties (source
– Fitch ratings, S&P Global and Global Credit Ratings):
•Cash and cash equivalents: the Group's cash and cash equivalents are held with a small number of financial institutions and banks
which are rated between BB- and AA+ (long term issuer default ratings). The high credit ratings support a low probability of default and
indicates that the Group's exposure to credit risk is minimal
•Environmental rehabilitation funds: these funds are invested with financial institutions and banks that are rated between BB- and AA+
(long term issuer default ratings) and therefore do not expose the Group to material credit risk
•Trade receivables: the Group's trade and other receivables consist largely of gold, PGM, chrome, silver, cobalt, nickel and zinc metals
sales. The Group's exposure to credit risk on these sales is limited due to payment terms of the agreements as well as dealings with a
small number of reputable customers. External credit ratings on these customers range between BBB- and A+, therefore exposure to
credit risk is minimal. The risk of default on other receivables is low due to the Group's approval process followed when entering into
these transactions.
There has been no significant increase in credit risk on the Group's financial assets since initial recognition.
Liquidity risk
In the ordinary course of business, the Group receives cash proceeds from its operations and is required to fund working capital and capital
expenditure requirements. The cash is managed to ensure surplus funds are invested to maximise returns whilst ensuring that capital is
safeguarded to the maximum extent possible by investing only with top financial institutions.
Uncommitted borrowing facilities are maintained with several banking counterparties to meet the Group’s normal and contingency
funding requirements (see note 21.2, 27.9 and 32).
NOTES TO THE CONSOLIDATED FINANCIAL STATEMENTS continued
For the year ended 31 December 2025
The following are contractually due, undiscounted cash flows resulting from maturities of financial liabilities including interest payments:
| | | | | | | |
Figures in million – SA rand | | | | Between one and two years | Between two and three years | Between three and five years | |
| | | | | | | |
| | | | | | | |
| | | | | | | |
| | | | | | | |
| | | | | | | |
| | | | | | | |
| | | | | | | |
| | | | | | | |
| | | | | | | |
| | | | | | | |
| | | | | | | |
| | | | | | | |
| | | | | | | |
| | | | | | | |
| | | | | | | |
| | | | | | | |
| | | | | | | |
| | | | | | | |
| | | | | | | |
| | | | | | | |
| | | | | | | |
| | | | | | | |
| | | | | | | |
| | | | | | | |
| | | | | | | |
| | | | | | | |
| | | | | | | |
| | | | | | | |
| | | | | | | |
| | | | | | | |
| | | | | | | |
| | | | | | | |
| | | | | | | |
| | | | | | | |
| | | | | | | |
| | | | | | | |
| | | | | | | |
| | | | | | | |
| | | | | | | |
Stillwater Convertible Debentures | | | | | | | |
| | | | | | | |
| | | | | | | |
NOTES TO THE CONSOLIDATED FINANCIAL STATEMENTS continued
For the year ended 31 December 2025
Working capital and going concern assessment
For the year ended 31 December 2025, the Group incurred a loss of R4,739 million (2024: loss of R5,710 million and 2023: loss of
R37,430 million). As at 31 December 2025, the Group’s current assets exceeded its current liabilities by R26,595 million (2024: R27,458 million
and 2023: R25,415 million) and the Group’s total assets exceeded its total liabilities by R44,167 million (2024: R48,289 million and 2023:
R51,607 million). During the year ended 31 December 2025 the Group generated net cash from operating activities of R21,407 million (2024:
R10,113 million and 2023: R7,095 million).
The Group has committed undrawn debt facilities of R21,255 million at 31 December 2025 (2024: R26,743 million and 2023: R20,755 million)
and cash balances of R17,178 million (2024: R16,049 million and 2023: R25,560 million). The Group’s leverage ratio (net debt/(cash) to
adjusted EBITDA) as at 31 December 2025 was 0.59:1 (2024 was 1.79:1 and 2023 was 0.58:1) and its interest coverage ratio (adjusted EBITDA
to net finance charges/(income)) was 25.4:1 (2024 was 11:1 and 2023 was 66:1). The maximum permitted leverage ratio up to 31
December 2025 is 3.0:1 and thereafter 2.5:1. The maximum required interest coverage ratio up to 31 December 2025 is 3.5:1 and 4.0:1
thereafter.
Included under current borrowings on the consolidated statement of financial position is the 2026 Notes, amounting to R11,185 million
which matures by November 2026. The Group has commenced its planning for the refinancing of these Notes and is expecting to
conclude the process before 30 June 2026. In addition, at the date of approving these consolidated financial statements for issue, the
US$1 billion RCF and R6.5 billion RCF were totally undrawn. There were no significant events which had a significant negative impact on the
Group’s strong liquidity position.
Management believes that the cash forecasted to be generated by operations, cash on hand, the committed unutilised debt facilities as
well as additional funding opportunities will enable the Group to continue to meet its obligations as they fall due for a period of at least
eighteen months after the reporting date. The consolidated financial statements for the year ended 31 December 2025 have therefore
been prepared on a going concern basis.
Market risk
The Group is exposed to market risks, including foreign currency, commodity price, and interest rate risk associated with underlying assets,
liabilities and anticipated transactions. The Group is also exposed to changes in share prices in respect of listed investments (see note 19).
Following periodic evaluation of these exposures, the Group may enter into derivative financial instruments to manage some of these
exposures.
The effects of reasonable possible changes of relevant risk variables on profit or loss or shareholders’ equity are determined by relating the
reasonable possible change in the risk variable to the balance of financial instruments at period end date.
The amounts generated from the sensitivity analyses are forward-looking estimates of market risks assuming certain adverse or favourable
market conditions occur. Actual results in the future may differ materially from those projected results and therefore should not be
considered a projection of likely future events and gains/losses.
Foreign currency risk
Sibanye-Stillwater’s operations are located in South Africa, US, Zimbabwe, Finland, France, Mexico, India, UK, South Korea and Australia. The
Group's revenues are sensitive to changes in the US dollar gold and PGM price and the SA rand/US dollar and to a lesser extent Euro/US
dollar and AUD/US dollar exchange rates (the exchange rates). Depreciation of the SA rand against the US dollar results in Sibanye-
Stillwater’s revenues and operating margin increasing. Conversely, should the rand appreciate against the US dollar, revenues and
operating margins would decrease. The impact on profitability of any change in the exchange rate can be substantial. Furthermore, the
exchange rates obtained when converting US dollars to rand are set by foreign exchange markets over which Sibanye-Stillwater has no
control. The relationship between currencies and commodities, which includes the gold price, is complex and changes in exchange rates
can influence commodity prices and vice versa.
In the ordinary course of business, the Group enters into transactions, such as gold, PGM and other metal sales, denominated in foreign
currencies, primarily US dollar. Although this exposes the Group to transaction and translation exposure from fluctuations in foreign currency
exchange rates, the Group does not generally hedge this exposure. However, hedging could be considered for significant expenditures
based in foreign currency or those items which have long lead times to produce or deliver. Also, the Group on occasion undertakes
currency hedging to take advantage of favourable short-term fluctuations in exchange rates when management believes exchange rates
are at unsustainably high levels.
Currency risk also exists on account of financial instruments being denominated in a currency that is not the functional currency and being
of a monetary nature. This includes but is not limited to US$1 billion RCF, to the extent drawn (see note 27.1), Burnstone Debt (see note 27.6)
and the Franco-Nevada liability.
For additional disclosures, see notes 3 and 27.
Foreign currency economic hedging exposure
During 2025, 2024 and 2023 a number of intra month (i.e. up to 21 days) forward exchange rate contracts were executed to hedge a
known currency inflow.
At 31 December 2025, the Group had no material outstanding foreign currency contract positions.
NOTES TO THE CONSOLIDATED FINANCIAL STATEMENTS continued
For the year ended 31 December 2025
Commodity price risk
The market price of commodities has a significant effect on the results of operations of the Group and the ability of the Group to pay
dividends and undertake capital expenditures. The gold and PGM basket prices, nickel, zinc and copper prices have historically fluctuated
widely and are affected by numerous industry factors over which the Group does not have any control (see note 23). The aggregate
effect of these factors on the gold and PGM basket prices, nickel, zinc and copper prices, all of which are beyond the control of the
Group, is difficult for the Group to predict.
Commodity price hedging policy
As a general rule, the Group does not enter into forward sales, derivatives or other hedging arrangements to establish a price in advance
for future gold, PGM, nickel and zinc production. Commodity hedging are considered under the following circumstances: to protect cash
flows at times of significant capital expenditure, financing projects or to safeguard the viability of higher cost operations.
To the extent that it enters into commodity hedging arrangements, the Group seeks to use different counterparty banks consisting of local
and international banks to spread risk. None of the counterparties is affiliated with, or related to parties of the Group.
Commodity price hedging exposure
At 31 December 2025, Sibanye-Stillwater had the following outstanding and future commodity price hedges:
•zinc for a total of 3,300t zinc at a floor price of A$4,250/t and a cap price of A$4,800/t, which commenced in January 2026 and matures
in June 2026
•zinc for a total of 6,000t zinc at a floor price of A$4,200/t and a cap price of A$4,750/t, which commenced in January 2026 and matures
in June 2026
•zinc for a total of 2,700t zinc at a floor price of A$4,250/t and a cap price of A$4,800/t, which commenced in January 2026 and matures
in June 2026
•zinc for a total of 12,000t zinc at a floor price of A$4,300/t and a cap price of A$4,900/t, which commenced in January 2026 and
matures in June 2026
•gold for a total of 3,400oz gold at an average purchase price of US$4,206/oz, which matured in February 2026
•silver for a total of 195,000oz silver at an average purchase price of US$57/oz, which matured in March 2026
•platinum for a total of 5,850oz platinum at an average purchase price of US$1,918/oz, which matures in April 2026
•palladium for a total of 9,600oz palladium at an average purchase price of US$1,501/oz, which matured in March 2026
Commodity price contract position
As of 31 December 2025, Sibanye-Stillwater had no outstanding commodity forward sale contracts for mined production other than the
gold and chrome prepays (see note 31).
Interest rate risk
The Group’s income and operating cash flows are impacted by changes in market interest rates. The Group’s interest rate risk arises from
long-term borrowings.
For additional disclosures, see note 27.9.
NOTES TO THE CONSOLIDATED FINANCIAL STATEMENTS continued
For the year ended 31 December 2025
36. Commitments
| | | | |
Figures in million - SA rand | | | | |
| | | | |
| | | | |
| | | | |
| | | | |
| | | | |
| | | | |
| | | | |
| | | | |
| | | | |
| | | | |
| | | | |
| | | | |
Sandouville nickel refinery | | | | |
| | | | |
| | | | |
| | | | |
| | | | |
1Includes authorised capital expenditure relating to DRDGOLD of R4,000 million (2024: R3,700 million, 2023: R3,700 million)
2Included in the amount are guarantees related to the Marikana operations of R2.3 billion (2024: R2.3 billion, 2023: R2.2 billion). The Group has an insurance policy over
these guarantees which includes a pledge of non-financial and financial assets of Sibanye UK, WPL, EPL, Messina Limited and Messina Platinum Mines Limited (collectively
the insured entities) in the event that the insured entities enter liquidation. At 31 December 2025, the insured entities' total assets amounted to R36,085 million which
includes property, plant and equipment of R12,704 million, trade receivables of R2,242 million, inventory of R9,323 million and cash and cash equivalents of R2,187 million.
Management does not expect the policy to be triggered due to the financial position and liquidity of the Group
Commitments will be funded from internal sources and to the extent necessary from borrowings. This expenditure primarily relates to mining
activities, infrastructure, hostel upgrades as well as the development of K4 and Keliber.
37. Related-party transactions
Sibanye-Stillwater entered into related-party transactions with Rand Refinery, and its subsidiaries during the year. The transactions with these
related parties are generally conducted with terms comparable to transactions with third parties, however in certain circumstances such as
related-party loans between South African entities, the transactions were not at arm’s length.
See note 1.3 for the Group structure, which provides further detail on the relationship between the parent and subsidiary companies.
Blue Ridge
During 2024, an impairment allowance related to a receivable balance from Blue Ridge was recognised amounting to R118 million (see
note 23).
Reldan Mexico S. de R.L. de C.V. (Reldan Mexico)
During 2024, the Group acquired a 72% investment in Reldan Mexico, through its wholly-owned subsidiary, Reldan International Holding
Company LLC (see note 16.2). For the year ended 31 December 2025, the Group purchased post-consumer e-scrap from Reldan Mexico
amounting to R484 million (2024: R372 million).
Rand Refinery
Rand Refinery, in which Sibanye-Stillwater holds a 44.4% interest, has an agreement with the Group whereby it refines all of the Group’s gold
production. For the year ended 31 December 2025, the Group received no dividend (2024: R221 million and 2023: R233 million) from Rand
Refinery, and sold gold and paid refining fees to Rand Refinery. See note 18.1 for additional information in respect of the Group’s
investment in Rand Refinery.
The table below details the transactions and balances between the Group and its related parties:
| | | | |
Figures in million - SA rand | | | | |
| | | | |
| | | | |
| | | | |
| | | | |
NOTES TO THE CONSOLIDATED FINANCIAL STATEMENTS continued
For the year ended 31 December 2025
Key management remuneration
Total key management personnel compensation recognised under IFRS Accounting Standards:
| | | | |
Figures in thousands - SA rand | | | | |
Short-term employee benefits1 | | | | |
| | | | |
| | | | |
| | | | |
1The amount for 2024 includes termination benefits of R29,590,540 (2023: R3,663,146)
38. Directors' and prescribed officers' remuneration
The disclosure below incorporates remuneration for services rendered to various companies within the Group during the year.
The executive directors and prescribed officers were paid the following remuneration during the year:
| | | | | | | | |
Figures in thousands - SA rand | | Cash bonus accrued for 2025 paid in 2026 | Accrual of share-based payment benefits | Pension scheme total contributions | Expense allowance and other benefits | | | |
| | | | | | | | |
| | | | | | | | |
| | | | | | | | |
| | | | | | | | |
| | | | | | | | |
| | | | | | | | |
| | | | | | | | |
| | | | | | | | |
| | | | | | | | |
| | | | | | | | |
| | | | | | | | |
| | | | | | | | |
| | | | | | | | |
| | | | | | | | |
| | | | | | | | |
| | | | | | | | |
1Remuneration paid by Stillwater in US dollars was converted at the average exchange rate of R17.88/US$ (2024: R18.32/US$ and 2023: R18.42/US$) for the year ended 31
December 2025. Neal Froneman retired as the Group's CEO and executive director effective 30 September 2025
2Richard Stewart succeeded Neal Froneman as CEO and executive director on 30 September 2025 after appointed as CEO designate and executive director on 1 March
2025
3Remuneration paid in GBP was converted at the average exchange rate of R23.55/GBP (2024:R23.40/GBP and 2023: R22.93/GBP) for the year ended 31 December 2025.
Laurent ceased performing a prescribed officer role on 31 January 2025
4Remuneration paid in Euros was converted at the average exchange rate of R20.17/Euro (2024: R19.82/Euro, 2023: R19.94/Euro) for the year ended 31 December 2025
5Remuneration paid in US dollars converted at the average exchange rate of R17.88/US$ (2024: R18.32/US$, 2023:R18.42/US$)
6Appointed as prescribed officer on 1 July 2025
7Appointed as prescribed officer on 1 October 2025
NOTES TO THE CONSOLIDATED FINANCIAL STATEMENTS continued
For the year ended 31 December 2025
The non-executive directors were paid the following fees during the year:
| | | | | | |
Figures in thousands - SA rand | | | | | | |
| | | | | | |
| | | | | | |
| | | | | | |
| | | | | | |
| | | | | | |
| | | | | | |
| | | | | | |
| | | | | | |
| | | | | | |
| | | | | | |
| | | | | | |
| | | | | | |
| | | | | | |
| | | | | | |
| | | | | | |
| | | | | | |
1Resigned as non-executive director on 11 March 2024
2Resigned as non-executive director on 28 May 2024
3Appointed on 26 August 2025
NOTES TO THE CONSOLIDATED FINANCIAL STATEMENTS continued
For the year ended 31 December 2025
The directors’ and prescribed officers’ (including their associates) direct and indirect share ownership at 31 December 2025 was:
| | | | | | |
| | |
| | | | | | |
| | | | | | |
| | | | | | |
| | | | | | |
| | | | | | |
| | | | | | |
| | | | | | |
| | | | | | |
| | | | | | |
| | | | | | |
| | | | | | |
| | | | | | |
| | | | | | |
| | | | | | |
Total share ownership by directors | | | | | | |
| | | | | | |
| | | | | | |
| | | | | | |
| | | | | | |
| | | | | | |
| | | | | | |
| | | | | | |
| | | | | | |
*This is the shareholding at the reporting date unless otherwise stated
1Share ownership (including shares held by associates) in the Company at the date of this report was unchanged, except for the following directors:
•Charl Keyter - 2,010,300
•Richard Menell - 20,125
•Charles Carter - 720,000
2Neal Froneman and his associates held 388,863 ADSs (2024 and 2023: 388,863), which converted to 1,555,452 (2024 and 2023: 1,555,452) ordinary shares in the Company
at 30 September 2025,which was the last known shareholding at resignation as CEO
3Appointed as CEO and executive director at 1 October 2025
4Harry Kenyon-Slaney and his associates hold 4,213 ADSs at 31 December 2025 (2024 and 2023:4,213) which convert to 16,852 (2024 and 2023: 16,852) ordinary shares in the
Company
5Themba Nkosi and his associates hold 5,300 ADSs at 31 December 2025 (2024 and 2023: 5,300) which convert into 21,200 (2024 and 2023: 21,200) ordinary shares in the
Company
6Laurent Charbonnier and his associates held 37,753 ADSs at 31 December 2024 (2023: 37,753) which converted to 151,012 (2023: 151,012) ordinary shares in the
Company. The ordinary shares held by Laurent and his associates represented the last known shareholding when he ceased performing a prescribed officer role on 31
January 2025
7Charles Carter and his associates hold 170,000 ADSs at 31 December 2025 (2024: 170,000, 2023: 145,000) which convert to 680,000 (2024: 680,000, 2023: 580,000) ordinary
shares in the Company
39. Events after reporting date
There were no events that could have a material impact on the financial results of the Group after 31 December 2025 up to the date on
which the consolidated financial statements for the year ended 31 December 2025 were authorised for issue.
ADJUSTED EBITDA RECONCILIATIONS
| | | | | | | | | | | | | | | | | | | | | | | | | | | | |
|
| | | | | | | | | | | | | | | | |
| | | | | | | | | | | | | | | | | | |
| | | | | | | | Corporate and re- conciling items1 | | | | | | Corporate and re- conciling items1 | Total international operations | | | | | | Pennsylvani a site and North Carolina site | | Sandouville nickel refinery | Corporate and re- conciling items1 | | Century zinc retreatmen t operation | Corporate and re- conciling items1 | |
Reconciliation of profit before royalties, carbon tax and tax to adjusted EBITDA: | | | | | | | | | | | | | | | | | | | | | | | | | | | | |
(Loss)/profit before royalties, carbon tax and tax | | | | | | | | | | | | | | | | | | | | | | | | | | | | |
| | | | | | | | | | | | | | | | | | | | | | | | | | | | |
Amortisation and depreciation | | | | | | | | | | | | | | | | | | | | | | | | | | | | |
| | | | | | | | | | | | | | | | | | | | | | | | | | | | |
| | | | | | | | | | | | | | | | | | | | | | | | | | | | |
| | | | | | | | | | | | | | | | | | | | | | | | | | | | |
(Gain)/loss on financial instruments | | | | | | | | | | | | | | | | | | | | | | | | | | | | |
Loss/(gain) on foreign exchange movements | | | | | | | | | | | | | | | | | | | | | | | | | | | | |
Share of results of equity-accounted investees after tax | | | | | | | | | | | | | | | | | | | | | | | | | | | | |
Change in estimate of environmental rehabilitation obligation | | | | | | | | | | | | | | | | | | | | | | | | | | | | |
(Gain)/loss on disposal of property, plant and equipment | | | | | | | | | | | | | | | | | | | | | | | | | | | | |
| | | | | | | | | | | | | | | | | | | | | | | | | | | | |
Occupational healthcare gain | | | | | | | | | | | | | | | | | | | | | | | | | | | | |
| | | | | | | | | | | | | | | | | | | | | | | | | | | | |
Transaction and project costs | | | | | | | | | | | | | | | | | | | | | | | | | | | | |
| | | | | | | | | | | | | | | | | | | | | | | | | | | | |
Onerous contract provision | | | | | | | | | | | | | | | | | | | | | | | | | | | | |
Corporate leadership costs | | | | | | | | | | | | | | | | | | | | | | | | | | | | |
Compensation for losses incurred | | | | | | | | | | | | | | | | | | | | | | | | | | | | |
| | | | | | | | | | | | | | | | | | | | | | | | | | | | |
Gain on increase in equity- accounted investment | | | | | | | | | | | | | | | | | | | | | | | | | | | | |
Gain on assets held for sale | | | | | | | | | | | | | | | | | | | | | | | | | | | | |
| | | | | | | | | | | | | | | | | | | | | | | | | | | | |
| | | | | | | | | | | | | | | | | | | | | | | | | | | | | |
|
| | | | | | | | | | | | | | | | |
| | | | | | | | | | | | | | | | | | |
| | | | | | | | | Corporate and re- conciling items1 | | | | | | Corporate and re- conciling items1 | Total internationa l operations | | | | | | Pennsylvani a site recycling | | Sandouville nickel refinery | Corporate and re- conciling items1 | | Century zinc retreatme nt operation | Corporate and re- conciling items1 | |
Reconciliation of profit before royalties, carbon tax and tax to adjusted EBITDA: | | | | | | | | | | | | | | | | | | | | | | | | | | | | | |
(Loss)/profit before royalties, carbon tax and tax | | | | | | | | | | | | | | | | | | | | | | | | | | | | | |
| | | | | | | | | | | | | | | | | | | | | | | | | | | | | |
Amortisation and depreciation | | | | | | | | | | | | | | | | | | | | | | | | | | | | | |
| | | | | | | | | | | | | | | | | | | | | | | | | | | | | |
| | | | | | | | | | | | | | | | | | | | | | | | | | | | | |
| | | | | | | | | | | | | | | | | | | | | | | | | | | | | |
(Gain)/loss on financial instruments | | | | | | | | | | | | | | | | | | | | | | | | | | | | | |
(Gain)/loss on foreign exchange movements | | | | | | | | | | | | | | | | | | | | | | | | | | | | | |
Share of results of equity-accounted investees after tax | | | | | | | | | | | | | | | | | | | | | | | | | | | | | |
Change in estimate of environmental rehabilitation obligation, and right of recovery liability and asset | | | | | | | | | | | | | | | | | | | | | | | | | | | | | |
(Gain)/loss on disposal of property, plant and equipment | | | | | | | | | | | | | | | | | | | | | | | | | | | | | |
| | | | | | | | | | | | | | | | | | | | | | | | | | | | | |
Occupational healthcare gain | | | | | | | | | | | | | | | | | | | | | | | | | | | | | |
| | | | | | | | | | | | | | | | | | | | | | | | | | | | | |
Transaction and project costs | | | | | | | | | | | | | | | | | | | | | | | | | | | | | |
| | | | | | | | | | | | | | | | | | | | | | | | | | | | | |
| | | | | | | | | | | | | | | | | | | | | | | | | | | | | |
Compensation for losses incurred | | | | | | | | | | | | | | | | | | | | | | | | | | | | | |
Provision for community costs post closure | | | | | | | | | | | | | | | | | | | | | | | | | | | | | |
Onerous contract provision | | | | | | | | | | | | | | | | | | | | | | | | | | | | | |
Gain/increase in equity-accounted investment | | | | | | | | | | | | | | | | | | | | | | | | | | | | | |
| | | | | | | | | | | | | | | | | | | | | | | | | | | | | |
NOTIONAL FREE CASH FLOW RECONCILIATIONS
RECONCILIATION OF NOTIONAL FREE CASH FLOW TO NET CASH FROM OPERATING ACTIVITIES
| | | | | | | | | | | |
Figures in million - SA rand | |
| | | Southern Africa Operations | | | | Total US PGM (including Columbus recycling) | Pennsylvani a site and North Carolina site | | | |
| | | | | | | | | | | |
| | | | | | | | | | | |
Property, plant and equipment additions | | | | | | | | | | | |
Net royalties, carbon tax and tax paid | | | | | | | | | | | |
Add back of accrued tax and royalties | | | | | | | | | | | |
Cash-settled share-based payments made | | | | | | | | | | | |
| | | | | | | | | | | |
Net interest (including intercompany) | | | | | | | | | | | |
Net working capital (including intercompany) | | | | | | | | | | | |
Movement on metals consignment line | | | | | | | | | | | |
Deferred revenue recognised | | | | | | | | | | | |
Deferred revenue received in advance | | | | | | | | | | | |
Re-allocation of stream revenue and costs | | | | | | | | | | | |
| | | | | | | | | | | |
Net cash from operating activities | | | | | | | | | | | |
Non-IFRS measures such as notional free cash flow is considered as pro forma financial information as per the JSE Listing Requirements.
The pro forma financial information is the responsibility of the Group’s Board of Directors and is presented for illustration purposes only,
and because of its nature, notional free cash flow should not be considered in isolation or as a substitute for measures of financial
performance and cash flows prepared in accordance with IFRS Accounting Standards, namely net cash from operating activities.
| | | | | | | | | | | |
Figures in million - SA rand | |
| | | Southern Africa Operations | | | | Total US PGM (including Columbus recycling) | Pennsylvani a site and North Carolina site | | | |
| | | | | | | | | | | |
| | | | | | | | | | | |
Property, plant and equipment additions | | | | | | | | | | | |
Net royalties, carbon tax and tax paid | | | | | | | | | | | |
Add back of accrued tax and royalties | | | | | | | | | | | |
Cash-settled share-based payments made | | | | | | | | | | | |
| | | | | | | | | | | |
Net interest (including intercompany) | | | | | | | | | | | |
Net working capital (including intercompany) | | | | | | | | | | | |
Movement on metals consignment line | | | | | | | | | | | |
Deferred revenue recognised | | | | | | | | | | | |
Deferred revenue received in advance | | | | | | | | | | | |
Re-allocation of stream revenue and costs | | | | | | | | | | | |
| | | | | | | | | | | |
Net cash from operating activities | | | | | | | | | | | |
Registered shareholder spread at 31 December 2025
| | | | |
| | | | |
| | | | |
| | | | |
| | | | |
| | | | |
1,000,001 shares and above | | | | |
| | | | |
1As of 27 March 2026, the issued share capital of Sibanye-Stillwater consisted of 2,830,567,264 ordinary shares
2Figures may not add due to rounding
3To our knowledge: (1) Sibanye-Stillwater is not directly or indirectly owned or controlled (a) by another entity or (b) by any foreign government; and (2) there are no arrangements
the operation of which may at a subsequent date result in a change in control of Sibanye-Stillwater. To the knowledge of Sibanye-Stillwater’s management, there is no controlling
shareholder of Sibanye-Stillwater
Public and non-public shareholdings at 31 December 2025
| | | | |
| | | | |
| | | | |
Directors and associates1 | | | | |
Prescribed Officers and associates | | | | |
| | | | |
| | | | |
| | | | |
1 Included in the number of prescribed officers and associates was shareholdings for Neal Froneman the previous CEO until his retirement on 30 September 2025
2Included in the number of non-public shareholders for the Share trust are trustees who are beneficiaries of this trust
Foreign custodians of 5% or more at 31 December 2025
| | |
| | |
Bank of New York Mellon (ADSs Sponsor) | | |
State Street Bank & Trust Co. | | |
| | |
SHAREHOLDER INFORMATION continued
Beneficial shareholder categories at 31 December 2025
| | | | |
| | | | |
American Depository Receipts | | | | |
Black Economic Empowerment | | | | |
| | | | |
| | | | |
| | | | |
| | | | |
| | | | |
| | | | |
| | | | |
| | | | |
| | | | |
| | | | |
| | | | |
| | | | |
| | | | |
| | | | |
| | | | |
| | | | |
| | | | |
| | | | |
| | | | |
| | | | |
1 The number of shares and percentage shares in issue in the beneficial shareholder category table above, are over the shares in issue of 2,830,567,264 at 31 December 2025 due to
stock lending
SHAREHOLDER INFORMATION continued
The tables below show the change in the percentage ownership of Sibanye-Stillwater’s major shareholders, to the knowledge of Sibanye-
Stillwater’s management, between 2023 and 2025.
Investment management shareholdings of 5% or more at 31 December1
| | | | | | |
| | | |
| | | | | | |
| | | | | | |
Lingotto Investment Management, LLP | | | | | | |
| | | | | | |
| | | | | | |
1A list of the investment managers holding, to the knowledge of Sibanye-Stillwater’s management, directly or indirectly, 5% or more of the issued share capital of Sibanye-Stillwater
as of 27 March 2026 is set forth below:
| | |
| | |
Government Employees Pension Fund (PIC)2 | | |
Lingotto Investment Management LLP | | |
2This represents funds managed by the PIC as an investment fund manager, which holds the majority of its shares on behalf of the Government Employees Pension Fund
Beneficial shareholdings of 5% or more at 31 December1
| | | | | | |
| | | |
| | | | | | |
Government Employees Pension Fund (PIC)2 | | | | | | |
1A list of the individuals and organisations holding, to the knowledge of Sibanye-Stillwater’s management, directly or indirectly, beneficial holdings of 5% or more of the issued share
capital of Sibanye-Stillwater as of 28 March 2025 is set forth below:
| | |
| | |
Government Employees Pension Fund (PIC)2 | | |
2This is the aggregate shareholding for the Government Employees Pension Fund the majority of which is managed by the Public Investment Corporation (PIC)
Sibanye-Stillwater’s ordinary shares are subject to dilution as a result of any non-pre-emptive share issuance, including issues of shares by the
Board in compliance with B-BBEE legislation or in connection with acquisitions. Sibanye-Stillwater (through its wholly-owned subsidiary Stillwater
Mining Company LLC) launched an offering of US$500 million senior, unsecured, guaranteed bonds, due in November 2028 which, subject to
approval by a general meeting of Sibanye-Stillwater shareholders, will be convertible into ordinary shares of Sibanye-Stillwater, thus resulting in
dilution.
The principal non-United States trading market for the ordinary shares of Sibanye-Stillwater is the JSE Limited, on which they trade under the
symbol “SSW”. Sibanye-Stillwater’s American depositary shares (ADSs) trade in the United States on the NYSE under the symbol “SBSW”. The ADSs
are issued by The Bank of New York Mellon (BNYM) as depositary under the ADS program. Each ADS represents four ordinary shares.
No public takeover offers by third parties have been made in respect of Sibanye-Stillwater’s shares or by Sibanye-Stillwater in respect of other
companies’ shares during the last and current fiscal year.
ADMINISTRATION AND CORPORATE INFORMATION
| |
SIBANYE STILLWATER LIMITED (SIBANYE-STILLWATER) Incorporated in the Republic of South Africa Registration number 2014/243852/06 Share code: SSW and SBSW Issuer code: SSW ISIN: ZAE000259701 LISTINGS JSE: SSW NYSE: SBSW WEBSITE www.sibanyestillwater.com REGISTERED AND CORPORATE OFFICE Constantia Office Park Bridgeview House, Building 11, Ground floor Cnr 14th Avenue & Hendrik Potgieter Road Weltevreden Park 1709 South Africa Private Bag X5 Westonaria 1780 South Africa Tel: +27 11 278 9600 Fax: +27 11 278 9863 COMPANY SECRETARY Lerato Matlosa Email: lerato.matlosa@sibanyestillwater.com DIRECTORS Dr Vincent Maphai* (Chairman) Dr Richard Stewart (CEO)+ Charl Keyter (CFO) Dr Elaine Dorward-King* Harry Kenyon-Slaney* ^ Prof Jeremiah Vilakazi*# Dr Lindiwe Mthimunye++ Keith Rayner# Dr Peter Hancock* Philippe Boisseau* Richard Menell# Sindiswa Zilwa* Terence Nombembe* Timothy Cumming# * Independent non-executive # Non-executive ^ Lead independent director 1 January 2024 + Appointed as executive director 1 March 2025 and as CEO on 1 October 2025 ++ Appointed as independent non-executive director 26 August 2025 INVESTOR ENQUIRIES James Wellsted Executive Vice President: Investor Relations and Corporate Affairs Mobile: +27 83 453 4014 Email: james.wellsted@sibanyestillwater.com or ir@sibanyestillwater.com JSE SPONSOR J.P. Morgan Equities South Africa Proprietary Limited Registration number 1995/011815/07 1 Fricker Road, Illovo Johannesburg 2196 South Africa Private Bag X9936 Sandton 2146 South Africa | AUDITORS BDO South Africa Inc. Wanderers Office Park 52 Corlett Drive Illovo 2196 South Africa Private Bag X60500 Houghton 2041 South Africa Tel: +27 11 488 170 AMERICAN DEPOSITARY RECEIPTS TRANSFER AGENT BNY Mellon Shareowner Correspondence (ADSs) Mailing address of agent: Computershare PO Box 43078 Providence, RI 02940-3078 Overnight/certified/registered delivery: Computershare 150 Royal Street, Suite 101 Canton, MA 02021 US toll free: + 1 888 269 2377 Tel: +1 201 680 6825 Email: shrrelations@cpushareownerservices.com Tatyana Vesselovskaya Relationship Manager - BNY Mellon Depositary Receipts Email: tatyana.vesselovskaya@bnymellon.com TRANSFER SECRETARIES SOUTH AFRICA Computershare Investor Services Proprietary Limited Rosebank Towers 15 Biermann Avenue Rosebank 2196 PO Box 61051 Marshalltown 2107 South Africa Tel: +27 11 370 5000 Fax: +27 11 688 5248 Forms of proxy to Meeting Scrutineers The Meeting Specialist Proprietary Limited JSE Building One Exchange Square 2 Gwen Lane Sandown Sandton, 2196 South Africa Contact Farhana Adam Tel: +27 84 433 4836 Izzy van Schoor Tel: +27 81 711 4255 Michael Wenner Tel: +27 61 440 0654 e-mail: proxy@tmsmeetings.co.za |
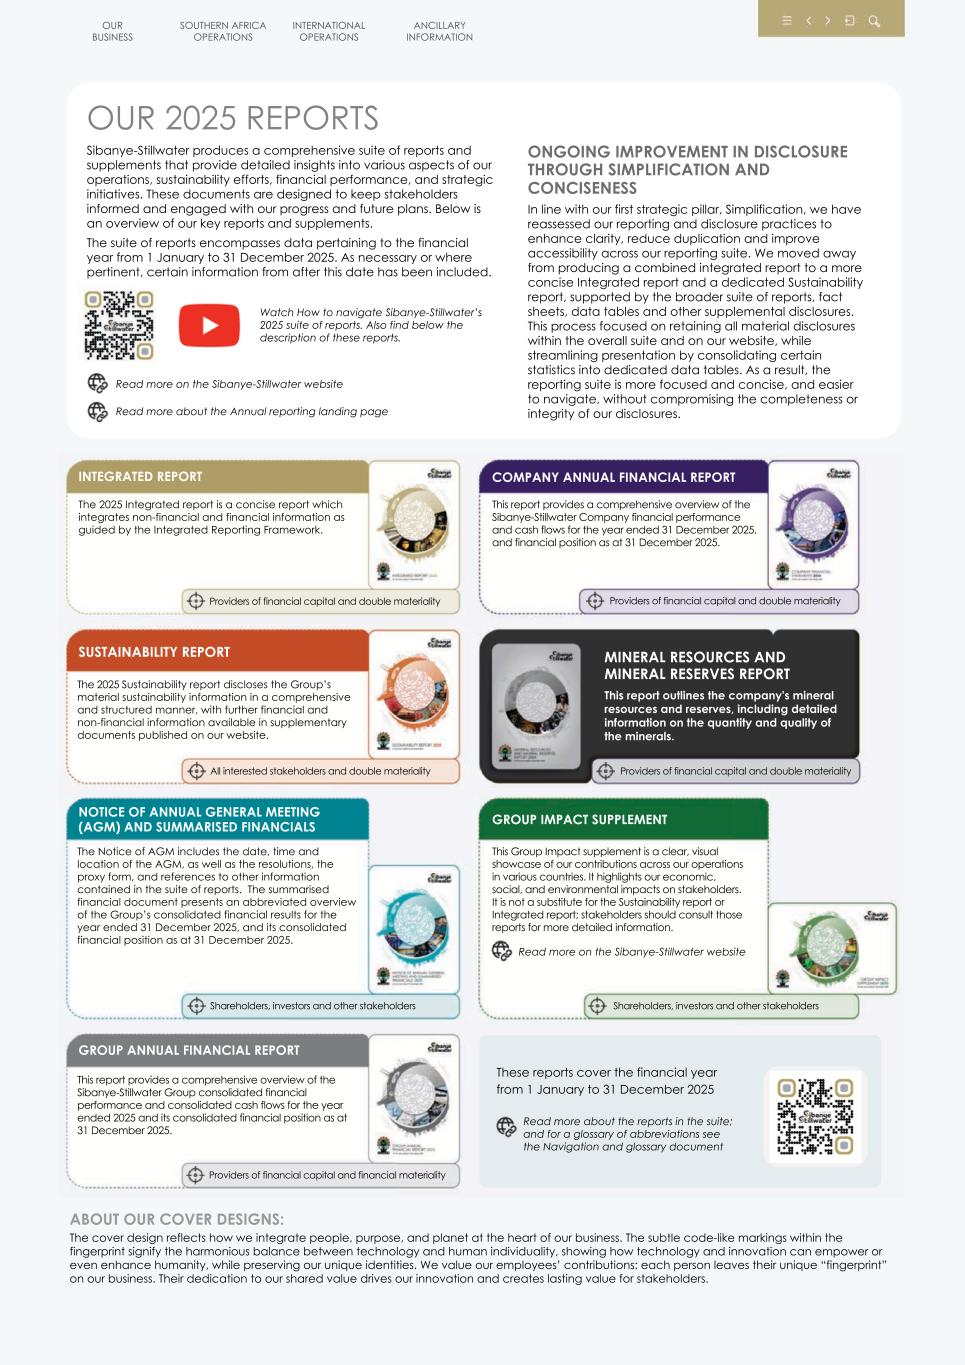
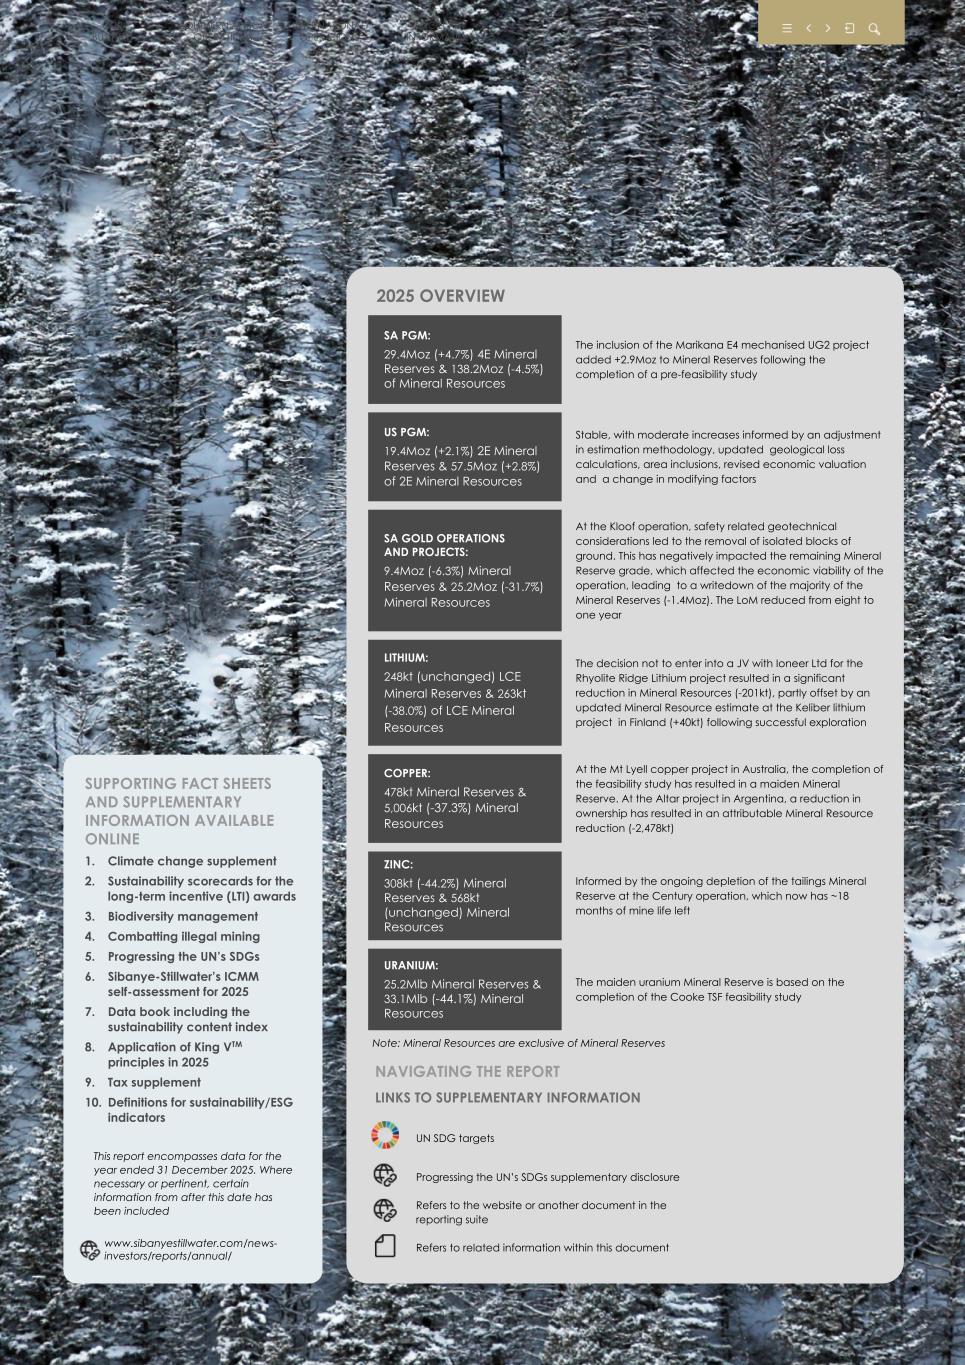
CORPORATE GOVERNANCE AND REGULATORY COMPLIANCE Sibanye-Stillwater is listed on the JSE and the NYSE and complies with Section 14.10 of the JSE Listings Requirements and the requirements of Subpart 1300 of Regulation S-K of the U.S. Securities Act (SK-1300). For all of our managed operations, as well as our development and exploration properties, and for certain non-managed assets (specifically DRDGOLD and Mimosa), we have prepared the Mineral Resources, Mineral Reserves, and the mineral asset valuations that support the Mineral Reserve estimates. These have been prepared in accordance with the South African Code for Reporting of the Exploration Results, Mineral Resources and Mineral Reserves (SAMREC 2016 edition, including Table 1 and Appendices) and the South African Code for the Reporting of Mineral Asset Valuation (SAMVAL 2016 edition). We have fully complied with all requirements set out in these codes. This disclosure also meets the requirements of Section 14 of the JSE Listings Requirements. For our non-managed properties (all non-material assets), the Marathon and Altar exploration property estimates were prepared in compliance with the Canadian NI 43-101. The NI 43-101 is a Committee for Mineral Reserves International Reporting Standards (CRIRSCO) sister code of SAMREC and SAMVAL. The Group has verified these estimates for alignment to SAMREC/SAMVAL and SK-1300, and believes that the final estimates would be similar (barring reporting methodology), and that therefore they can be considered current. In complying with the requirements of SK-1300, this document serves to satisfy both the summary disclosure requirements set out under Item 1303 of SK-1300 (Item 1303) and individual material property disclosure requirements set out under Item 1304 of SK-1300 (Item 1304). Section 1 contains all summary disclosure-related information set out under Item 1303, while Sections 2 and 3 contain individual material property disclosure information required under Item 1304 of SK-1300 for material properties. To ensure alignment and continuity with past disclosures, the Group is also disclosing additional and relevant information on non-material properties in Sections 2 and 3. This report also complies with the internal controls disclosure requirements set out under Item 1305 of SK-1300 (Item 1305). Disclosures pursuant to Item 1305 can be found in Sections 2 and 3. MATERIAL PROPERTIES A materiality assessment has been conducted on the Group’s mineral properties, which led to the identification of five material properties key to the Group’s Mineral Reserves: revenue, profits, and strategy. The properties considered material for the purpose of SK-1300 are listed below. PGM l SOUTHERN AFRICA: the Marikana operation and Rustenburg operation l AMERICAS: the US PGM operations consisting of the East Boulder and Stillwater mines GOLD l SOUTHERN AFRICA: The Driefontein operation BATTERY METALS l FINLAND: the Keliber lithium project In support of the material property disclosure for the 2025 reporting period, Sibanye-Stillwater has filed updated technical report summaries (TRS) for: l Marikana operation, where the inclusion of the E4 mechanised UG2 project has led to a material increase in Mineral Reserves l Rustenburg operation, where the acquisition of the Kroondal operation led to a material increase in Mineral Reserves These filings with the United States Securities and Exchange Commission (SEC) on Form 6-K, were incorporated by reference as exhibits to the 2025 Annual report on Form 20-F, and can be accessed via EDGAR. Mineral Resources are reported exclusive of Mineral Reserves, on an attributable legal interest basis. Keliber lithium project landscape in Finland OUR BUSINESS SOUTHERN AFRICA OPERATIONS INTERNATIONAL OPERATIONS ANCILLARY INFORMATION SIBANYE-STILLWATER MINERAL RESOURCES AND MINERAL RESERVES 2025 4
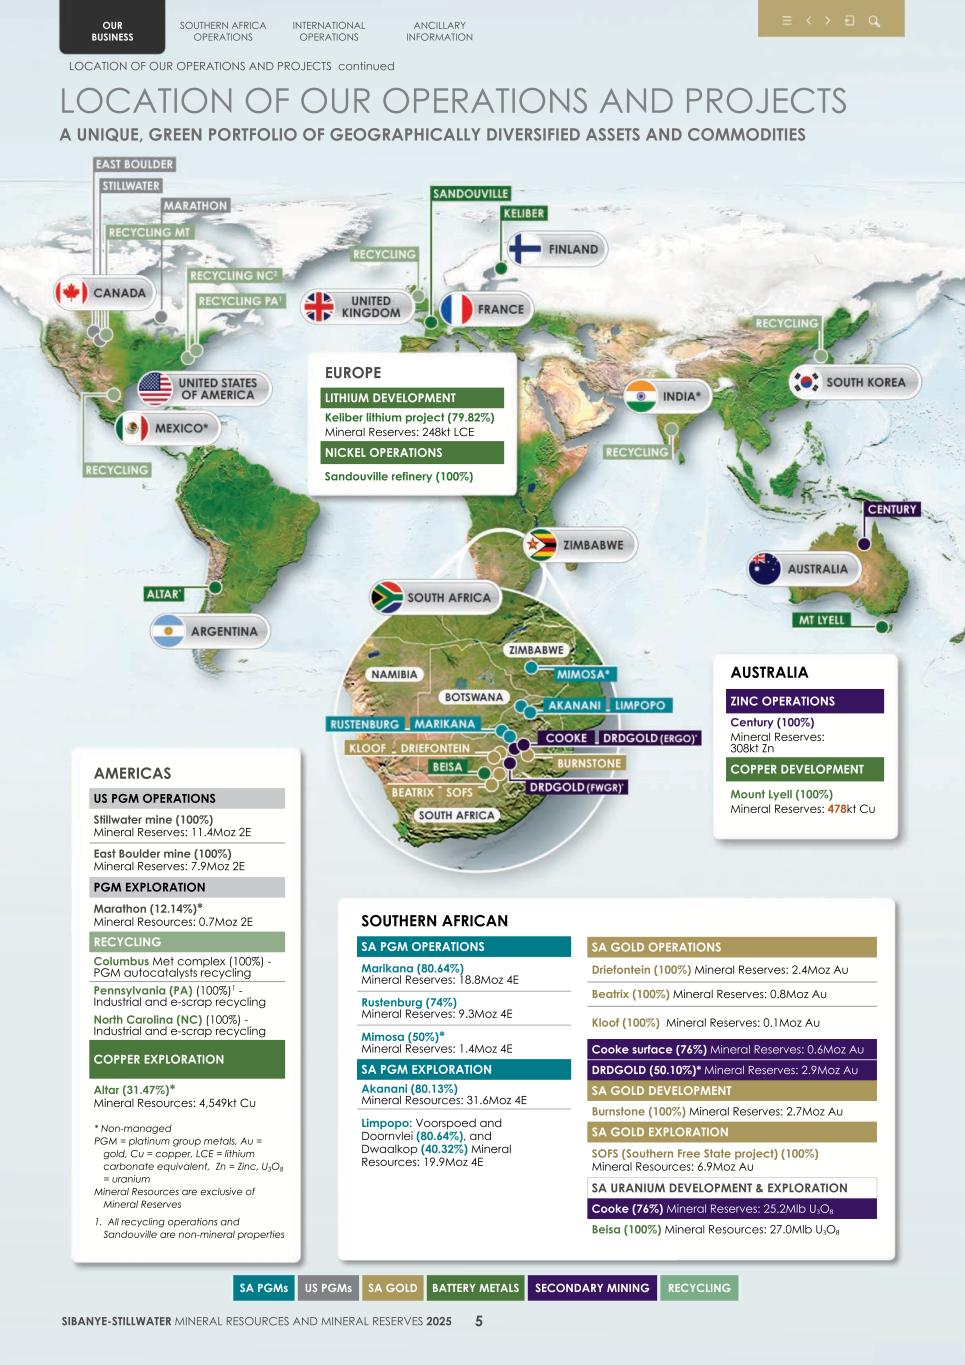
SOUTHERN AFRICA PGMS The SA PGM operations comprise two managed underground operations (Marikana and Rustenburg). In addition, the Group has a 50% attributable interest in a non-managed, underground operation (Mimosa) in Zimbabwe. During 2025, the pre-feasibility study (PFS) into the Marikana E4 mechanised UG2 project was completed, resulting in the maiden inclusion of those Mineral Reserves. For the 2025 disclosure, the Rustenburg and Kroondal operations’ Mineral Resources and Mineral Reserves were combined, following the acquisition of Kroondal by Rustenburg. The Rustenburg (74% attributable) operation produces concentrate which is processed in terms of a toll-treatment agreement with Rustenburg Platinum Mines Pty Ltd, a subsidiary of Valterra Platinum Ltd. The Marikana operation (80.64% attributable) processes its own as well as third-party concentrate via a metallurgical smelter and base metals refinery at the operation, and a precious metals refinery complex located in Brakpan, to the east of Johannesburg. Apart from the primary mining operations, significant surface tailings treatment operations exist: l The Platinum Mile tailings retreatment facility (100% owned and managed) recovers PGMs from historic Rustenburg TSFs as well as live tailings streams from the Rustenburg concentrator plants l The Bulk tailings treatment (BTT) facility recovers PGMs from the ETD2 TSF at the Marikana operation l The Eastern tailings treatment project (ETTP) facility recovers PGMs from live tailings material from the EPL concentrator at the Marikana operation. Chromite recovery from EPL live tailings occurs at the EPL Glencore Chrome Recovery Plant l At the Rustenburg and Marikana operations, a chromite concentrate is recovered as a by-product at various UG2 concentrator plants The Akanani exploration project (80.13% attributable) is an exploration asset on the northern limb of the Bushveld Igneous Complex (BC) near the town of Mokopane. The Limpopo exploration project, located approximately 50km southeast of Mokopane, consists of the care and maintenance Baobab operation (80.64% attributable), the Dwaalkop mining right (50:50 JV area with Northam, 40.32% attributable), and the Doornvlei mining right (80.64% attributable). GOLD The SA gold operations are made up of four managed, producing, underground and surface operations in South Africa, namely the Kloof (100% attributable), Driefontein (100% attributable) and Cooke (76% attributable) operations in the West Wits region, and Beatrix (100% attributable) operation in the Free State province. Sibanye- Stillwater owns and manages four metallurgical processing facilities where gold-bearing ore is processed, and gold extracted. Burnstone (100% attributable) is a development project in the Mpumalanga province. In addition, and in support of its gold mining activities. Wholly-owned and managed projects in study phase include the Bloemhoek and De Bron Merriespruit, which form part of the Southern Free State (SOFS) exploration project. The Group also reports Mineral Resources and Mineral Reserves on an attributable basis for DRDGOLD Limited (DRDGOLD) due to its 50.10% equity interest. DRDGOLD operates the Far West Gold Recoveries (FWGR) and the ERGO Gold Recoveries operations. URANIUM Significant quantities of uranium are present in the historic TSFs of the Cooke operation, as well as in the Beisa project area, a combined gold and uranium deposit at the Beatrix operation. These are considered exploration (Beisa) or development (Cooke) projects, even though they occur within existing operational mining right areas. The FS into the exploitation of the Cooke TSF has been completed, leading to the declaration of a maiden Mineral Reserve. The Beisa Mineral Resource is reported subject to a pending transaction with Neo Energy Metals PLC, expected to close in early 2026, for the sale of the Beisa uranium asset in exchange for a consideration of R250 million in cash and R250 million in equity in Neo (approximately 40%). AMERICAS PGMS Sibanye-Stillwater wholly owns and operates PGM mining and processing operations located in Montana, US. These assets include the Stillwater mine, the East Boulder mine, two concentrator plants, and PGM mining claims located near the town of Nye. In addition, the Group owns and operates a metallurgical smelter and base metals refinery complex situated in the town of Columbus, Montana. The Group has a 12.14% equity holding in Generation Mining Ltd, the owner and operator of the Marathon PGM project in Canada. The Group holds a 31.47% non-managed interest in the Altar copper-gold porphyry exploration project in Argentina, for which a preliminary economic assessment (PEA) was completed in 2025. EUROPE BATTERY METALS The Group is developing the Keliber lithium project in Finland(79.82% attributable). As part of a staged ramp-up process, open pit ore mining commenced in Q1 2026, with first spodumene concentrate production scheduled for H2 2026. Successful exploration activities are also ongoing at the extensive mineral title holdings, which have led to a Mineral Resource increase. AUSTRALIA ZINC AND COPPER The Group owns 100% of the Century zinc operation, a tailings retreatment operation in Queensland, Australia. The Group is undertaking a FS to incorporate the mining of neighbouring phosphate deposits as an alternative use for the considerable fixed infrastructure, which would extend the life of the operation post the TSF depletion. The FS into reopening the Mt Lyell (under care and maintenance) copper mine in Tasmania has been delivered, leading to a maiden Mineral Reserve being declared. NON-MINERAL PROPERTIES PGM RECYCLING AND NICKEL REFINING The Columbus metallurgical complex, which is managed as an integrated business with our US PGM operations, is one of the world’s largest recyclers of PGMs derived from spent catalytic converters and other industrial sources. In addition, Sibanye- Stillwater Reldan is a precious metals recycling group, with facilities in Pennsylvania, USA, as well as Mexico and India. The production of nickel cathodes at the Sandouville nickel refinery has ceased in Q1 2025. A pre-feasibility study (PFS) to assess the potential conversion of the Sandouville plant to produce pCAM (the GalliCam project) is underway. OUR BUSINESS SOUTHERN AFRICA OPERATIONS INTERNATIONAL OPERATIONS ANCILLARY INFORMATION LOCATION OF OUR OPERATIONS AND PROJECTS continued SIBANYE-STILLWATER MINERAL RESOURCES AND MINERAL RESERVES 2025 6
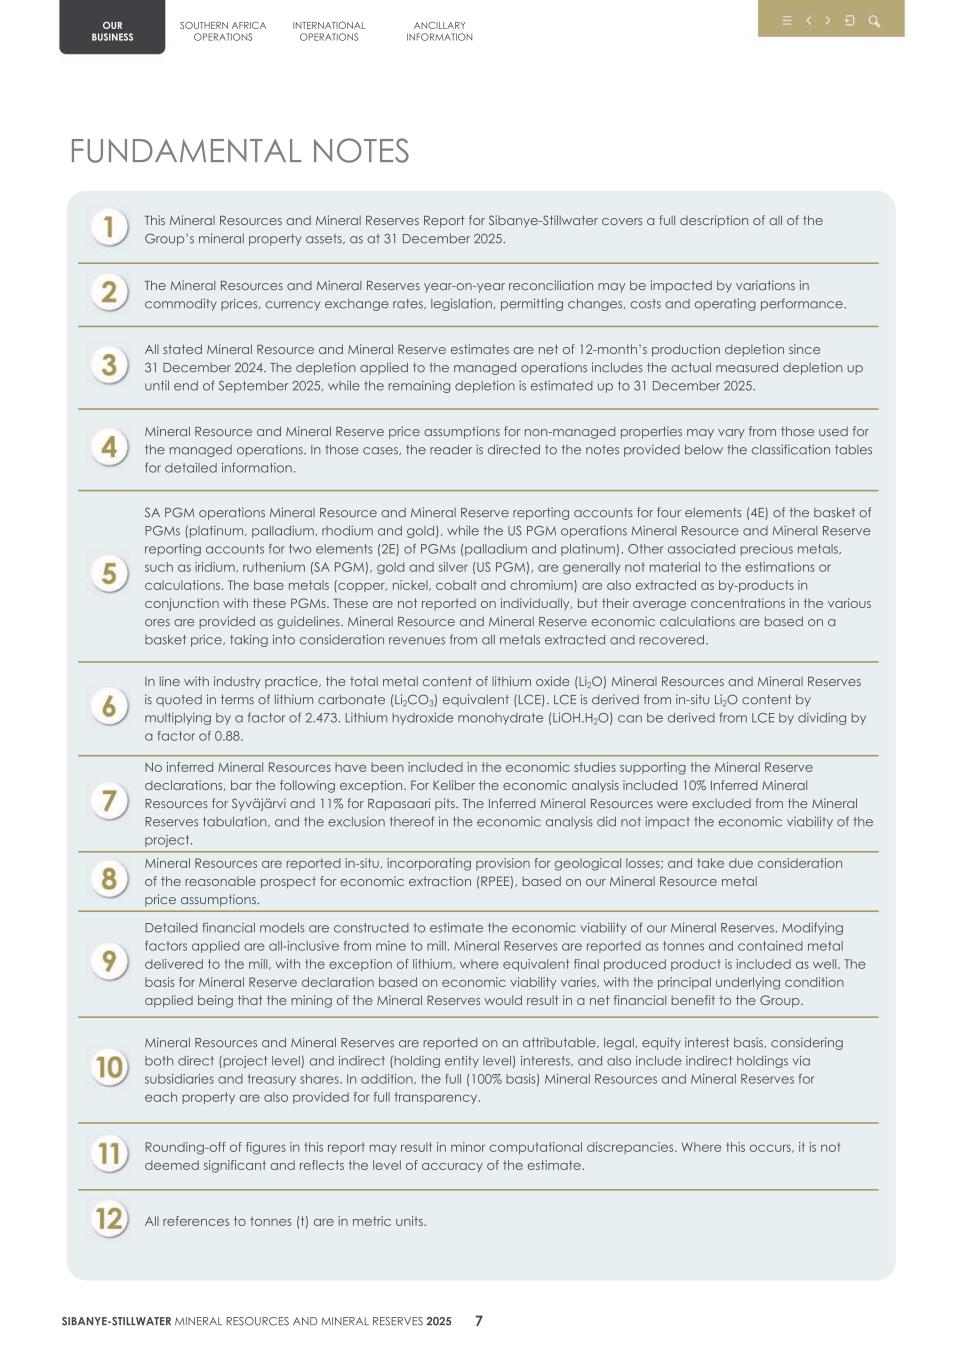
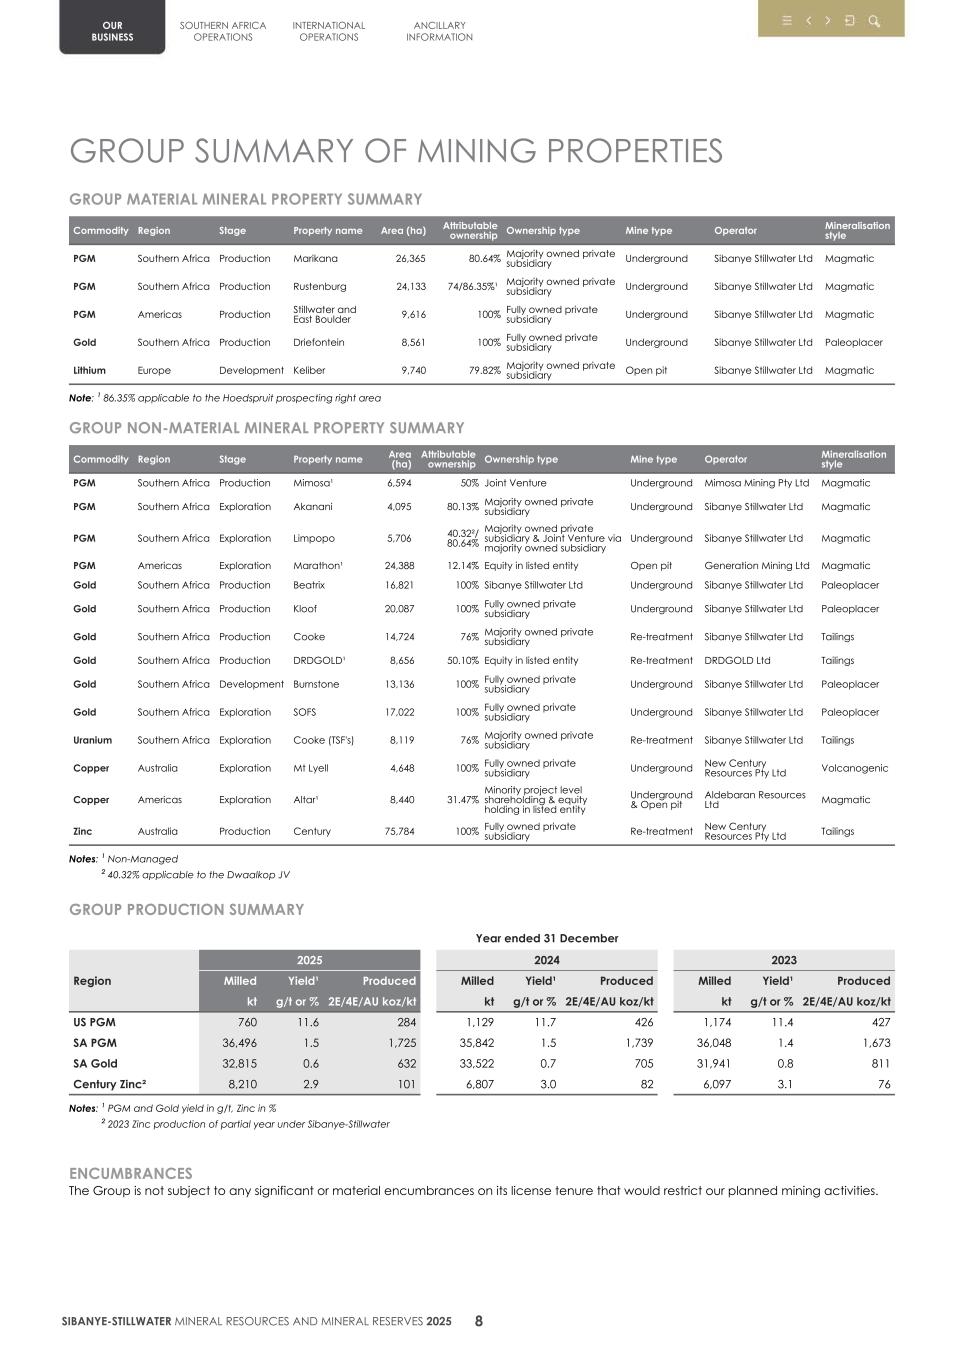
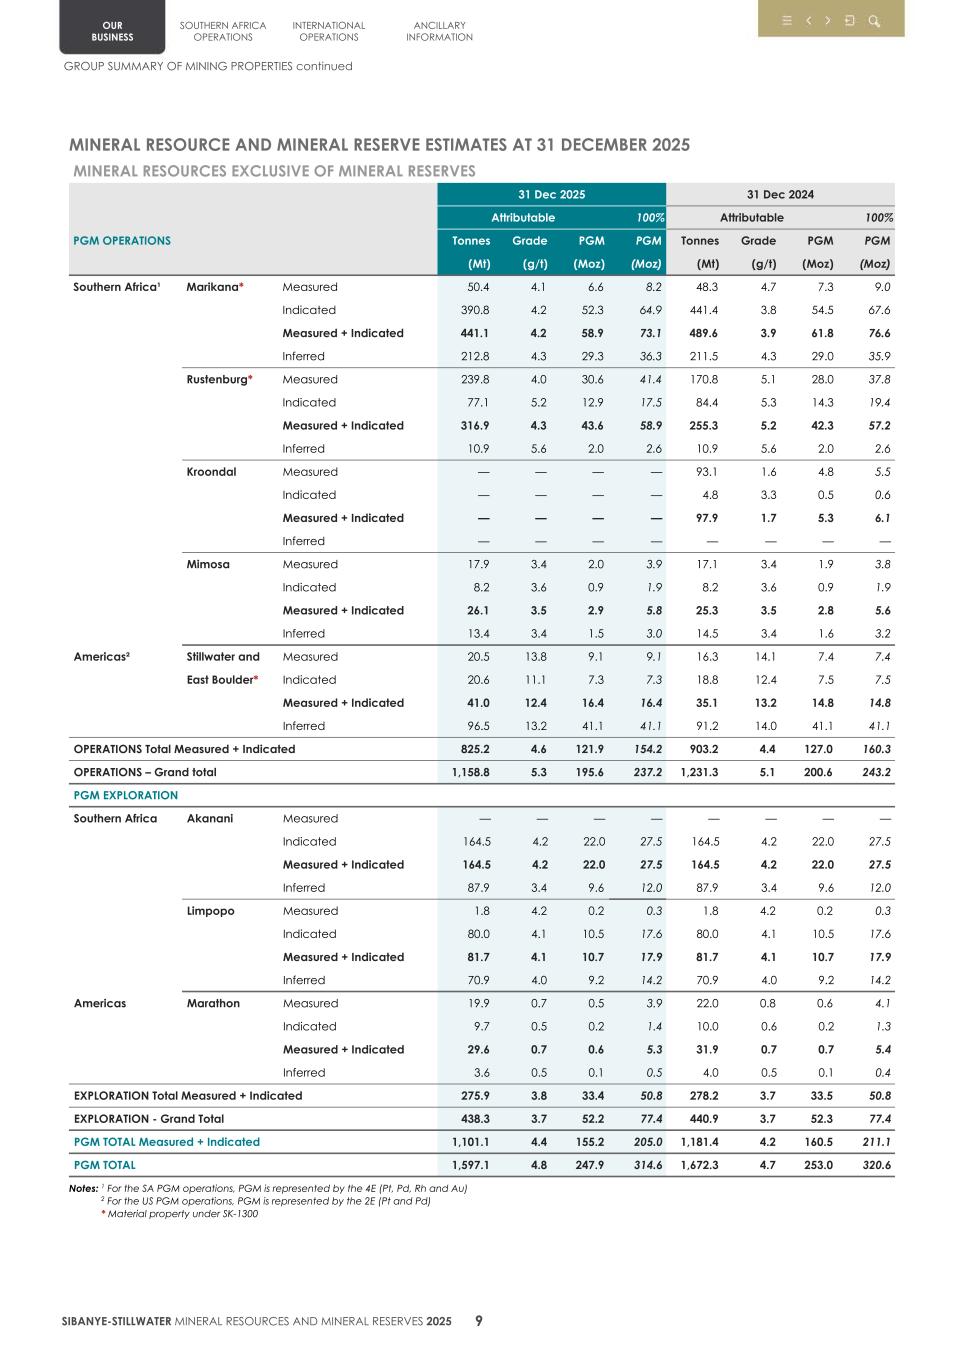
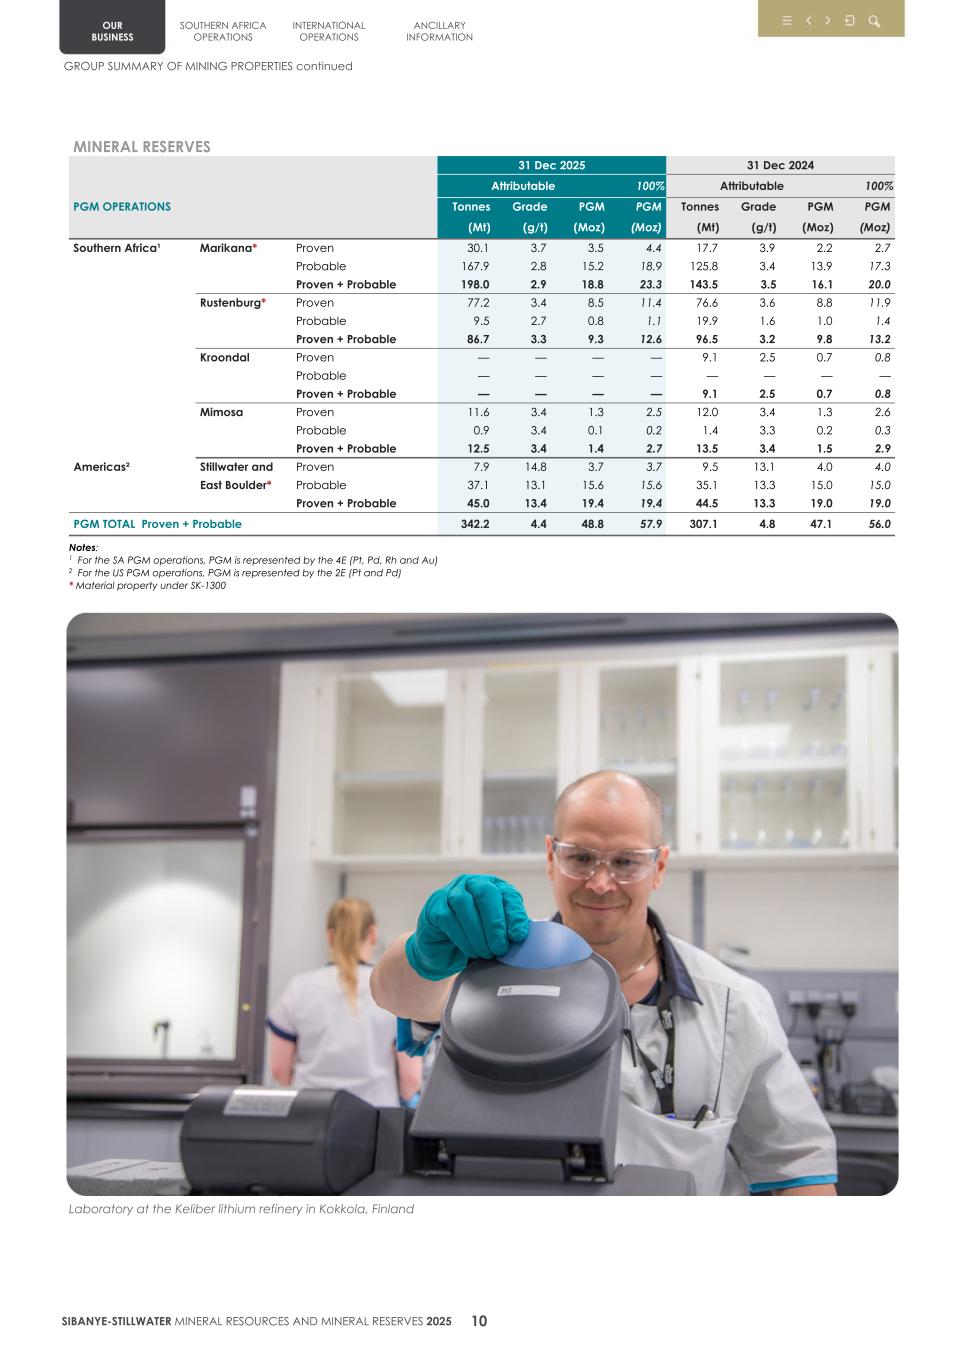
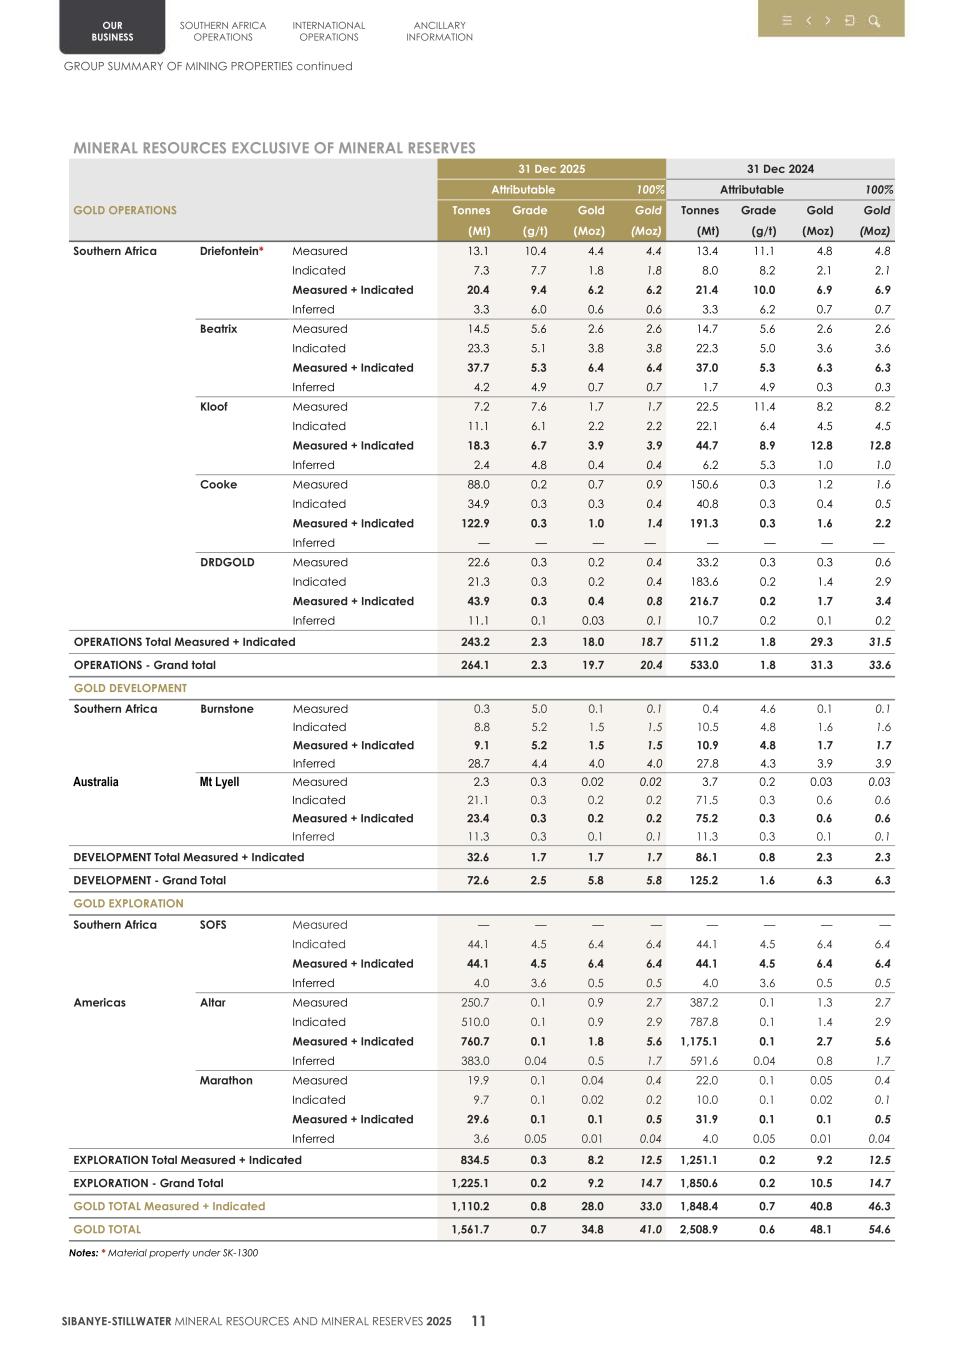
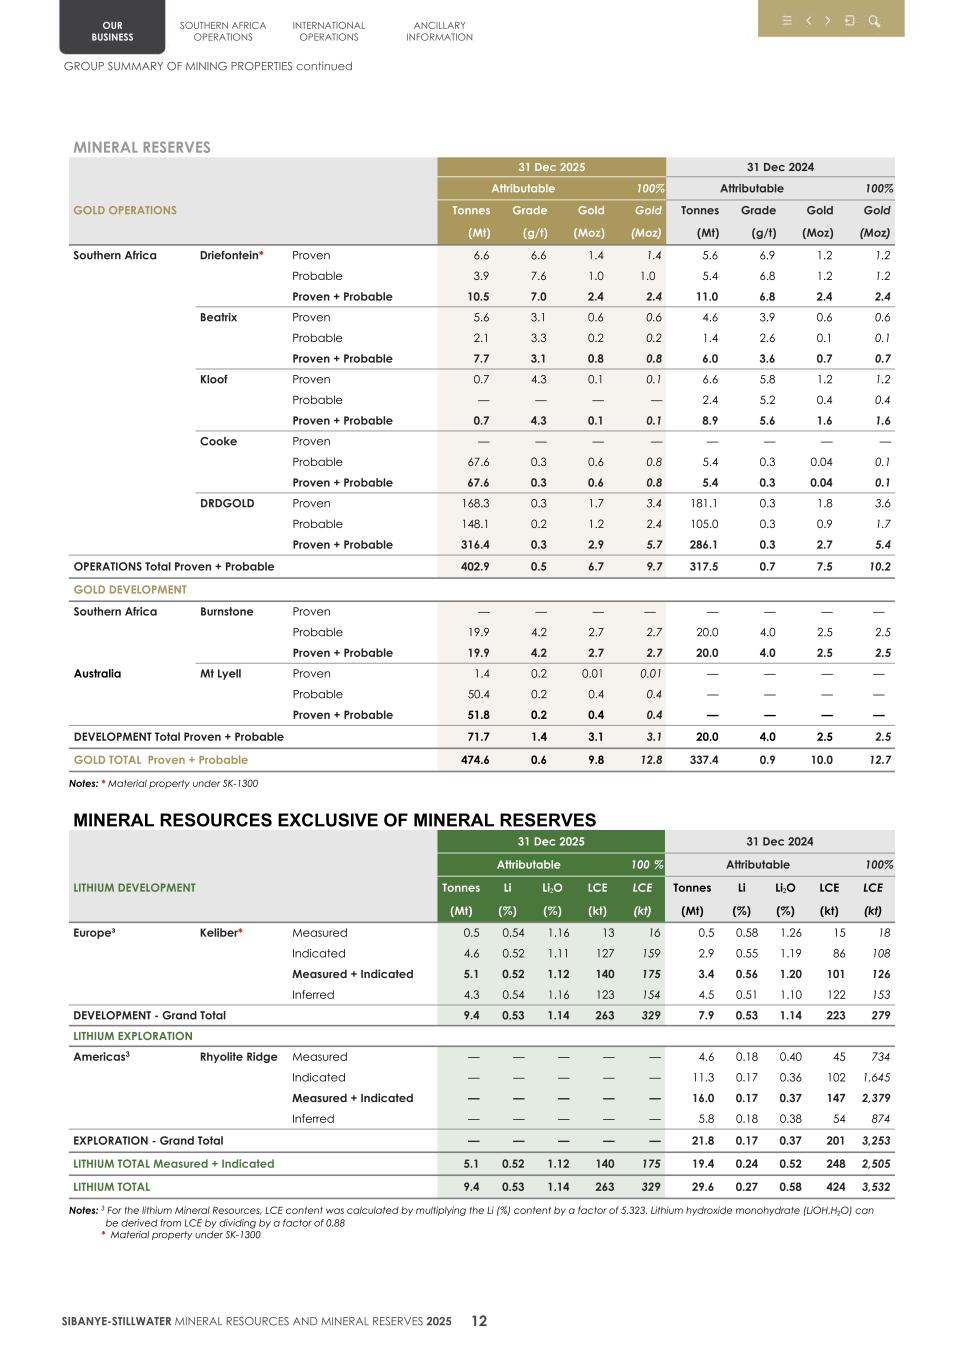
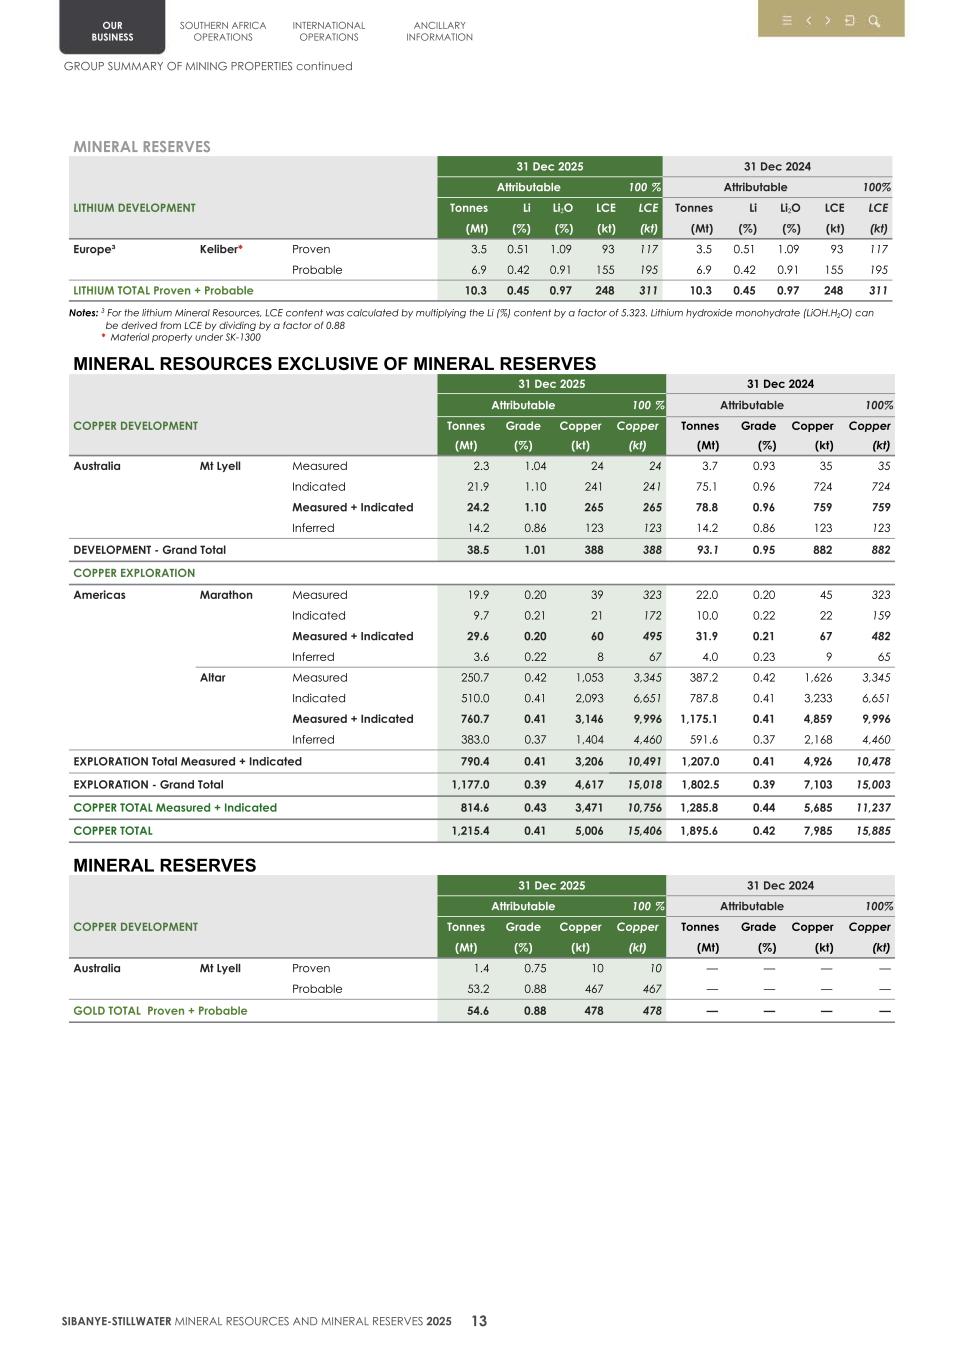
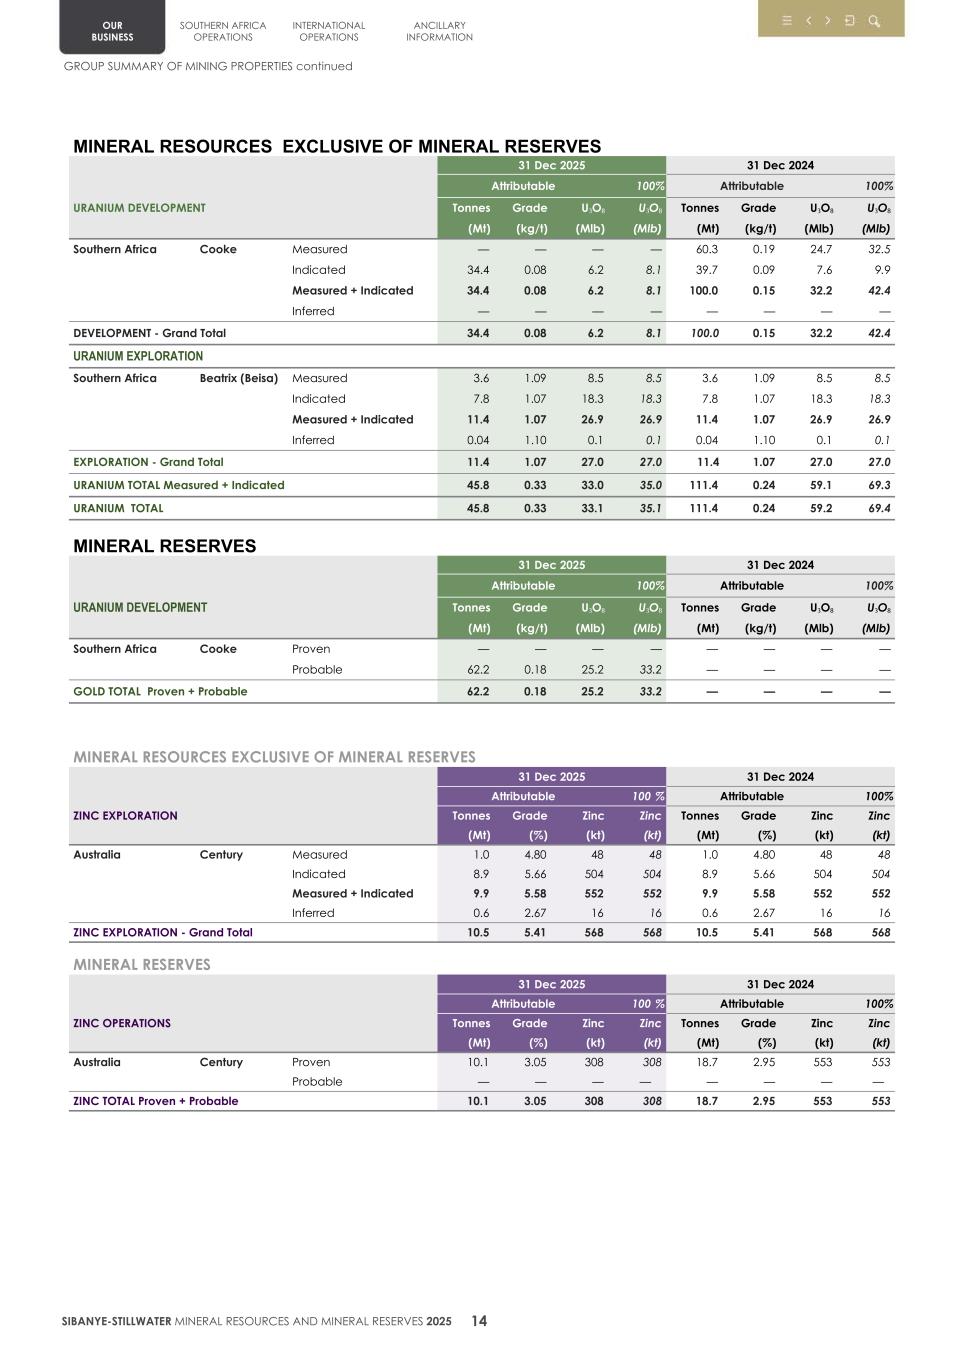
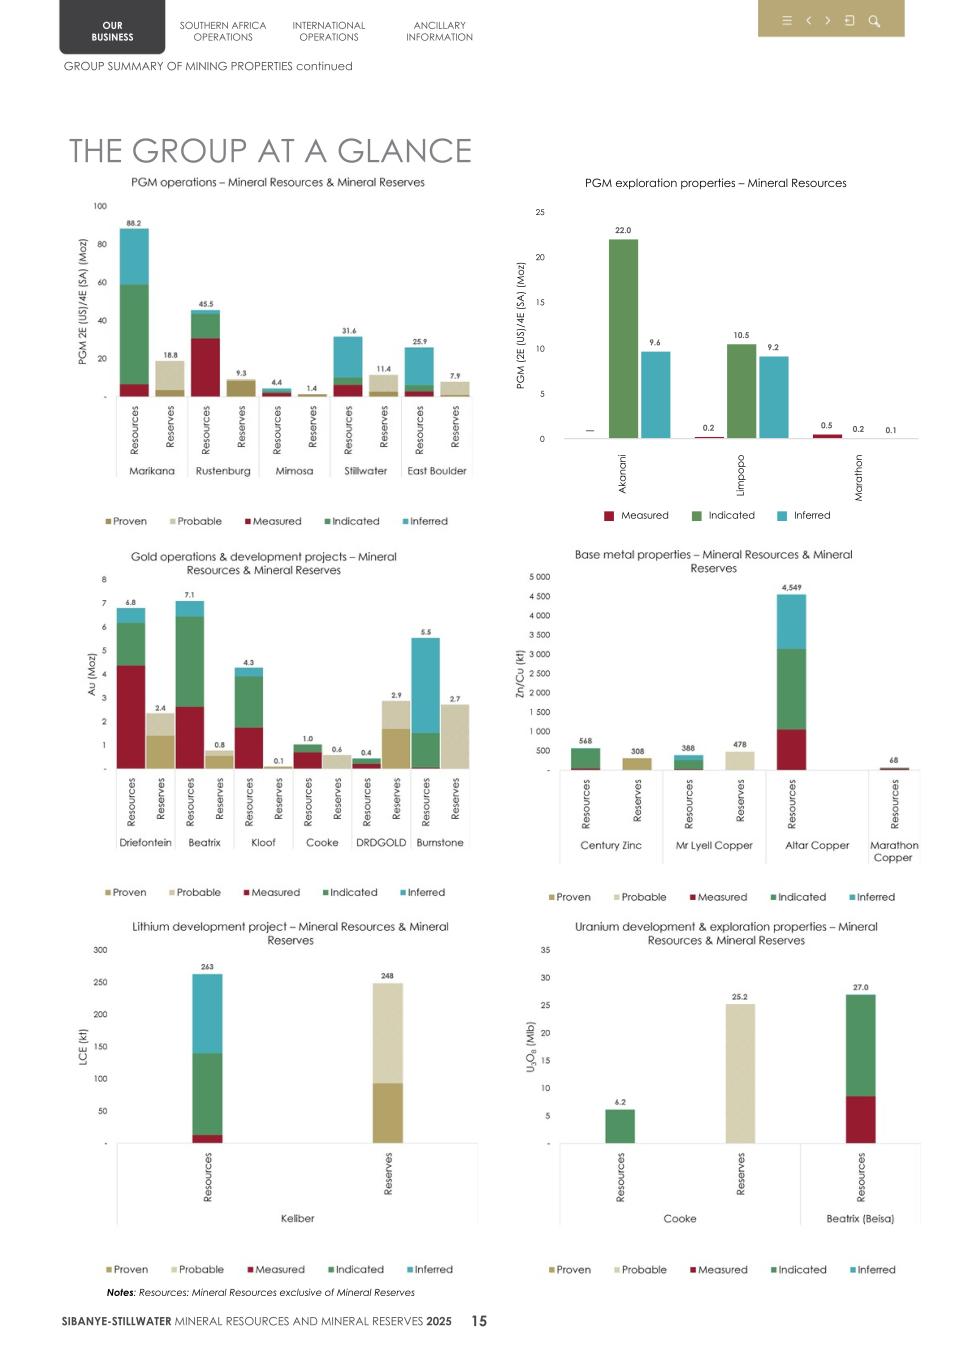
THE GROUP AT A GLANCE PG M ( 2E ( U S) /4 E (S A ) (M o z) PGM exploration properties – Mineral Resources — 0.2 0.5 22.0 10.5 0.2 9.6 9.2 0.1 Measured Indicated Inferred A ka n a n i Li m p o p o M a ra th o n 0 5 10 15 20 25 OUR BUSINESS SOUTHERN AFRICA OPERATIONS INTERNATIONAL OPERATIONS ANCILLARY INFORMATION GROUP SUMMARY OF MINING PROPERTIES continued SIBANYE-STILLWATER MINERAL RESOURCES AND MINERAL RESERVES 2025 15 Notes: Resources: Mineral Resources exclusive of Mineral Reserves
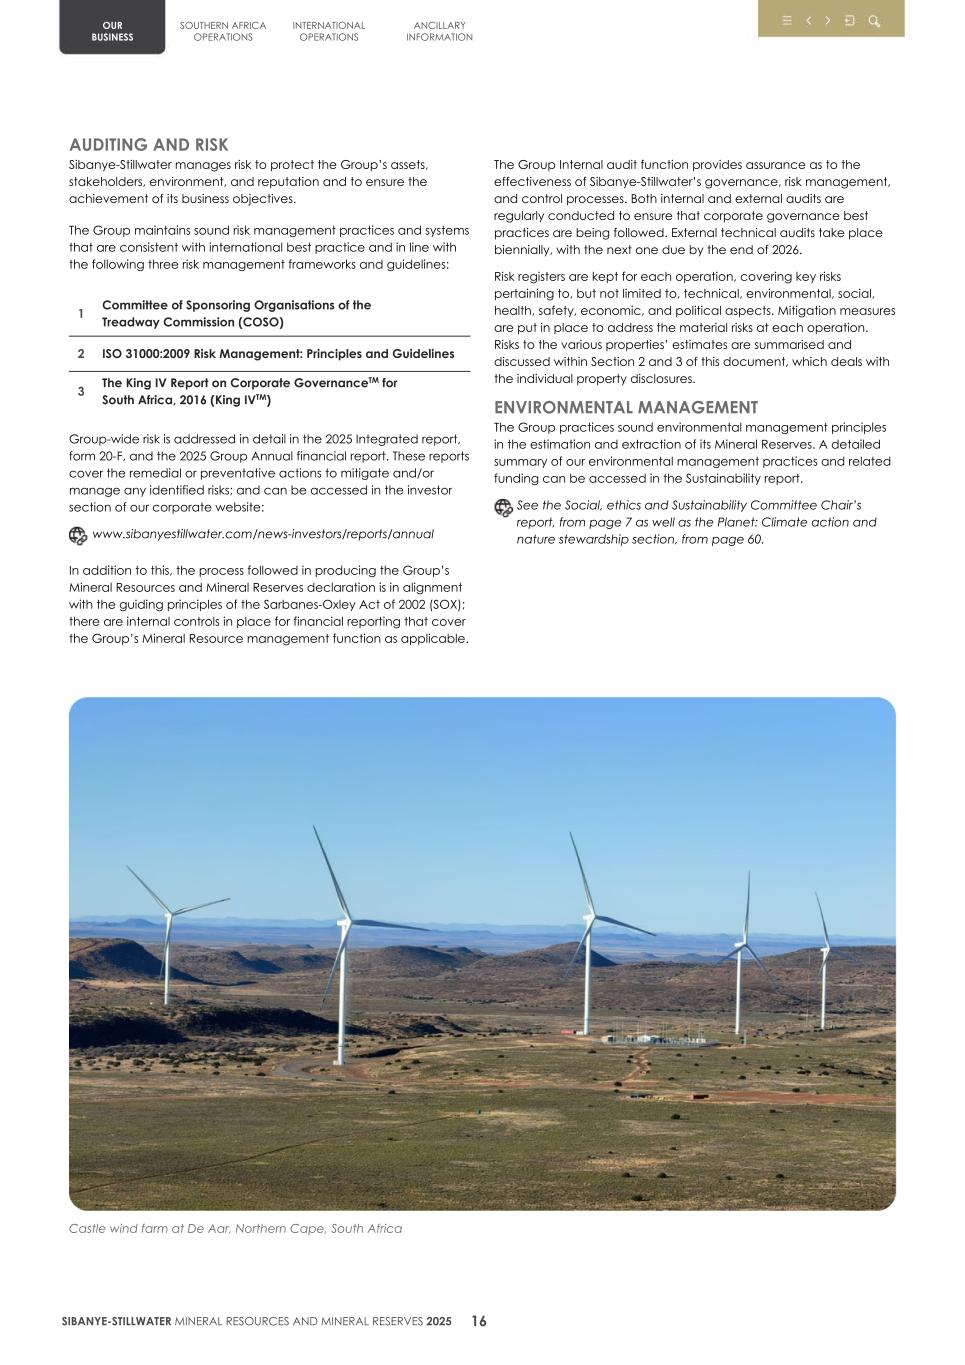
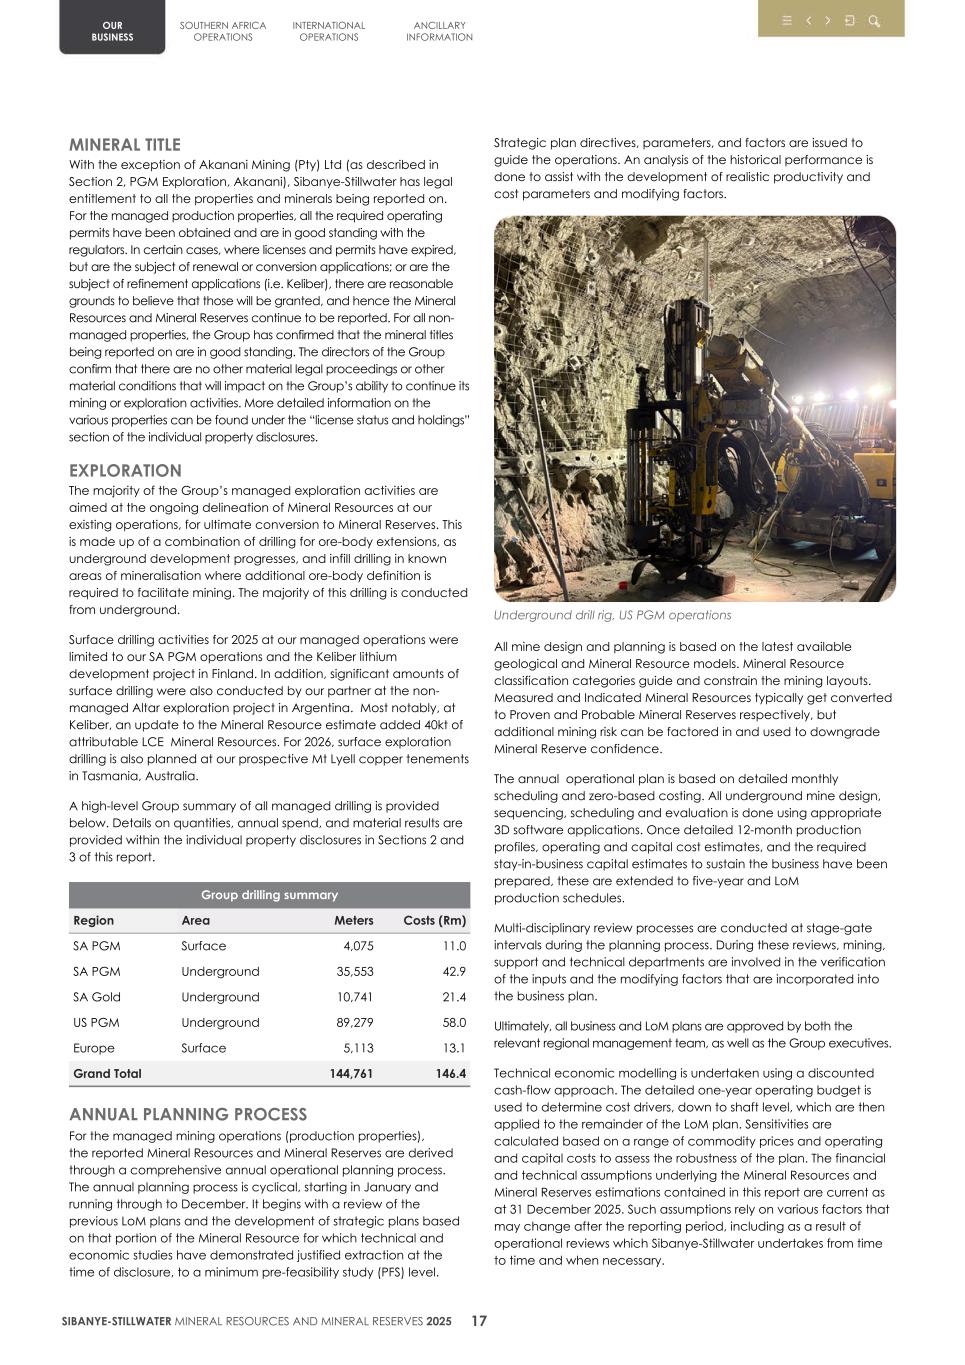
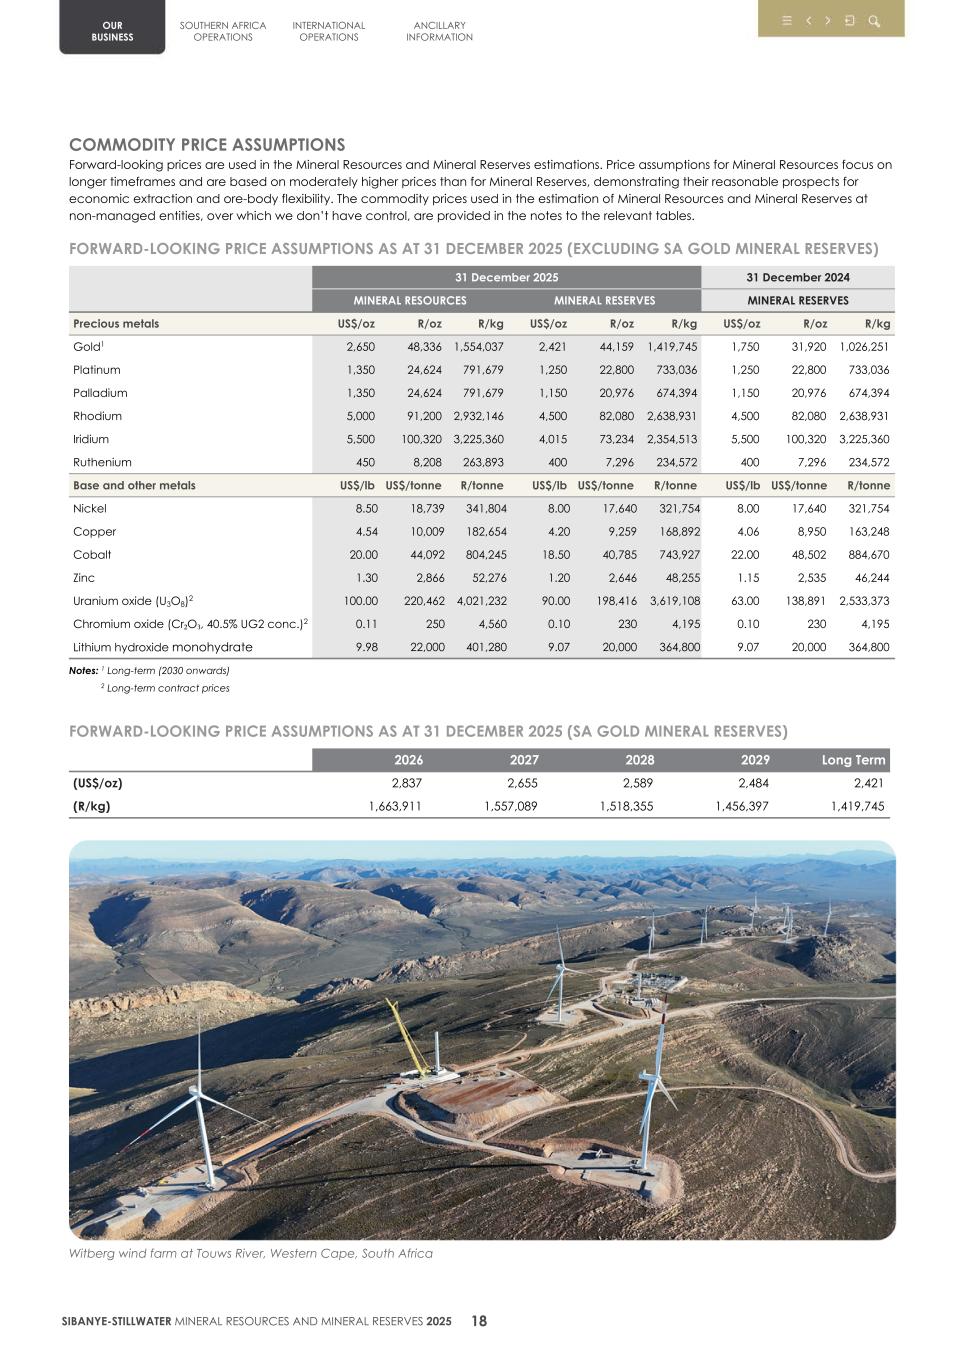
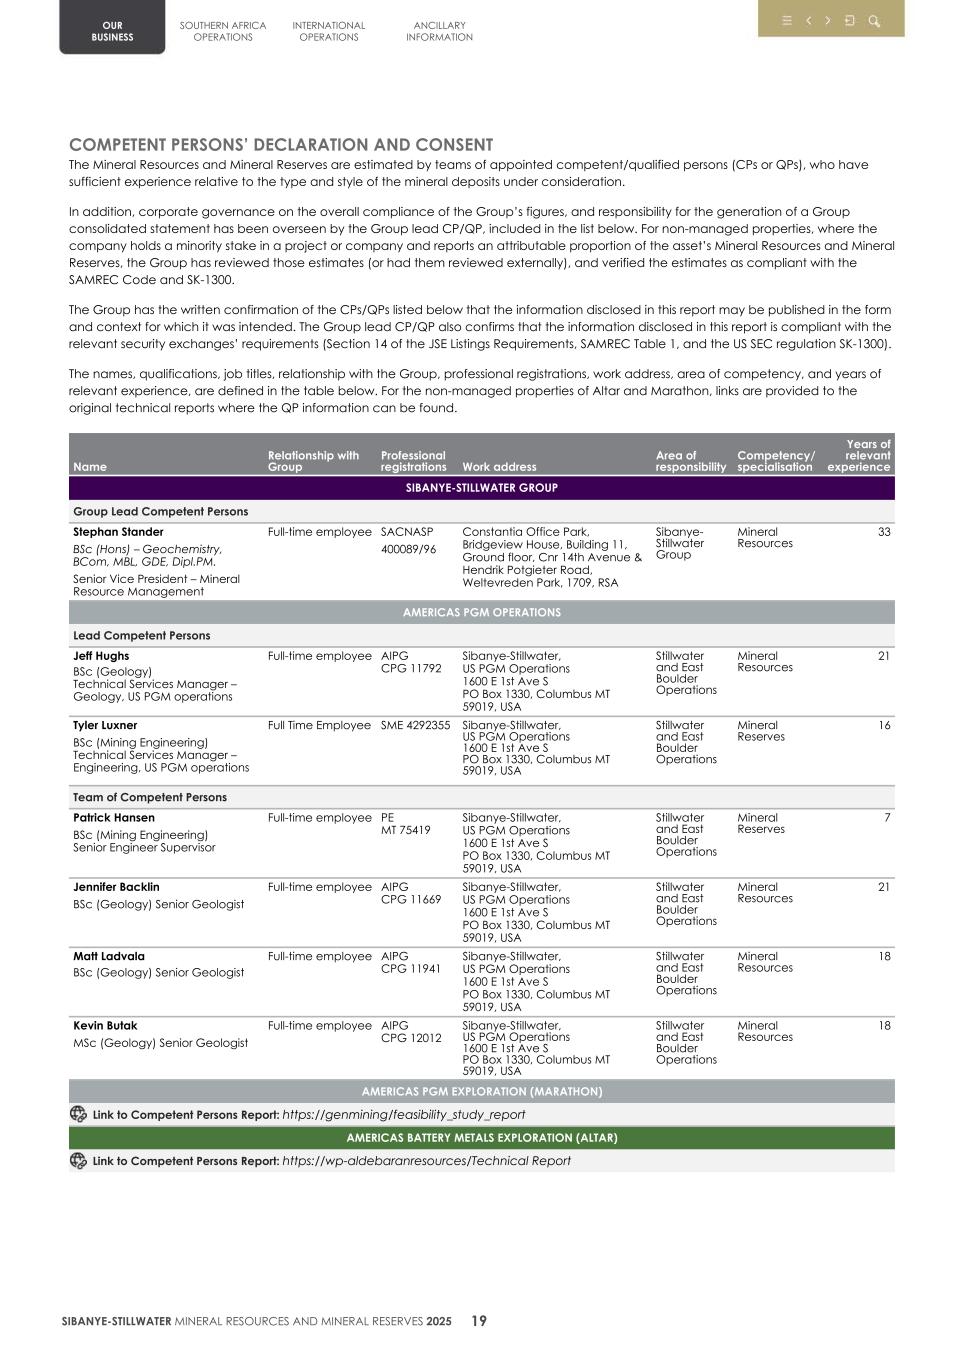
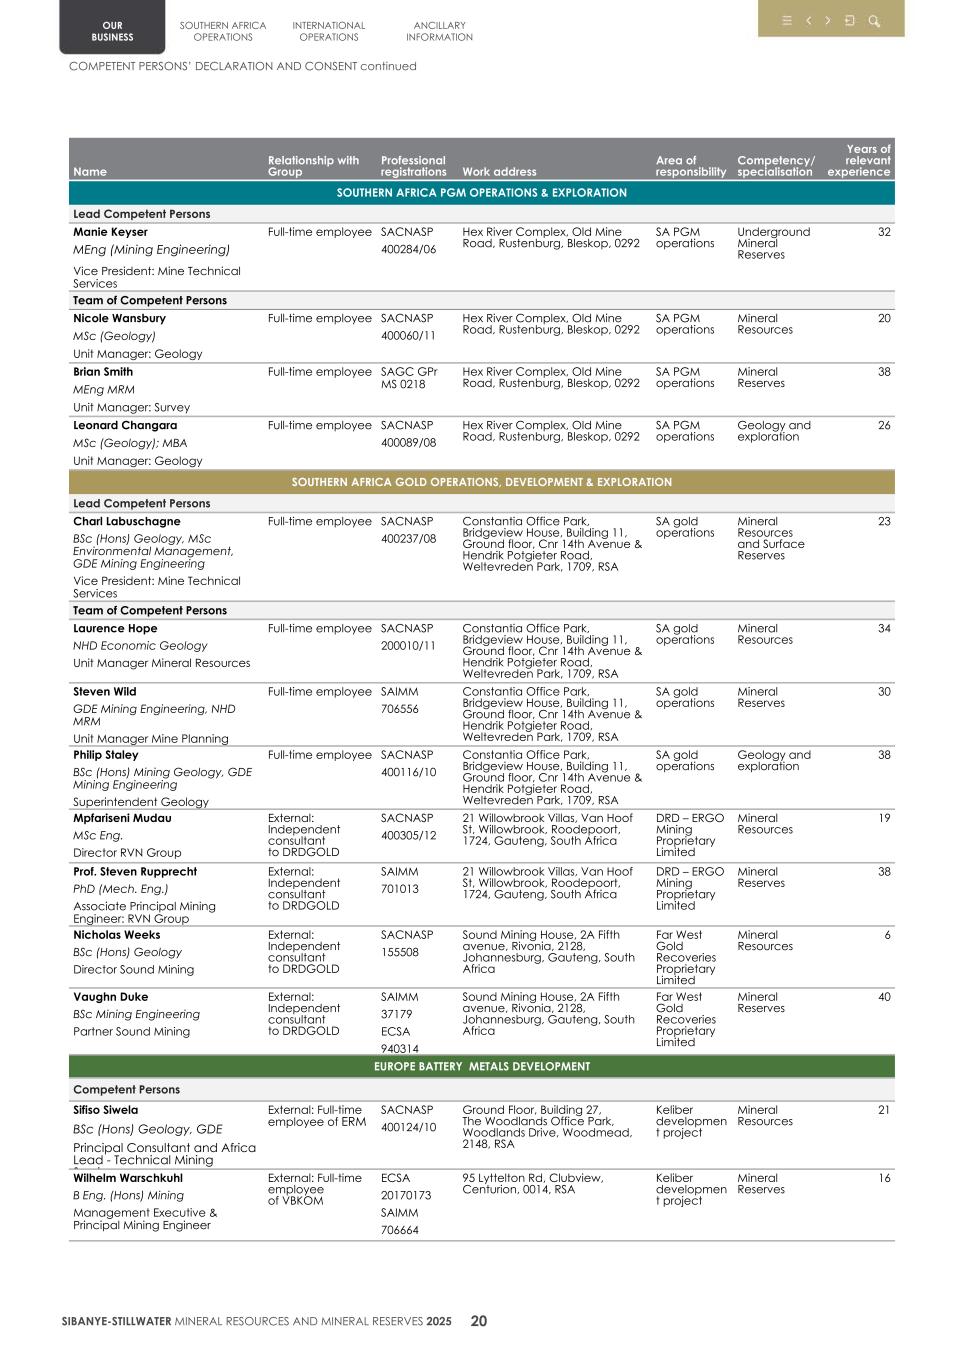
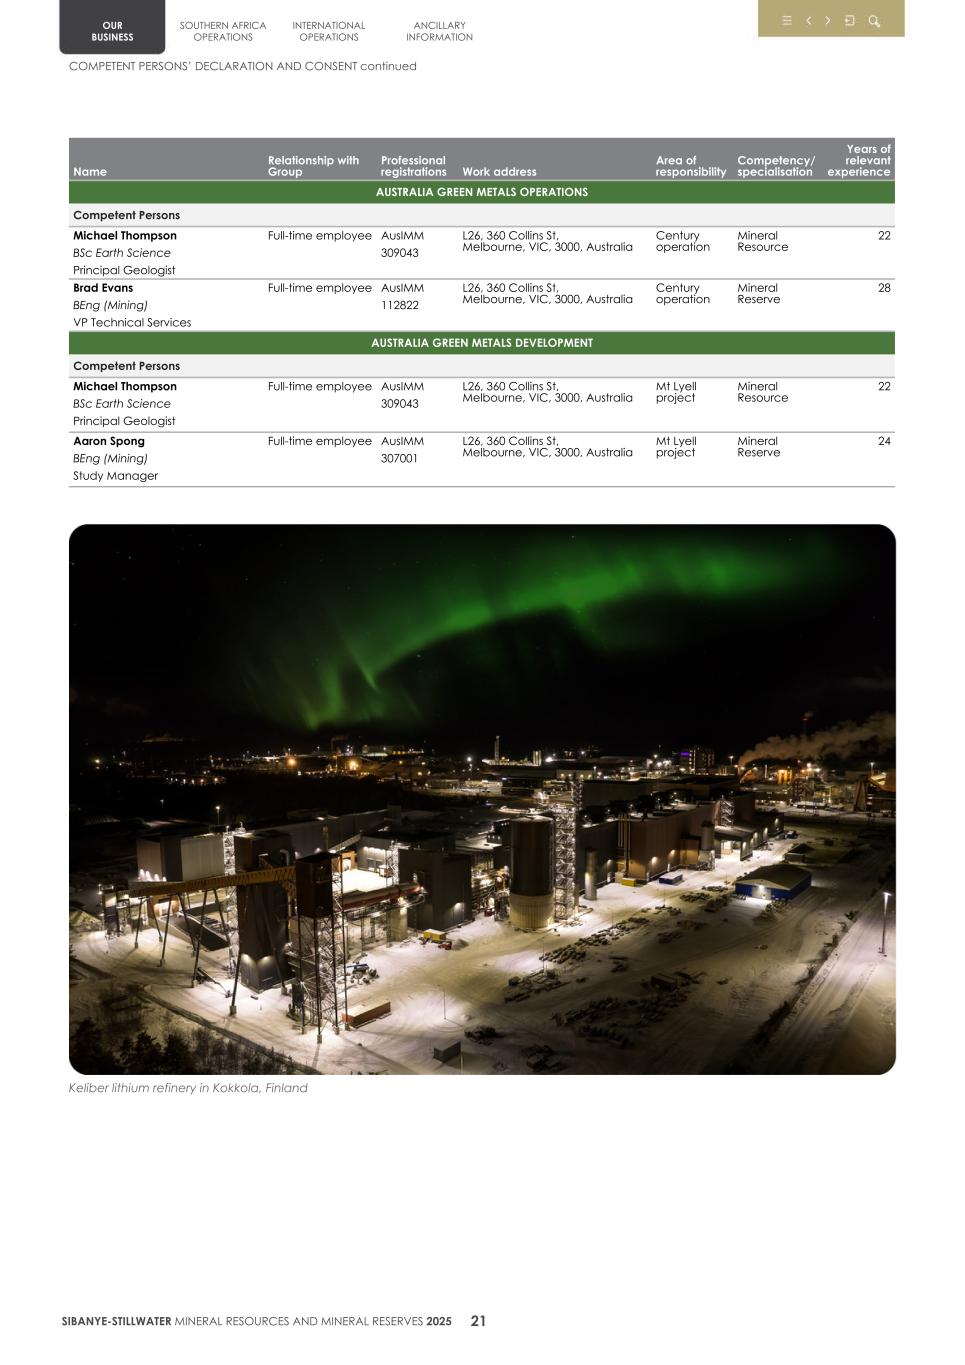
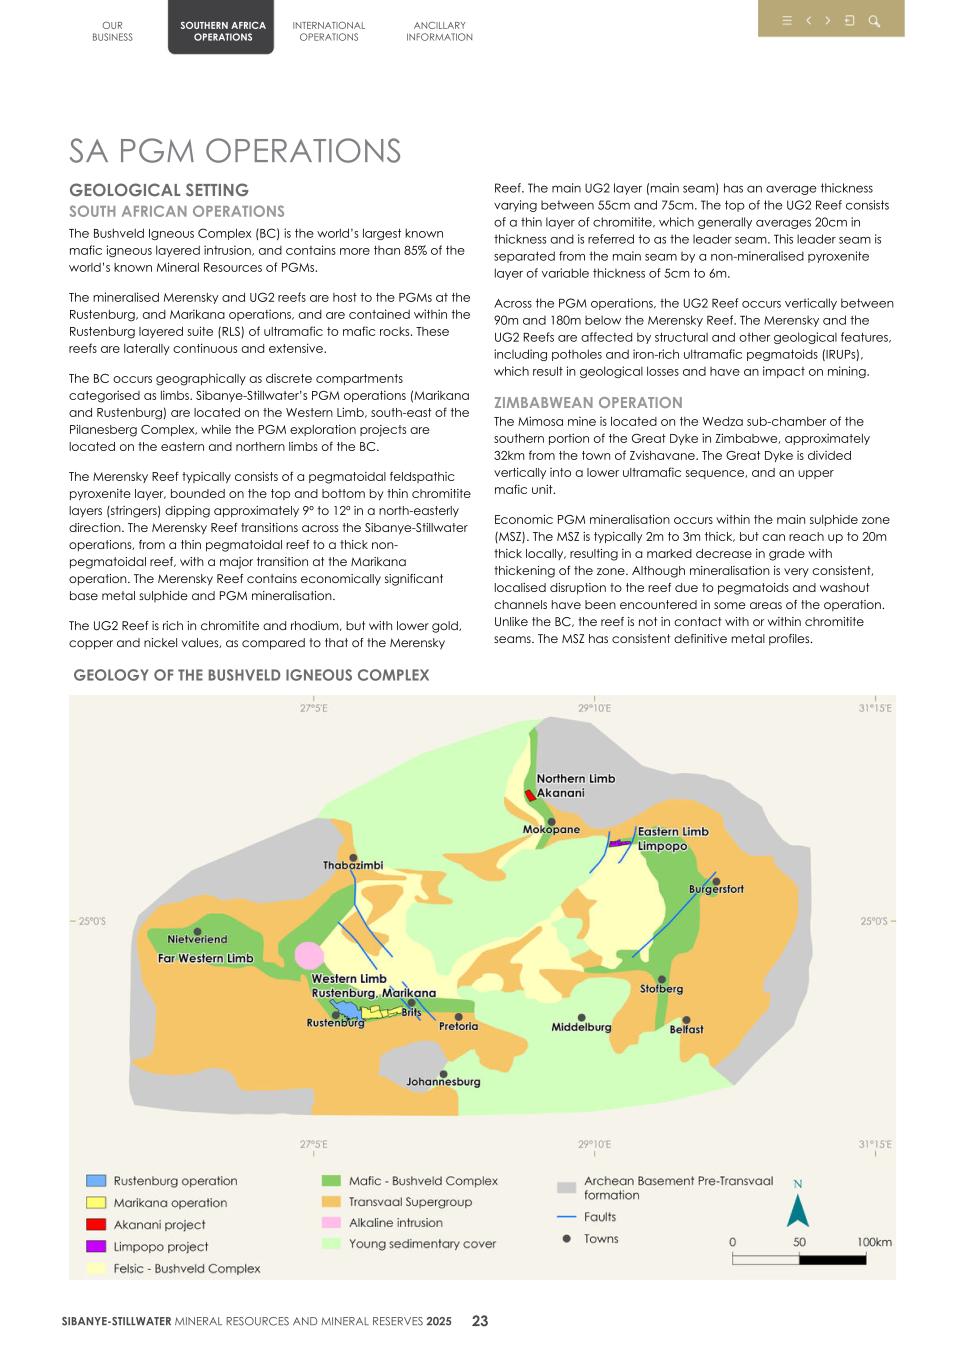
SA PGM OPERATIONS GEOLOGICAL SETTING SOUTH AFRICAN OPERATIONS The Bushveld Igneous Complex (BC) is the world’s largest known mafic igneous layered intrusion, and contains more than 85% of the world’s known Mineral Resources of PGMs. The mineralised Merensky and UG2 reefs are host to the PGMs at the Rustenburg, and Marikana operations, and are contained within the Rustenburg layered suite (RLS) of ultramafic to mafic rocks. These reefs are laterally continuous and extensive. The BC occurs geographically as discrete compartments categorised as limbs. Sibanye-Stillwater’s PGM operations (Marikana and Rustenburg) are located on the Western Limb, south-east of the Pilanesberg Complex, while the PGM exploration projects are located on the eastern and northern limbs of the BC. The Merensky Reef typically consists of a pegmatoidal feldspathic pyroxenite layer, bounded on the top and bottom by thin chromitite layers (stringers) dipping approximately 9º to 12º in a north-easterly direction. The Merensky Reef transitions across the Sibanye-Stillwater operations, from a thin pegmatoidal reef to a thick non- pegmatoidal reef, with a major transition at the Marikana operation. The Merensky Reef contains economically significant base metal sulphide and PGM mineralisation. The UG2 Reef is rich in chromitite and rhodium, but with lower gold, copper and nickel values, as compared to that of the Merensky Reef. The main UG2 layer (main seam) has an average thickness varying between 55cm and 75cm. The top of the UG2 Reef consists of a thin layer of chromitite, which generally averages 20cm in thickness and is referred to as the leader seam. This leader seam is separated from the main seam by a non-mineralised pyroxenite layer of variable thickness of 5cm to 6m. Across the PGM operations, the UG2 Reef occurs vertically between 90m and 180m below the Merensky Reef. The Merensky and the UG2 Reefs are affected by structural and other geological features, including potholes and iron-rich ultramafic pegmatoids (IRUPs), which result in geological losses and have an impact on mining. ZIMBABWEAN OPERATION The Mimosa mine is located on the Wedza sub-chamber of the southern portion of the Great Dyke in Zimbabwe, approximately 32km from the town of Zvishavane. The Great Dyke is divided vertically into a lower ultramafic sequence, and an upper mafic unit. Economic PGM mineralisation occurs within the main sulphide zone (MSZ). The MSZ is typically 2m to 3m thick, but can reach up to 20m thick locally, resulting in a marked decrease in grade with thickening of the zone. Although mineralisation is very consistent, localised disruption to the reef due to pegmatoids and washout channels have been encountered in some areas of the operation. Unlike the BC, the reef is not in contact with or within chromitite seams. The MSZ has consistent definitive metal profiles. GEOLOGY OF THE BUSHVELD IGNEOUS COMPLEX OUR BUSINESS SOUTHERN AFRICA OPERATIONS INTERNATIONAL OPERATIONS ANCILLARY INFORMATION SIBANYE-STILLWATER MINERAL RESOURCES AND MINERAL RESERVES 2025 23
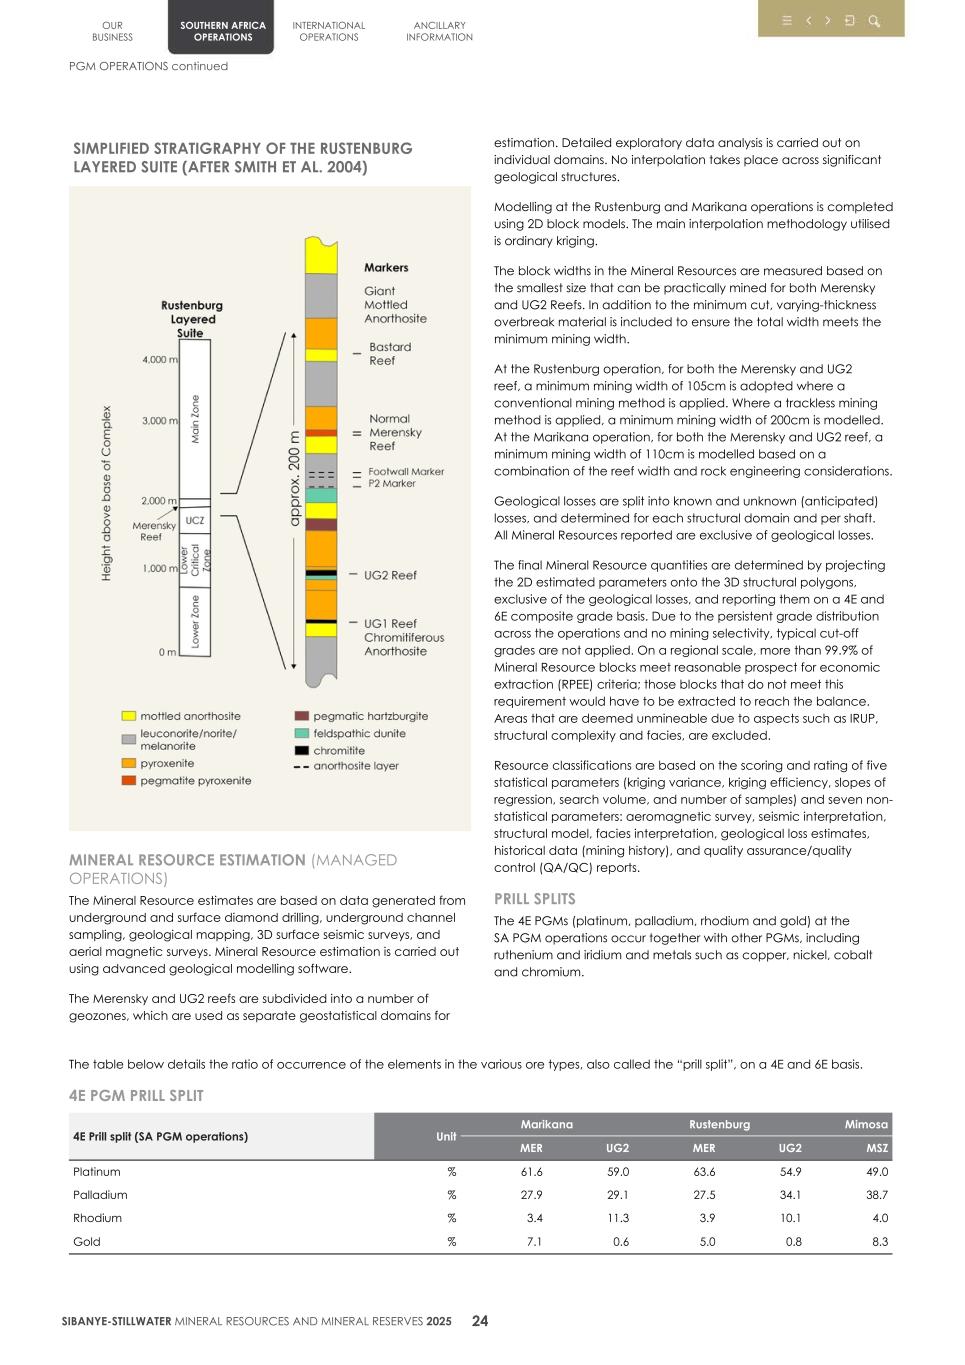
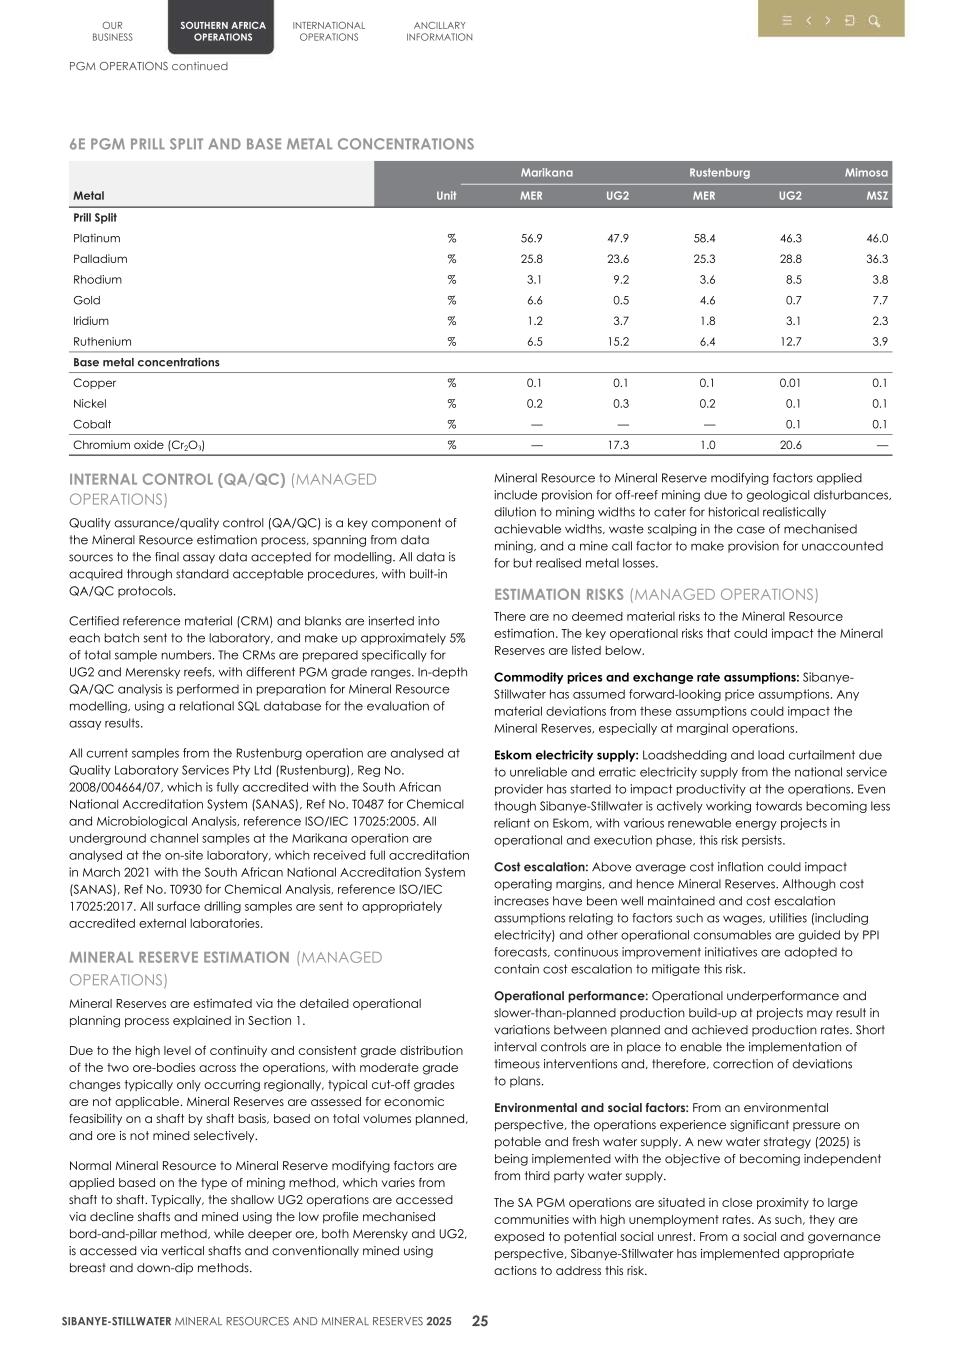
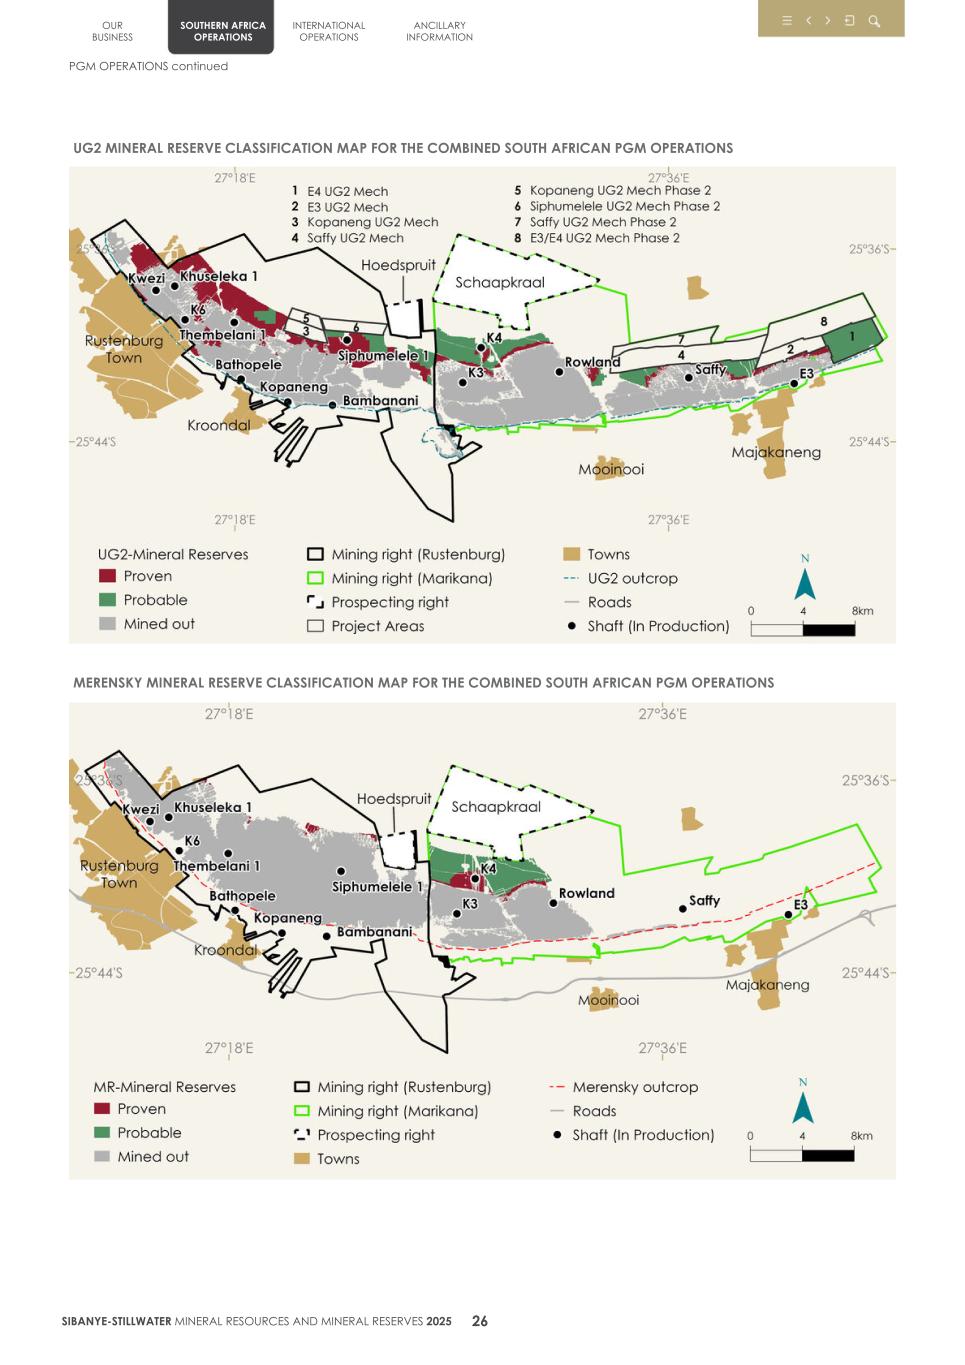
UG2 MINERAL RESERVE CLASSIFICATION MAP FOR THE COMBINED SOUTH AFRICAN PGM OPERATIONS MERENSKY MINERAL RESERVE CLASSIFICATION MAP FOR THE COMBINED SOUTH AFRICAN PGM OPERATIONS OUR BUSINESS SOUTHERN AFRICA OPERATIONS INTERNATIONAL OPERATIONS ANCILLARY INFORMATION PGM OPERATIONS continued SIBANYE-STILLWATER MINERAL RESOURCES AND MINERAL RESERVES 2025 26
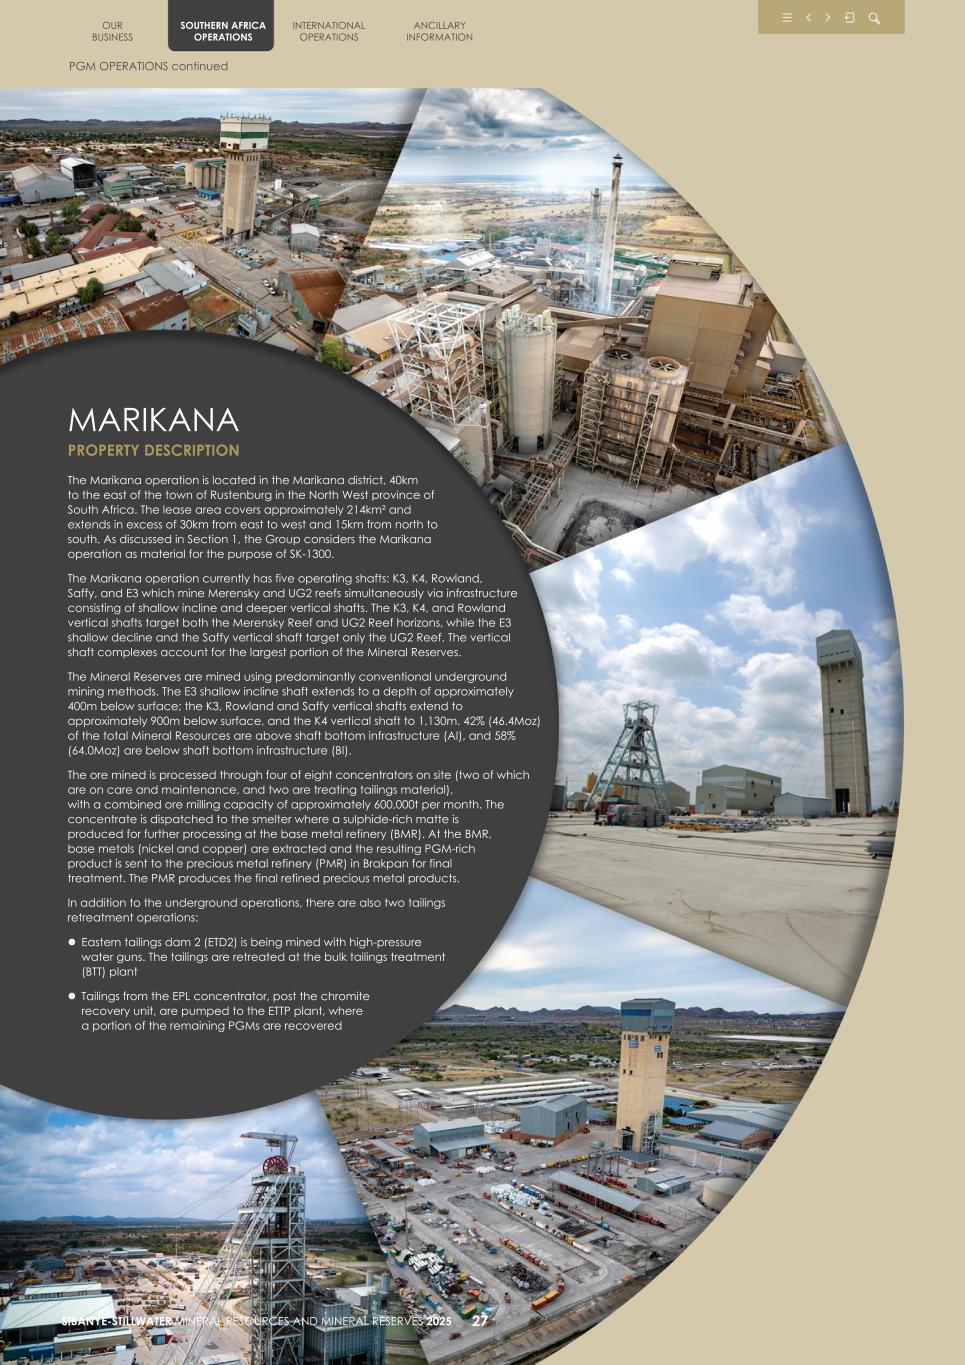
OUR BUSINESS SOUTHERN AFRICA OPERATIONS INTERNATIONAL OPERATIONS ANCILLARY INFORMATION PGM OPERATIONS continued SIBANYE-STILLWATER MINERAL RESOURCES AND MINERAL RESERVES 2025 27 MARIKANA PROPERTY DESCRIPTION The Marikana operation is located in the Marikana district, 40km to the east of the town of Rustenburg in the North West province of South Africa. The lease area covers approximately 214km² and extends in excess of 30km from east to west and 15km from north to south. As discussed in Section 1, the Group considers the Marikana operation as material for the purpose of SK-1300. The Marikana operation currently has five operating shafts: K3, K4, Rowland, Saffy, and E3 which mine Merensky and UG2 reefs simultaneously via infrastructure consisting of shallow incline and deeper vertical shafts. The K3, K4, and Rowland vertical shafts target both the Merensky Reef and UG2 Reef horizons, while the E3 shallow decline and the Saffy vertical shaft target only the UG2 Reef. The vertical shaft complexes account for the largest portion of the Mineral Reserves. The Mineral Reserves are mined using predominantly conventional underground mining methods. The E3 shallow incline shaft extends to a depth of approximately 400m below surface; the K3, Rowland and Saffy vertical shafts extend to approximately 900m below surface, and the K4 vertical shaft to 1,130m. 42% (46.4Moz) of the total Mineral Resources are above shaft bottom infrastructure (AI), and 58% (64.0Moz) are below shaft bottom infrastructure (BI). The ore mined is processed through four of eight concentrators on site (two of which are on care and maintenance, and two are treating tailings material), with a combined ore milling capacity of approximately 600,000t per month. The concentrate is dispatched to the smelter where a sulphide-rich matte is produced for further processing at the base metal refinery (BMR). At the BMR, base metals (nickel and copper) are extracted and the resulting PGM-rich product is sent to the precious metal refinery (PMR) in Brakpan for final treatment. The PMR produces the final refined precious metal products. In addition to the underground operations, there are also two tailings retreatment operations: l Eastern tailings dam 2 (ETD2) is being mined with high-pressure water guns. The tailings are retreated at the bulk tailings treatment (BTT) plant l Tailings from the EPL concentrator, post the chromite recovery unit, are pumped to the ETTP plant, where a portion of the remaining PGMs are recovered
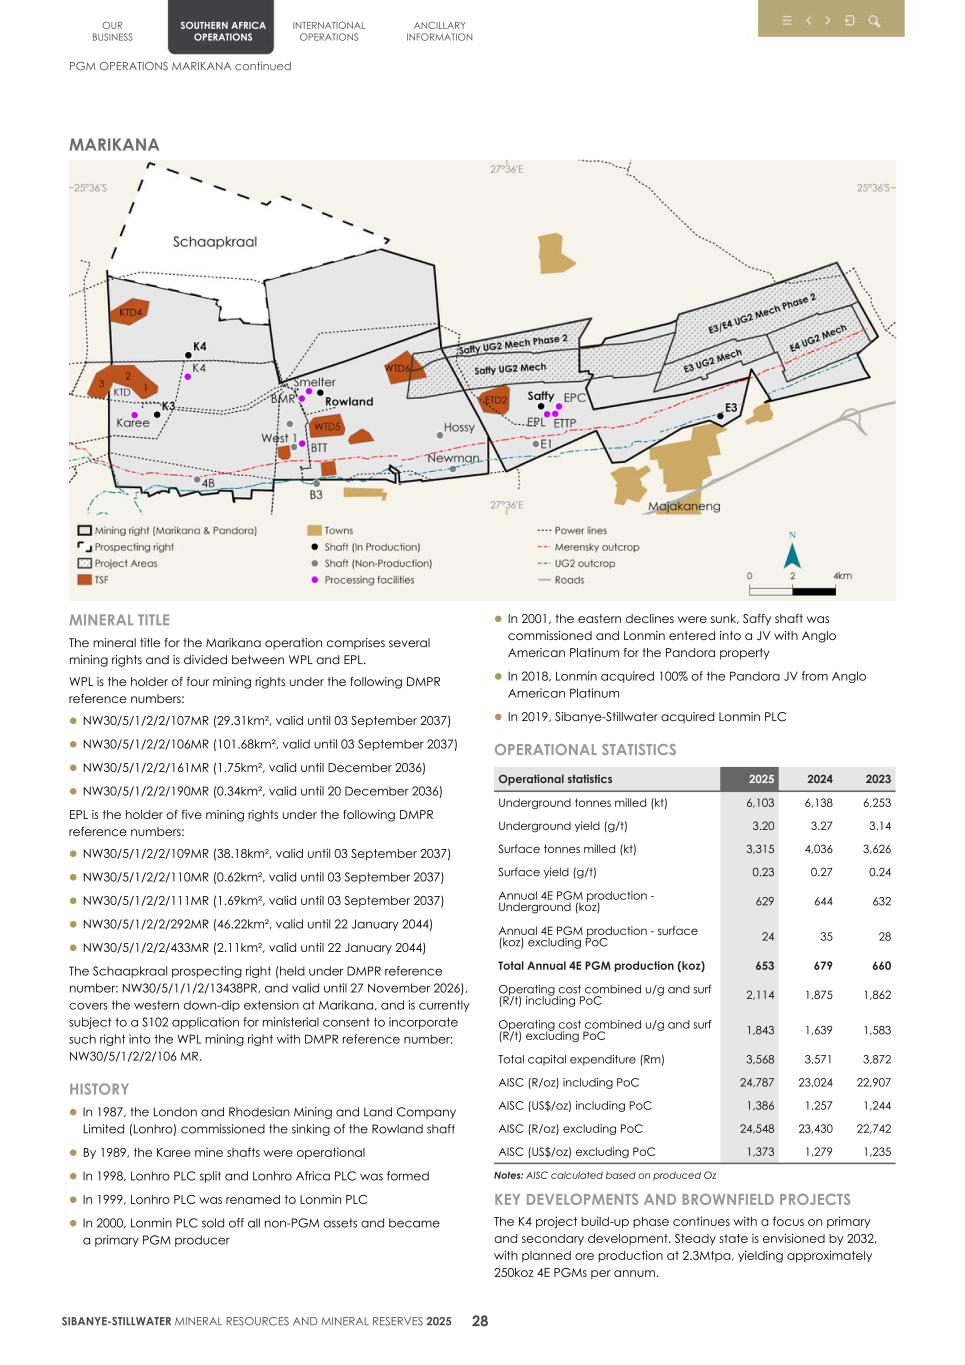
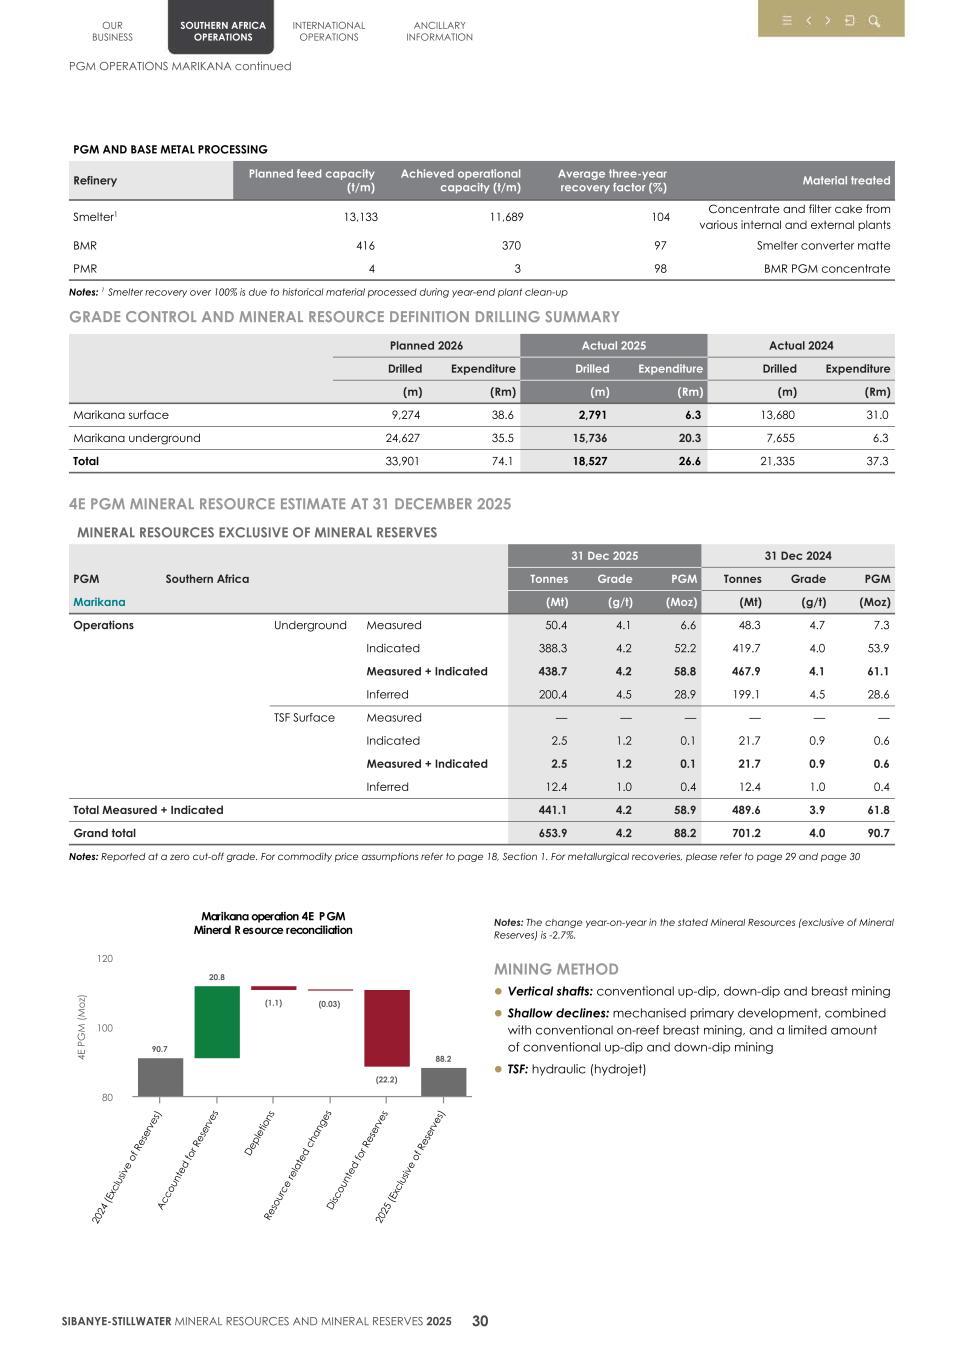
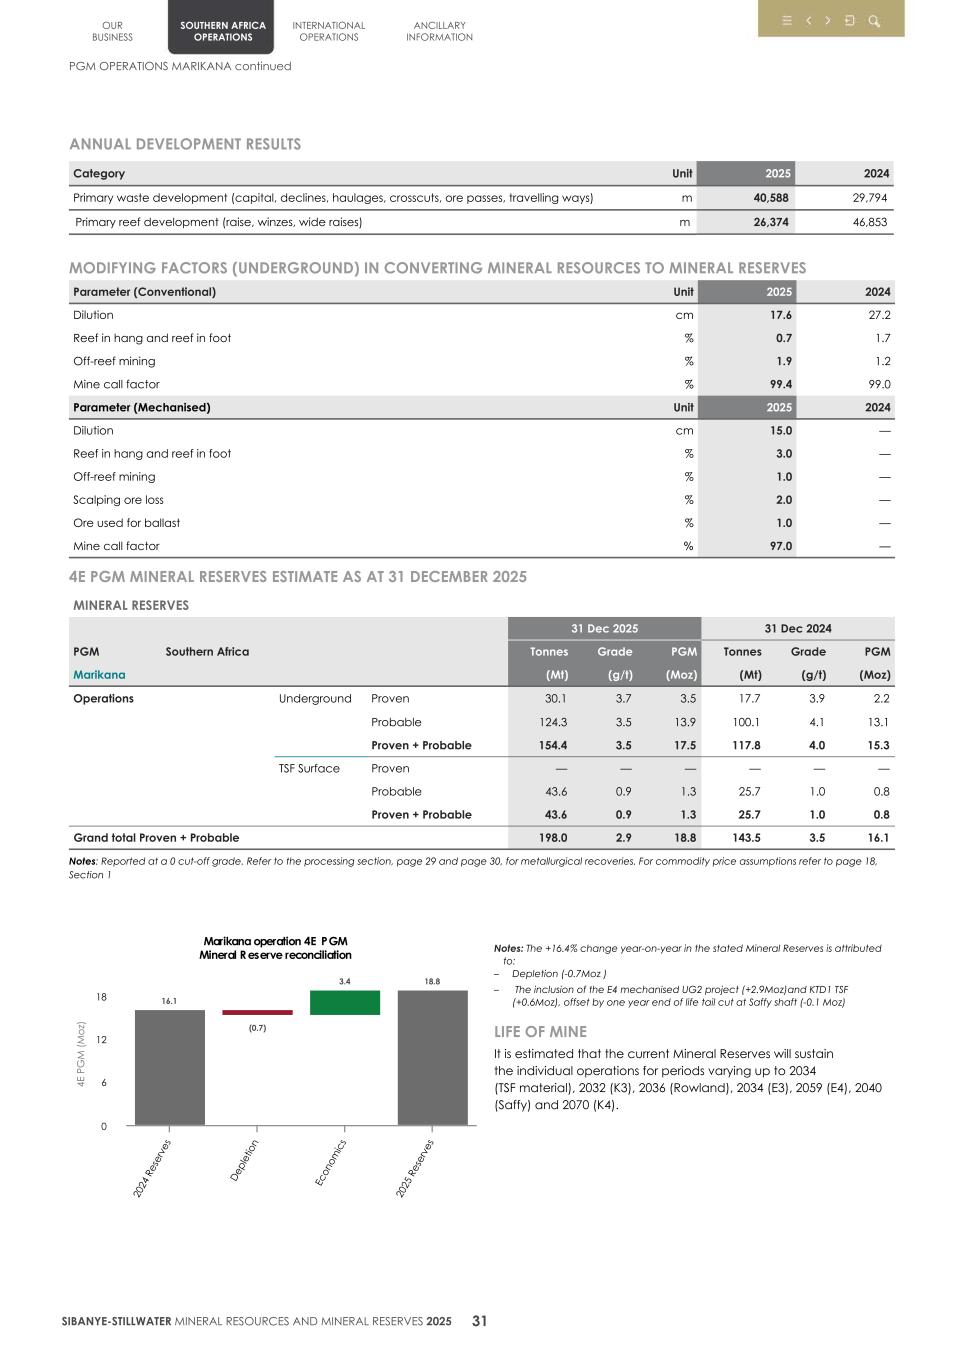
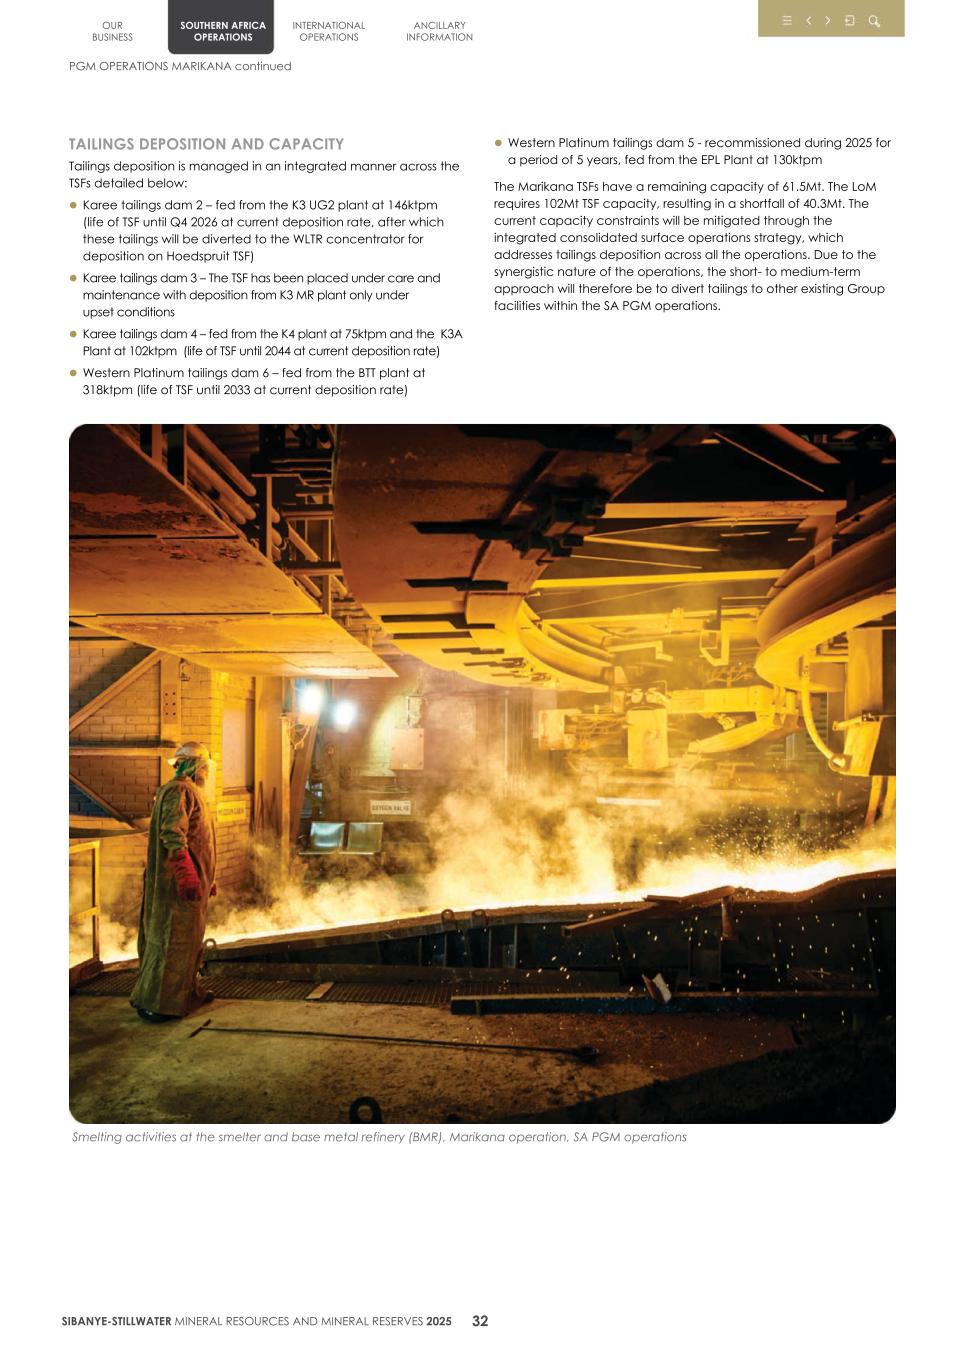
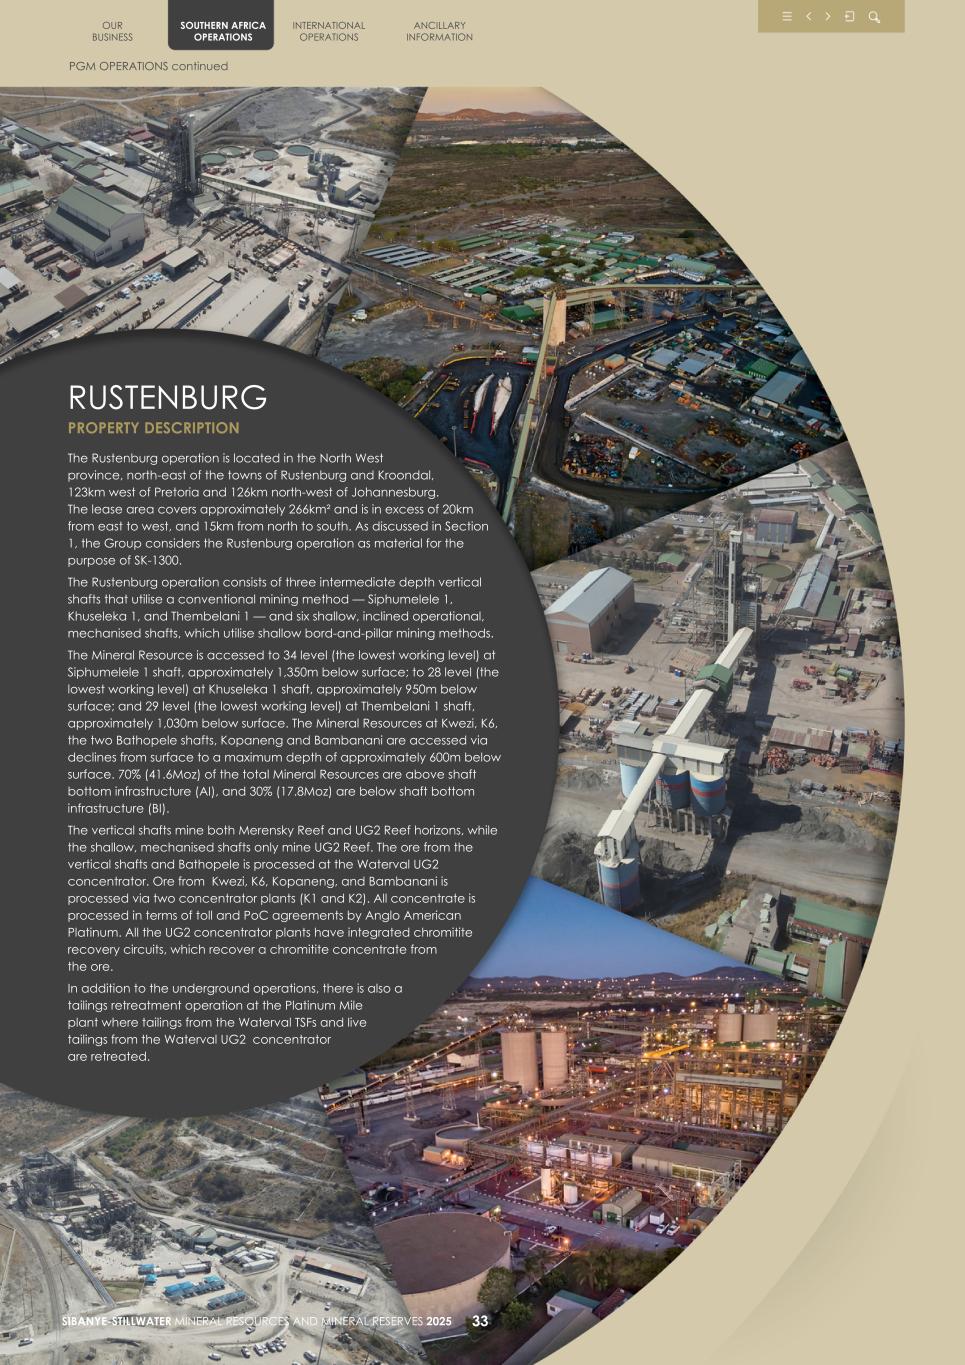
OUR BUSINESS SOUTHERN AFRICA OPERATIONS INTERNATIONAL OPERATIONS ANCILLARY INFORMATION PGM OPERATIONS continued SIBANYE-STILLWATER MINERAL RESOURCES AND MINERAL RESERVES 2025 33 RUSTENBURG PROPERTY DESCRIPTION The Rustenburg operation is located in the North West province, north-east of the towns of Rustenburg and Kroondal, 123km west of Pretoria and 126km north-west of Johannesburg. The lease area covers approximately 266km² and is in excess of 20km from east to west, and 15km from north to south. As discussed in Section 1, the Group considers the Rustenburg operation as material for the purpose of SK-1300. The Rustenburg operation consists of three intermediate depth vertical shafts that utilise a conventional mining method — Siphumelele 1, Khuseleka 1, and Thembelani 1 — and six shallow, inclined operational, mechanised shafts, which utilise shallow bord-and-pillar mining methods. The Mineral Resource is accessed to 34 level (the lowest working level) at Siphumelele 1 shaft, approximately 1,350m below surface; to 28 level (the lowest working level) at Khuseleka 1 shaft, approximately 950m below surface; and 29 level (the lowest working level) at Thembelani 1 shaft, approximately 1,030m below surface. The Mineral Resources at Kwezi, K6, the two Bathopele shafts, Kopaneng and Bambanani are accessed via declines from surface to a maximum depth of approximately 600m below surface. 70% (41.6Moz) of the total Mineral Resources are above shaft bottom infrastructure (AI), and 30% (17.8Moz) are below shaft bottom infrastructure (BI). The vertical shafts mine both Merensky Reef and UG2 Reef horizons, while the shallow, mechanised shafts only mine UG2 Reef. The ore from the vertical shafts and Bathopele is processed at the Waterval UG2 concentrator. Ore from Kwezi, K6, Kopaneng, and Bambanani is processed via two concentrator plants (K1 and K2). All concentrate is processed in terms of toll and PoC agreements by Anglo American Platinum. All the UG2 concentrator plants have integrated chromitite recovery circuits, which recover a chromitite concentrate from the ore. In addition to the underground operations, there is also a tailings retreatment operation at the Platinum Mile plant where tailings from the Waterval TSFs and live tailings from the Waterval UG2 concentrator are retreated.
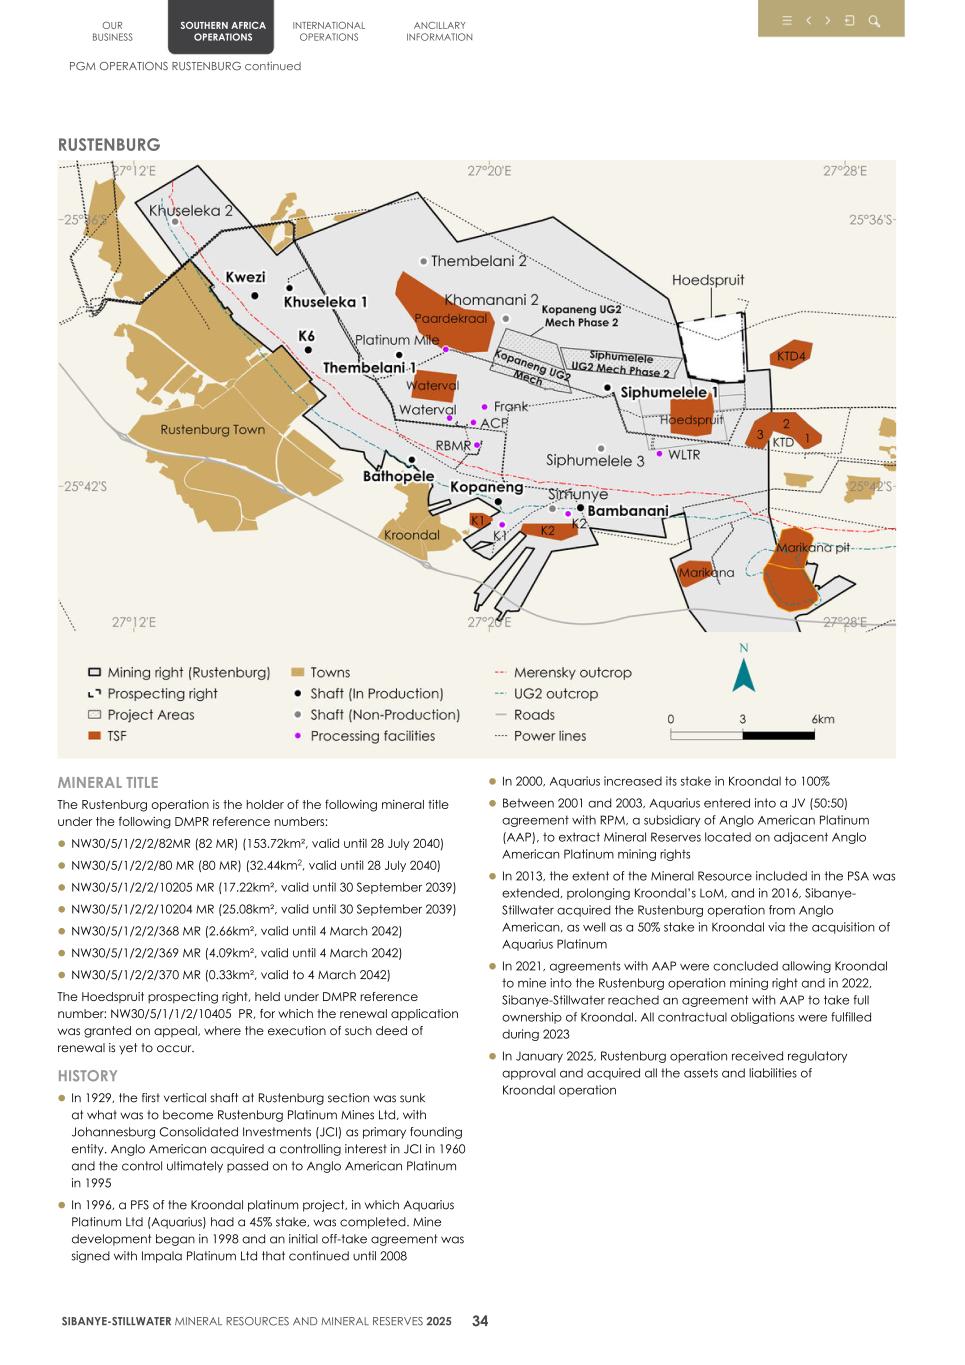
RUSTENBURG MINERAL TITLE The Rustenburg operation is the holder of the following mineral title under the following DMPR reference numbers: l NW30/5/1/2/2/82MR (82 MR) (153.72km², valid until 28 July 2040) l NW30/5/1/2/2/80 MR (80 MR) (32.44km2, valid until 28 July 2040) l NW30/5/1/2/2/10205 MR (17.22km², valid until 30 September 2039) l NW30/5/1/2/2/10204 MR (25.08km², valid until 30 September 2039) l NW30/5/1/2/2/368 MR (2.66km², valid until 4 March 2042) l NW30/5/1/2/2/369 MR (4.09km², valid until 4 March 2042) l NW30/5/1/2/2/370 MR (0.33km², valid to 4 March 2042) The Hoedspruit prospecting right, held under DMPR reference number: NW30/5/1/1/2/10405 PR, for which the renewal application was granted on appeal, where the execution of such deed of renewal is yet to occur. HISTORY l In 1929, the first vertical shaft at Rustenburg section was sunk at what was to become Rustenburg Platinum Mines Ltd, with Johannesburg Consolidated Investments (JCI) as primary founding entity. Anglo American acquired a controlling interest in JCI in 1960 and the control ultimately passed on to Anglo American Platinum in 1995 l In 1996, a PFS of the Kroondal platinum project, in which Aquarius Platinum Ltd (Aquarius) had a 45% stake, was completed. Mine development began in 1998 and an initial off-take agreement was signed with Impala Platinum Ltd that continued until 2008 l In 2000, Aquarius increased its stake in Kroondal to 100% l Between 2001 and 2003, Aquarius entered into a JV (50:50) agreement with RPM, a subsidiary of Anglo American Platinum (AAP), to extract Mineral Reserves located on adjacent Anglo American Platinum mining rights l In 2013, the extent of the Mineral Resource included in the PSA was extended, prolonging Kroondal’s LoM, and in 2016, Sibanye- Stillwater acquired the Rustenburg operation from Anglo American, as well as a 50% stake in Kroondal via the acquisition of Aquarius Platinum l In 2021, agreements with AAP were concluded allowing Kroondal to mine into the Rustenburg operation mining right and in 2022, Sibanye-Stillwater reached an agreement with AAP to take full ownership of Kroondal. All contractual obligations were fulfilled during 2023 l In January 2025, Rustenburg operation received regulatory approval and acquired all the assets and liabilities of Kroondal operation OUR BUSINESS SOUTHERN AFRICA OPERATIONS INTERNATIONAL OPERATIONS ANCILLARY INFORMATION PGM OPERATIONS RUSTENBURG continued SIBANYE-STILLWATER MINERAL RESOURCES AND MINERAL RESERVES 2025 34
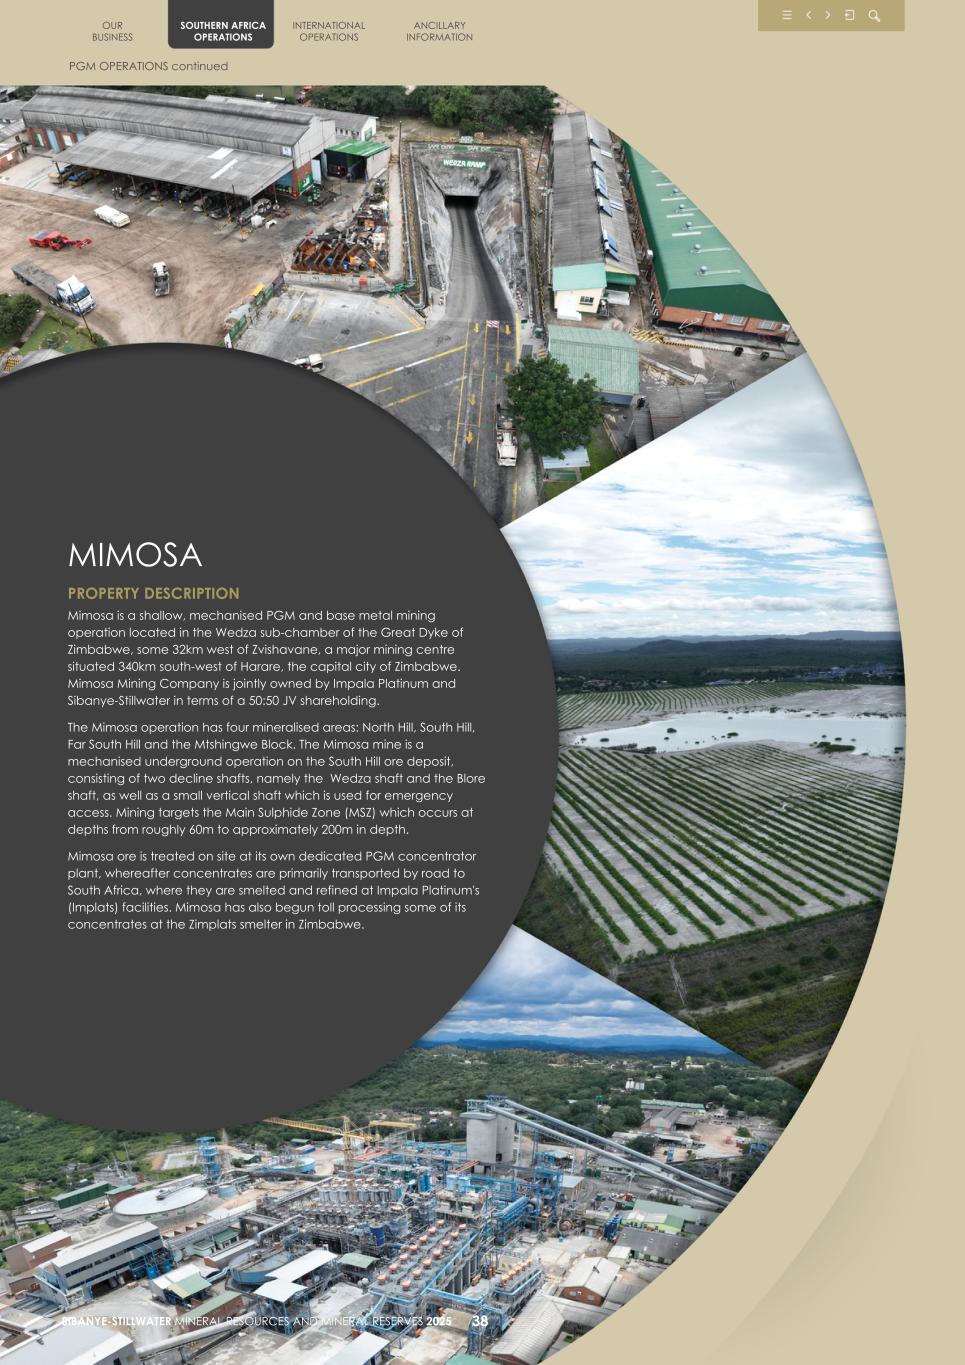
OUR BUSINESS SOUTHERN AFRICA OPERATIONS INTERNATIONAL OPERATIONS ANCILLARY INFORMATION PGM OPERATIONS continued SIBANYE-STILLWATER MINERAL RESOURCES AND MINERAL RESERVES 2025 38 MIMOSA PROPERTY DESCRIPTION Mimosa is a shallow, mechanised PGM and base metal mining operation located in the Wedza sub-chamber of the Great Dyke of Zimbabwe, some 32km west of Zvishavane, a major mining centre situated 340km south-west of Harare, the capital city of Zimbabwe. Mimosa Mining Company is jointly owned by Impala Platinum and Sibanye-Stillwater in terms of a 50:50 JV shareholding. The Mimosa operation has four mineralised areas: North Hill, South Hill, Far South Hill and the Mtshingwe Block. The Mimosa mine is a mechanised underground operation on the South Hill ore deposit, consisting of two decline shafts, namely the Wedza shaft and the Blore shaft, as well as a small vertical shaft which is used for emergency access. Mining targets the Main Sulphide Zone (MSZ) which occurs at depths from roughly 60m to approximately 200m in depth. Mimosa ore is treated on site at its own dedicated PGM concentrator plant, whereafter concentrates are primarily transported by road to South Africa, where they are smelted and refined at Impala Platinum's (Implats) facilities. Mimosa has also begun toll processing some of its concentrates at the Zimplats smelter in Zimbabwe.
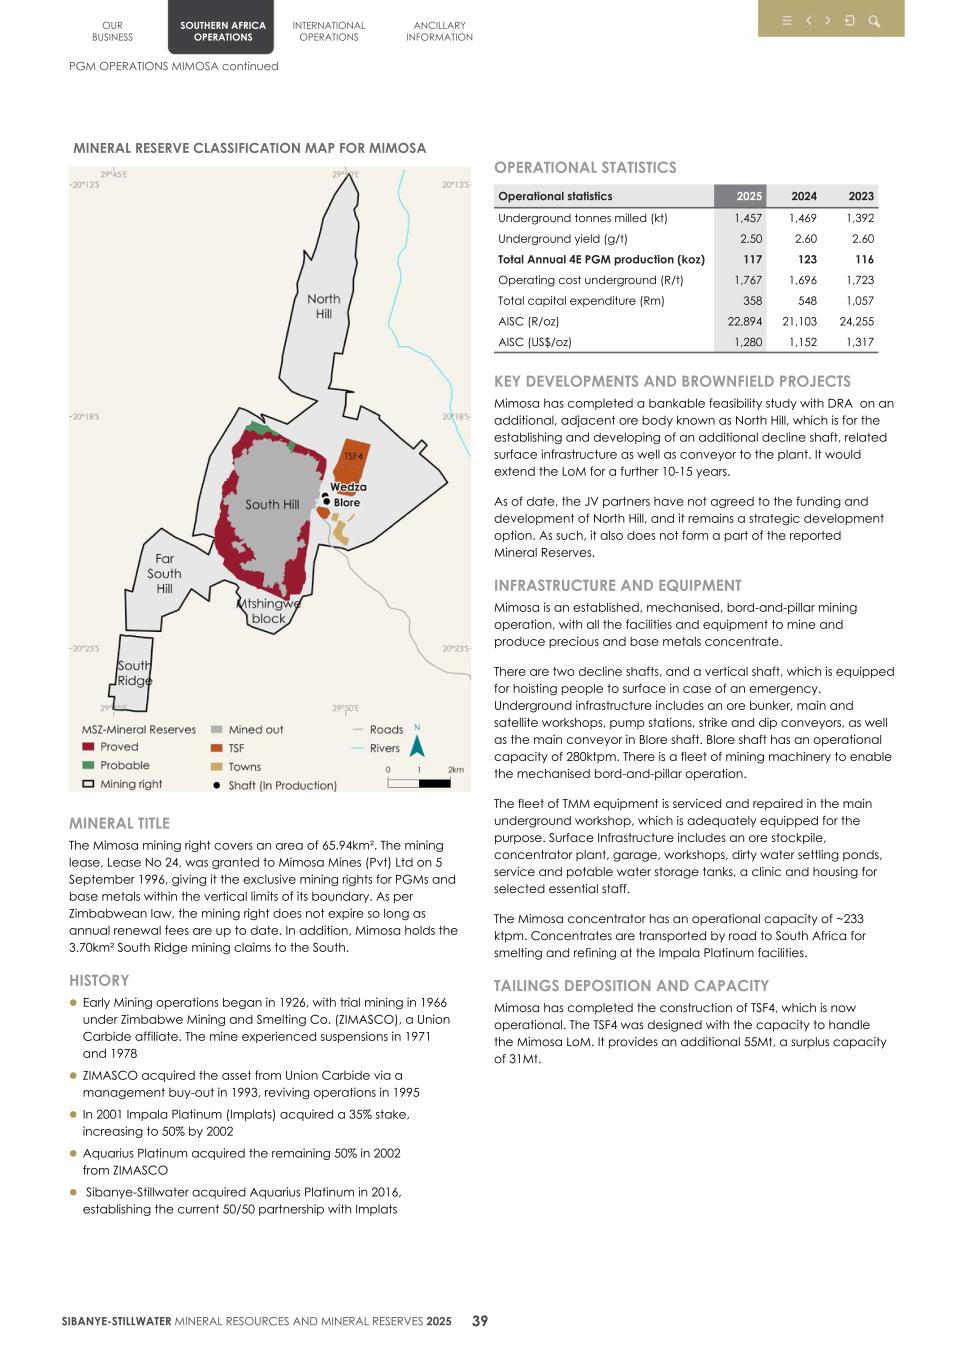
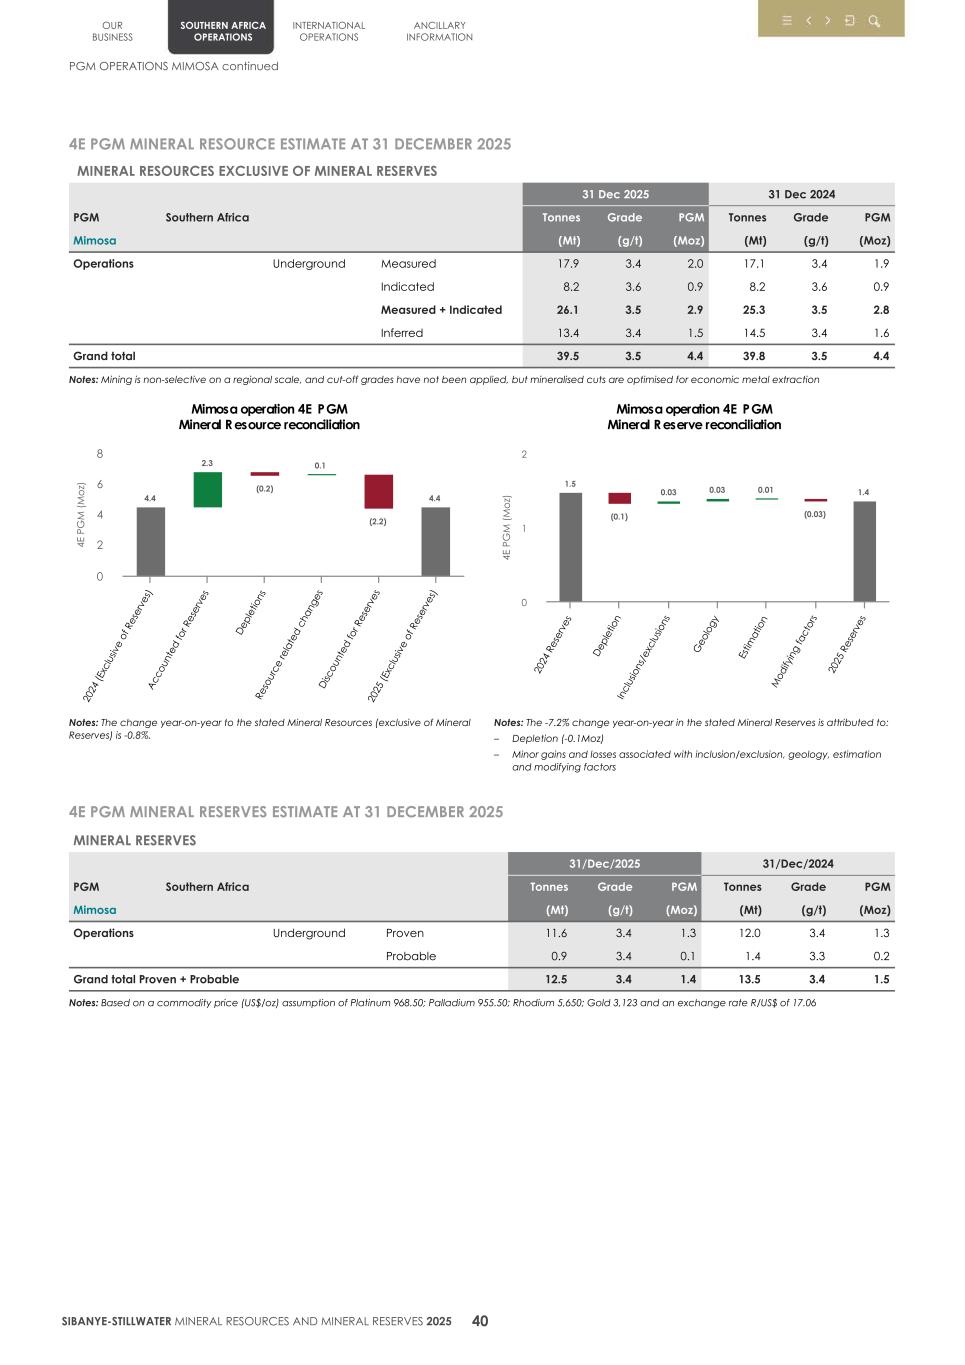
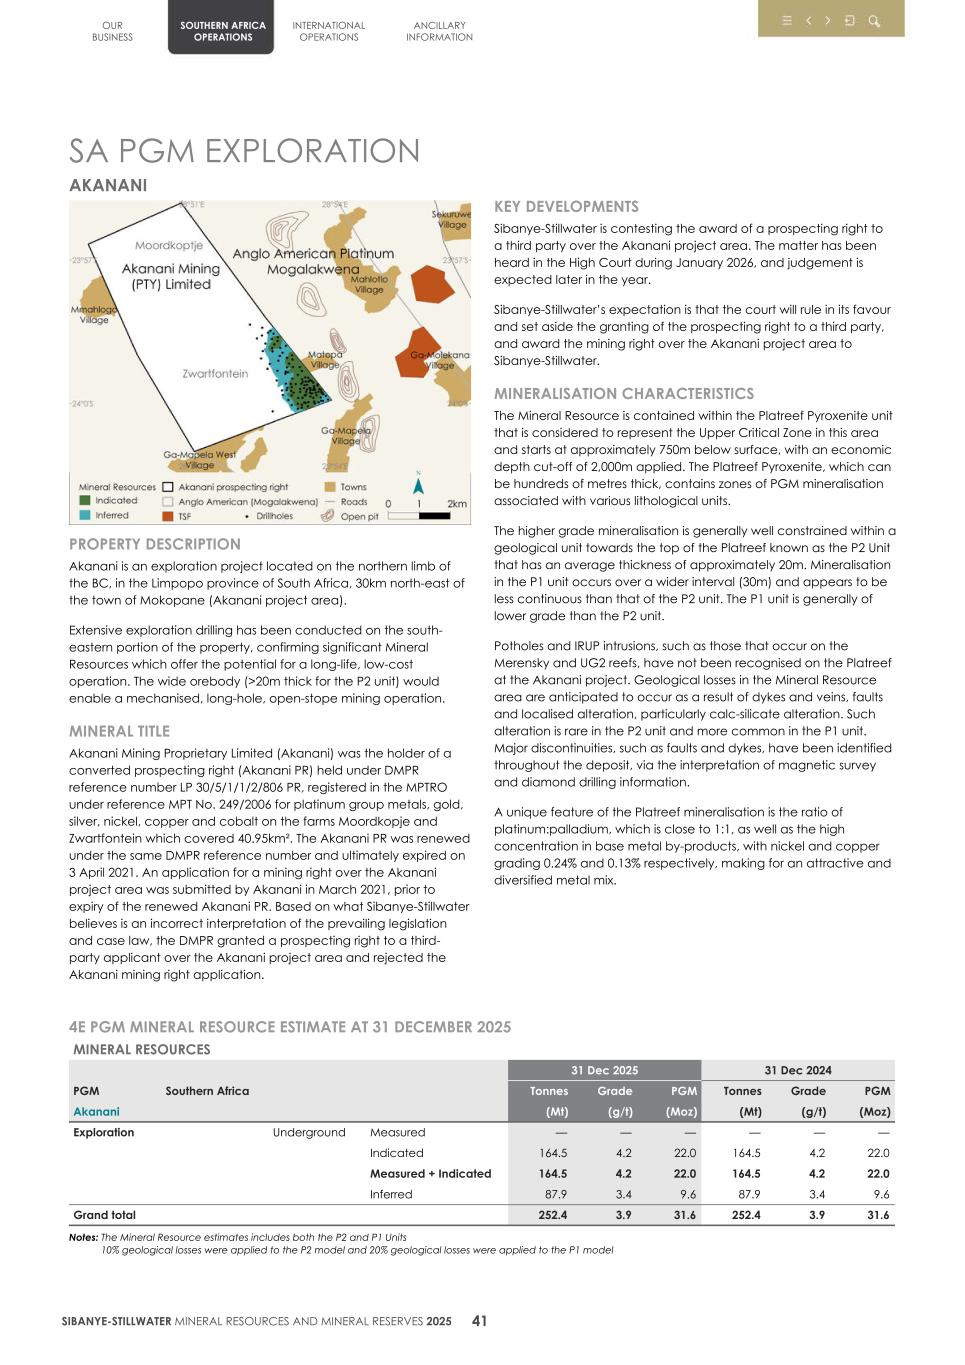
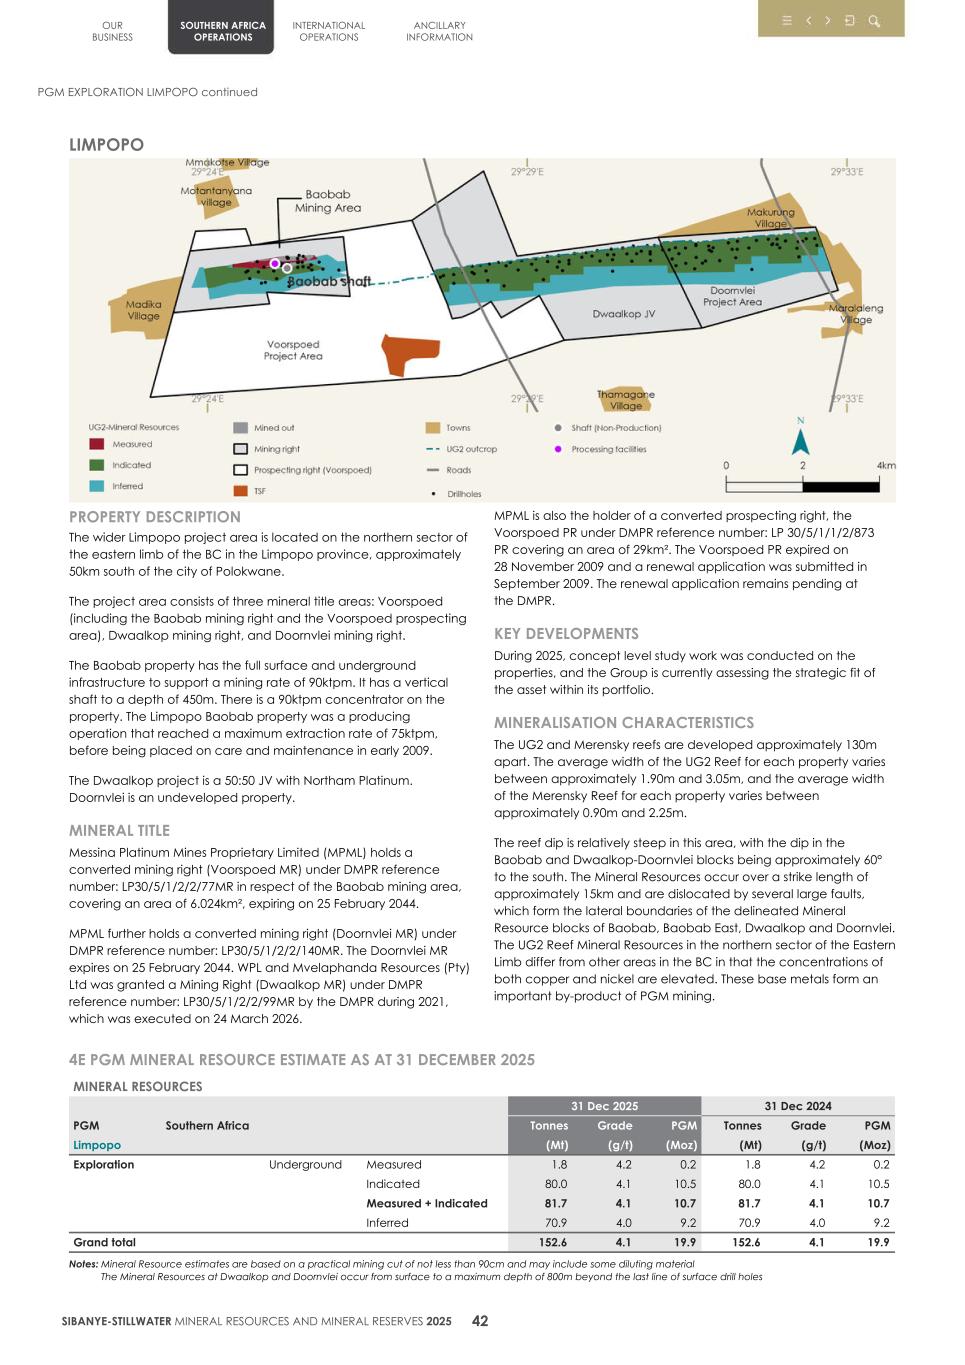
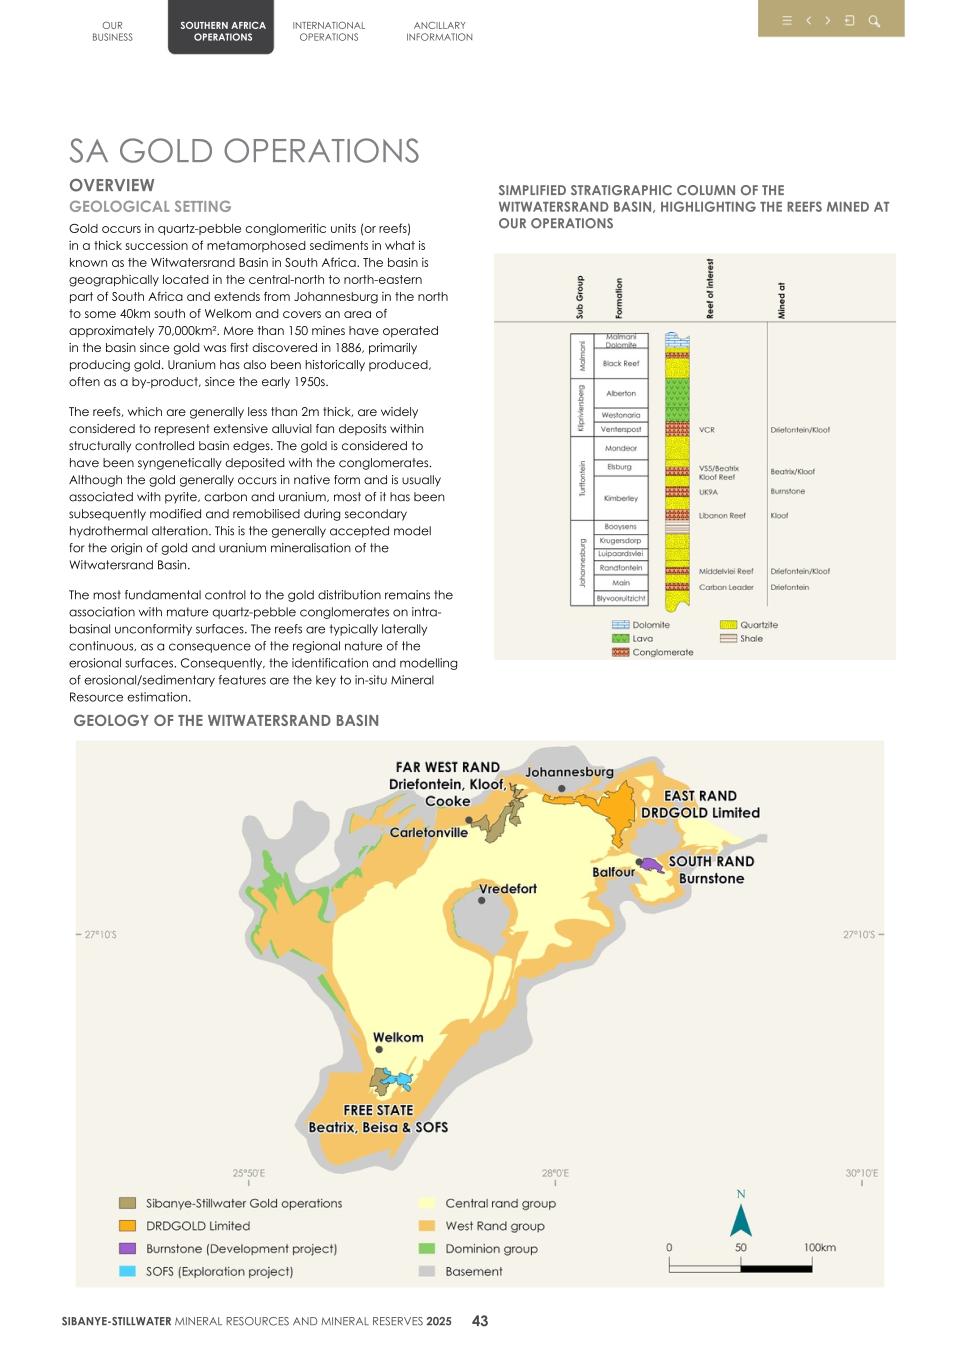
SA GOLD OPERATIONS OVERVIEW GEOLOGICAL SETTING Gold occurs in quartz-pebble conglomeritic units (or reefs) in a thick succession of metamorphosed sediments in what is known as the Witwatersrand Basin in South Africa. The basin is geographically located in the central-north to north-eastern part of South Africa and extends from Johannesburg in the north to some 40km south of Welkom and covers an area of approximately 70,000km². More than 150 mines have operated in the basin since gold was first discovered in 1886, primarily producing gold. Uranium has also been historically produced, often as a by-product, since the early 1950s. The reefs, which are generally less than 2m thick, are widely considered to represent extensive alluvial fan deposits within structurally controlled basin edges. The gold is considered to have been syngenetically deposited with the conglomerates. Although the gold generally occurs in native form and is usually associated with pyrite, carbon and uranium, most of it has been subsequently modified and remobilised during secondary hydrothermal alteration. This is the generally accepted model for the origin of gold and uranium mineralisation of the Witwatersrand Basin. The most fundamental control to the gold distribution remains the association with mature quartz-pebble conglomerates on intra- basinal unconformity surfaces. The reefs are typically laterally continuous, as a consequence of the regional nature of the erosional surfaces. Consequently, the identification and modelling of erosional/sedimentary features are the key to in-situ Mineral Resource estimation. SIMPLIFIED STRATIGRAPHIC COLUMN OF THE WITWATERSRAND BASIN, HIGHLIGHTING THE REEFS MINED AT OUR OPERATIONS GEOLOGY OF THE WITWATERSRAND BASIN OUR BUSINESS SOUTHERN AFRICA OPERATIONS INTERNATIONAL OPERATIONS ANCILLARY INFORMATION SIBANYE-STILLWATER MINERAL RESOURCES AND MINERAL RESERVES 2025 43
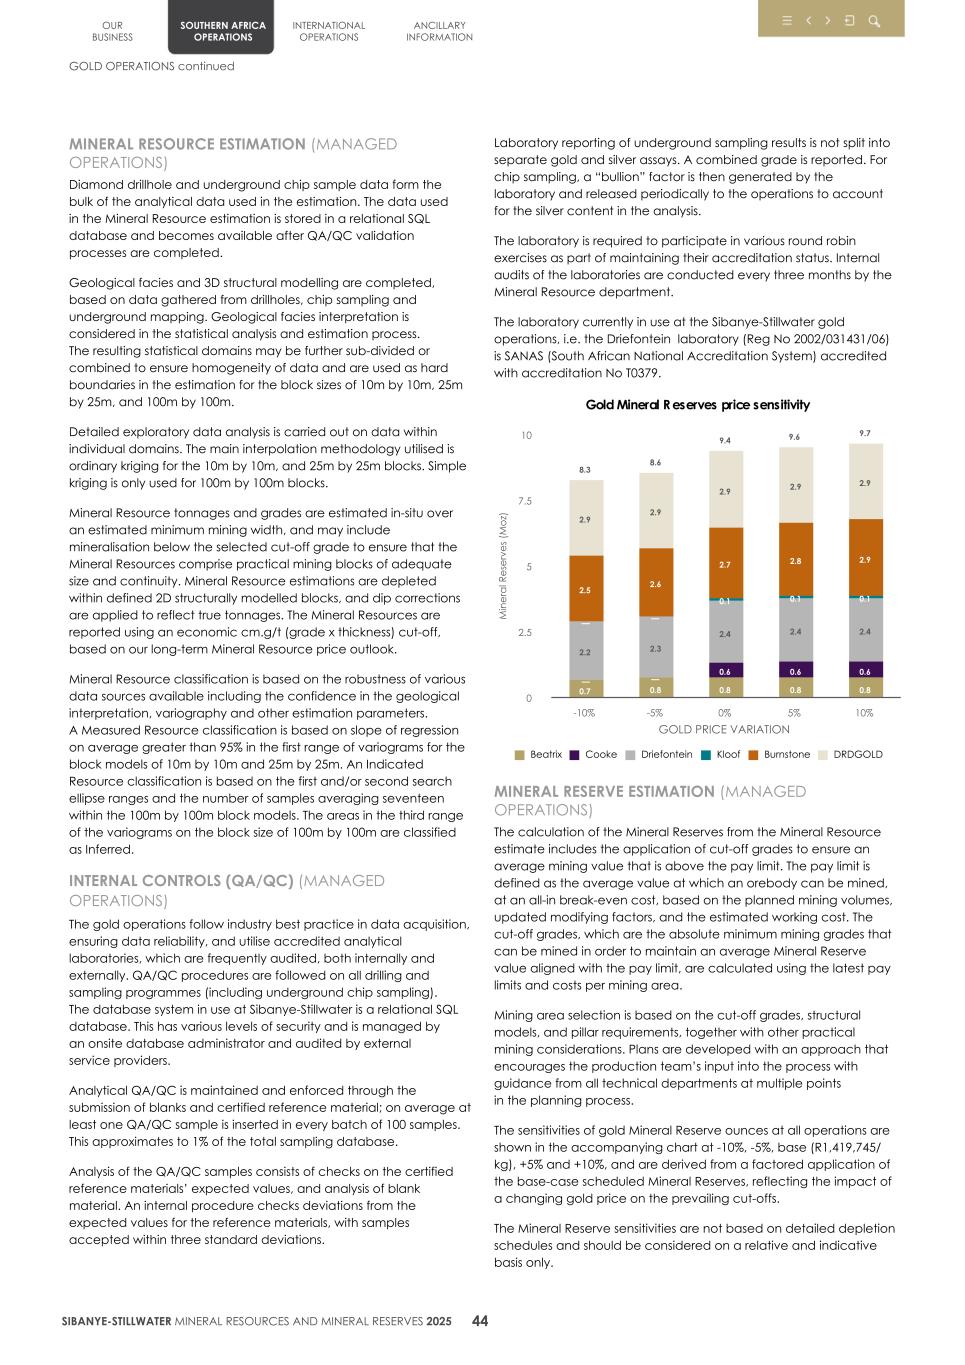
MINERAL RESOURCE ESTIMATION (MANAGED OPERATIONS) Diamond drillhole and underground chip sample data form the bulk of the analytical data used in the estimation. The data used in the Mineral Resource estimation is stored in a relational SQL database and becomes available after QA/QC validation processes are completed. Geological facies and 3D structural modelling are completed, based on data gathered from drillholes, chip sampling and underground mapping. Geological facies interpretation is considered in the statistical analysis and estimation process. The resulting statistical domains may be further sub-divided or combined to ensure homogeneity of data and are used as hard boundaries in the estimation for the block sizes of 10m by 10m, 25m by 25m, and 100m by 100m. Detailed exploratory data analysis is carried out on data within individual domains. The main interpolation methodology utilised is ordinary kriging for the 10m by 10m, and 25m by 25m blocks. Simple kriging is only used for 100m by 100m blocks. Mineral Resource tonnages and grades are estimated in-situ over an estimated minimum mining width, and may include mineralisation below the selected cut-off grade to ensure that the Mineral Resources comprise practical mining blocks of adequate size and continuity. Mineral Resource estimations are depleted within defined 2D structurally modelled blocks, and dip corrections are applied to reflect true tonnages. The Mineral Resources are reported using an economic cm.g/t (grade x thickness) cut-off, based on our long-term Mineral Resource price outlook. Mineral Resource classification is based on the robustness of various data sources available including the confidence in the geological interpretation, variography and other estimation parameters. A Measured Resource classification is based on slope of regression on average greater than 95% in the first range of variograms for the block models of 10m by 10m and 25m by 25m. An Indicated Resource classification is based on the first and/or second search ellipse ranges and the number of samples averaging seventeen within the 100m by 100m block models. The areas in the third range of the variograms on the block size of 100m by 100m are classified as Inferred. INTERNAL CONTROLS (QA/QC) (MANAGED OPERATIONS) The gold operations follow industry best practice in data acquisition, ensuring data reliability, and utilise accredited analytical laboratories, which are frequently audited, both internally and externally. QA/QC procedures are followed on all drilling and sampling programmes (including underground chip sampling). The database system in use at Sibanye-Stillwater is a relational SQL database. This has various levels of security and is managed by an onsite database administrator and audited by external service providers. Analytical QA/QC is maintained and enforced through the submission of blanks and certified reference material; on average at least one QA/QC sample is inserted in every batch of 100 samples. This approximates to 1% of the total sampling database. Analysis of the QA/QC samples consists of checks on the certified reference materials’ expected values, and analysis of blank material. An internal procedure checks deviations from the expected values for the reference materials, with samples accepted within three standard deviations. Laboratory reporting of underground sampling results is not split into separate gold and silver assays. A combined grade is reported. For chip sampling, a “bullion” factor is then generated by the laboratory and released periodically to the operations to account for the silver content in the analysis. The laboratory is required to participate in various round robin exercises as part of maintaining their accreditation status. Internal audits of the laboratories are conducted every three months by the Mineral Resource department. The laboratory currently in use at the Sibanye-Stillwater gold operations, i.e. the Driefontein laboratory (Reg No 2002/031431/06) is SANAS (South African National Accreditation System) accredited with accreditation No T0379. GOLD PRICE VARIATION M in e ra l R e se rv e s (M o z) Gold Mineral R eserves price sensitivity 8.3 8.6 9.4 9.6 9.7 0.7 0.8 0.8 0.8 0.8 — — 0.6 0.6 0.6 2.2 2.3 2.4 2.4 2.4 — — 0.1 0.1 0.1 2.5 2.6 2.7 2.8 2.9 2.9 2.9 2.9 2.9 2.9 Beatrix Cooke Driefontein Kloof Burnstone DRDGOLD -10% -5% 0% 5% 10% 0 2.5 5 7.5 10 MINERAL RESERVE ESTIMATION (MANAGED OPERATIONS) The calculation of the Mineral Reserves from the Mineral Resource estimate includes the application of cut-off grades to ensure an average mining value that is above the pay limit. The pay limit is defined as the average value at which an orebody can be mined, at an all-in break-even cost, based on the planned mining volumes, updated modifying factors, and the estimated working cost. The cut-off grades, which are the absolute minimum mining grades that can be mined in order to maintain an average Mineral Reserve value aligned with the pay limit, are calculated using the latest pay limits and costs per mining area. Mining area selection is based on the cut-off grades, structural models, and pillar requirements, together with other practical mining considerations. Plans are developed with an approach that encourages the production team’s input into the process with guidance from all technical departments at multiple points in the planning process. The sensitivities of gold Mineral Reserve ounces at all operations are shown in the accompanying chart at -10%, -5%, base (R1,419,745/ kg), +5% and +10%, and are derived from a factored application of the base-case scheduled Mineral Reserves, reflecting the impact of a changing gold price on the prevailing cut-offs. The Mineral Reserve sensitivities are not based on detailed depletion schedules and should be considered on a relative and indicative basis only. OUR BUSINESS SOUTHERN AFRICA OPERATIONS INTERNATIONAL OPERATIONS ANCILLARY INFORMATION GOLD OPERATIONS continued SIBANYE-STILLWATER MINERAL RESOURCES AND MINERAL RESERVES 2025 44
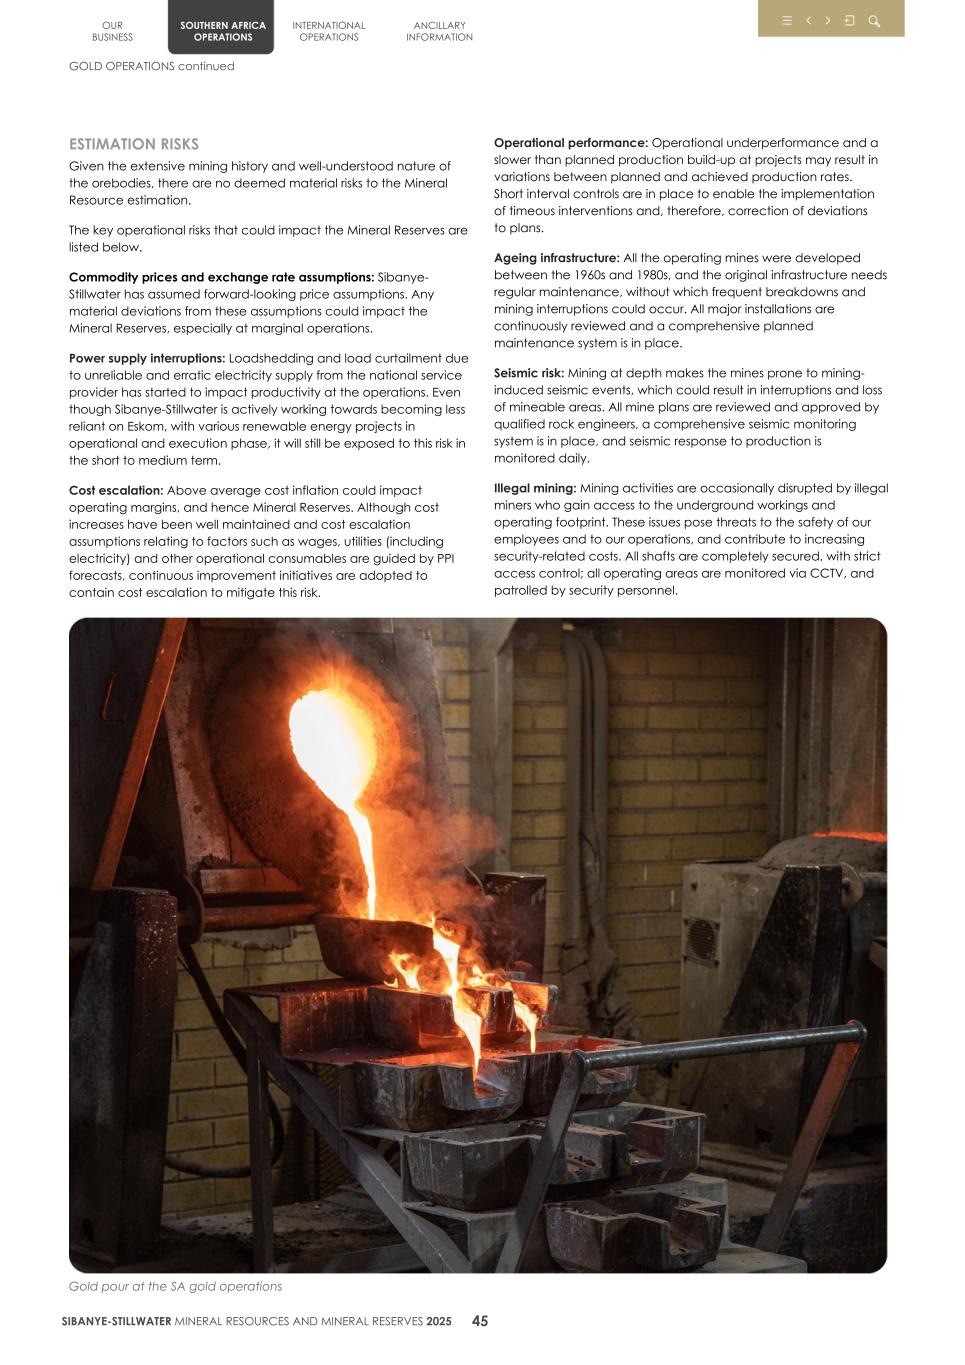
ESTIMATION RISKS Given the extensive mining history and well-understood nature of the orebodies, there are no deemed material risks to the Mineral Resource estimation. The key operational risks that could impact the Mineral Reserves are listed below. Commodity prices and exchange rate assumptions: Sibanye- Stillwater has assumed forward-looking price assumptions. Any material deviations from these assumptions could impact the Mineral Reserves, especially at marginal operations. Power supply interruptions: Loadshedding and load curtailment due to unreliable and erratic electricity supply from the national service provider has started to impact productivity at the operations. Even though Sibanye-Stillwater is actively working towards becoming less reliant on Eskom, with various renewable energy projects in operational and execution phase, it will still be exposed to this risk in the short to medium term. Cost escalation: Above average cost inflation could impact operating margins, and hence Mineral Reserves. Although cost increases have been well maintained and cost escalation assumptions relating to factors such as wages, utilities (including electricity) and other operational consumables are guided by PPI forecasts, continuous improvement initiatives are adopted to contain cost escalation to mitigate this risk. Operational performance: Operational underperformance and a slower than planned production build-up at projects may result in variations between planned and achieved production rates. Short interval controls are in place to enable the implementation of timeous interventions and, therefore, correction of deviations to plans. Ageing infrastructure: All the operating mines were developed between the 1960s and 1980s, and the original infrastructure needs regular maintenance, without which frequent breakdowns and mining interruptions could occur. All major installations are continuously reviewed and a comprehensive planned maintenance system is in place. Seismic risk: Mining at depth makes the mines prone to mining- induced seismic events, which could result in interruptions and loss of mineable areas. All mine plans are reviewed and approved by qualified rock engineers, a comprehensive seismic monitoring system is in place, and seismic response to production is monitored daily. Illegal mining: Mining activities are occasionally disrupted by illegal miners who gain access to the underground workings and operating footprint. These issues pose threats to the safety of our employees and to our operations, and contribute to increasing security-related costs. All shafts are completely secured, with strict access control; all operating areas are monitored via CCTV, and patrolled by security personnel. Gold pour at the SA gold operations OUR BUSINESS SOUTHERN AFRICA OPERATIONS INTERNATIONAL OPERATIONS ANCILLARY INFORMATION GOLD OPERATIONS continued SIBANYE-STILLWATER MINERAL RESOURCES AND MINERAL RESERVES 2025 45
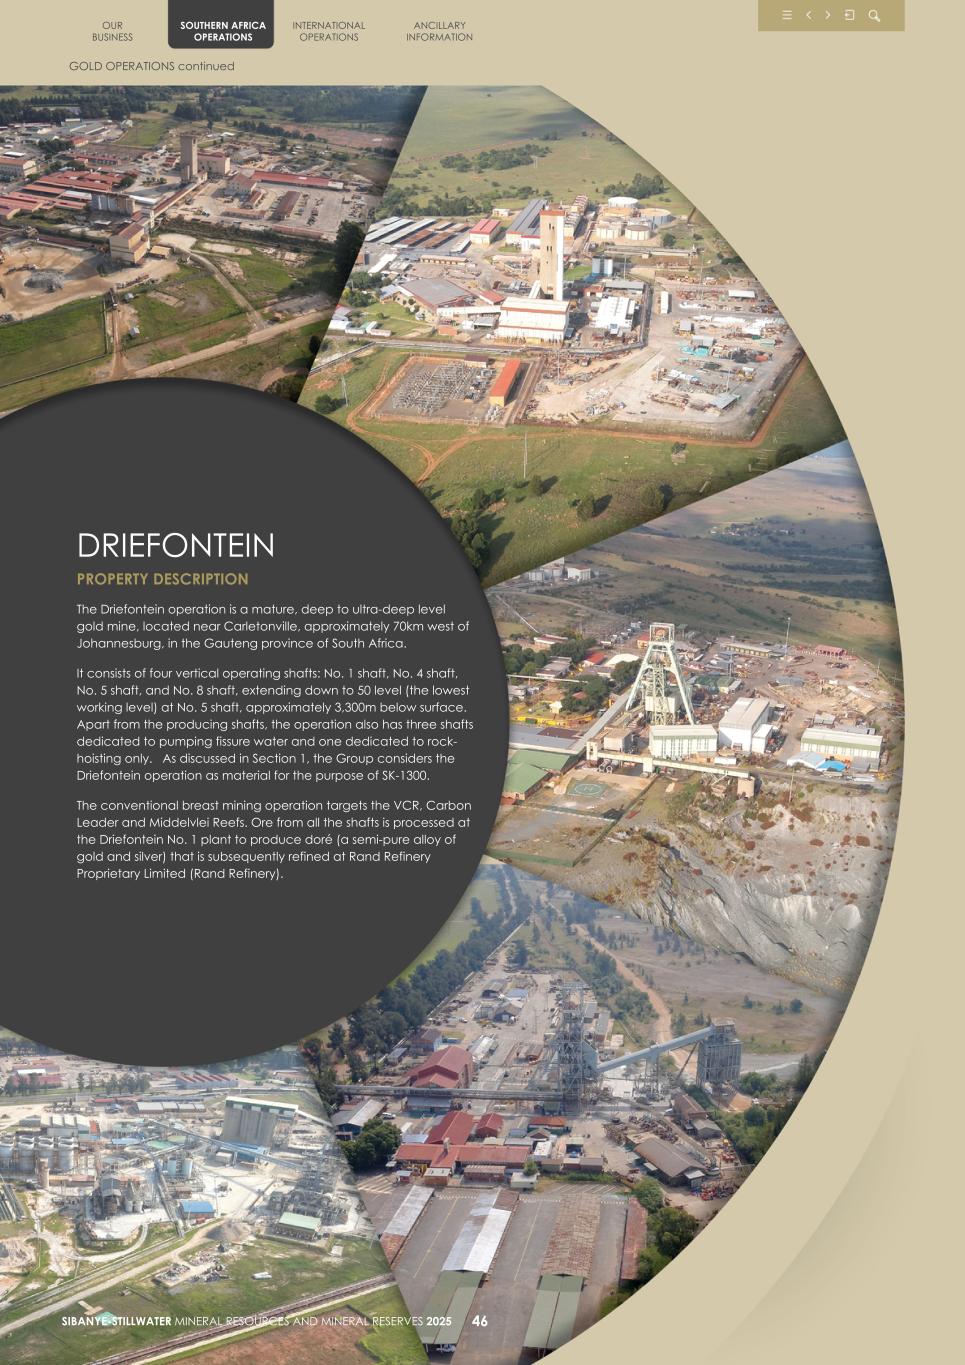
OUR BUSINESS SOUTHERN AFRICA OPERATIONS INTERNATIONAL OPERATIONS ANCILLARY INFORMATION GOLD OPERATIONS continued SIBANYE-STILLWATER MINERAL RESOURCES AND MINERAL RESERVES 2025 46 DRIEFONTEIN PROPERTY DESCRIPTION The Driefontein operation is a mature, deep to ultra-deep level gold mine, located near Carletonville, approximately 70km west of Johannesburg, in the Gauteng province of South Africa. It consists of four vertical operating shafts: No. 1 shaft, No. 4 shaft, No. 5 shaft, and No. 8 shaft, extending down to 50 level (the lowest working level) at No. 5 shaft, approximately 3,300m below surface. Apart from the producing shafts, the operation also has three shafts dedicated to pumping fissure water and one dedicated to rock- hoisting only. As discussed in Section 1, the Group considers the Driefontein operation as material for the purpose of SK-1300. The conventional breast mining operation targets the VCR, Carbon Leader and Middelvlei Reefs. Ore from all the shafts is processed at the Driefontein No. 1 plant to produce doré (a semi-pure alloy of gold and silver) that is subsequently refined at Rand Refinery Proprietary Limited (Rand Refinery).
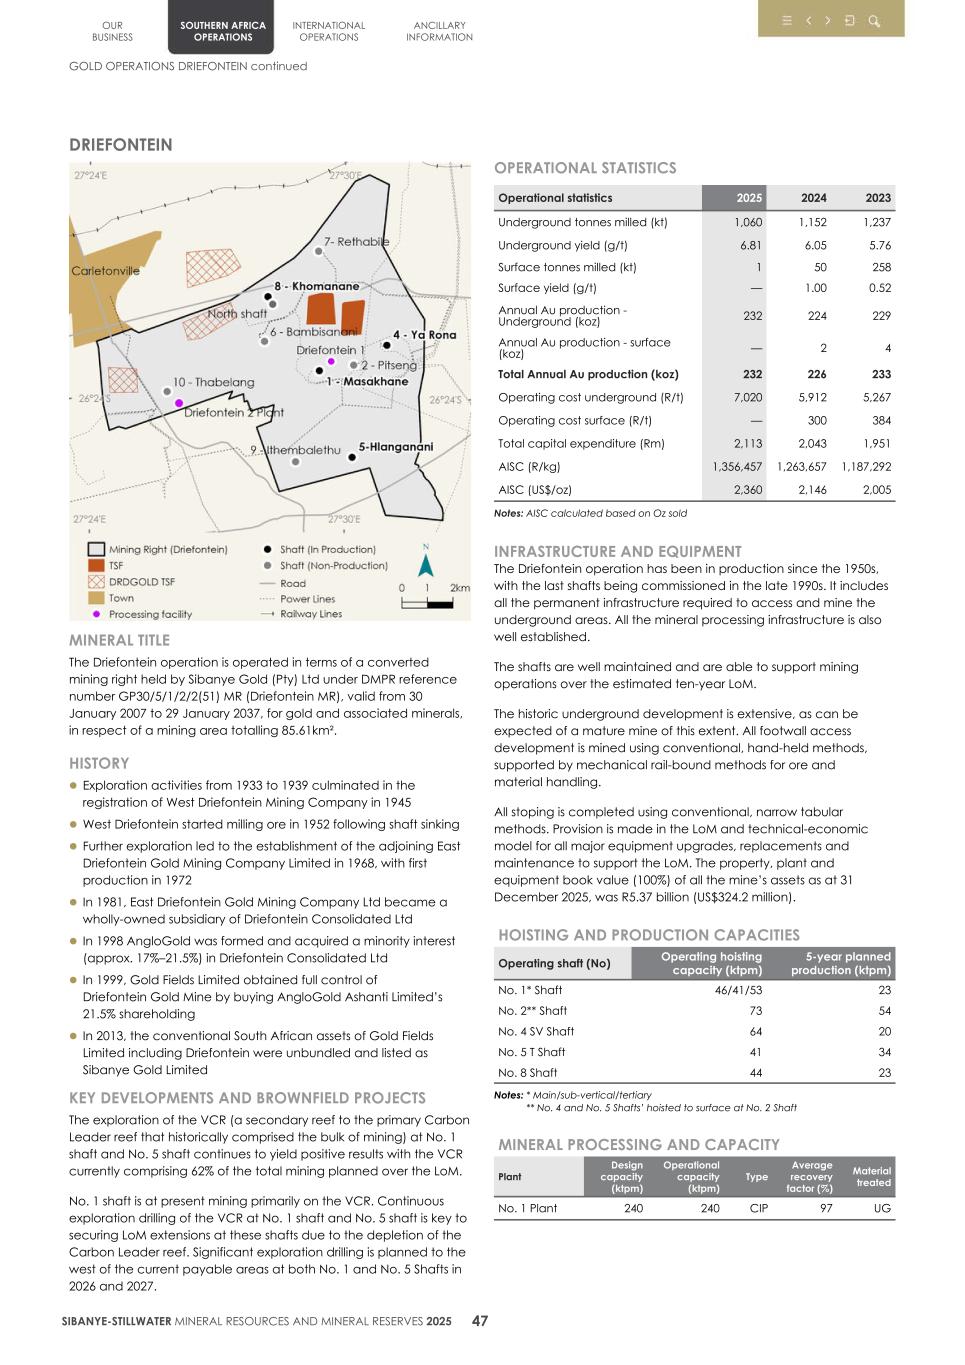
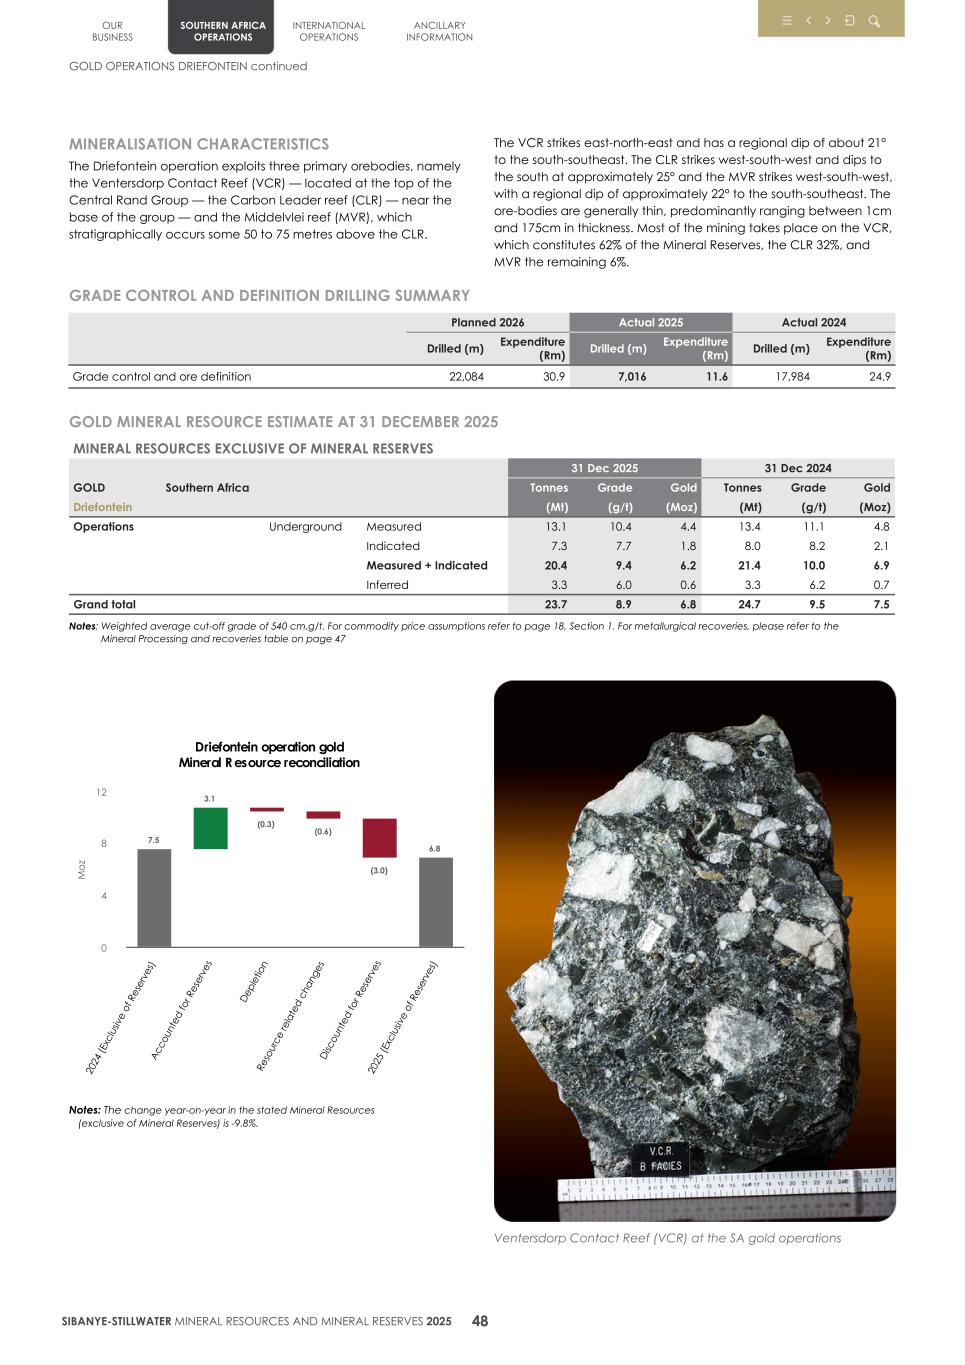
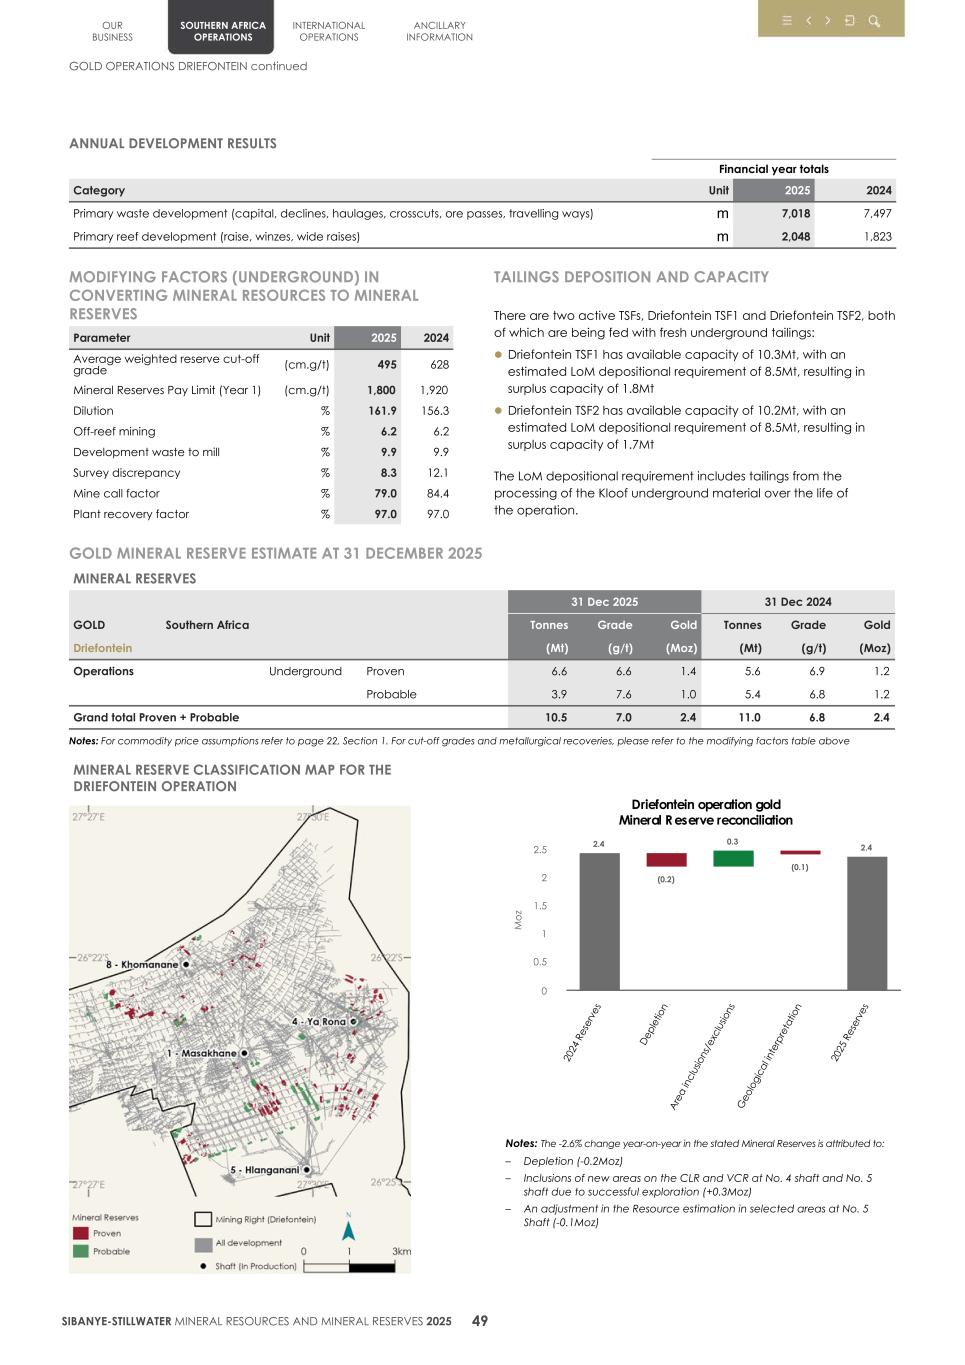
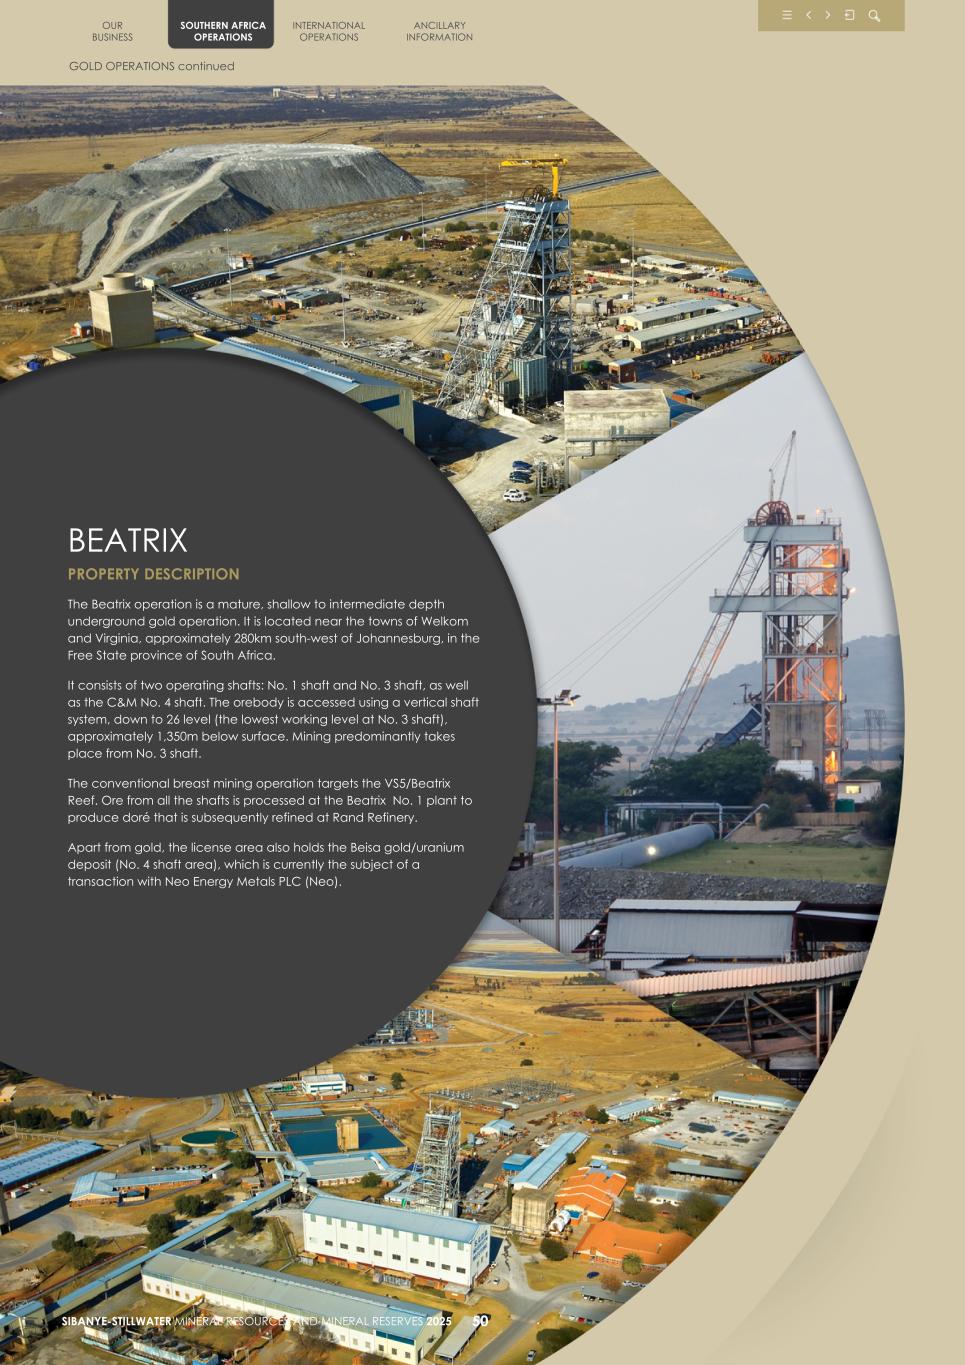
OUR BUSINESS SOUTHERN AFRICA OPERATIONS INTERNATIONAL OPERATIONS ANCILLARY INFORMATION GOLD OPERATIONS continued SIBANYE-STILLWATER MINERAL RESOURCES AND MINERAL RESERVES 2025 50 BEATRIX PROPERTY DESCRIPTION The Beatrix operation is a mature, shallow to intermediate depth underground gold operation. It is located near the towns of Welkom and Virginia, approximately 280km south-west of Johannesburg, in the Free State province of South Africa. It consists of two operating shafts: No. 1 shaft and No. 3 shaft, as well as the C&M No. 4 shaft. The orebody is accessed using a vertical shaft system, down to 26 level (the lowest working level at No. 3 shaft), approximately 1,350m below surface. Mining predominantly takes place from No. 3 shaft. The conventional breast mining operation targets the VS5/Beatrix Reef. Ore from all the shafts is processed at the Beatrix No. 1 plant to produce doré that is subsequently refined at Rand Refinery. Apart from gold, the license area also holds the Beisa gold/uranium deposit (No. 4 shaft area), which is currently the subject of a transaction with Neo Energy Metals PLC (Neo).
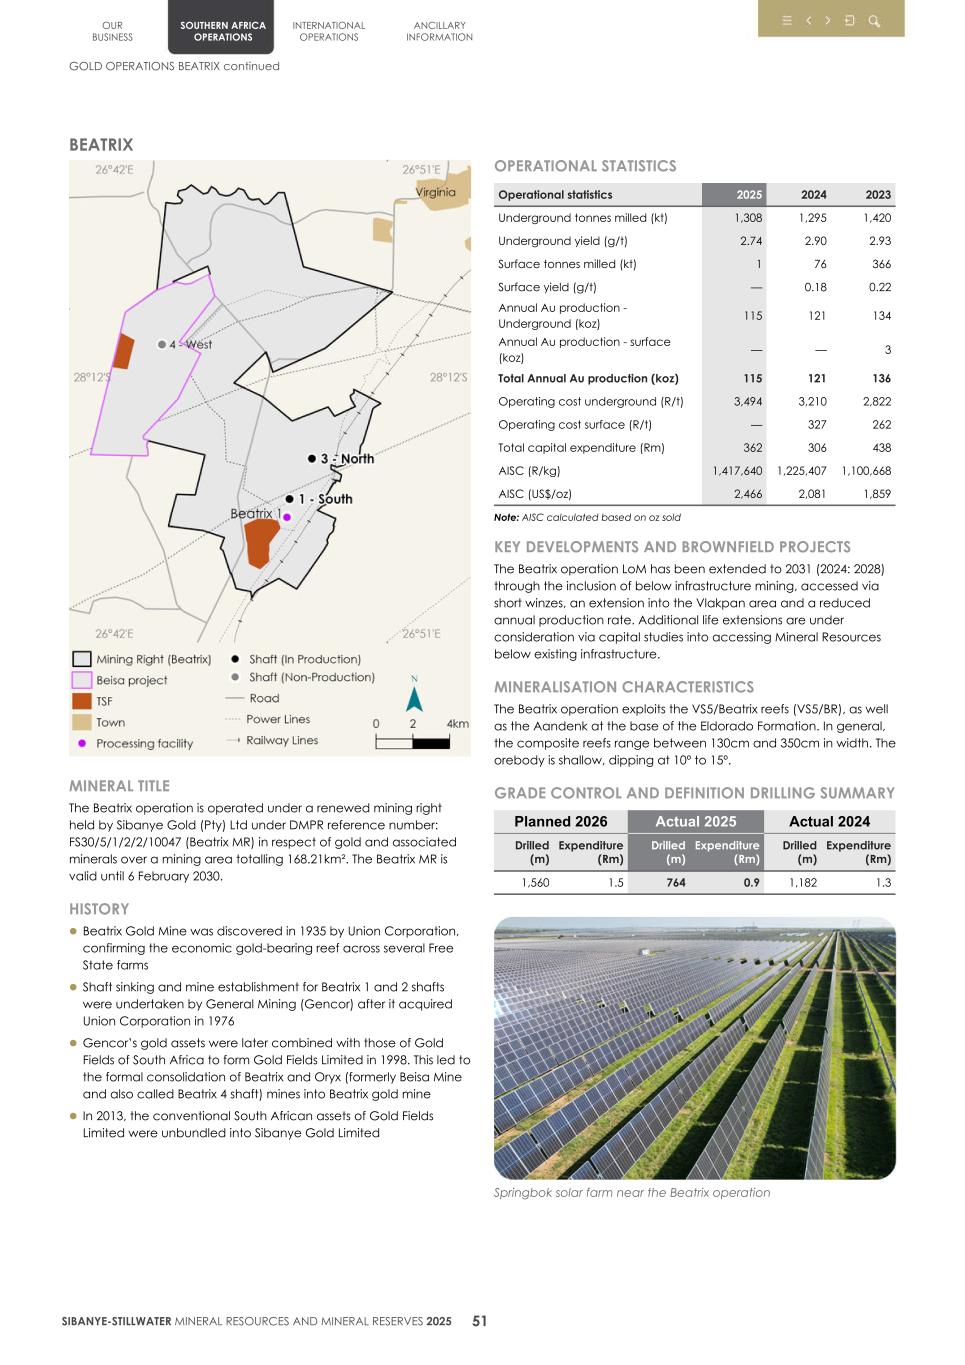
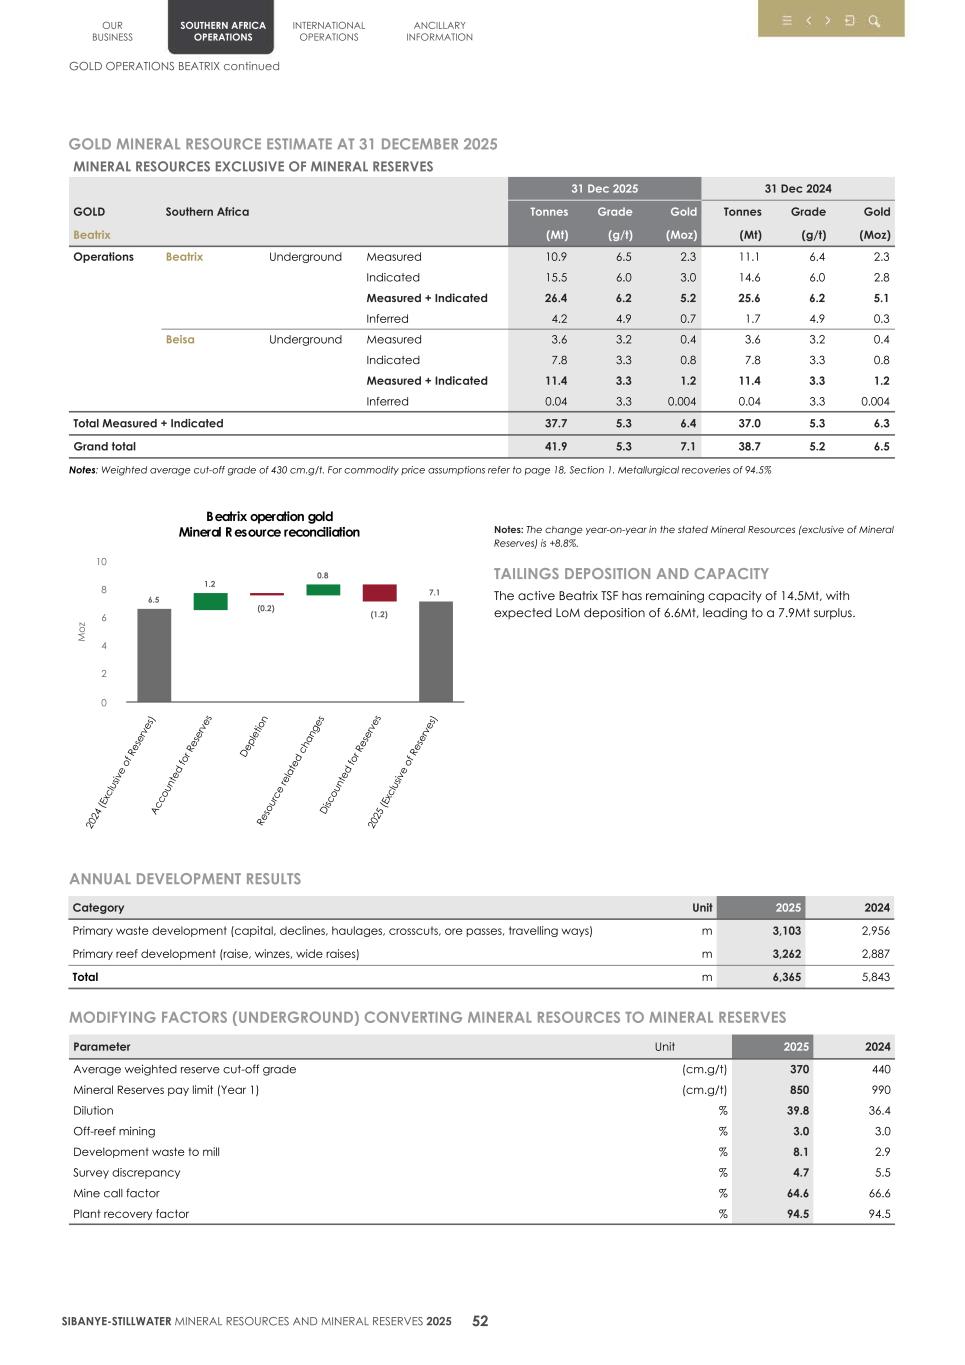
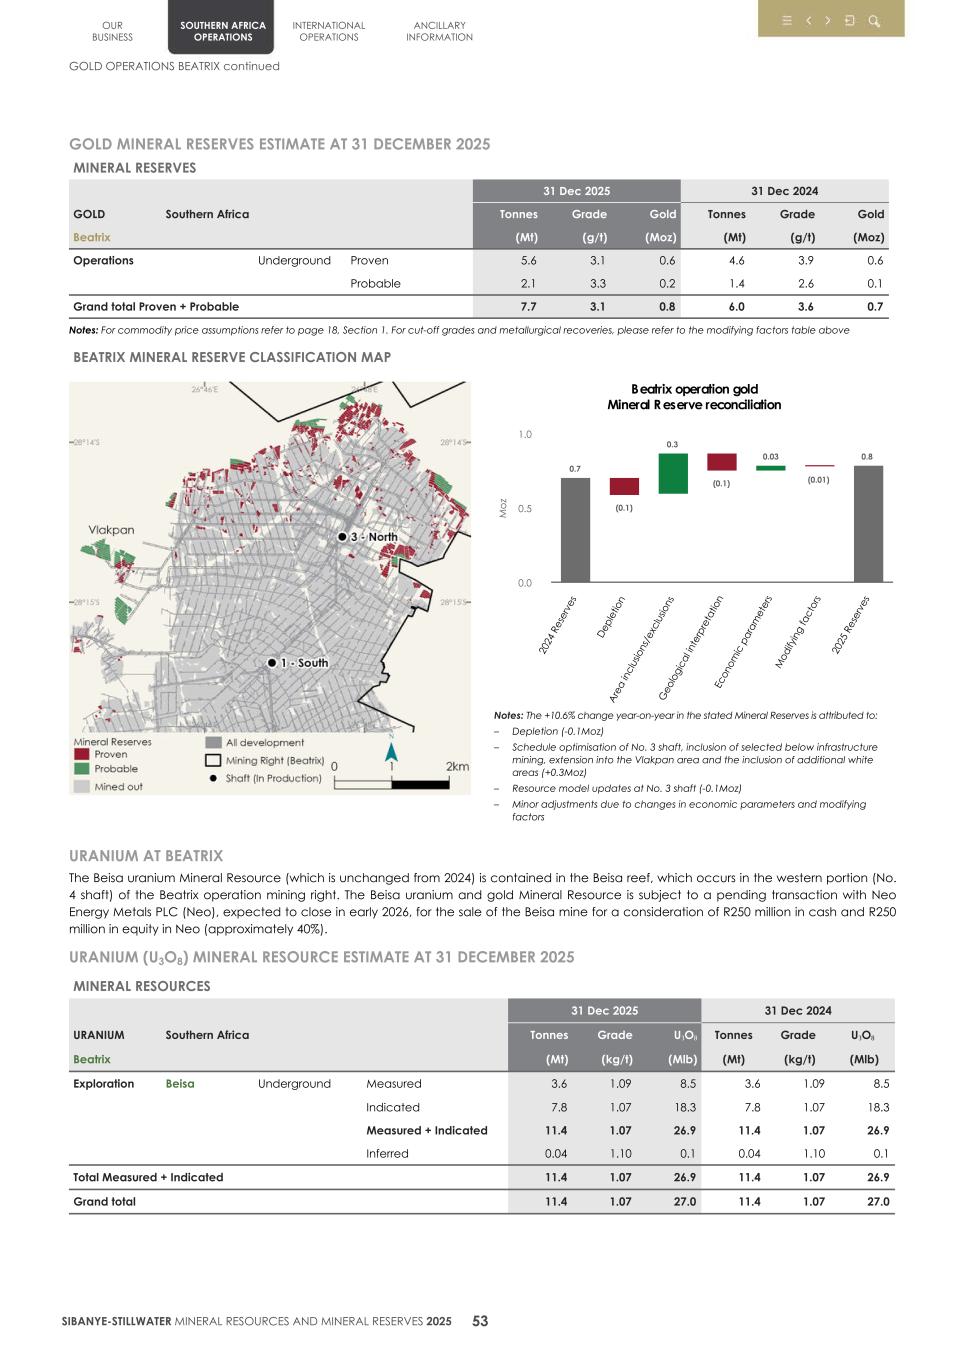
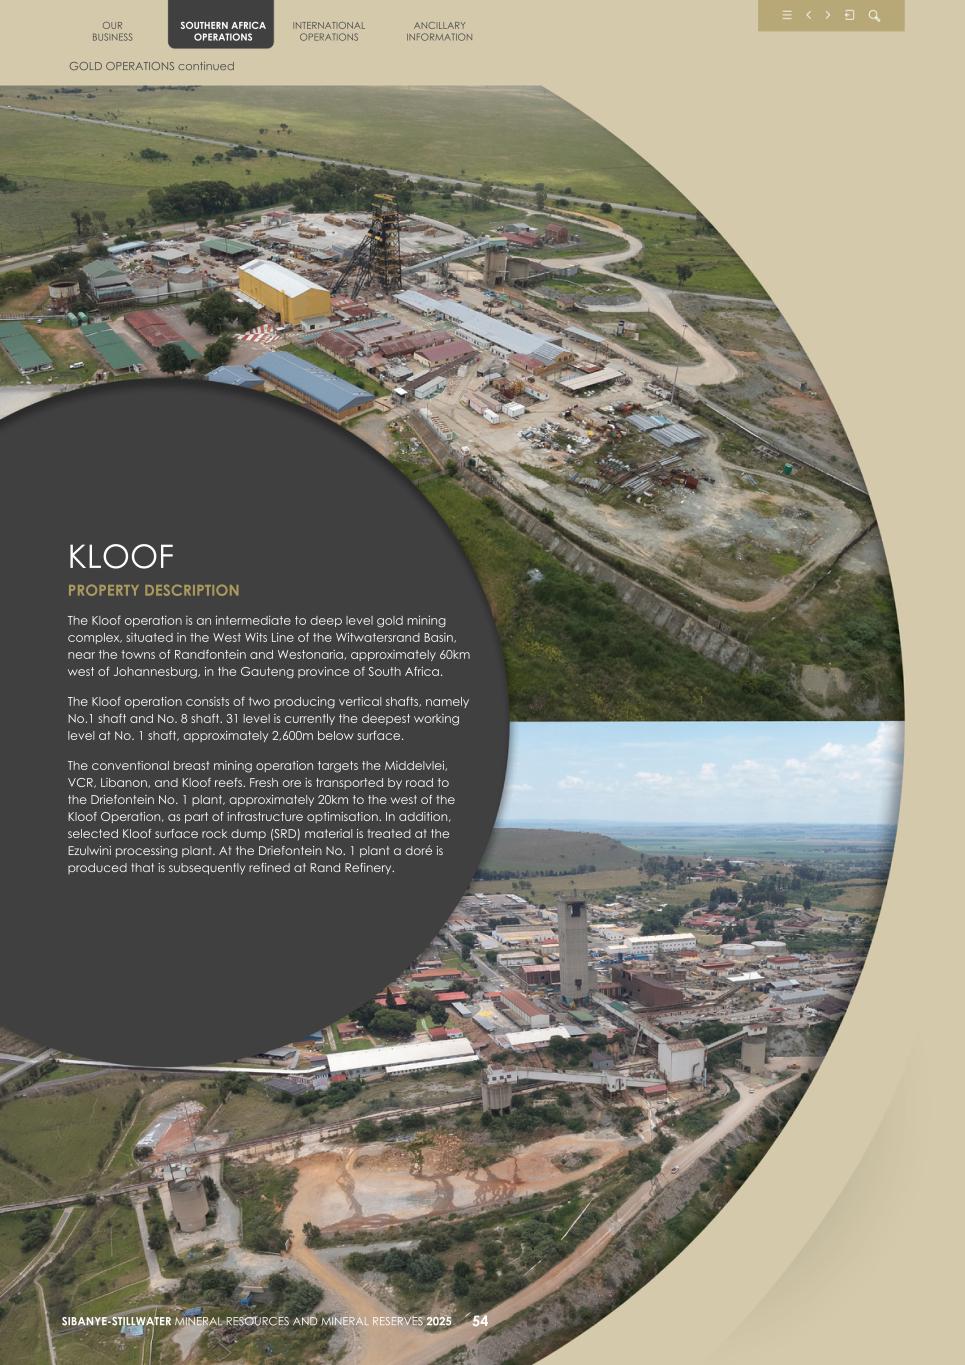
OUR BUSINESS SOUTHERN AFRICA OPERATIONS INTERNATIONAL OPERATIONS ANCILLARY INFORMATION GOLD OPERATIONS continued SIBANYE-STILLWATER MINERAL RESOURCES AND MINERAL RESERVES 2025 54 KLOOF PROPERTY DESCRIPTION The Kloof operation is an intermediate to deep level gold mining complex, situated in the West Wits Line of the Witwatersrand Basin, near the towns of Randfontein and Westonaria, approximately 60km west of Johannesburg, in the Gauteng province of South Africa. The Kloof operation consists of two producing vertical shafts, namely No.1 shaft and No. 8 shaft. 31 level is currently the deepest working level at No. 1 shaft, approximately 2,600m below surface. The conventional breast mining operation targets the Middelvlei, VCR, Libanon, and Kloof reefs. Fresh ore is transported by road to the Driefontein No. 1 plant, approximately 20km to the west of the Kloof Operation, as part of infrastructure optimisation. In addition, selected Kloof surface rock dump (SRD) material is treated at the Ezulwini processing plant. At the Driefontein No. 1 plant a doré is produced that is subsequently refined at Rand Refinery.
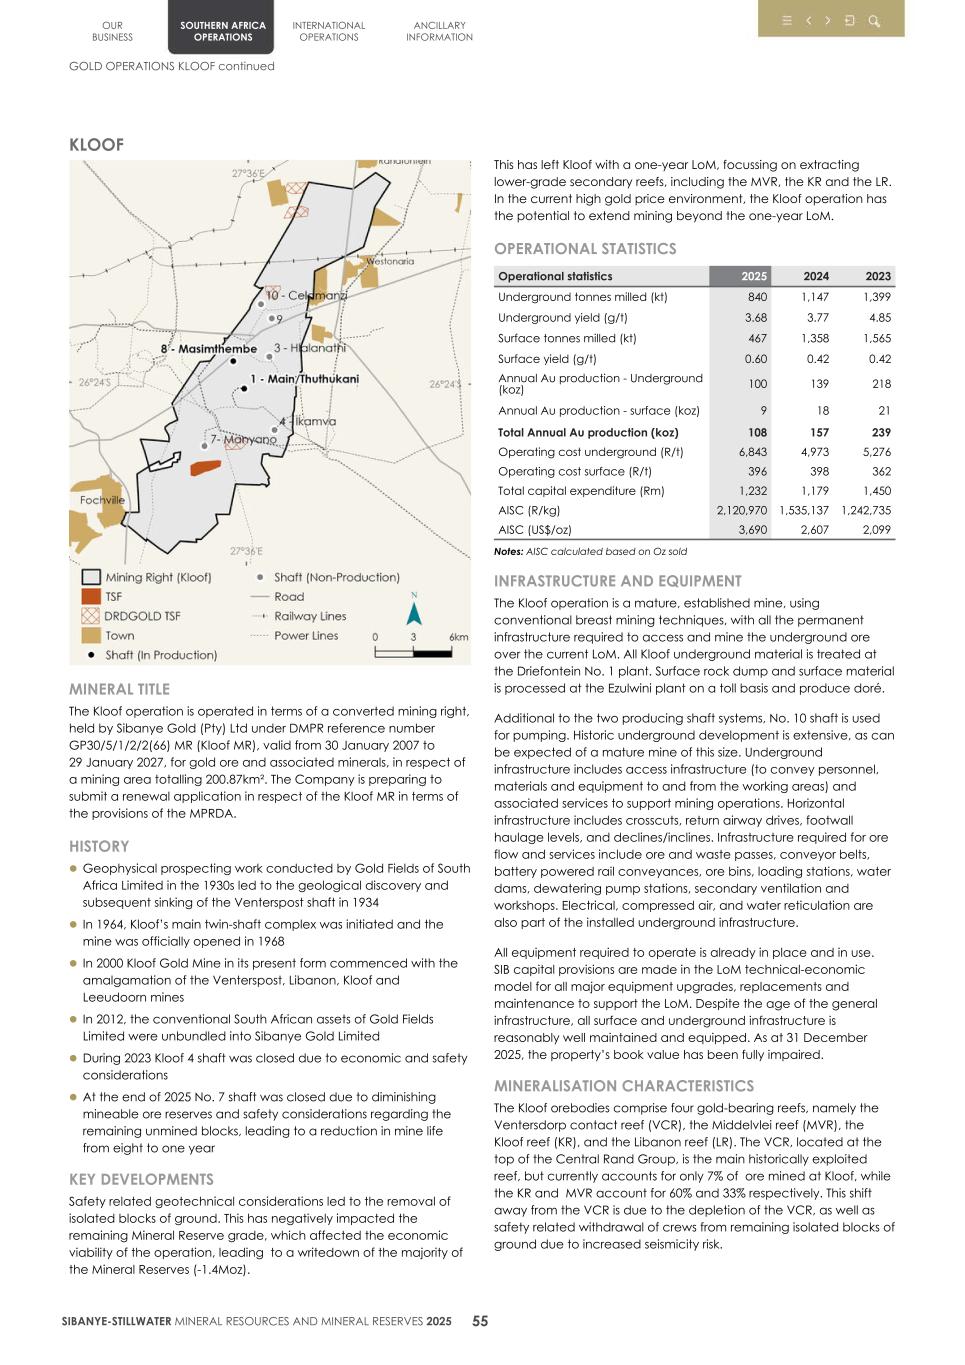
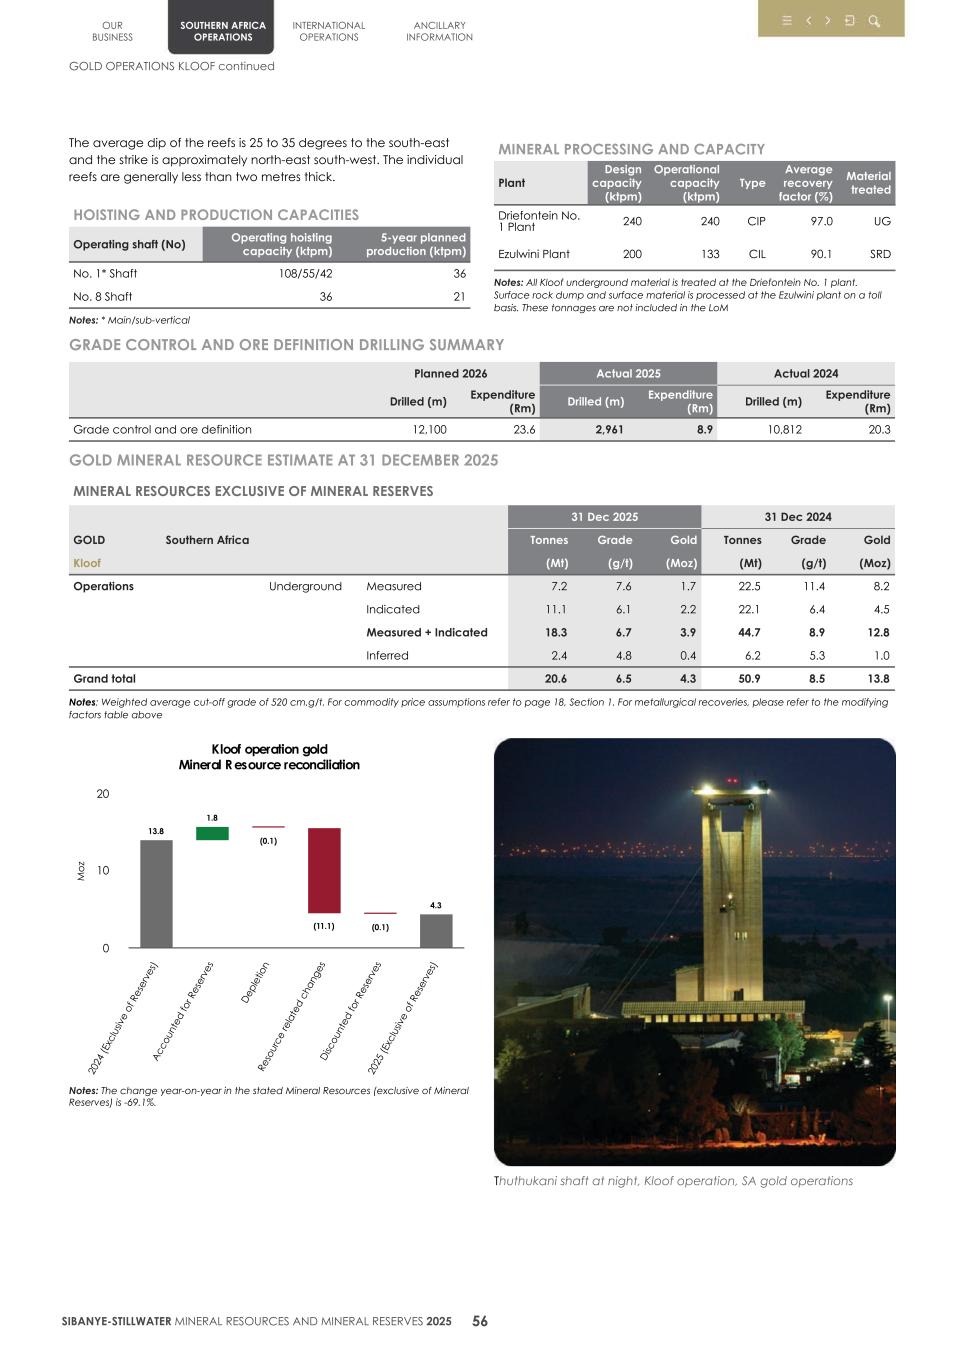
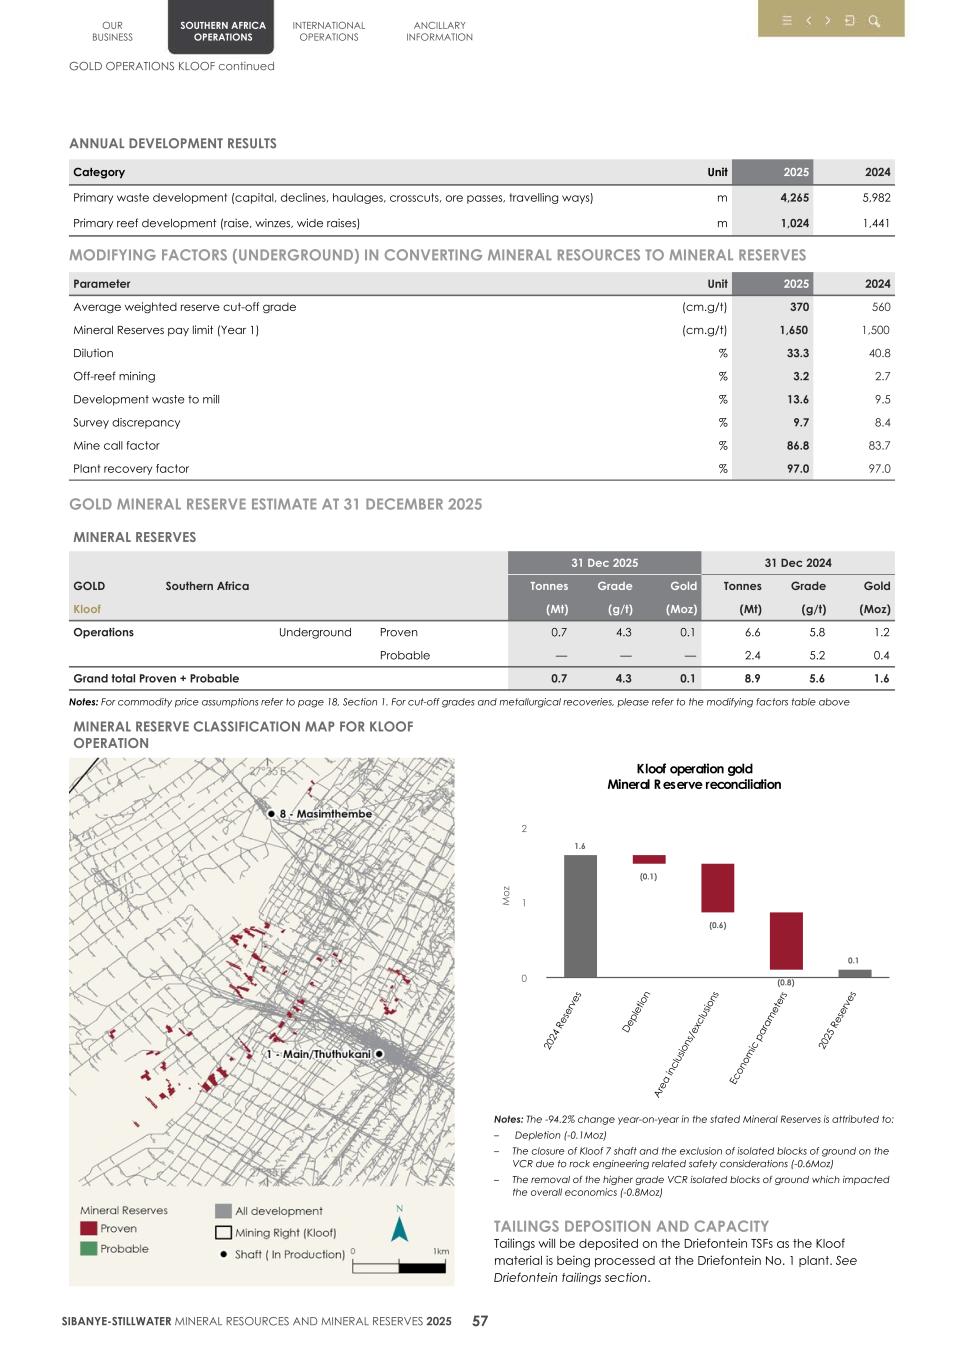
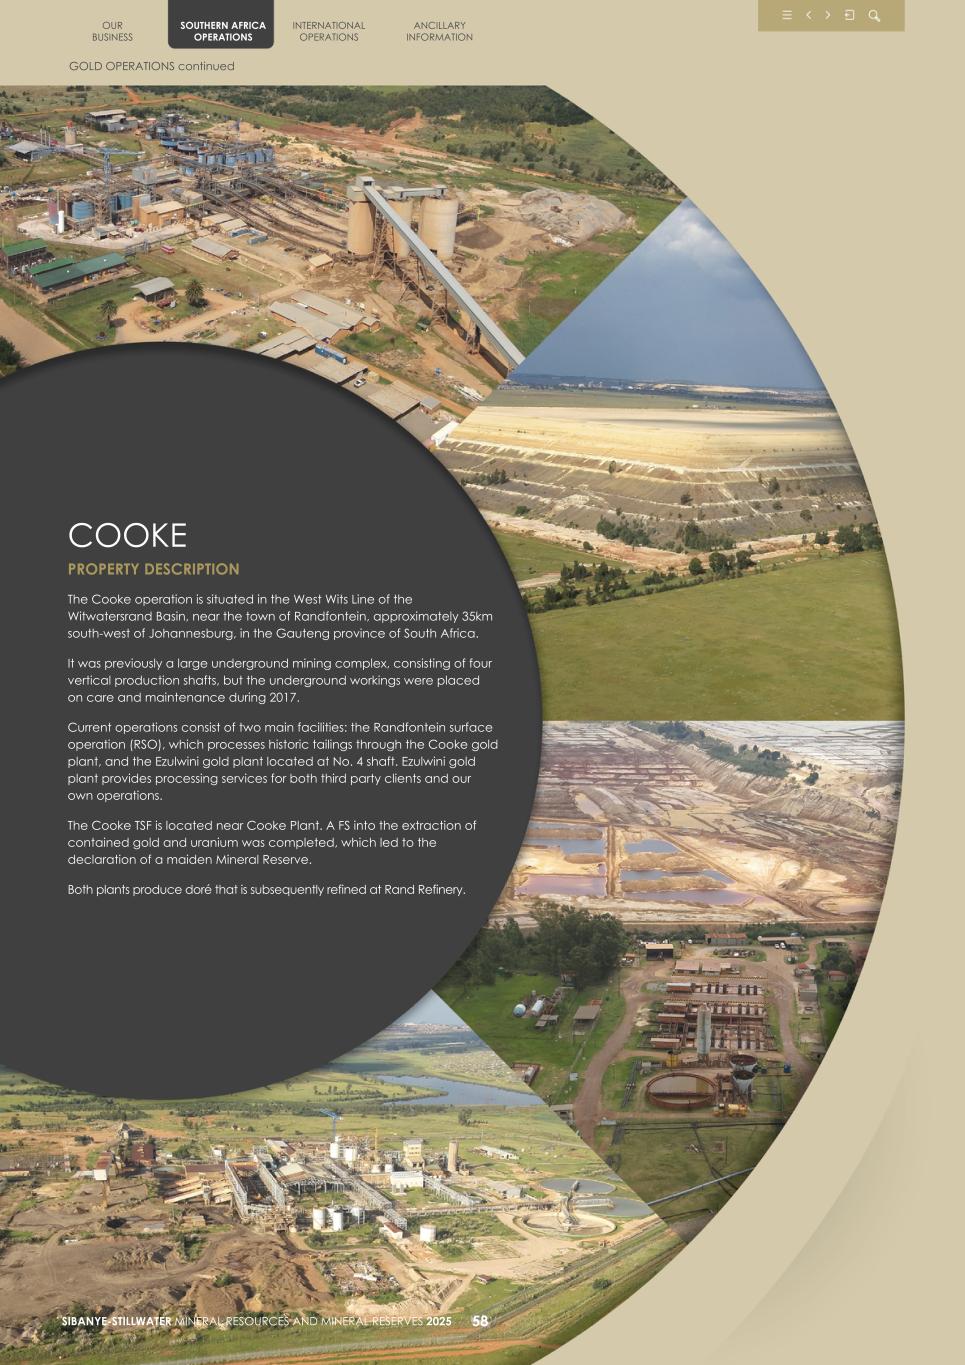
OUR BUSINESS SOUTHERN AFRICA OPERATIONS INTERNATIONAL OPERATIONS ANCILLARY INFORMATION GOLD OPERATIONS continued SIBANYE-STILLWATER MINERAL RESOURCES AND MINERAL RESERVES 2025 58 COOKE PROPERTY DESCRIPTION The Cooke operation is situated in the West Wits Line of the Witwatersrand Basin, near the town of Randfontein, approximately 35km south-west of Johannesburg, in the Gauteng province of South Africa. It was previously a large underground mining complex, consisting of four vertical production shafts, but the underground workings were placed on care and maintenance during 2017. Current operations consist of two main facilities: the Randfontein surface operation (RSO), which processes historic tailings through the Cooke gold plant, and the Ezulwini gold plant located at No. 4 shaft. Ezulwini gold plant provides processing services for both third party clients and our own operations. The Cooke TSF is located near Cooke Plant. A FS into the extraction of contained gold and uranium was completed, which led to the declaration of a maiden Mineral Reserve. Both plants produce doré that is subsequently refined at Rand Refinery.
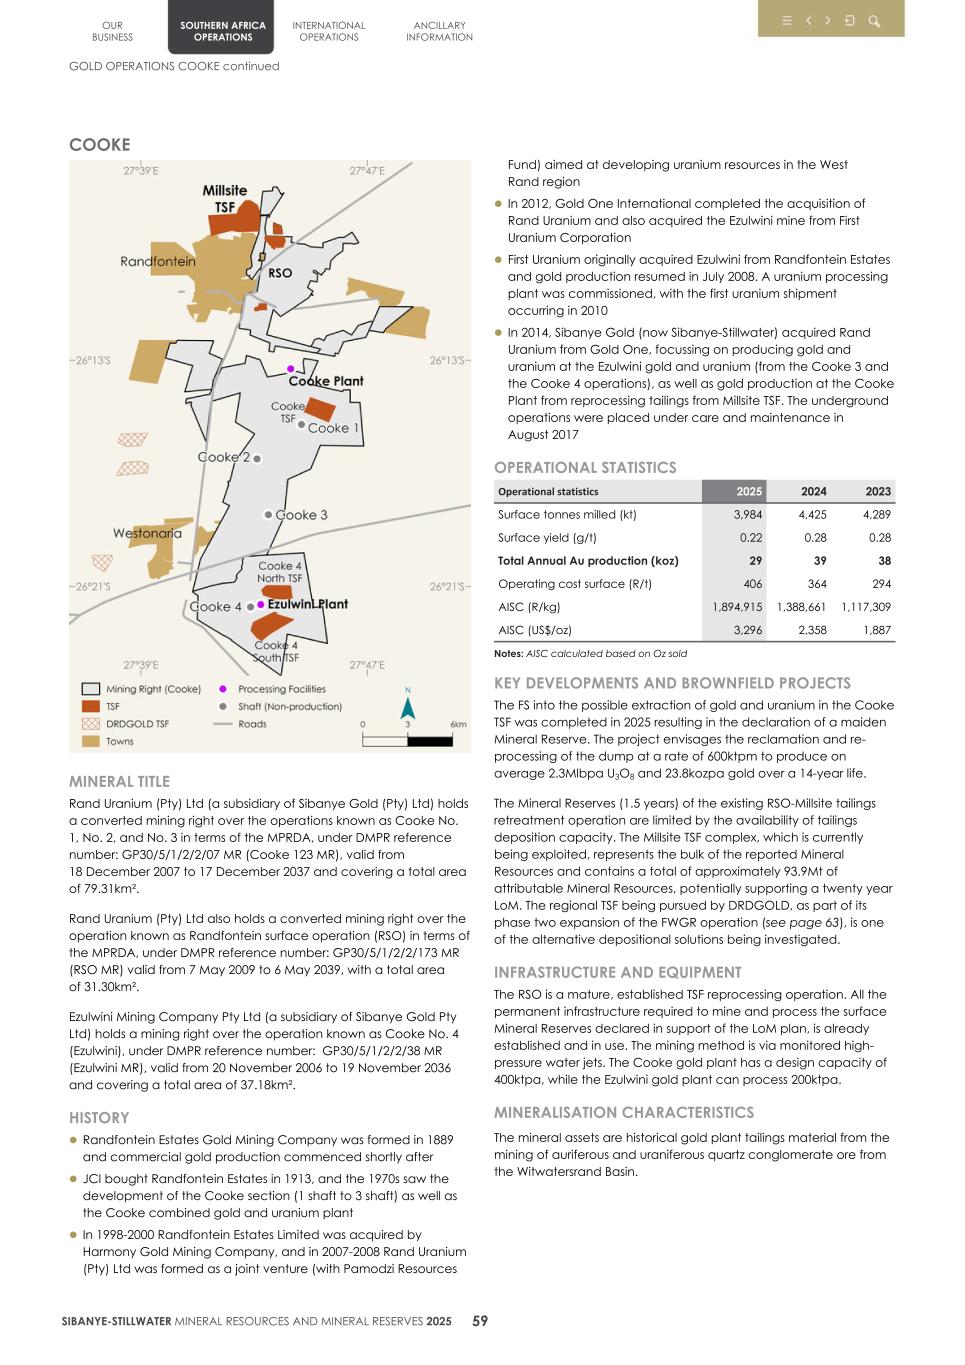
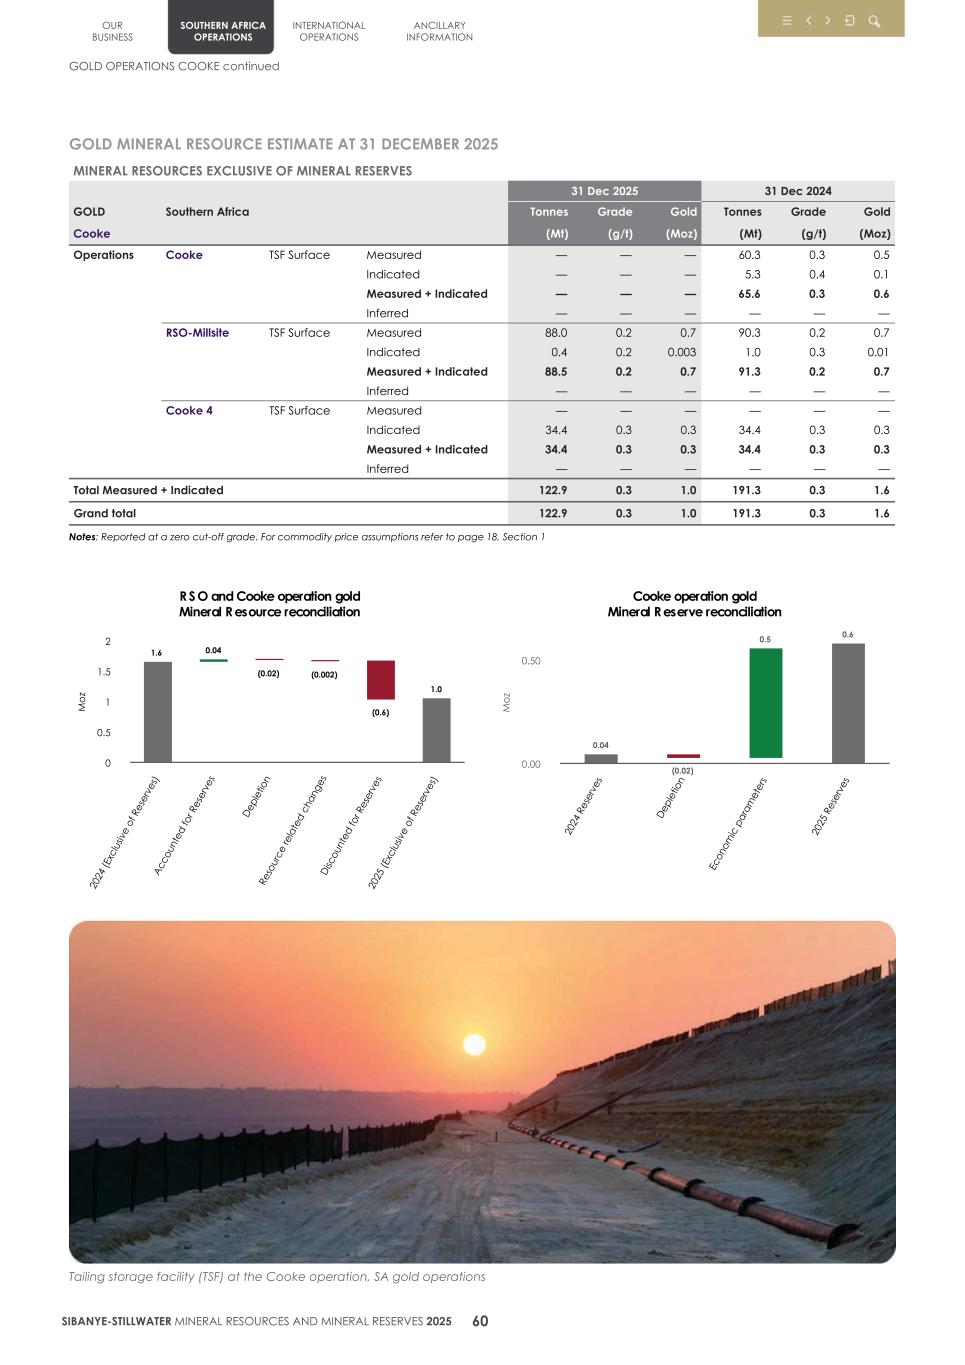
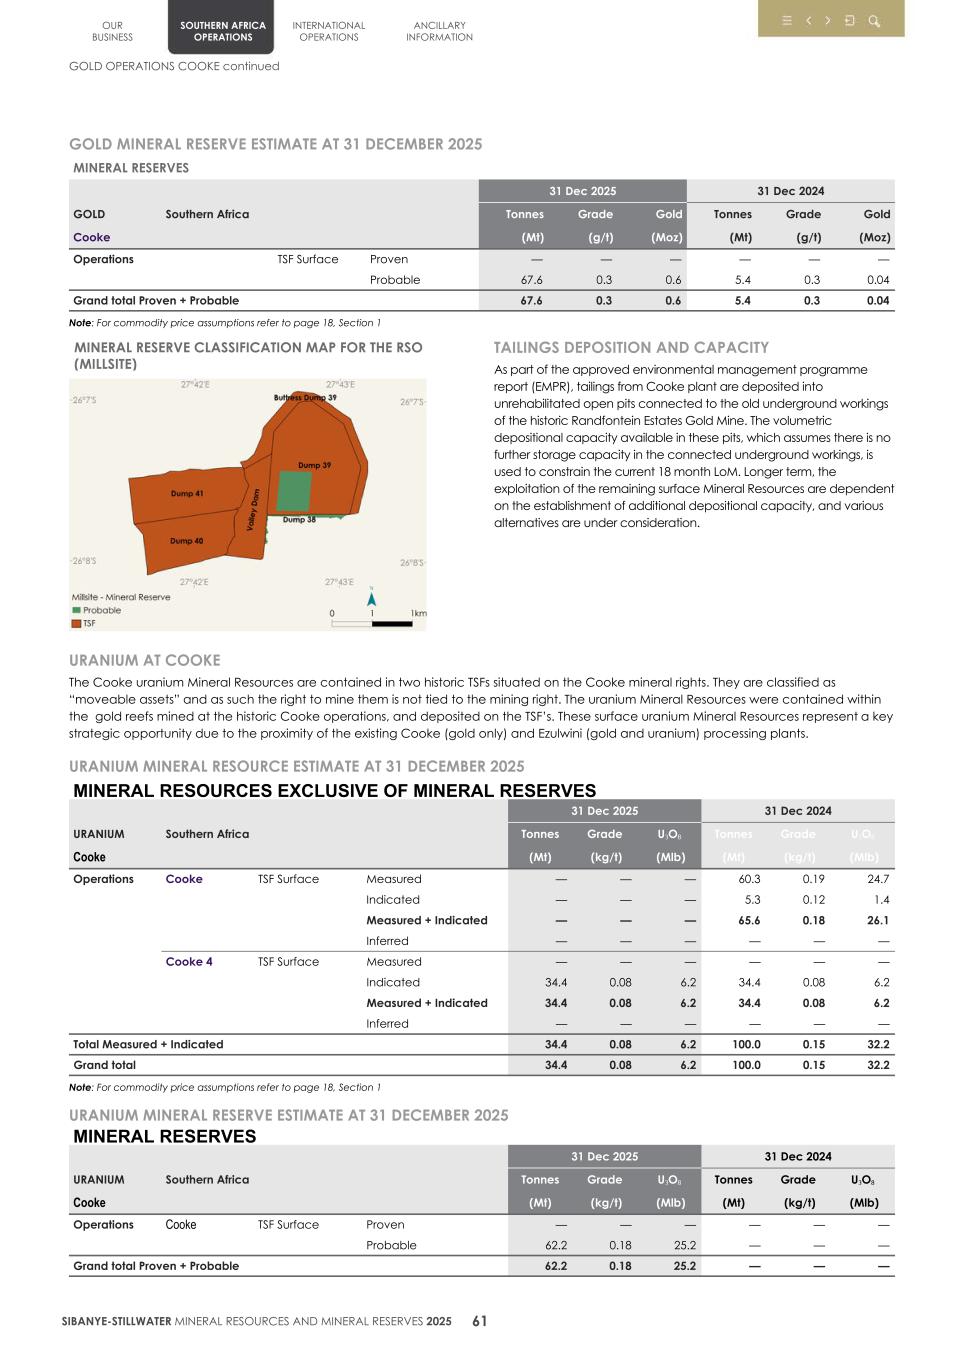
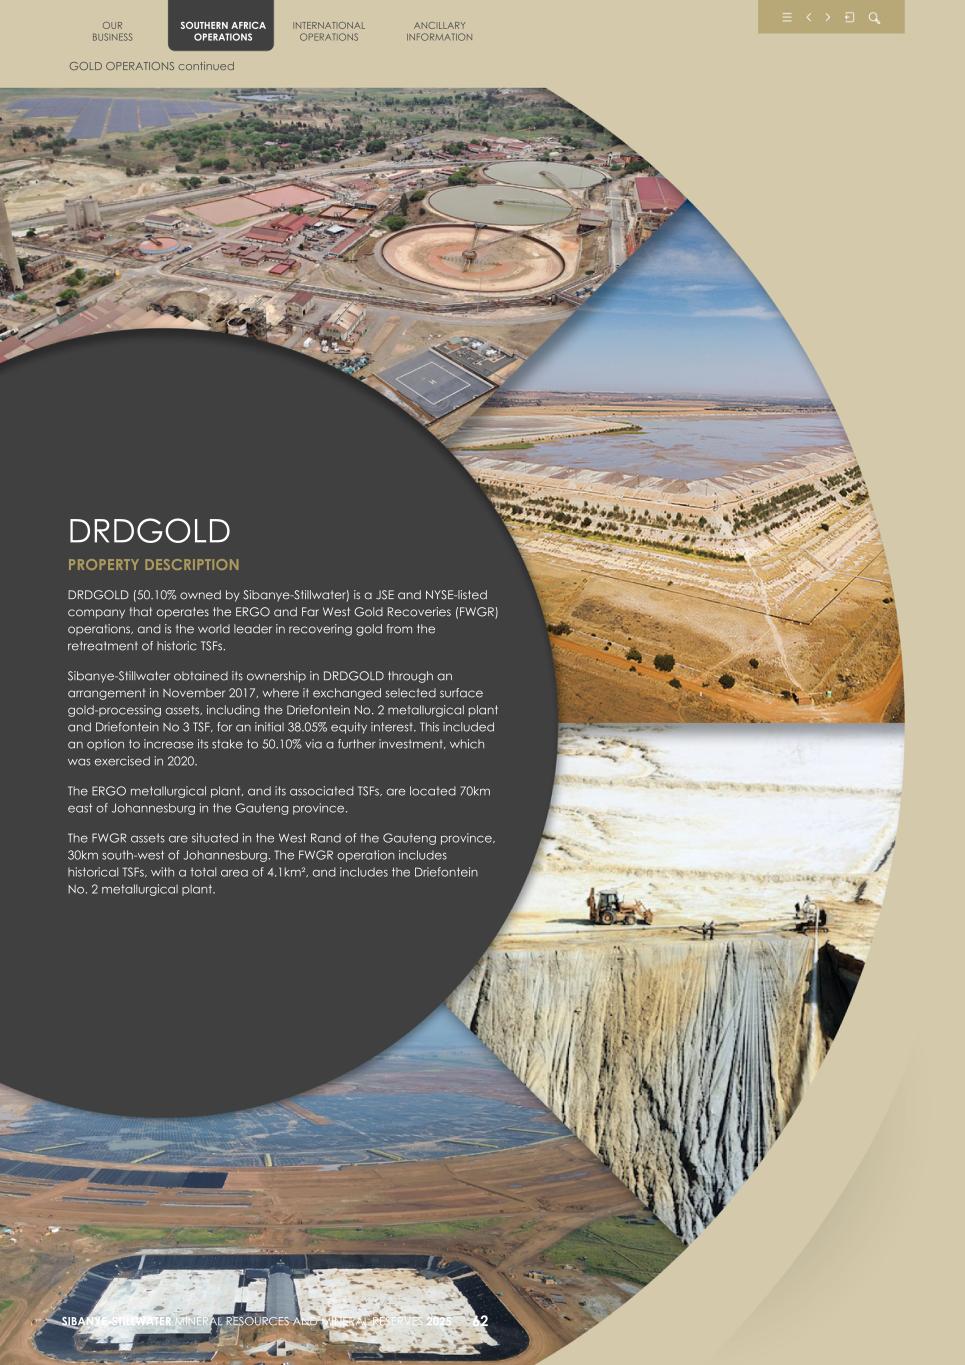
OUR BUSINESS SOUTHERN AFRICA OPERATIONS INTERNATIONAL OPERATIONS ANCILLARY INFORMATION GOLD OPERATIONS continued SIBANYE-STILLWATER MINERAL RESOURCES AND MINERAL RESERVES 2025 62 DRDGOLD PROPERTY DESCRIPTION DRDGOLD (50.10% owned by Sibanye-Stillwater) is a JSE and NYSE-listed company that operates the ERGO and Far West Gold Recoveries (FWGR) operations, and is the world leader in recovering gold from the retreatment of historic TSFs. Sibanye-Stillwater obtained its ownership in DRDGOLD through an arrangement in November 2017, where it exchanged selected surface gold-processing assets, including the Driefontein No. 2 metallurgical plant and Driefontein No 3 TSF, for an initial 38.05% equity interest. This included an option to increase its stake to 50.10% via a further investment, which was exercised in 2020. The ERGO metallurgical plant, and its associated TSFs, are located 70km east of Johannesburg in the Gauteng province. The FWGR assets are situated in the West Rand of the Gauteng province, 30km south-west of Johannesburg. The FWGR operation includes historical TSFs, with a total area of 4.1km², and includes the Driefontein No. 2 metallurgical plant.
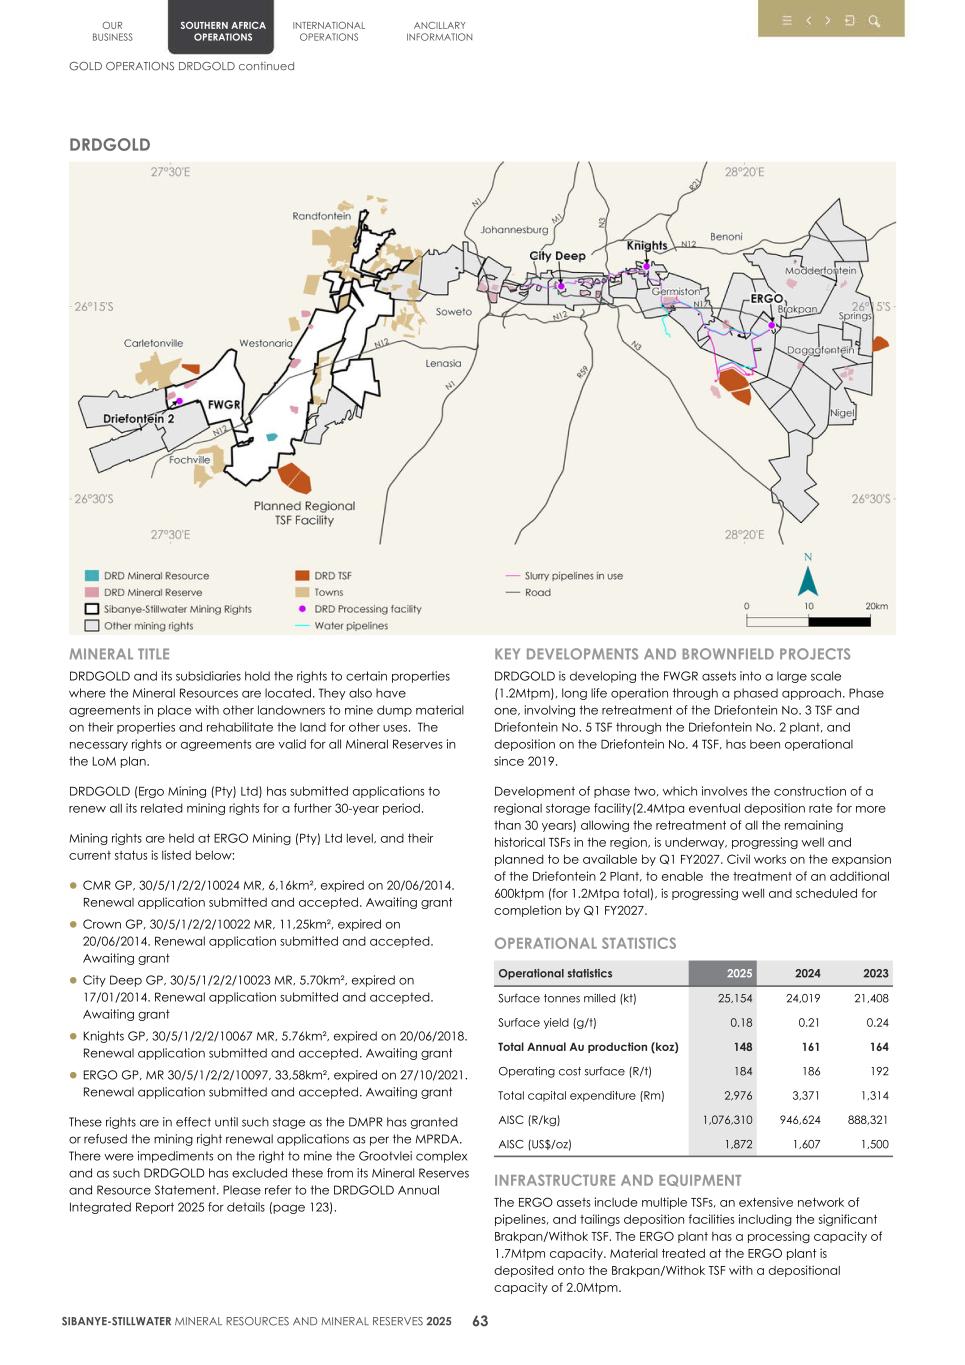
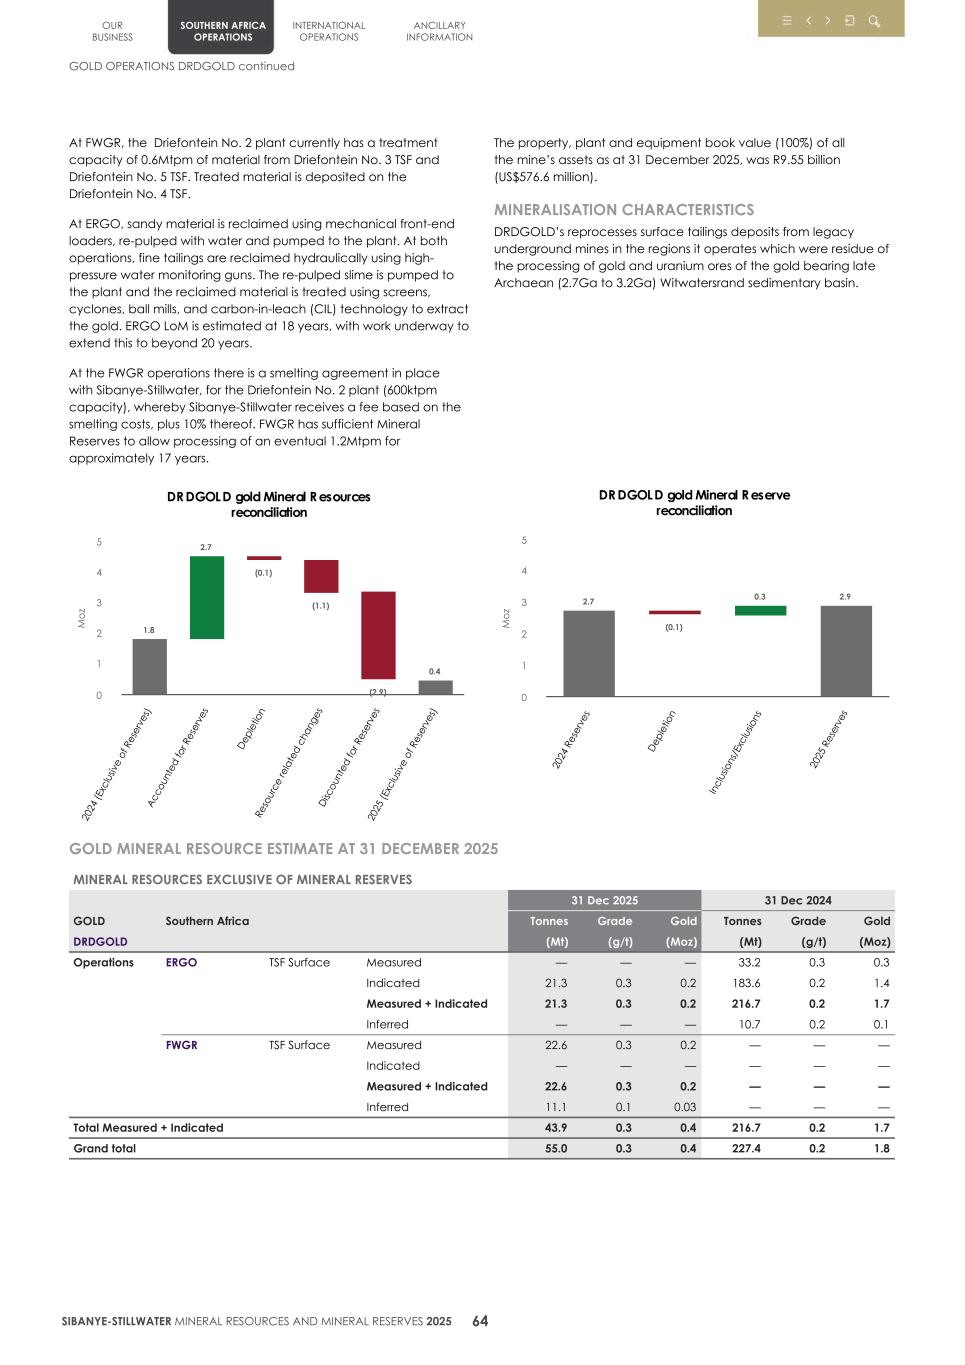
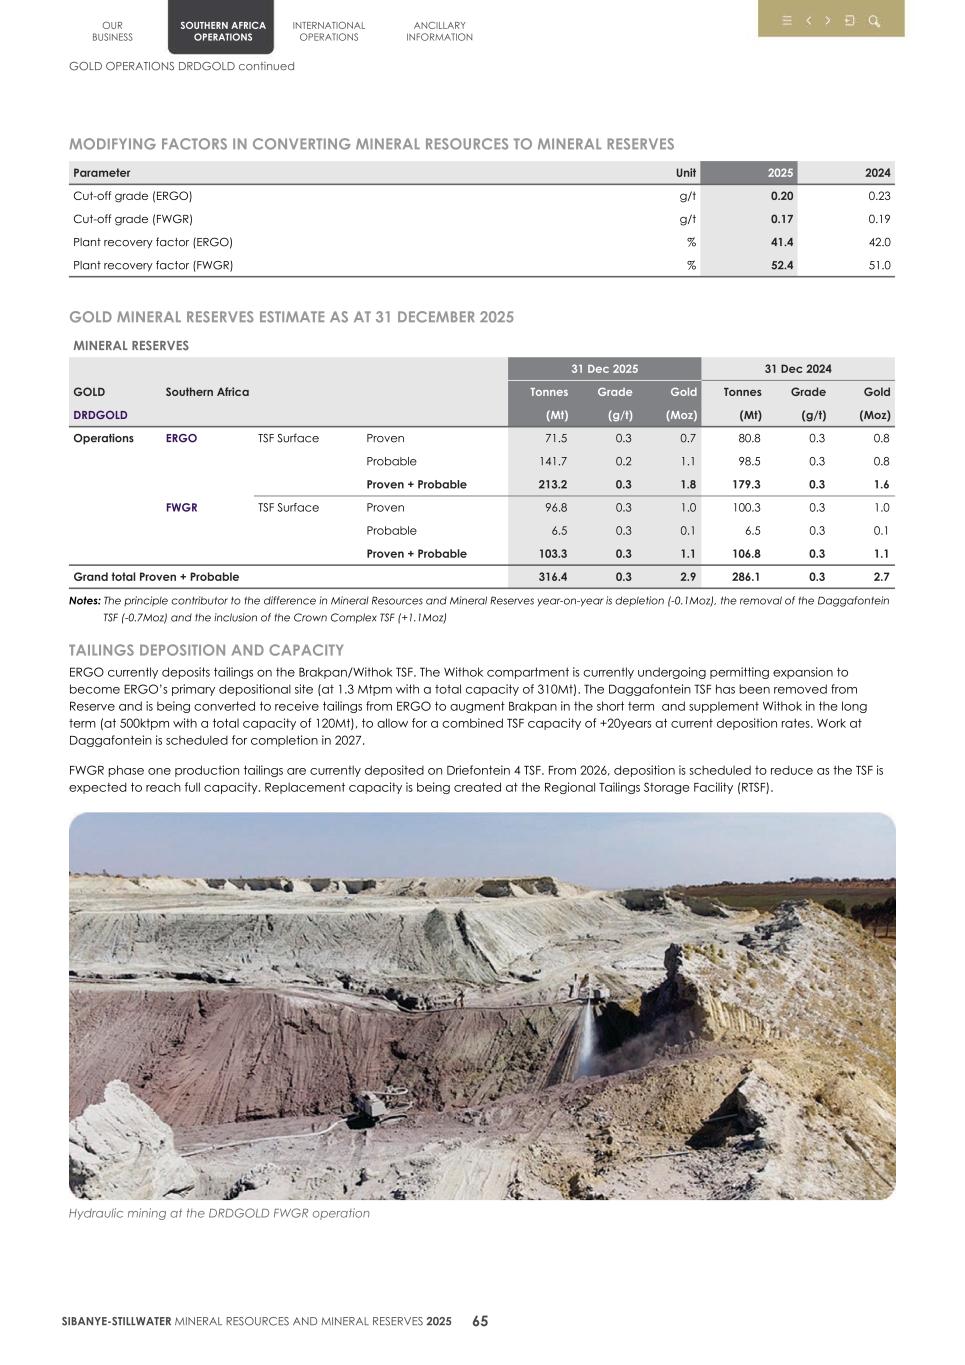
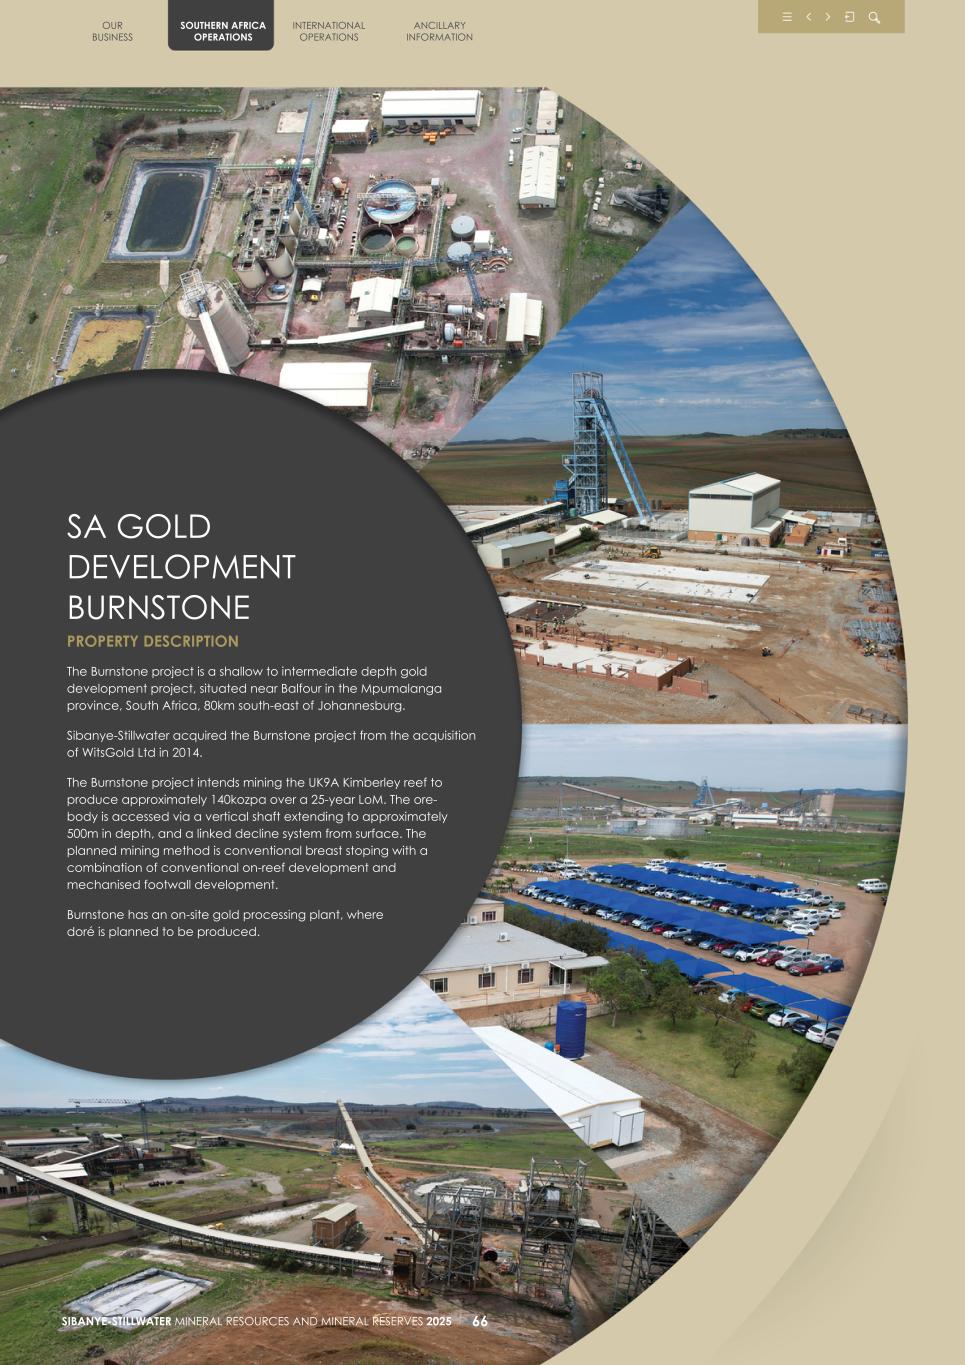
OUR BUSINESS SOUTHERN AFRICA OPERATIONS INTERNATIONAL OPERATIONS ANCILLARY INFORMATION SIBANYE-STILLWATER MINERAL RESOURCES AND MINERAL RESERVES 2025 66 SA GOLD DEVELOPMENT BURNSTONE PROPERTY DESCRIPTION The Burnstone project is a shallow to intermediate depth gold development project, situated near Balfour in the Mpumalanga province, South Africa, 80km south-east of Johannesburg. Sibanye-Stillwater acquired the Burnstone project from the acquisition of WitsGold Ltd in 2014. The Burnstone project intends mining the UK9A Kimberley reef to produce approximately 140kozpa over a 25-year LoM. The ore- body is accessed via a vertical shaft extending to approximately 500m in depth, and a linked decline system from surface. The planned mining method is conventional breast stoping with a combination of conventional on-reef development and mechanised footwall development. Burnstone has an on-site gold processing plant, where doré is planned to be produced.
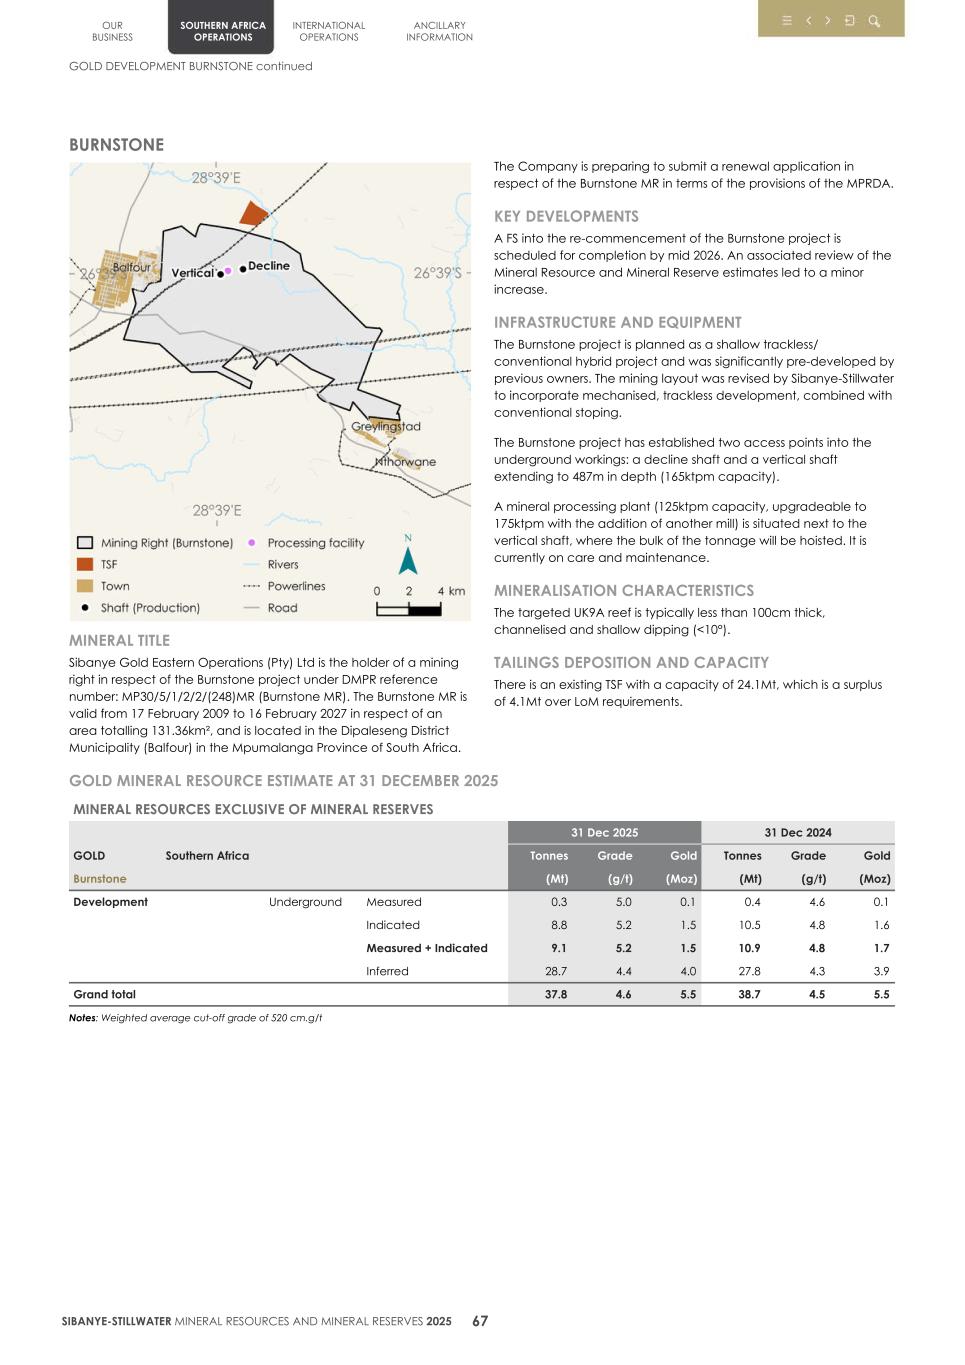
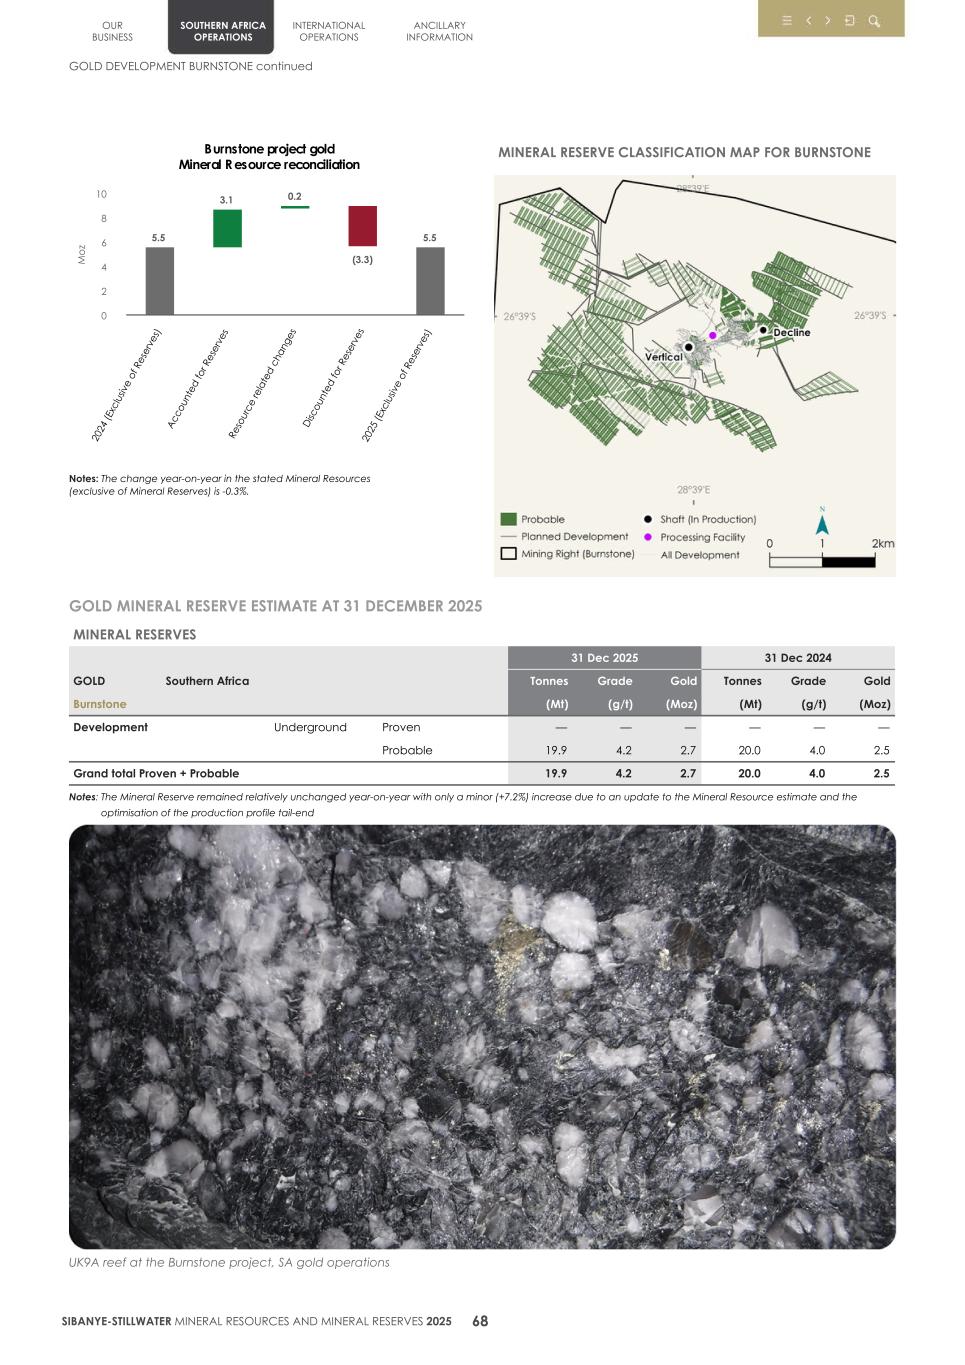
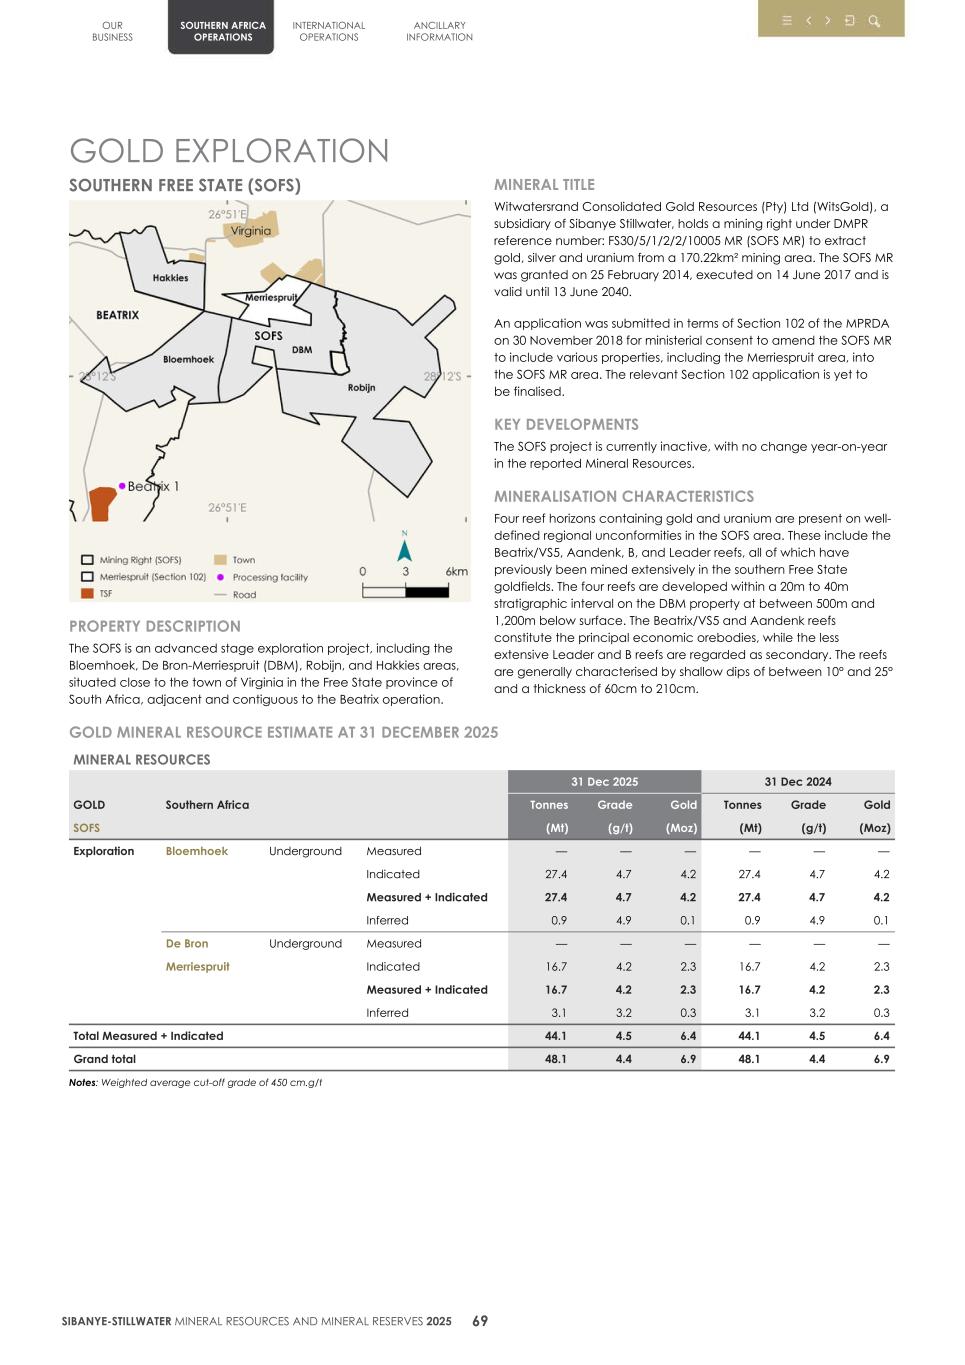
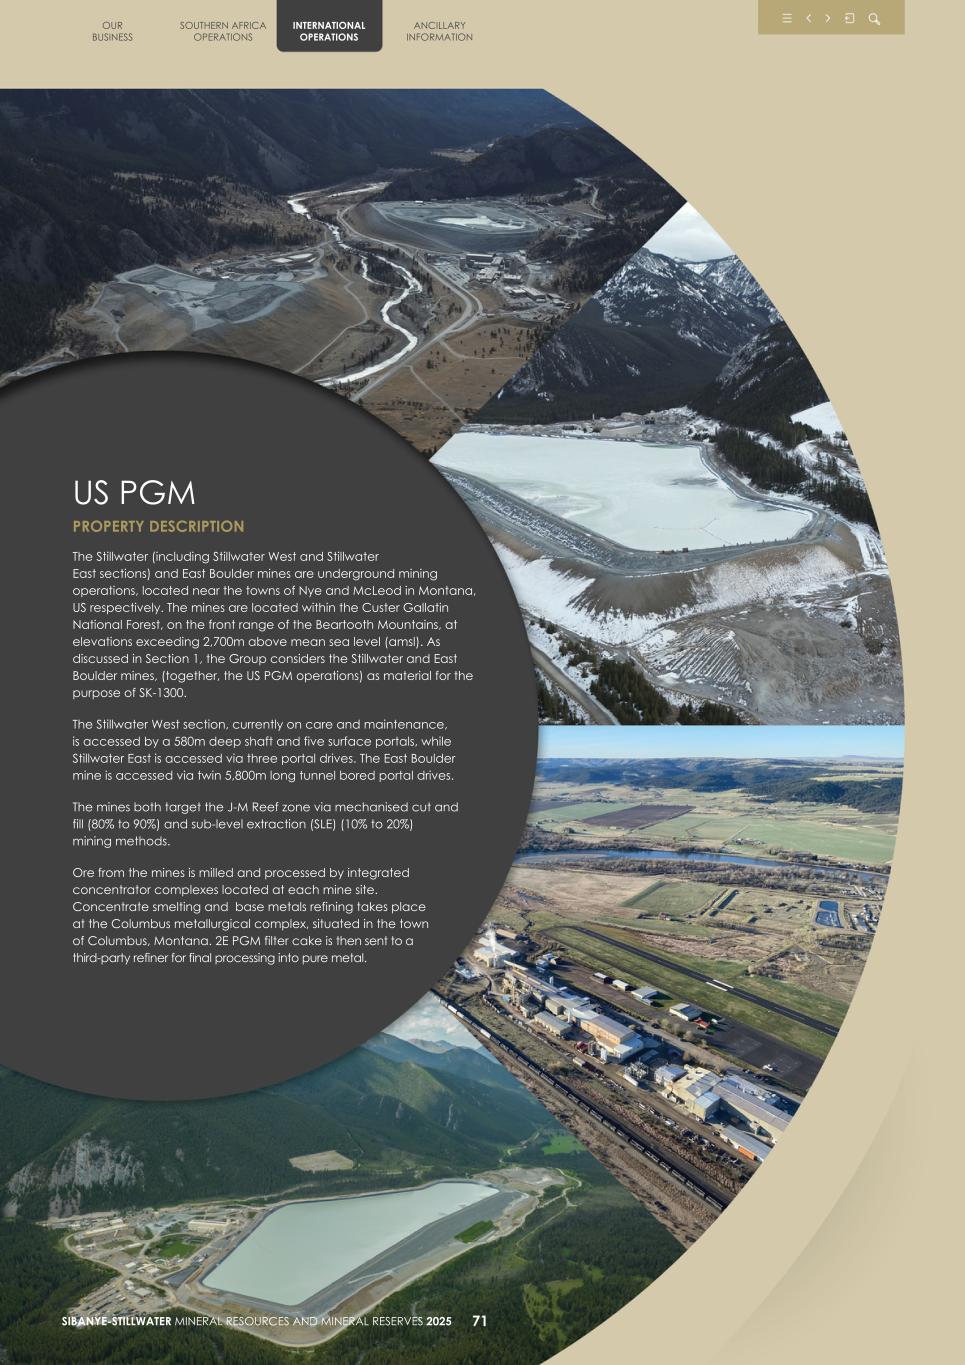
OUR BUSINESS SOUTHERN AFRICA OPERATIONS INTERNATIONAL OPERATIONS ANCILLARY INFORMATION SIBANYE-STILLWATER MINERAL RESOURCES AND MINERAL RESERVES 2025 71 US PGM PROPERTY DESCRIPTION The Stillwater (including Stillwater West and Stillwater East sections) and East Boulder mines are underground mining operations, located near the towns of Nye and McLeod in Montana, US respectively. The mines are located within the Custer Gallatin National Forest, on the front range of the Beartooth Mountains, at elevations exceeding 2,700m above mean sea level (amsl). As discussed in Section 1, the Group considers the Stillwater and East Boulder mines, (together, the US PGM operations) as material for the purpose of SK-1300. The Stillwater West section, currently on care and maintenance, is accessed by a 580m deep shaft and five surface portals, while Stillwater East is accessed via three portal drives. The East Boulder mine is accessed via twin 5,800m long tunnel bored portal drives. The mines both target the J-M Reef zone via mechanised cut and fill (80% to 90%) and sub-level extraction (SLE) (10% to 20%) mining methods. Ore from the mines is milled and processed by integrated concentrator complexes located at each mine site. Concentrate smelting and base metals refining takes place at the Columbus metallurgical complex, situated in the town of Columbus, Montana. 2E PGM filter cake is then sent to a third-party refiner for final processing into pure metal.
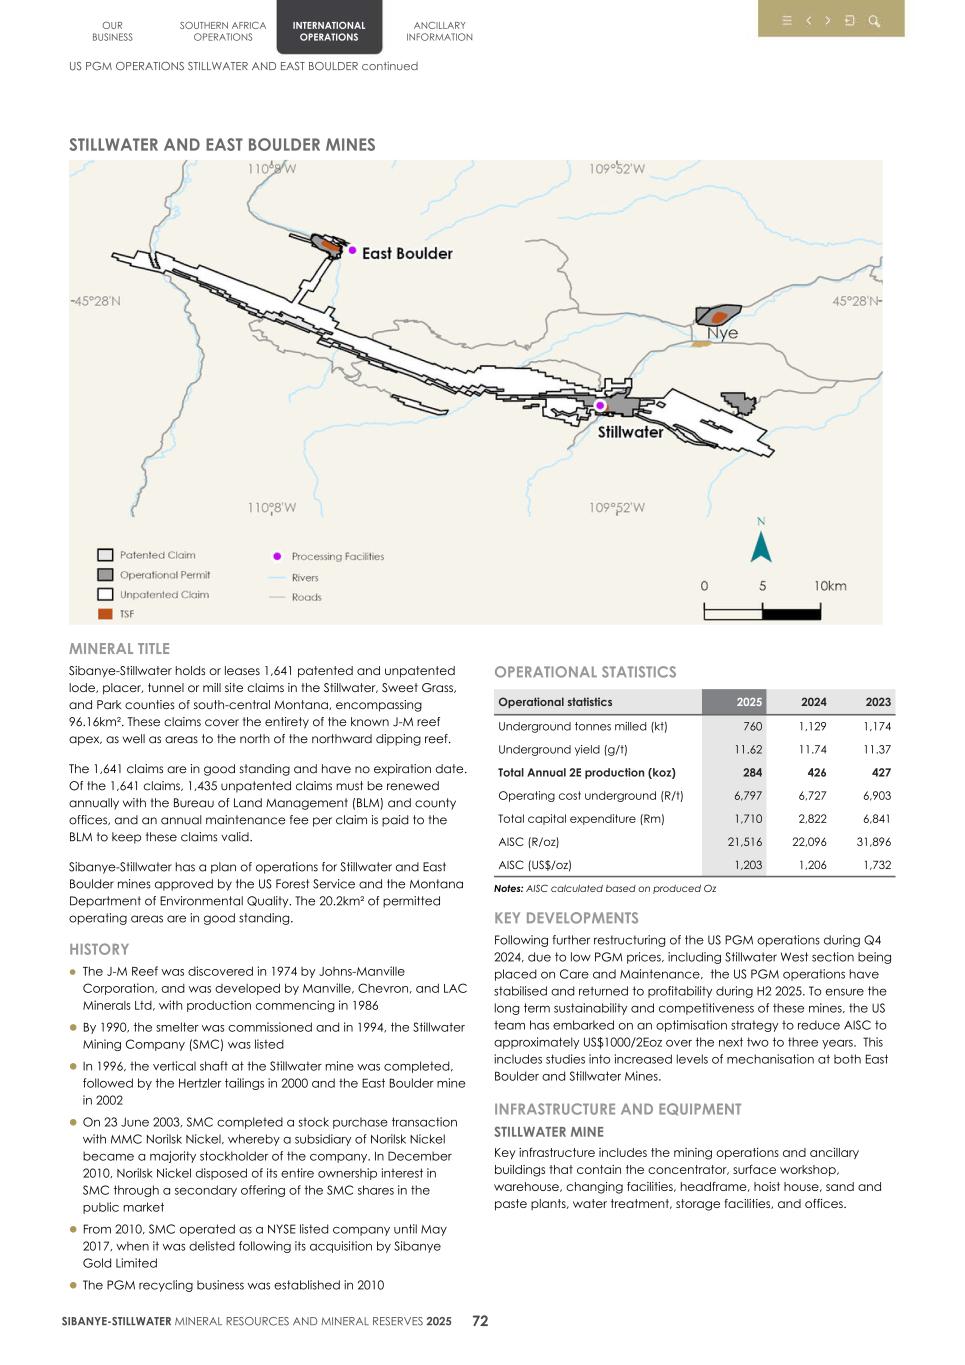
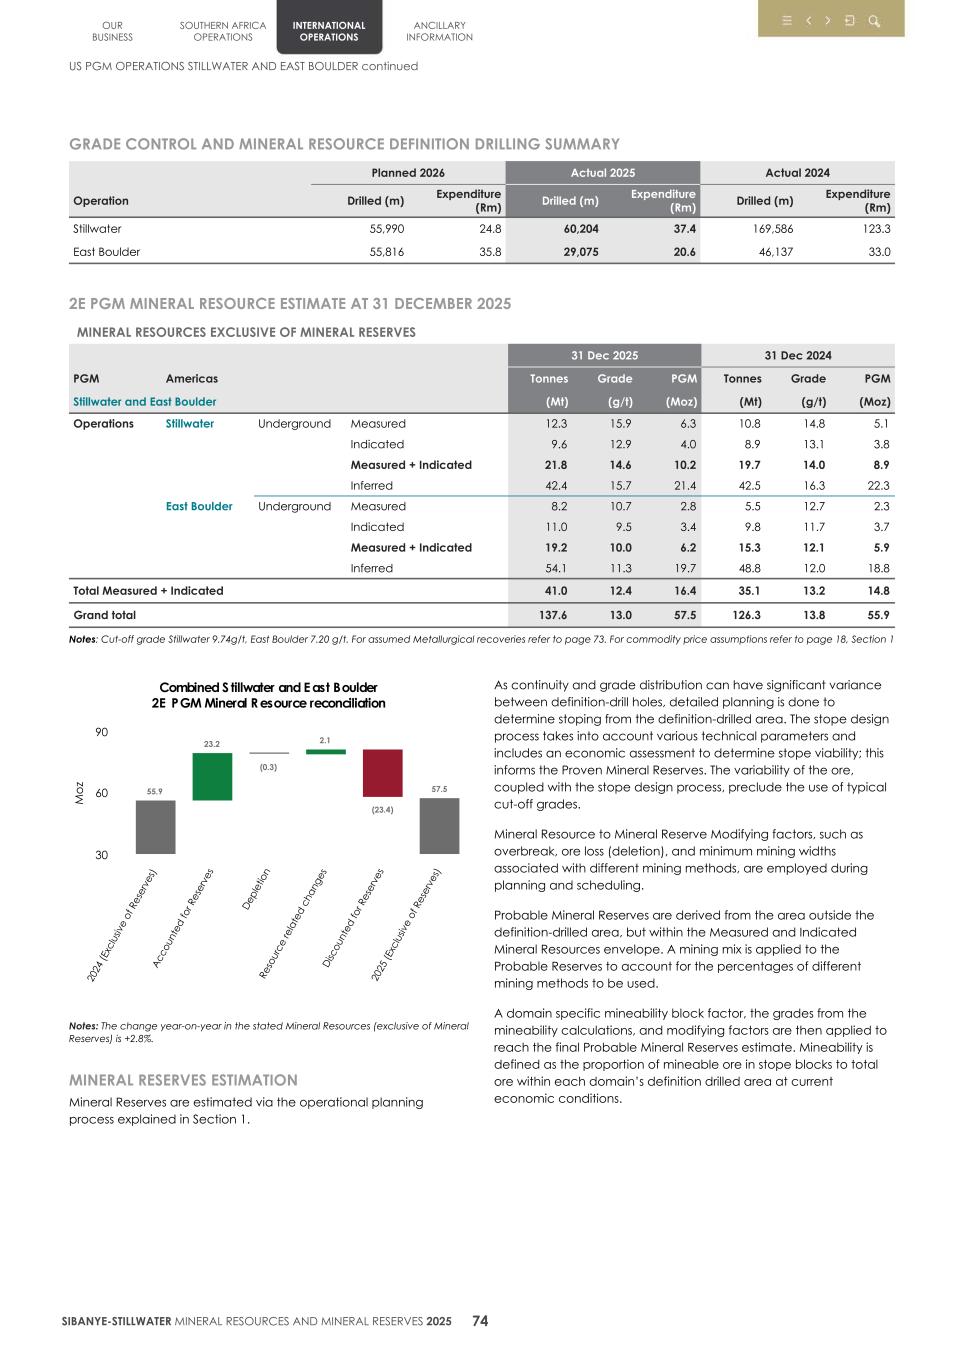
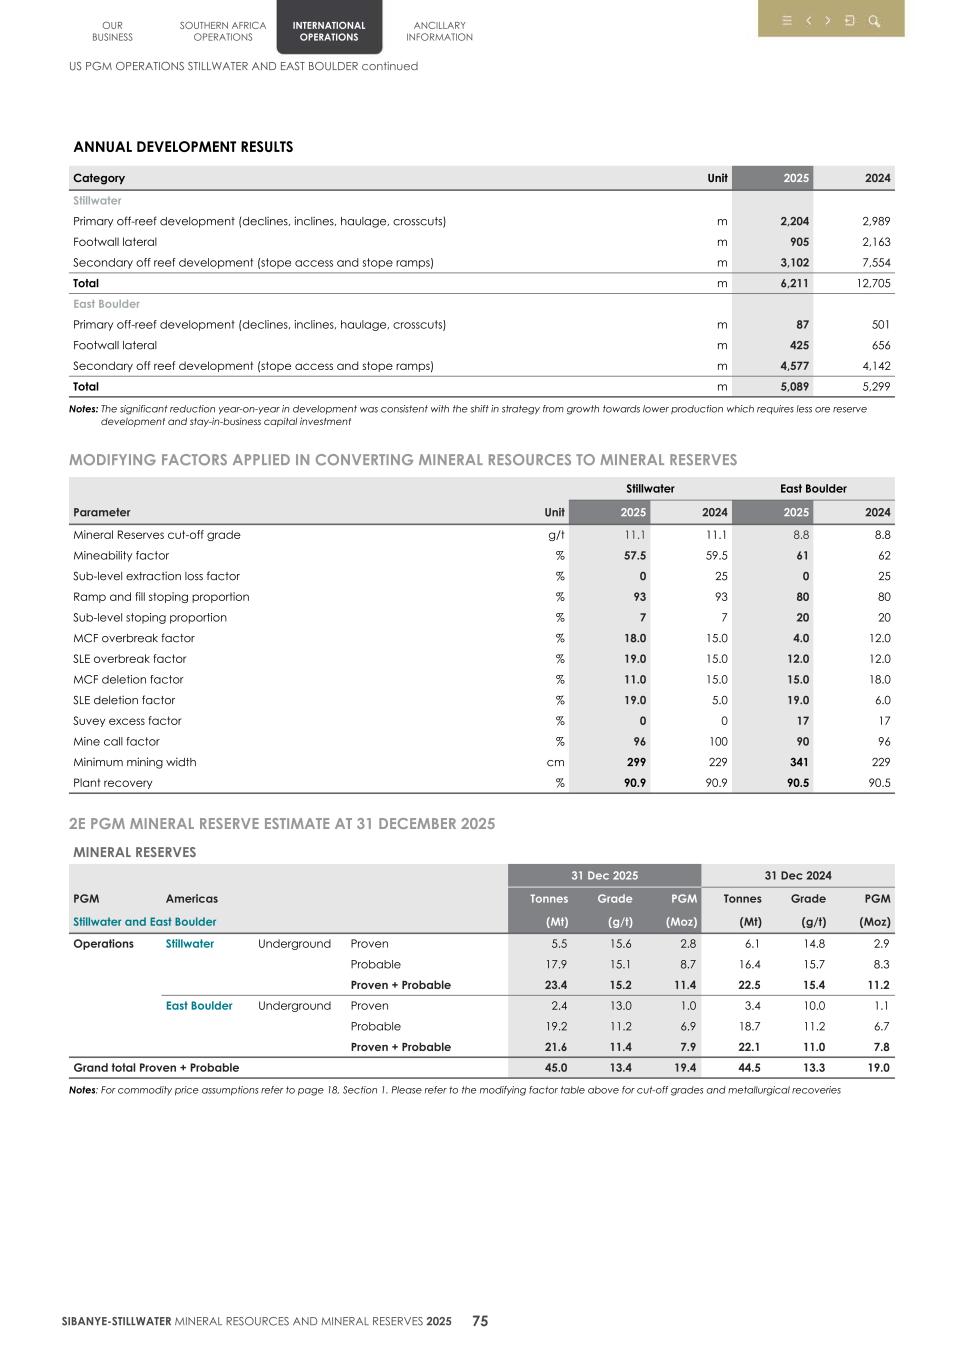
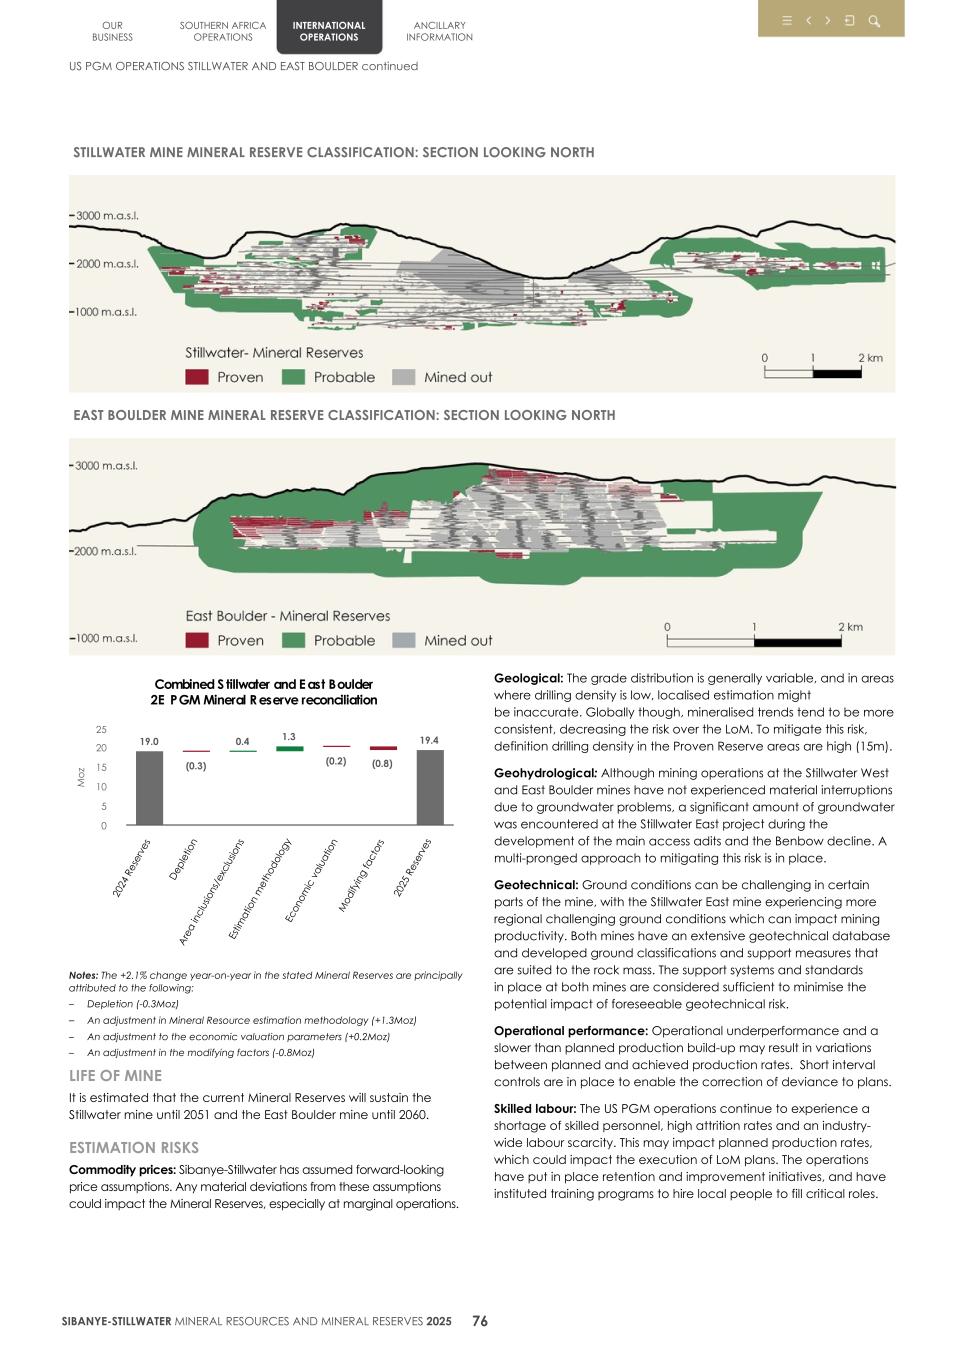
STILLWATER MINE MINERAL RESERVE CLASSIFICATION: SECTION LOOKING NORTH EAST BOULDER MINE MINERAL RESERVE CLASSIFICATION: SECTION LOOKING NORTH M o z Combined S tillwater and E ast Boulder 2E PGM Mineral R eserve reconciliation 19.0 (0.3) 0.4 1.3 (0.2) (0.8) 19.4 20 24 R es er ve s D ep le tio n A re a in cl us io ns /e xc lu sio ns Es tim at io n m et ho do lo gy Ec on om ic v al ua tio n M od ify in g fa ct or s 20 25 R es er ve s 0 5 10 15 20 25 Notes: The +2.1% change year-on-year in the stated Mineral Reserves are principally attributed to the following: – Depletion (-0.3Moz) – An adjustment in Mineral Resource estimation methodology (+1.3Moz) – An adjustment to the economic valuation parameters (+0.2Moz) – An adjustment in the modifying factors (-0.8Moz) LIFE OF MINE It is estimated that the current Mineral Reserves will sustain the Stillwater mine until 2051 and the East Boulder mine until 2060. ESTIMATION RISKS Commodity prices: Sibanye-Stillwater has assumed forward-looking price assumptions. Any material deviations from these assumptions could impact the Mineral Reserves, especially at marginal operations. Geological: The grade distribution is generally variable, and in areas where drilling density is low, localised estimation might be inaccurate. Globally though, mineralised trends tend to be more consistent, decreasing the risk over the LoM. To mitigate this risk, definition drilling density in the Proven Reserve areas are high (15m). Geohydrological: Although mining operations at the Stillwater West and East Boulder mines have not experienced material interruptions due to groundwater problems, a significant amount of groundwater was encountered at the Stillwater East project during the development of the main access adits and the Benbow decline. A multi-pronged approach to mitigating this risk is in place. Geotechnical: Ground conditions can be challenging in certain parts of the mine, with the Stillwater East mine experiencing more regional challenging ground conditions which can impact mining productivity. Both mines have an extensive geotechnical database and developed ground classifications and support measures that are suited to the rock mass. The support systems and standards in place at both mines are considered sufficient to minimise the potential impact of foreseeable geotechnical risk. Operational performance: Operational underperformance and a slower than planned production build-up may result in variations between planned and achieved production rates. Short interval controls are in place to enable the correction of deviance to plans. Skilled labour: The US PGM operations continue to experience a shortage of skilled personnel, high attrition rates and an industry- wide labour scarcity. This may impact planned production rates, which could impact the execution of LoM plans. The operations have put in place retention and improvement initiatives, and have instituted training programs to hire local people to fill critical roles. OUR BUSINESS SOUTHERN AFRICA OPERATIONS INTERNATIONAL OPERATIONS ANCILLARY INFORMATION US PGM OPERATIONS STILLWATER AND EAST BOULDER continued SIBANYE-STILLWATER MINERAL RESOURCES AND MINERAL RESERVES 2025 76
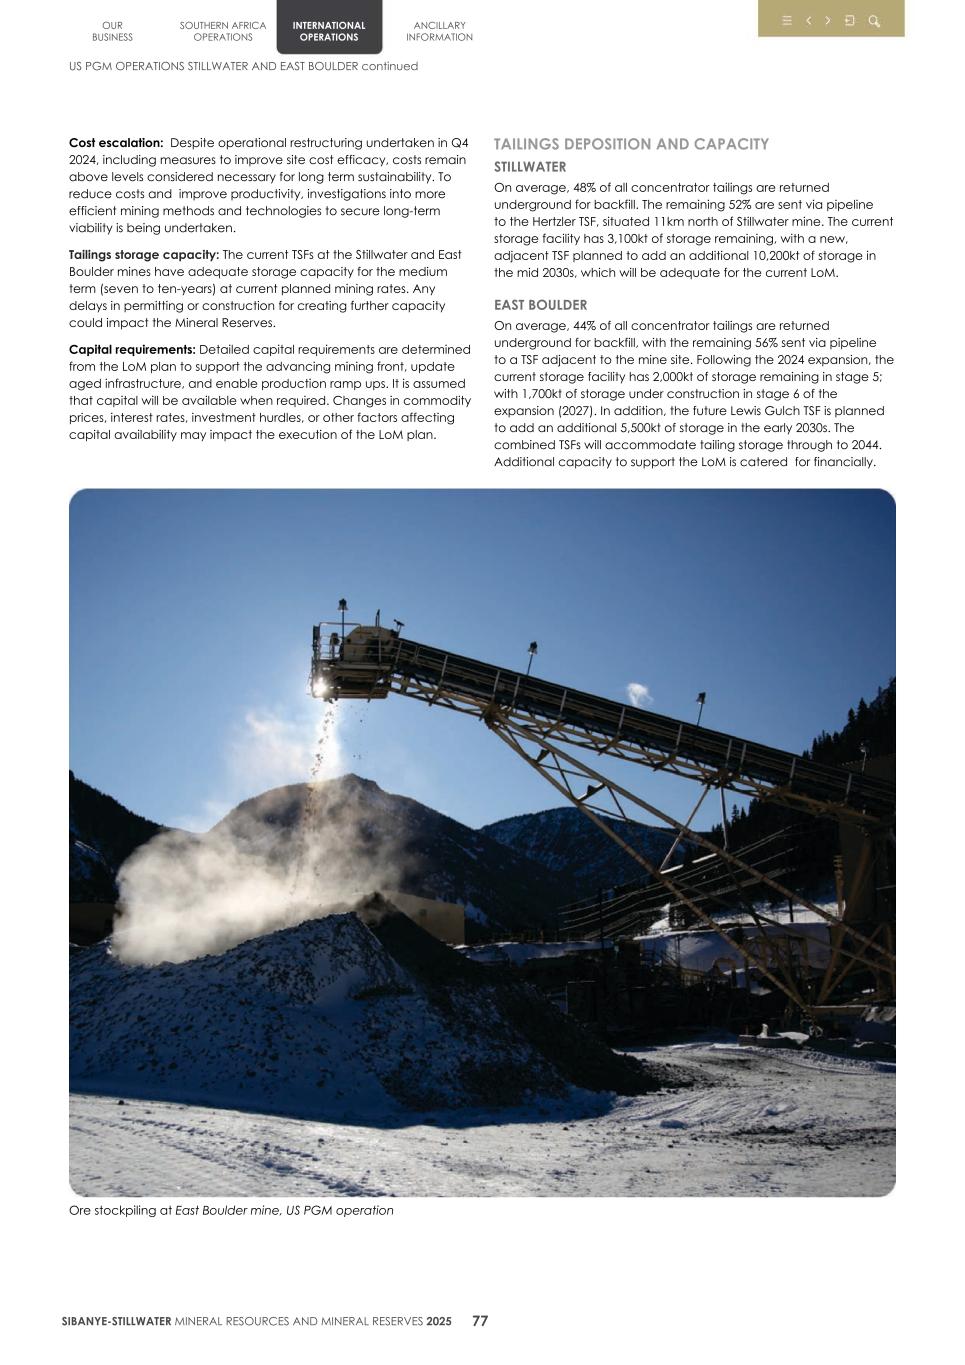
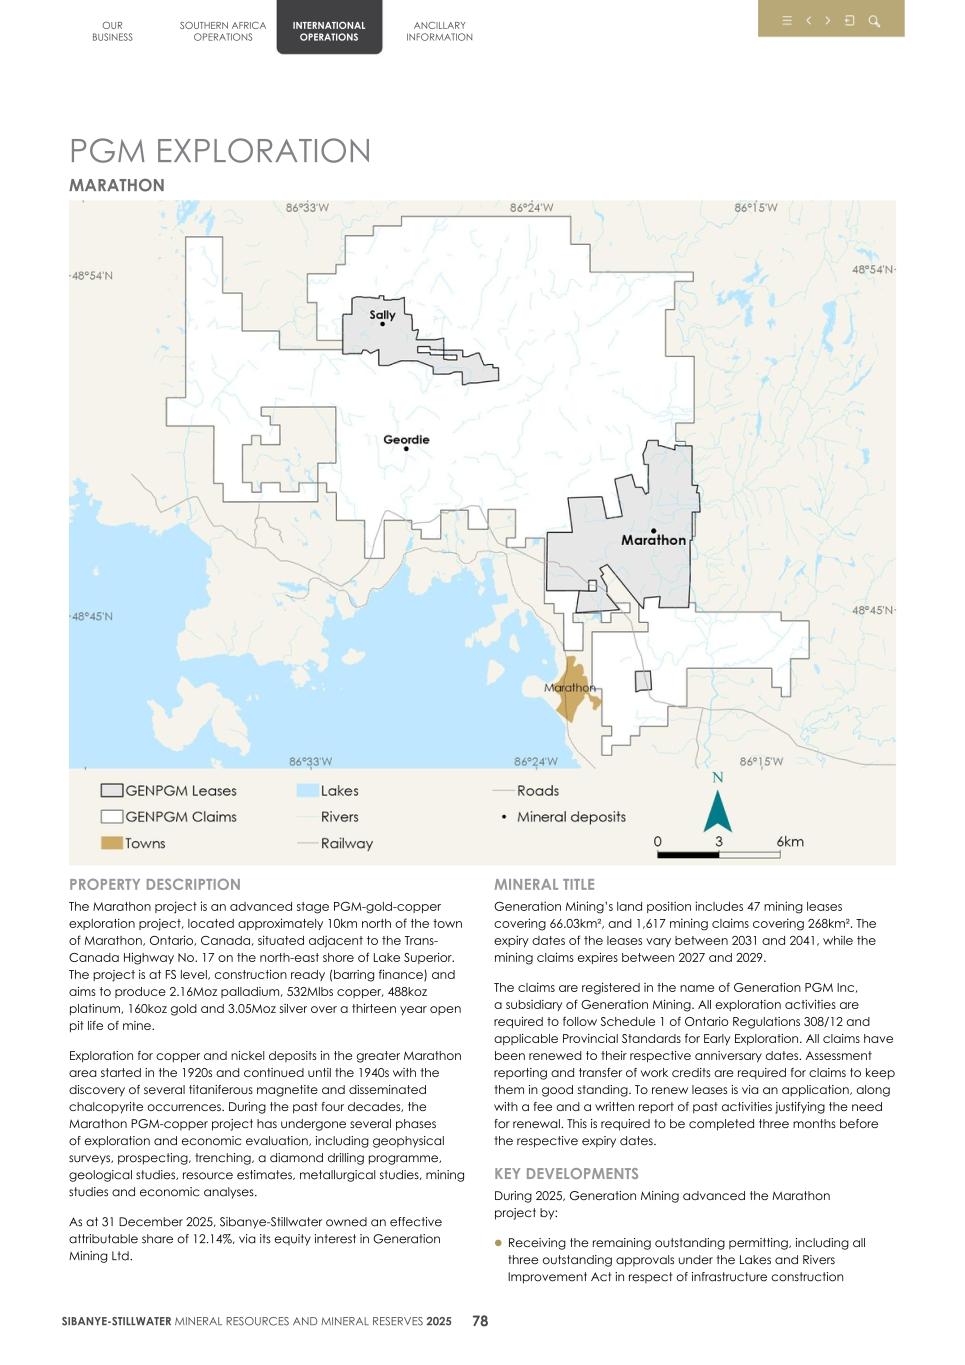
PGM EXPLORATION MARATHON PROPERTY DESCRIPTION The Marathon project is an advanced stage PGM-gold-copper exploration project, located approximately 10km north of the town of Marathon, Ontario, Canada, situated adjacent to the Trans- Canada Highway No. 17 on the north-east shore of Lake Superior. The project is at FS level, construction ready (barring finance) and aims to produce 2.16Moz palladium, 532Mlbs copper, 488koz platinum, 160koz gold and 3.05Moz silver over a thirteen year open pit life of mine. Exploration for copper and nickel deposits in the greater Marathon area started in the 1920s and continued until the 1940s with the discovery of several titaniferous magnetite and disseminated chalcopyrite occurrences. During the past four decades, the Marathon PGM-copper project has undergone several phases of exploration and economic evaluation, including geophysical surveys, prospecting, trenching, a diamond drilling programme, geological studies, resource estimates, metallurgical studies, mining studies and economic analyses. As at 31 December 2025, Sibanye-Stillwater owned an effective attributable share of 12.14%, via its equity interest in Generation Mining Ltd. MINERAL TITLE Generation Mining’s land position includes 47 mining leases covering 66.03km², and 1,617 mining claims covering 268km². The expiry dates of the leases vary between 2031 and 2041, while the mining claims expires between 2027 and 2029. The claims are registered in the name of Generation PGM Inc, a subsidiary of Generation Mining. All exploration activities are required to follow Schedule 1 of Ontario Regulations 308/12 and applicable Provincial Standards for Early Exploration. All claims have been renewed to their respective anniversary dates. Assessment reporting and transfer of work credits are required for claims to keep them in good standing. To renew leases is via an application, along with a fee and a written report of past activities justifying the need for renewal. This is required to be completed three months before the respective expiry dates. KEY DEVELOPMENTS During 2025, Generation Mining advanced the Marathon project by: l Receiving the remaining outstanding permitting, including all three outstanding approvals under the Lakes and Rivers Improvement Act in respect of infrastructure construction OUR BUSINESS SOUTHERN AFRICA OPERATIONS INTERNATIONAL OPERATIONS ANCILLARY INFORMATION SIBANYE-STILLWATER MINERAL RESOURCES AND MINERAL RESERVES 2025 78
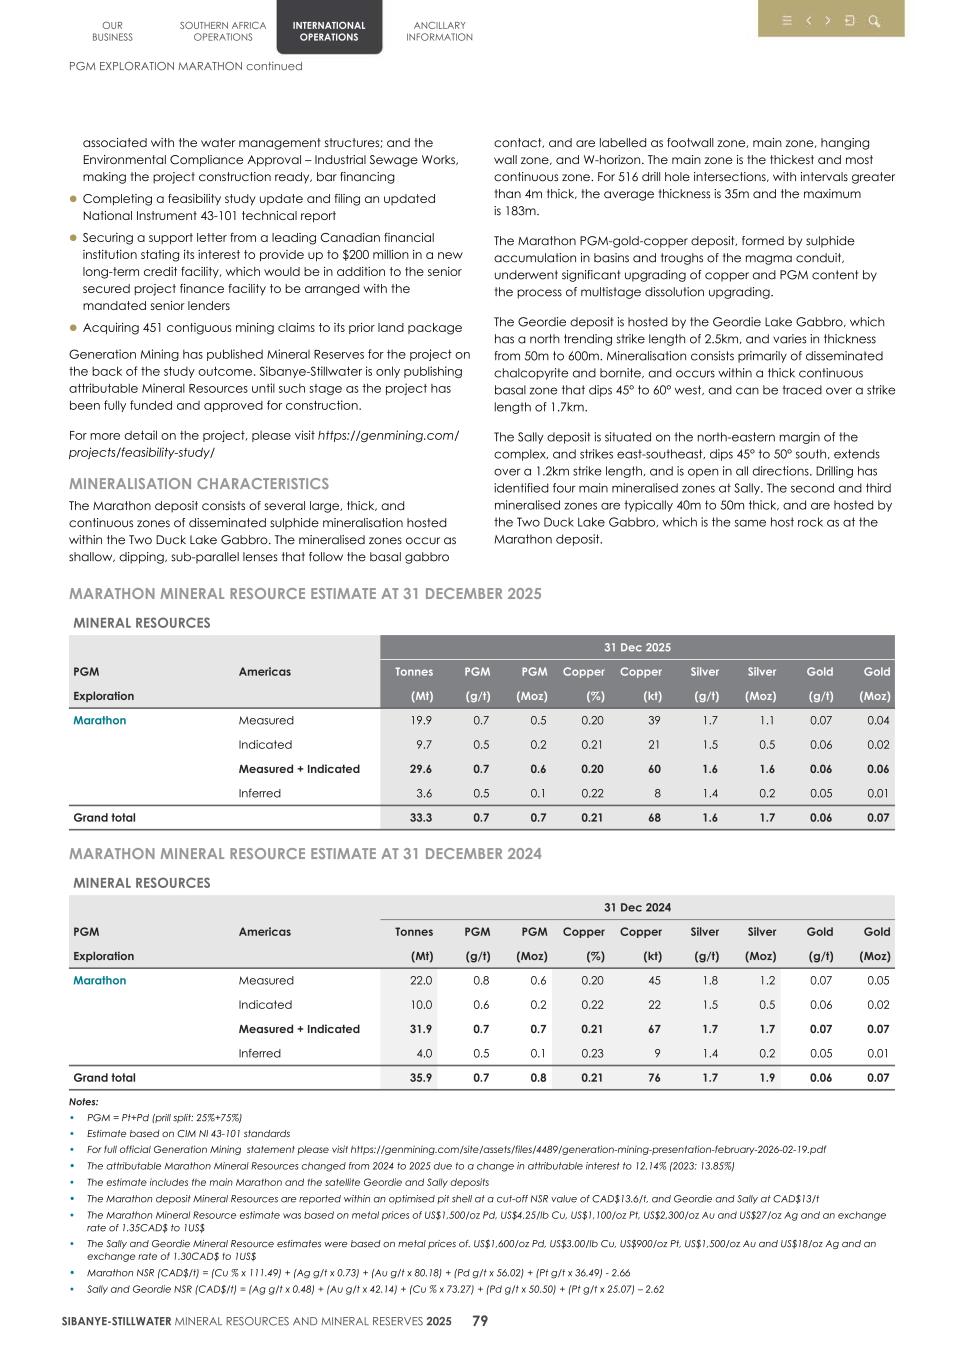
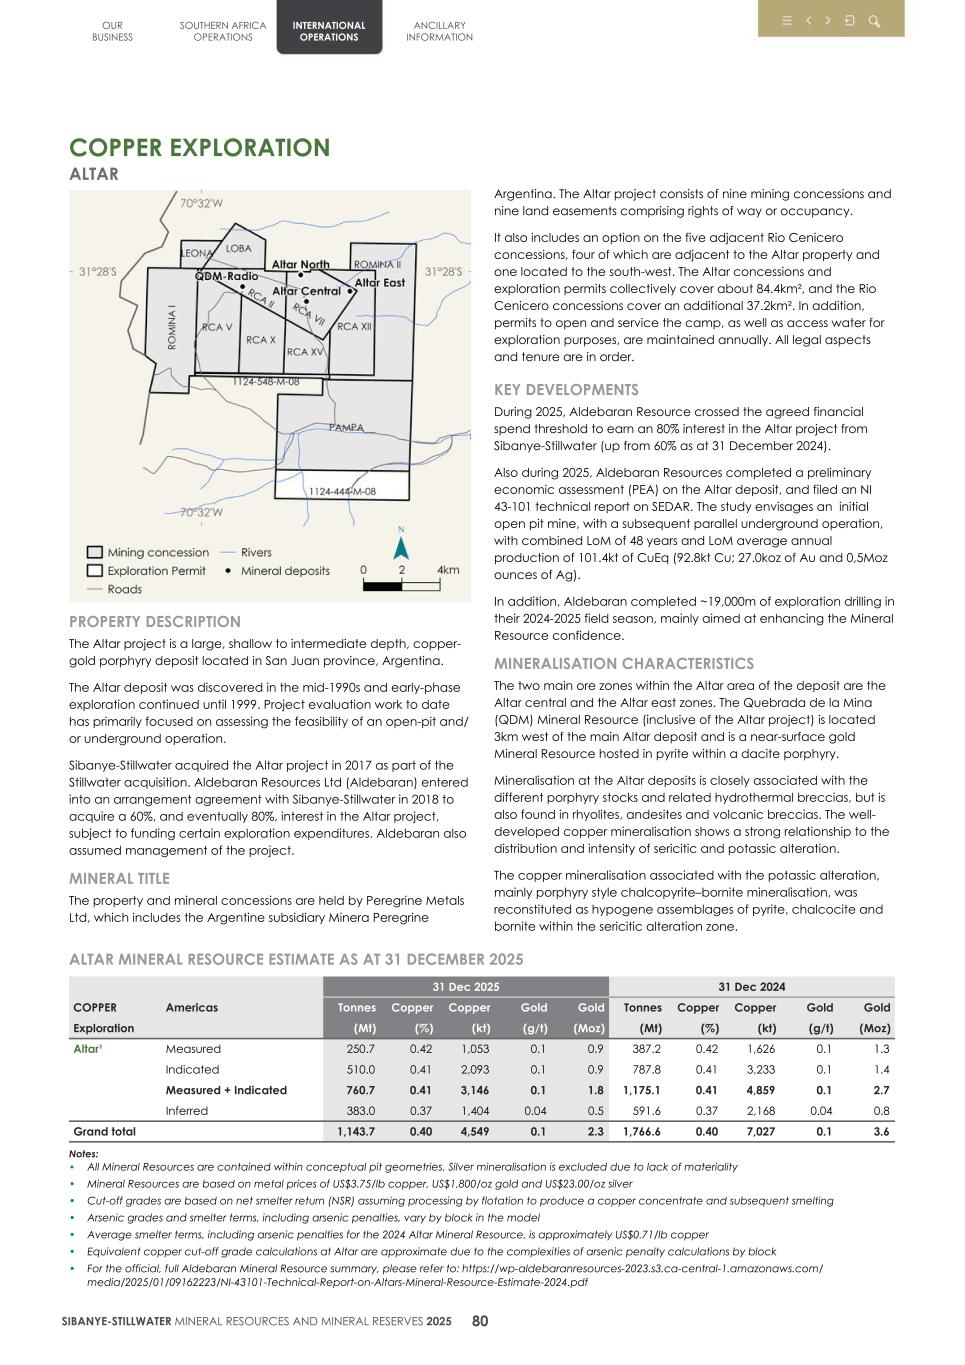
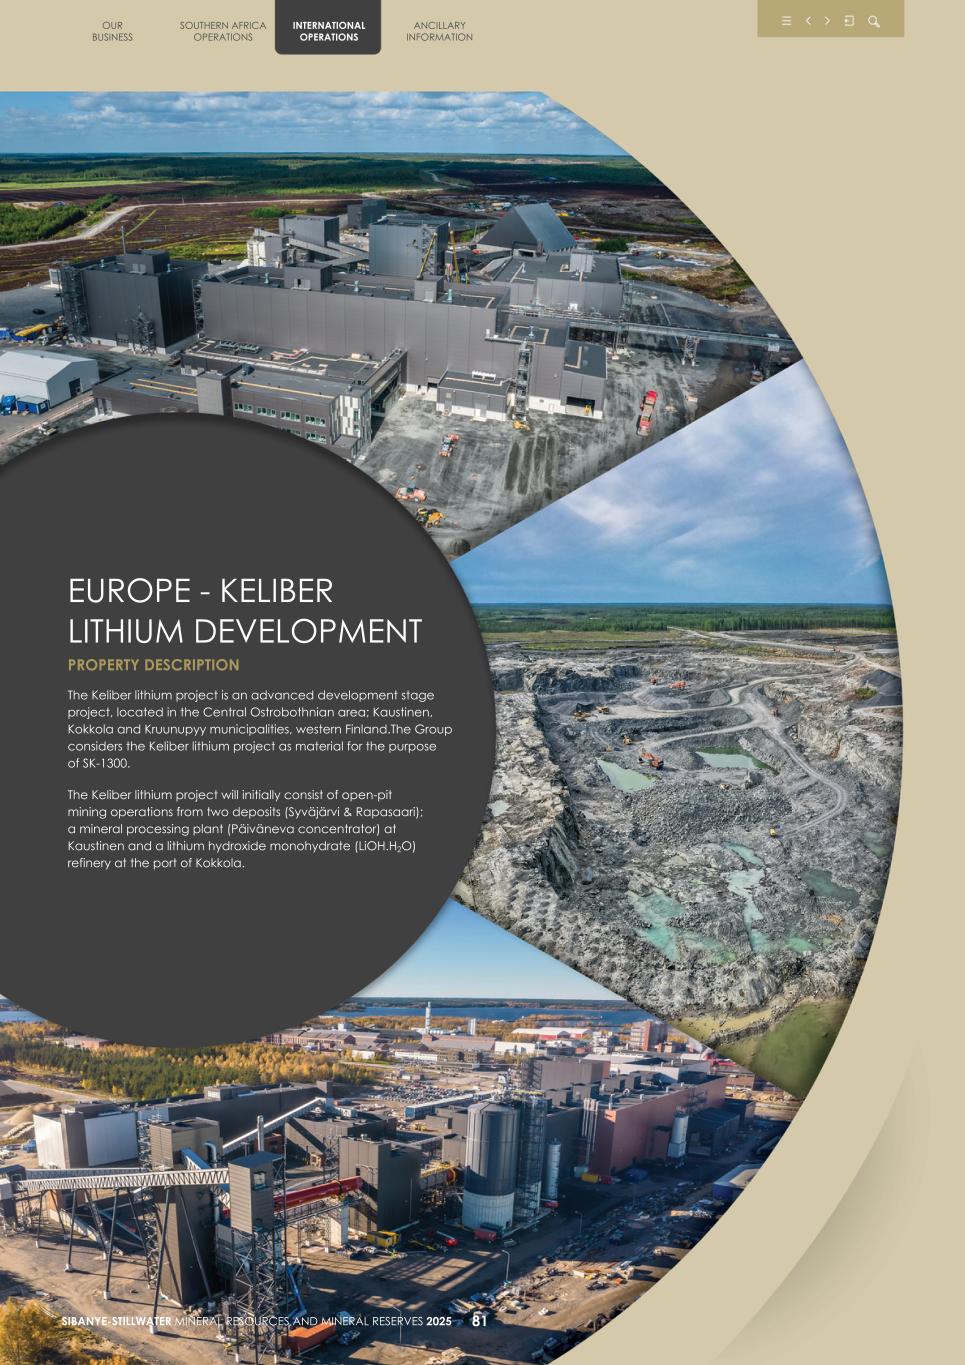
OUR BUSINESS SOUTHERN AFRICA OPERATIONS INTERNATIONAL OPERATIONS ANCILLARY INFORMATION SIBANYE-STILLWATER MINERAL RESOURCES AND MINERAL RESERVES 2025 81 EUROPE - KELIBER LITHIUM DEVELOPMENT PROPERTY DESCRIPTION The Keliber lithium project is an advanced development stage project, located in the Central Ostrobothnian area; Kaustinen, Kokkola and Kruunupyy municipalities, western Finland.The Group considers the Keliber lithium project as material for the purpose of SK-1300. The Keliber lithium project will initially consist of open-pit mining operations from two deposits (Syväjärvi & Rapasaari); a mineral processing plant (Päiväneva concentrator) at Kaustinen and a lithium hydroxide monohydrate (LiOH.H2O) refinery at the port of Kokkola.
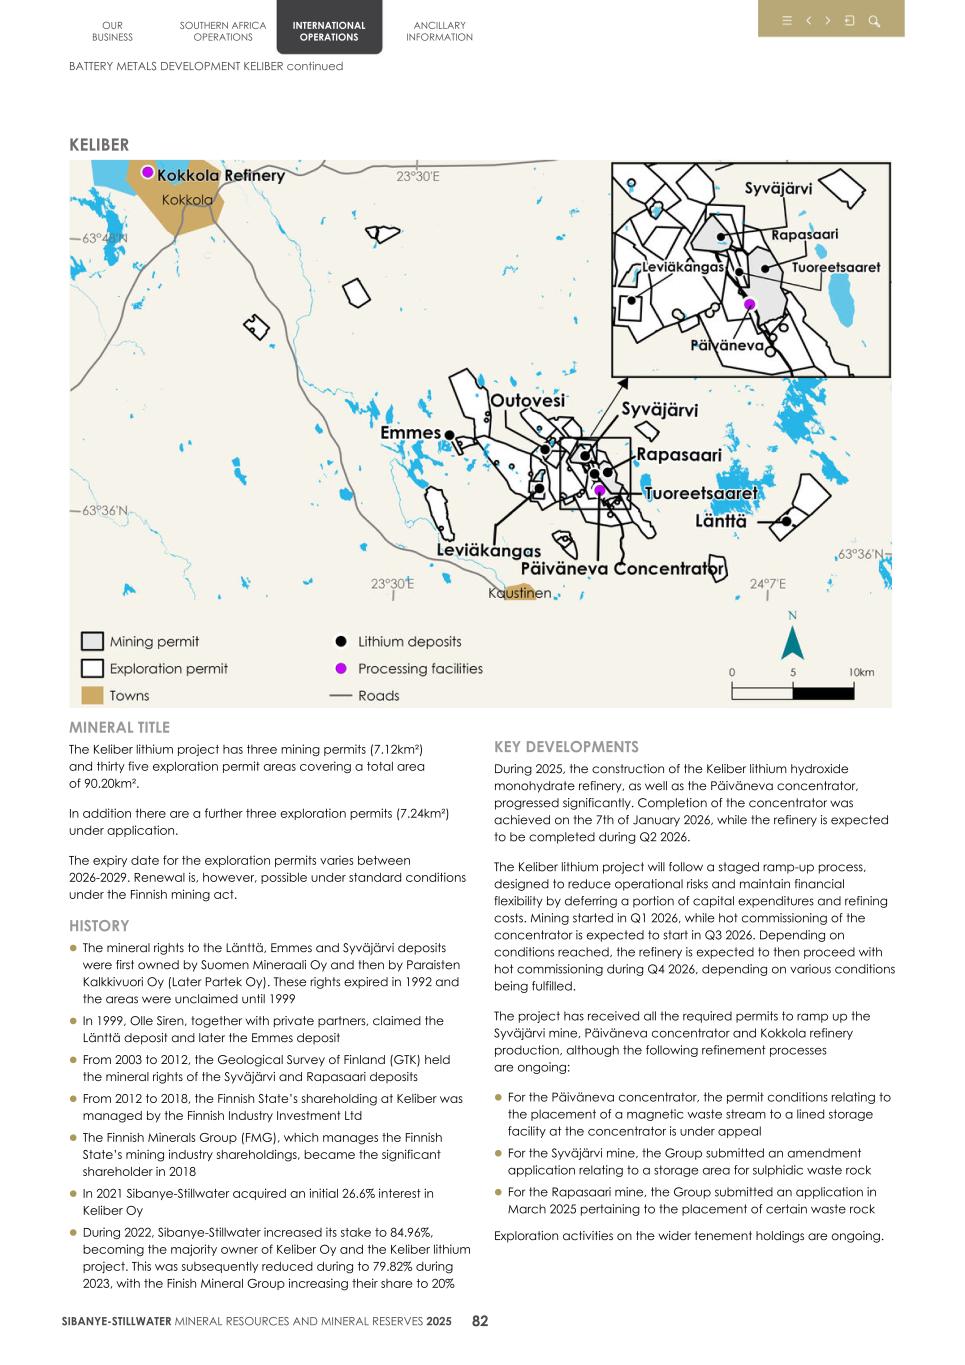
KELIBER MINERAL TITLE The Keliber lithium project has three mining permits (7.12km²) and thirty five exploration permit areas covering a total area of 90.20km². In addition there are a further three exploration permits (7.24km²) under application. The expiry date for the exploration permits varies between 2026-2029. Renewal is, however, possible under standard conditions under the Finnish mining act. HISTORY l The mineral rights to the Länttä, Emmes and Syväjärvi deposits were first owned by Suomen Mineraali Oy and then by Paraisten Kalkkivuori Oy (Later Partek Oy). These rights expired in 1992 and the areas were unclaimed until 1999 l In 1999, Olle Siren, together with private partners, claimed the Länttä deposit and later the Emmes deposit l From 2003 to 2012, the Geological Survey of Finland (GTK) held the mineral rights of the Syväjärvi and Rapasaari deposits l From 2012 to 2018, the Finnish State’s shareholding at Keliber was managed by the Finnish Industry Investment Ltd l The Finnish Minerals Group (FMG), which manages the Finnish State’s mining industry shareholdings, became the significant shareholder in 2018 l In 2021 Sibanye-Stillwater acquired an initial 26.6% interest in Keliber Oy l During 2022, Sibanye-Stillwater increased its stake to 84.96%, becoming the majority owner of Keliber Oy and the Keliber lithium project. This was subsequently reduced during to 79.82% during 2023, with the Finish Mineral Group increasing their share to 20% KEY DEVELOPMENTS During 2025, the construction of the Keliber lithium hydroxide monohydrate refinery, as well as the Päiväneva concentrator, progressed significantly. Completion of the concentrator was achieved on the 7th of January 2026, while the refinery is expected to be completed during Q2 2026. The Keliber lithium project will follow a staged ramp-up process, designed to reduce operational risks and maintain financial flexibility by deferring a portion of capital expenditures and refining costs. Mining started in Q1 2026, while hot commissioning of the concentrator is expected to start in Q3 2026. Depending on conditions reached, the refinery is expected to then proceed with hot commissioning during Q4 2026, depending on various conditions being fulfilled. The project has received all the required permits to ramp up the Syväjärvi mine, Päiväneva concentrator and Kokkola refinery production, although the following refinement processes are ongoing: l For the Päiväneva concentrator, the permit conditions relating to the placement of a magnetic waste stream to a lined storage facility at the concentrator is under appeal l For the Syväjärvi mine, the Group submitted an amendment application relating to a storage area for sulphidic waste rock l For the Rapasaari mine, the Group submitted an application in March 2025 pertaining to the placement of certain waste rock Exploration activities on the wider tenement holdings are ongoing. OUR BUSINESS SOUTHERN AFRICA OPERATIONS INTERNATIONAL OPERATIONS ANCILLARY INFORMATION BATTERY METALS DEVELOPMENT KELIBER continued SIBANYE-STILLWATER MINERAL RESOURCES AND MINERAL RESERVES 2025 82
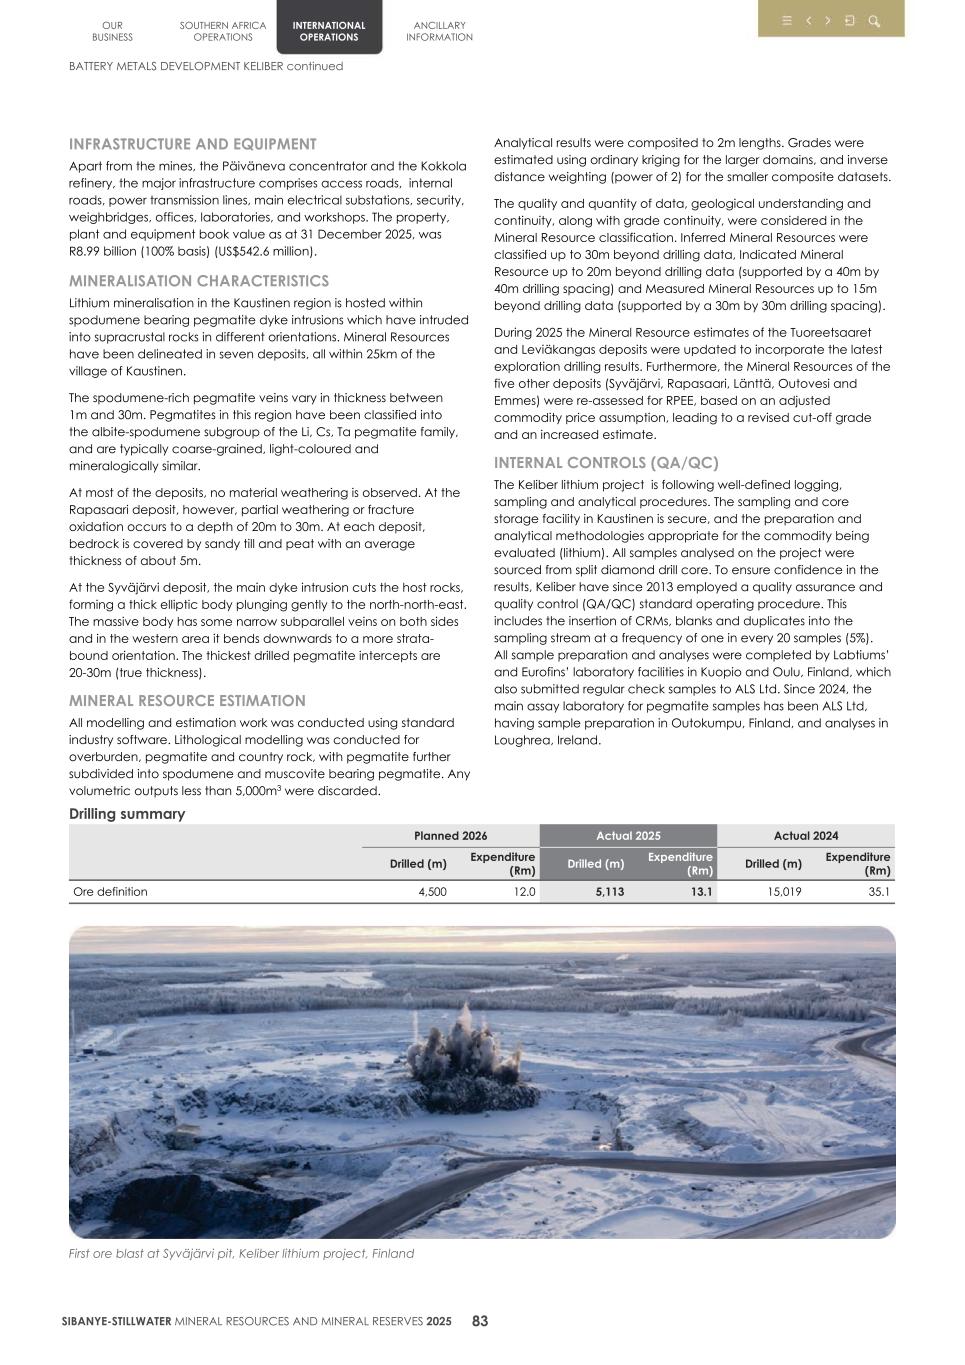
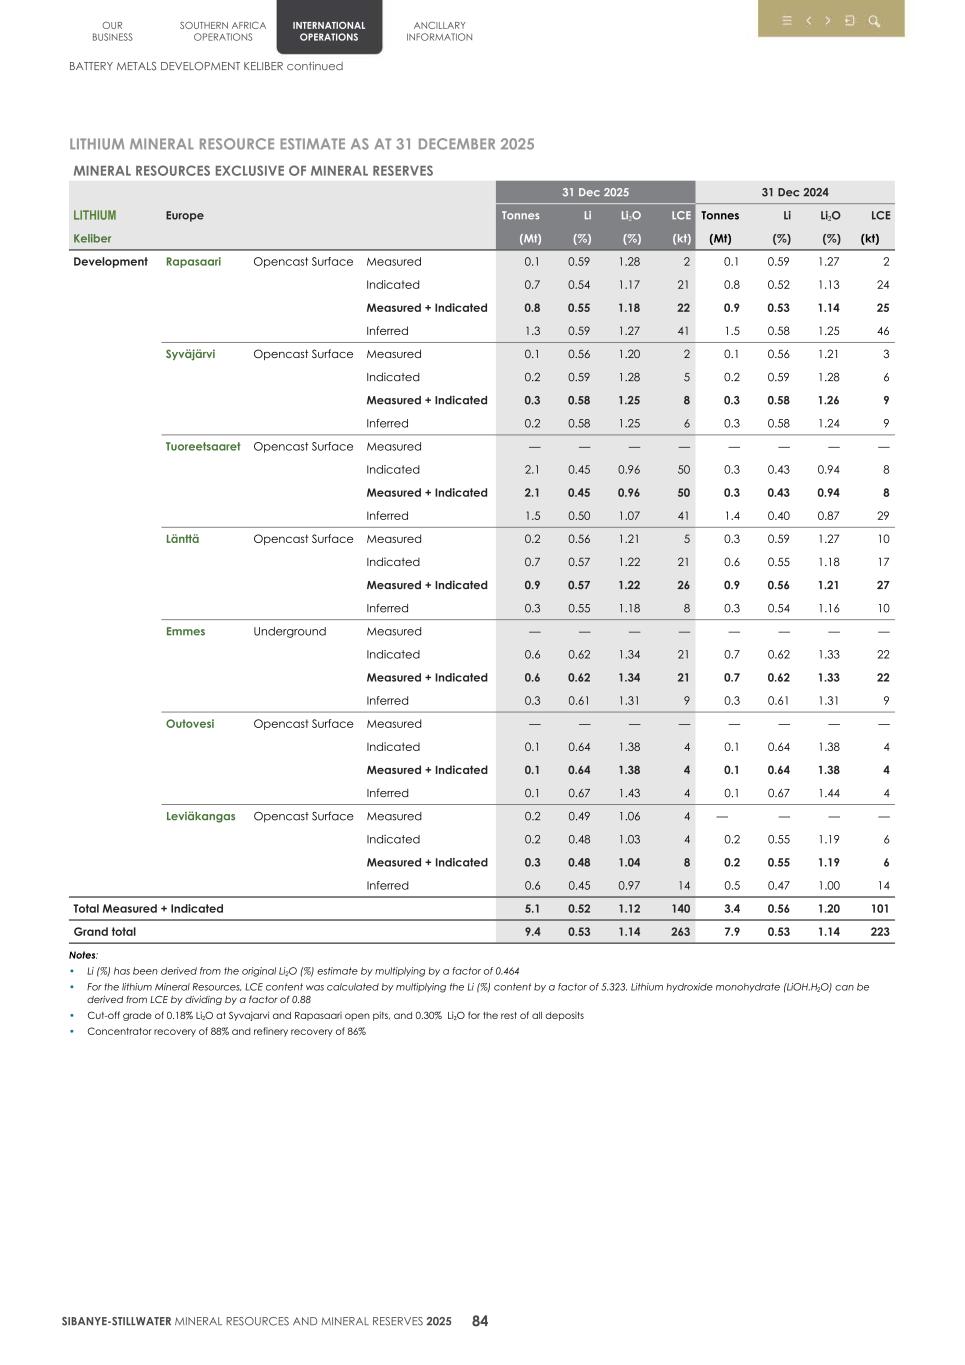
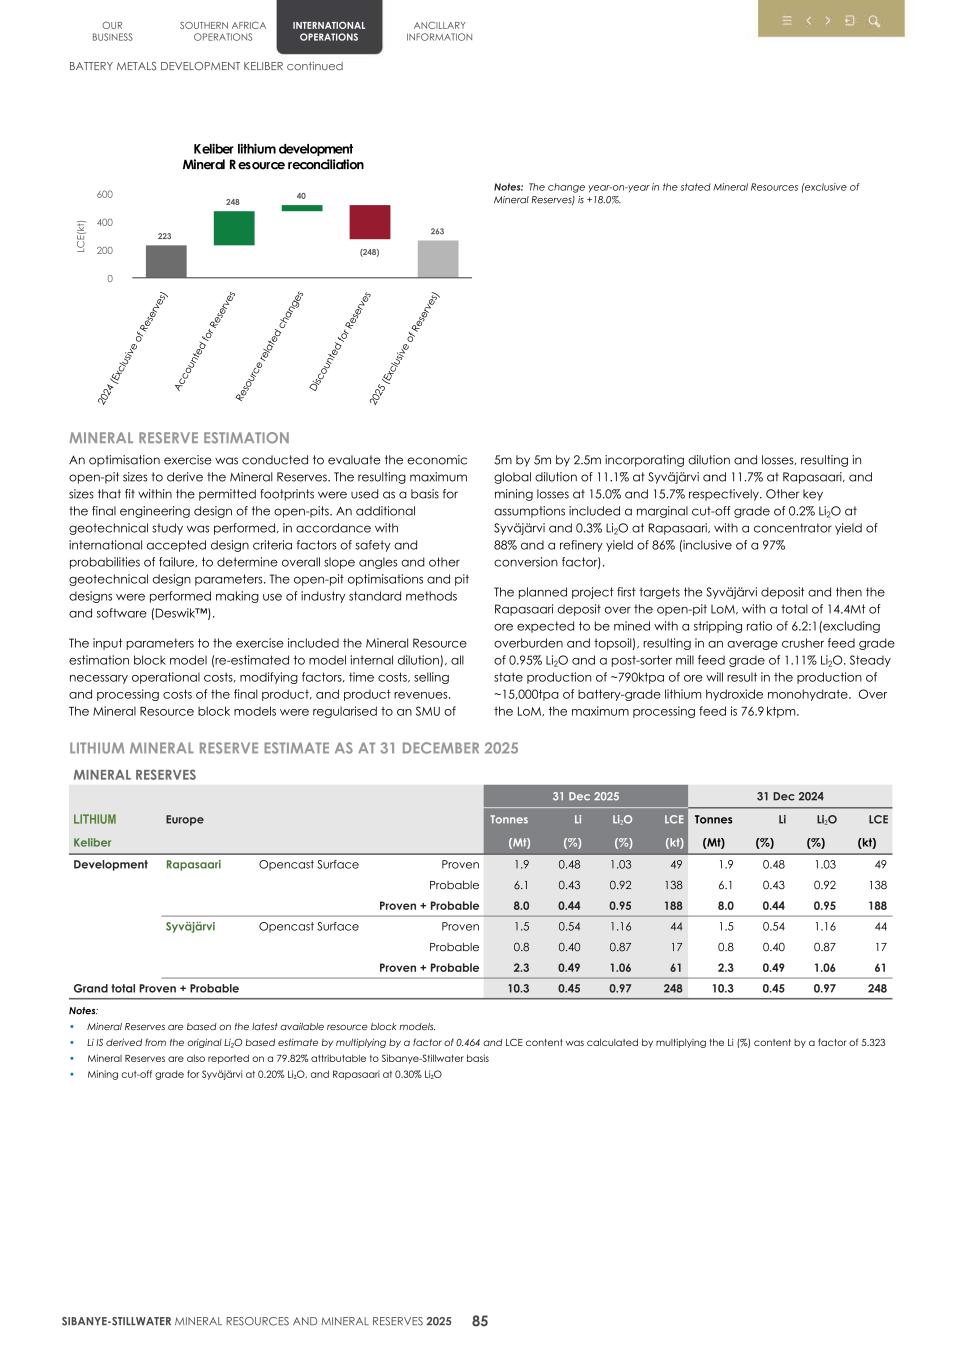
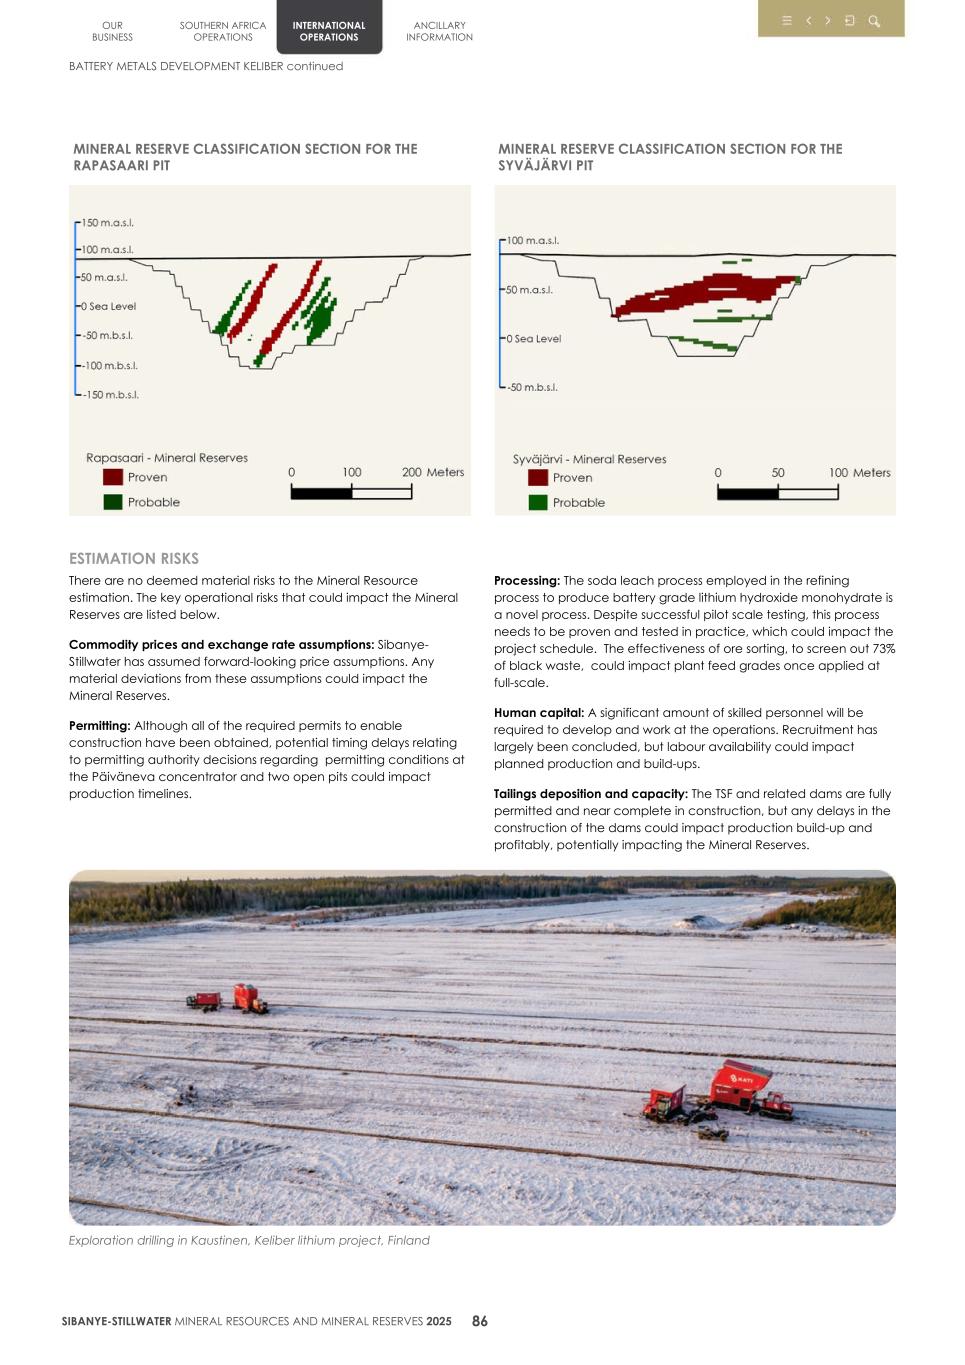
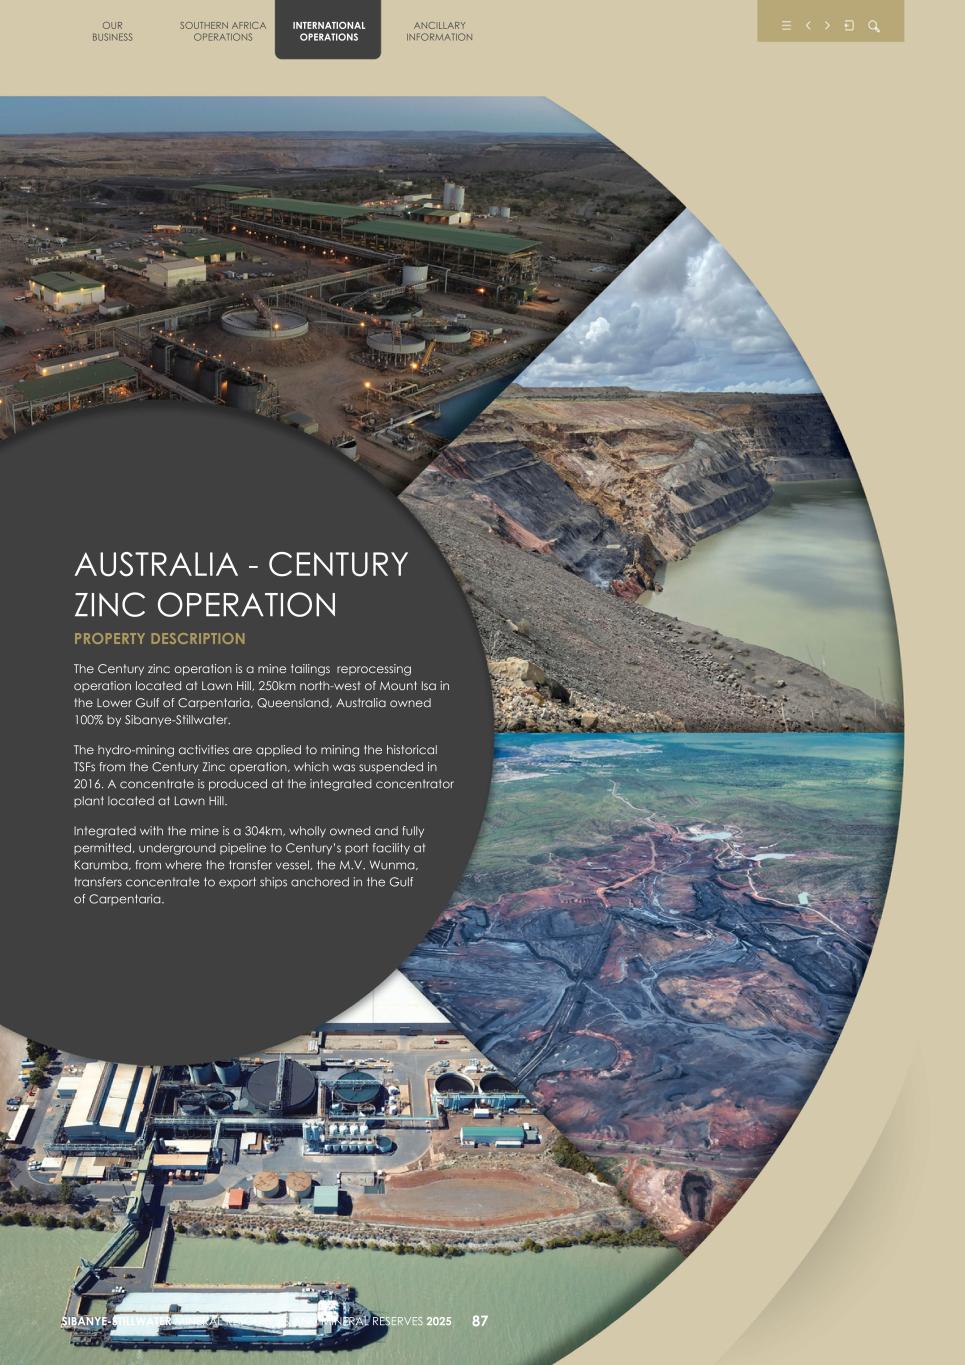
. OUR BUSINESS SOUTHERN AFRICA OPERATIONS INTERNATIONAL OPERATIONS ANCILLARY INFORMATION SIBANYE-STILLWATER MINERAL RESOURCES AND MINERAL RESERVES 2025 87 AUSTRALIA - CENTURY ZINC OPERATION PROPERTY DESCRIPTION The Century zinc operation is a mine tailings reprocessing operation located at Lawn Hill, 250km north-west of Mount Isa in the Lower Gulf of Carpentaria, Queensland, Australia owned 100% by Sibanye-Stillwater. The hydro-mining activities are applied to mining the historical TSFs from the Century Zinc operation, which was suspended in 2016. A concentrate is produced at the integrated concentrator plant located at Lawn Hill. Integrated with the mine is a 304km, wholly owned and fully permitted, underground pipeline to Century’s port facility at Karumba, from where the transfer vessel, the M.V. Wunma, transfers concentrate to export ships anchored in the Gulf of Carpentaria.
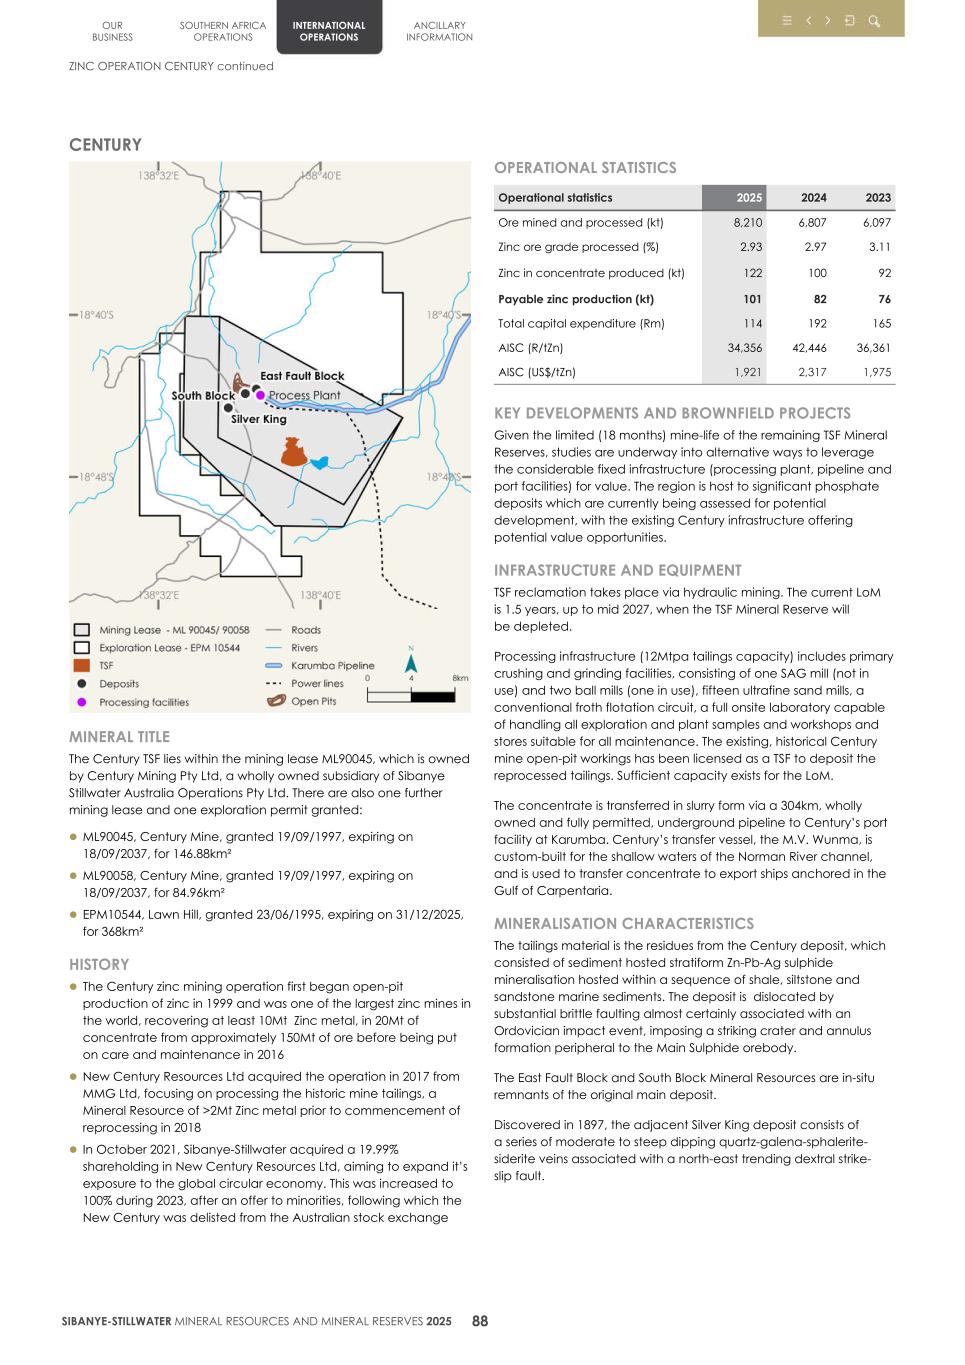
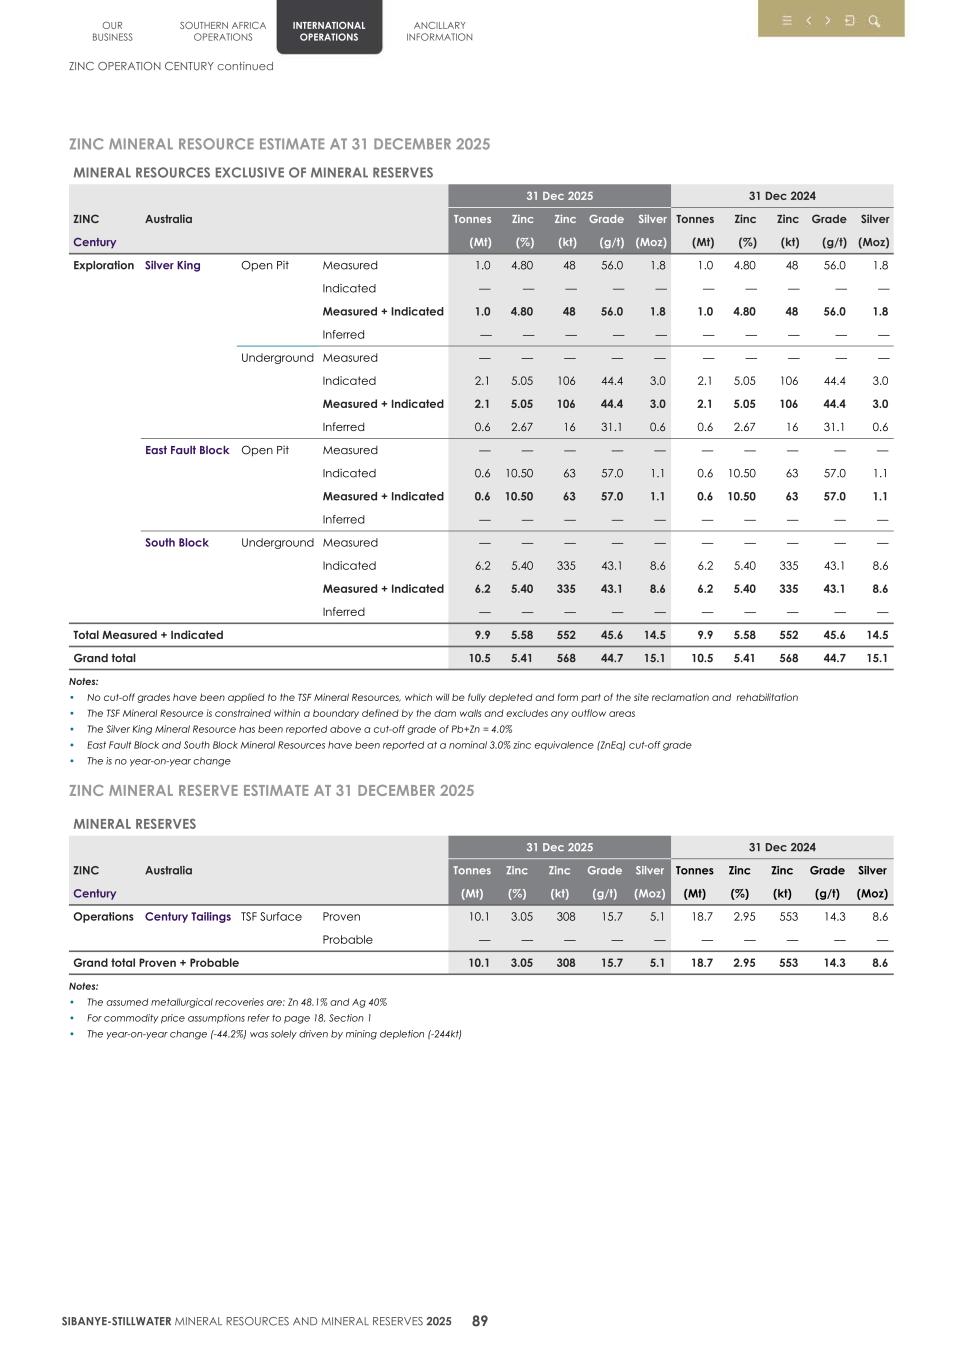
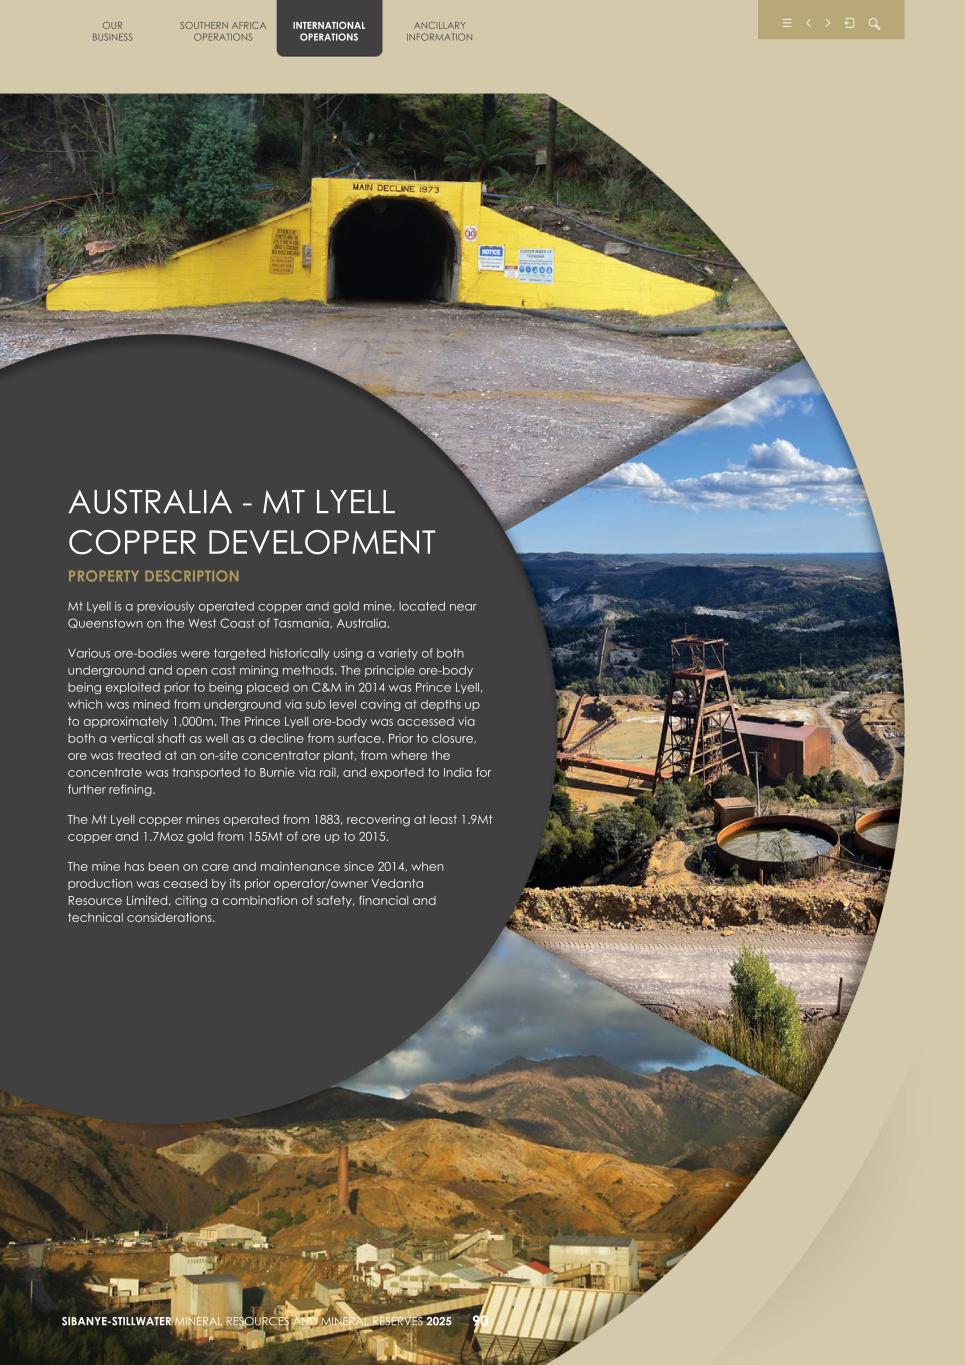
OUR BUSINESS SOUTHERN AFRICA OPERATIONS INTERNATIONAL OPERATIONS ANCILLARY INFORMATION SIBANYE-STILLWATER MINERAL RESOURCES AND MINERAL RESERVES 2025 90 AUSTRALIA - MT LYELL COPPER DEVELOPMENT PROPERTY DESCRIPTION Mt Lyell is a previously operated copper and gold mine, located near Queenstown on the West Coast of Tasmania, Australia. Various ore-bodies were targeted historically using a variety of both underground and open cast mining methods. The principle ore-body being exploited prior to being placed on C&M in 2014 was Prince Lyell, which was mined from underground via sub level caving at depths up to approximately 1,000m. The Prince Lyell ore-body was accessed via both a vertical shaft as well as a decline from surface. Prior to closure, ore was treated at an on-site concentrator plant, from where the concentrate was transported to Burnie via rail, and exported to India for further refining. The Mt Lyell copper mines operated from 1883, recovering at least 1.9Mt copper and 1.7Moz gold from 155Mt of ore up to 2015. The mine has been on care and maintenance since 2014, when production was ceased by its prior operator/owner Vedanta Resource Limited, citing a combination of safety, financial and technical considerations.
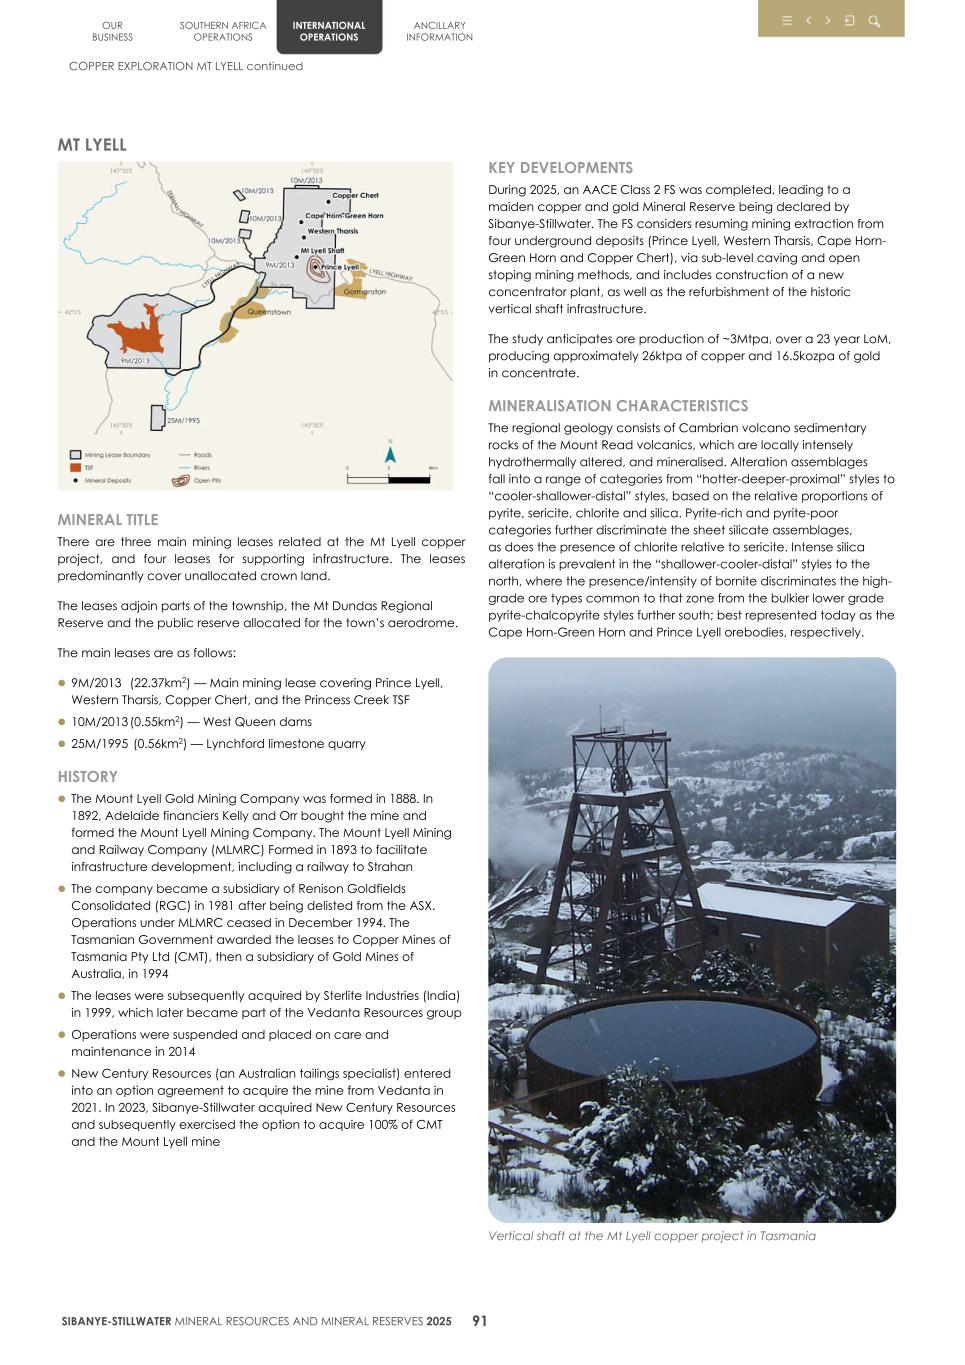
MT LYELL MINERAL TITLE There are three main mining leases related at the Mt Lyell copper project, and four leases for supporting infrastructure. The leases predominantly cover unallocated crown land. The leases adjoin parts of the township, the Mt Dundas Regional Reserve and the public reserve allocated for the town’s aerodrome. The main leases are as follows: l 9M/2013 (22.37km2) — Main mining lease covering Prince Lyell, Western Tharsis, Copper Chert, and the Princess Creek TSF l 10M/2013 (0.55km2) — West Queen dams l 25M/1995 (0.56km2) — Lynchford limestone quarry HISTORY l The Mount Lyell Gold Mining Company was formed in 1888. In 1892, Adelaide financiers Kelly and Orr bought the mine and formed the Mount Lyell Mining Company. The Mount Lyell Mining and Railway Company (MLMRC) Formed in 1893 to facilitate infrastructure development, including a railway to Strahan l The company became a subsidiary of Renison Goldfields Consolidated (RGC) in 1981 after being delisted from the ASX. Operations under MLMRC ceased in December 1994. The Tasmanian Government awarded the leases to Copper Mines of Tasmania Pty Ltd (CMT), then a subsidiary of Gold Mines of Australia, in 1994 l The leases were subsequently acquired by Sterlite Industries (India) in 1999, which later became part of the Vedanta Resources group l Operations were suspended and placed on care and maintenance in 2014 l New Century Resources (an Australian tailings specialist) entered into an option agreement to acquire the mine from Vedanta in 2021. In 2023, Sibanye-Stillwater acquired New Century Resources and subsequently exercised the option to acquire 100% of CMT and the Mount Lyell mine KEY DEVELOPMENTS During 2025, an AACE Class 2 FS was completed, leading to a maiden copper and gold Mineral Reserve being declared by Sibanye-Stillwater. The FS considers resuming mining extraction from four underground deposits (Prince Lyell, Western Tharsis, Cape Horn- Green Horn and Copper Chert), via sub-level caving and open stoping mining methods, and includes construction of a new concentrator plant, as well as the refurbishment of the historic vertical shaft infrastructure. The study anticipates ore production of ~3Mtpa, over a 23 year LoM, producing approximately 26ktpa of copper and 16.5kozpa of gold in concentrate. MINERALISATION CHARACTERISTICS The regional geology consists of Cambrian volcano sedimentary rocks of the Mount Read volcanics, which are locally intensely hydrothermally altered, and mineralised. Alteration assemblages fall into a range of categories from “hotter-deeper-proximal” styles to “cooler-shallower-distal” styles, based on the relative proportions of pyrite, sericite, chlorite and silica. Pyrite-rich and pyrite-poor categories further discriminate the sheet silicate assemblages, as does the presence of chlorite relative to sericite. Intense silica alteration is prevalent in the “shallower-cooler-distal” styles to the north, where the presence/intensity of bornite discriminates the high- grade ore types common to that zone from the bulkier lower grade pyrite-chalcopyrite styles further south; best represented today as the Cape Horn-Green Horn and Prince Lyell orebodies, respectively. Vertical shaft at the Mt Lyell copper project in Tasmania OUR BUSINESS SOUTHERN AFRICA OPERATIONS INTERNATIONAL OPERATIONS ANCILLARY INFORMATION COPPER EXPLORATION MT LYELL continued SIBANYE-STILLWATER MINERAL RESOURCES AND MINERAL RESERVES 2025 91
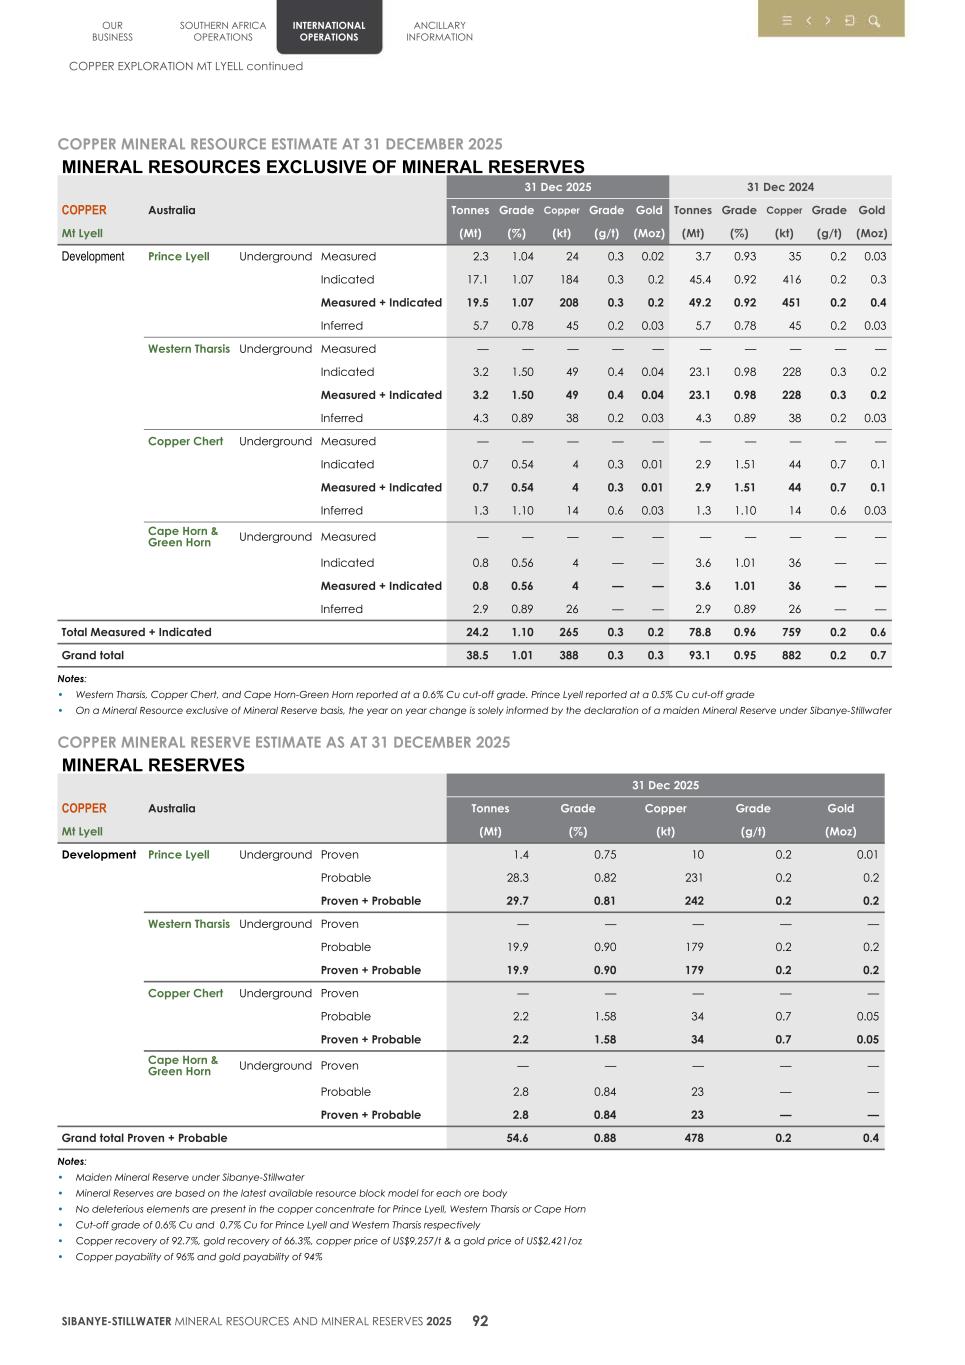
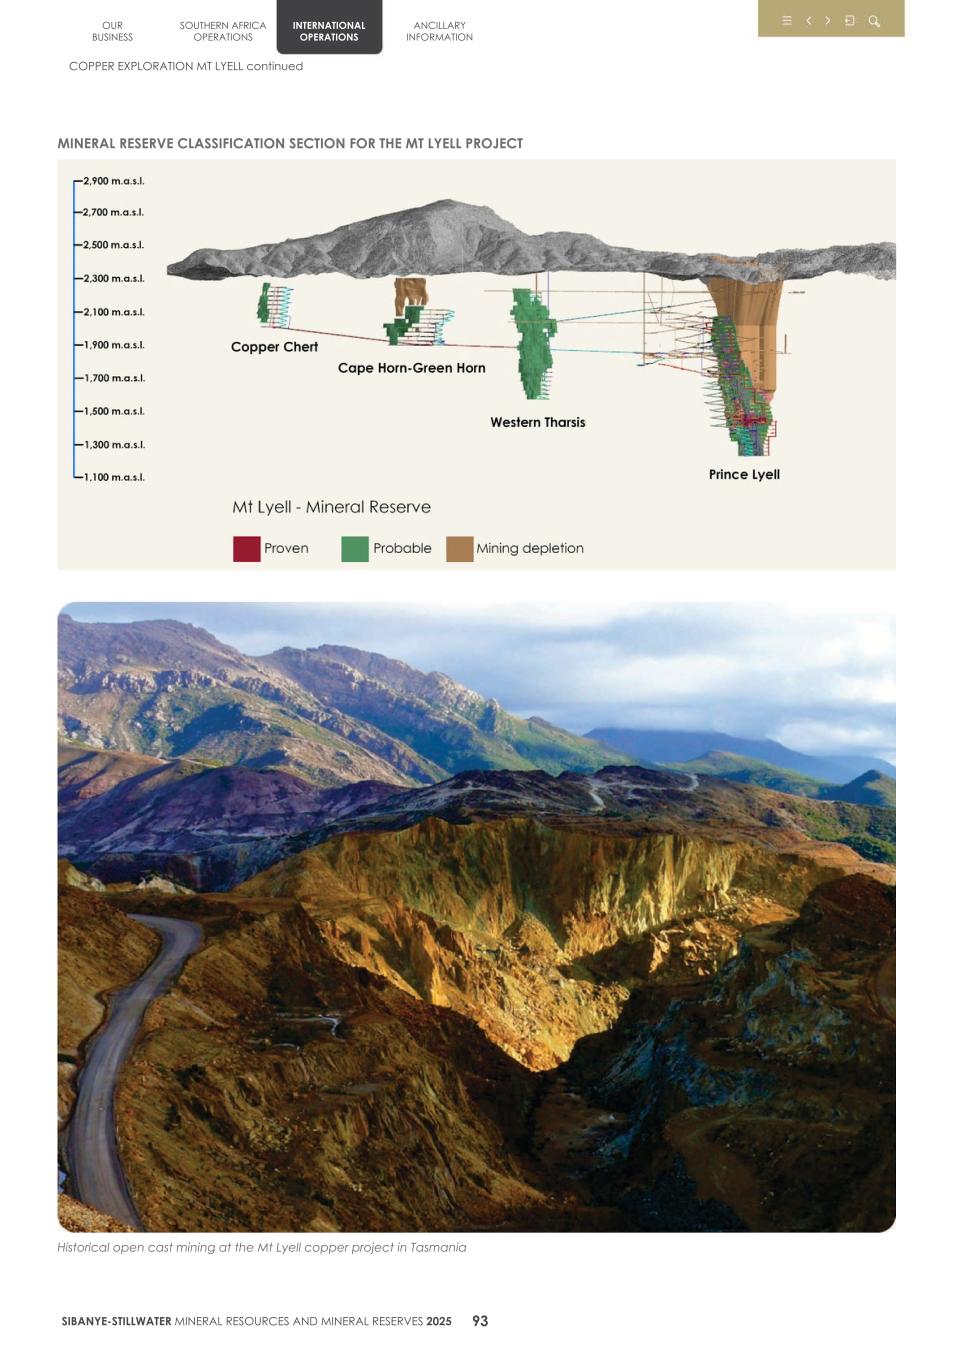
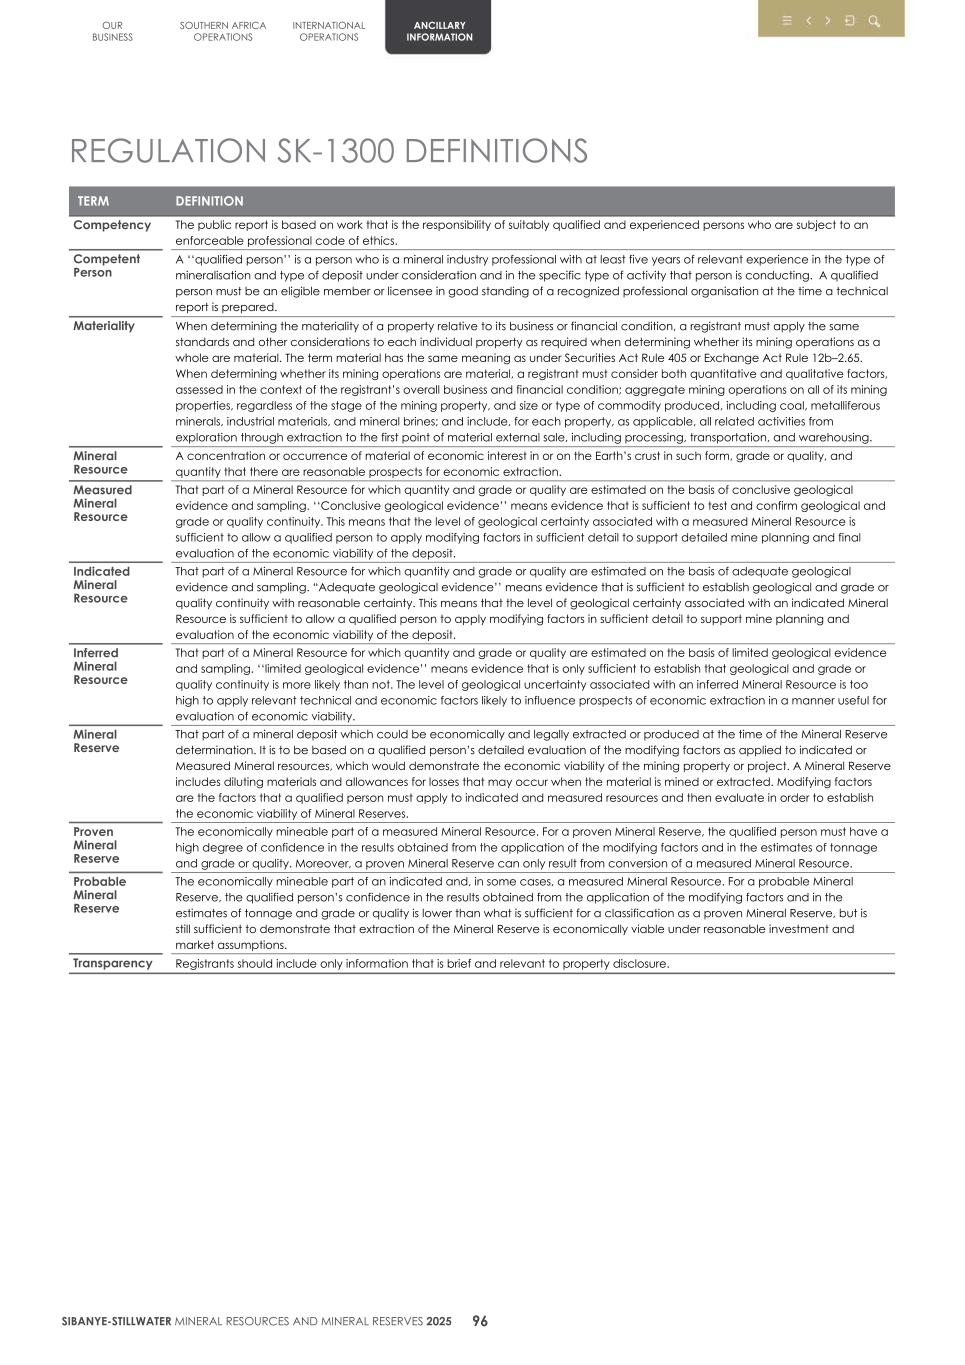
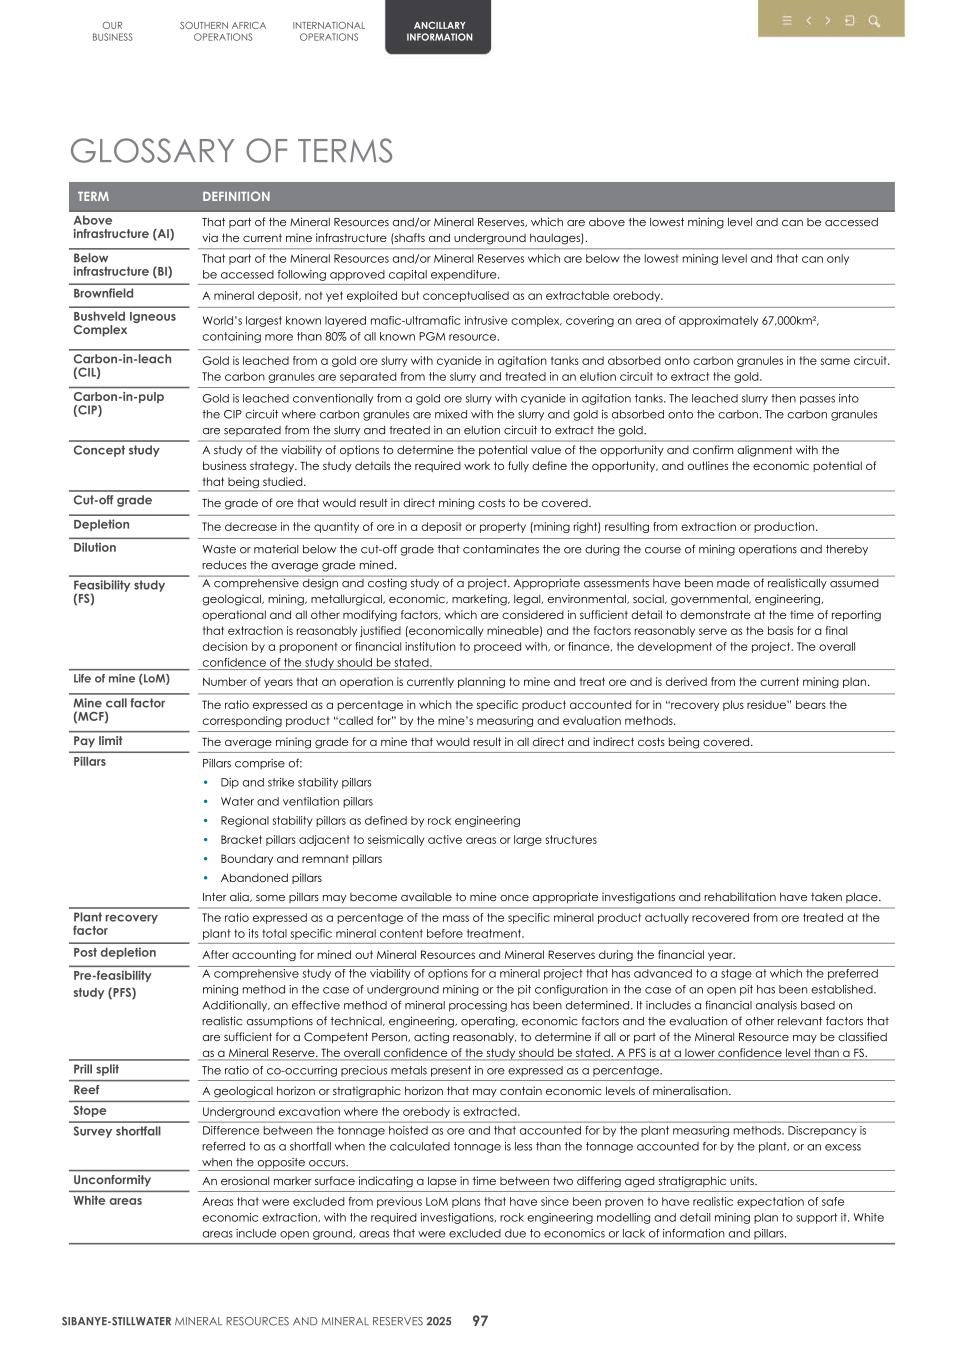
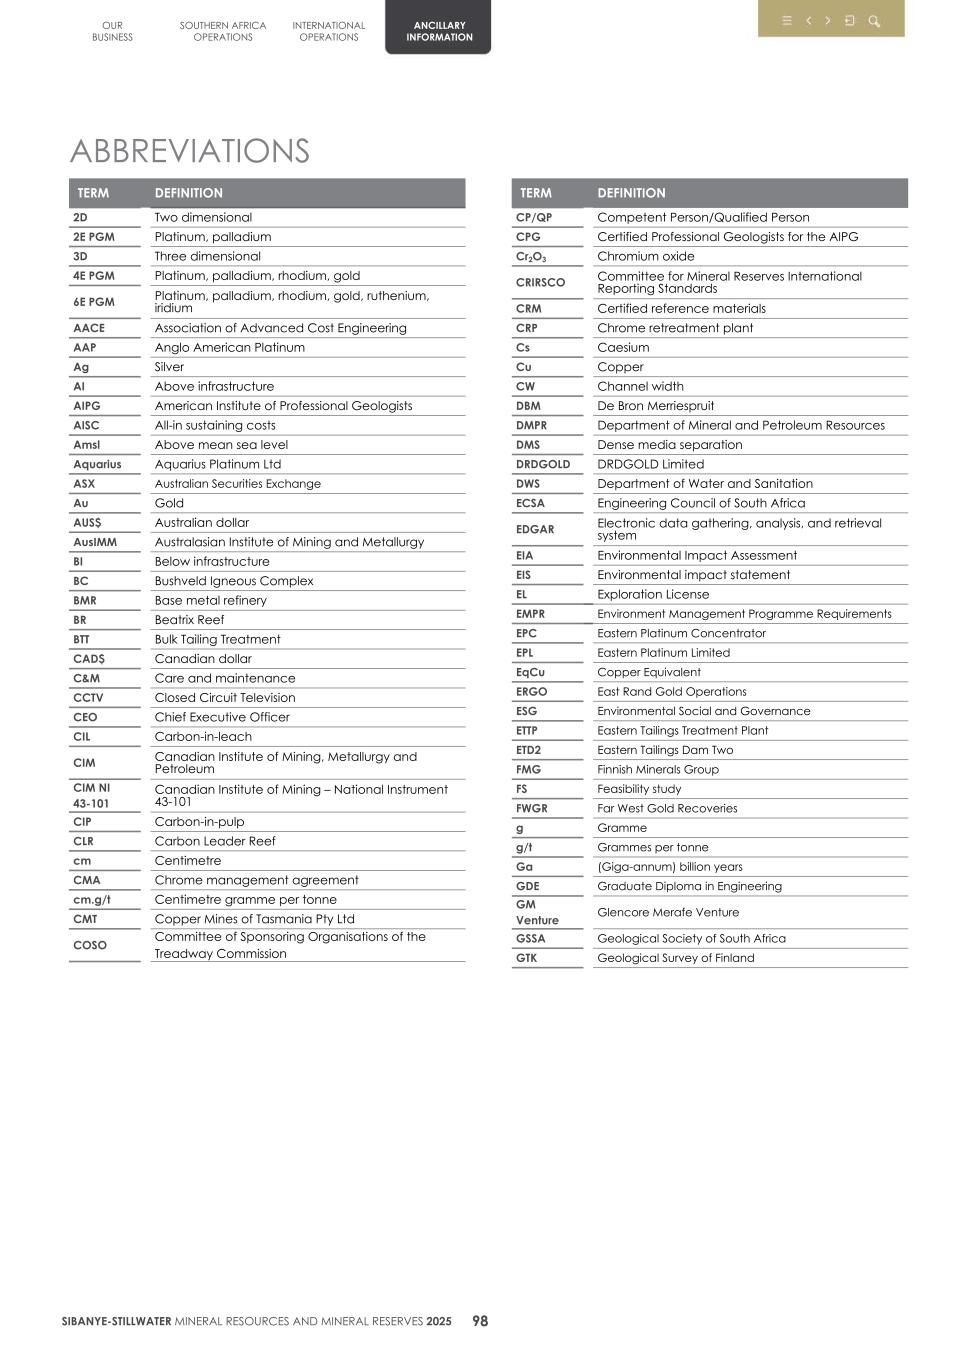
DISCLAIMER FORWARD-LOOKING STATEMENTS The information in this report may contain forward-looking statements within the meaning of the “safe harbour” provisions of the United States Private Securities Litigation Reform Act of 1995. These forward-looking statements, including, among others, those relating to Sibanye Stillwater Limited’s (Sibanye-Stillwater or the Group) financial positions, business strategies, business prospects, industry forecasts, production and operational guidance, climate and ESG-related targets and metrics, plans and objectives of management for future operations, are necessarily estimates reflecting the best judgment of the senior management and directors of Sibanye-Stillwater and involve a number of risks and uncertainties that could cause actual results to differ materially from those suggested by the forward-looking statements. As a consequence, these forward-looking statements should be considered in light of various important factors, including those set forth in this report. All statements other than statements of historical facts included in this report may be forward-looking statements. Forward-looking statements often use words such as “will”, “would”, “expect”, “forecast”, “potential”, “may”, “could”, “believe”, “aim”, “anticipate”, “target”, “estimate” and words of similar or comparable meaning. By their nature, forward-looking statements involve risk and uncertainty because they relate to future events and circumstances and should be considered in light of various important factors, including those set forth in this disclaimer. Readers are cautioned not to place undue reliance on such statements. The important factors that could cause Sibanye-Stillwater’s actual results, performance or achievements to differ materially from estimates or projections contained in the forward-looking statements include, without limitation, Sibanye-Stillwater’s future financial position, plans, strategies, objectives, capital expenditures, projected costs and anticipated cost savings, financing plans, debt position and ability to reduce debt leverage; economic, business, political and social conditions in South Africa, Zimbabwe, the United States, Europe and elsewhere; plans and objectives of management for future operations; Sibanye- Stillwater’s ability to obtain the benefits of any streaming arrangements or pipeline financing; the ability of Sibanye-Stillwater to comply with loan and other covenants and restrictions and difficulties in obtaining additional financing or refinancing; Sibanye-Stillwater’s ability to service its bond instruments; changes in assumptions underlying Sibanye-Stillwater’s estimation of its Mineral Resources and Mineral Reserves; any failure of a tailings storage facility; the ability to achieve anticipated efficiencies and other cost savings in connection with, and the ability to successfully integrate, past, ongoing and future acquisitions, as well as at existing operations; the ability of Sibanye-Stillwater to complete any ongoing or future acquisitions; the success of Sibanye-Stillwater’s business strategy and exploration and development activities, including any proposed, anticipated or planned expansions into the battery metals or adjacent sectors and estimations or expectations of enterprise value; the ability of Sibanye-Stillwater to comply with requirements that it operate in ways that provide progressive benefits to affected communities; changes in the market price of gold, silver, PGMs, battery metals (e.g., nickel, lithium, copper and zinc) and the cost of power, petroleum fuels, and oil, among other commodities and supply requirements; the occurrence of hazards associated with underground and surface mining; any downgrade of South Africa’s credit rating; a challenge regarding the title to any of Sibanye-Stillwater’s properties by claimants to land under restitution and other legislation; Sibanye-Stillwater’s ability to implement its strategy and any changes thereto; the outcome of legal challenges to the Group’s mining or other land use rights; the occurrence of labour disputes, disruptions and industrial actions; the availability, terms and deployment of capital or credit; changes in the imposition of industry standards, regulatory costs and relevant government regulations, particularly environmental, sustainability, tax, health and safety regulations and new legislation affecting water, mining, mineral rights and business ownership, including any interpretation thereof which may be subject to dispute; the outcome and consequence of any potential or pending litigation or regulatory proceedings, including in relation to any environmental, health or safety issues; failure to meet ethical standards, including actual or alleged instances of fraud, bribery or corruption; the effect of climate change or other extreme weather events on Sibanye- Stillwater’s business; the concentration of all final refining activity and a large portion of Sibanye-Stillwater’s PGM sales from mine production in the United States with one entity; the identification of a material weakness in disclosure and internal controls over financial reporting; the effect of US tax reform legislation on Sibanye-Stillwater and its subsidiaries; the effect of South African Exchange Control Regulations on Sibanye-Stillwater’s financial flexibility; operating in new geographies and regulatory environments where Sibanye-Stillwater has no previous experience; power disruptions, constraints and cost increases; supply chain disruptions and shortages and increases in the price of production inputs; the regional concentration of Sibanye-Stillwater’s operations; fluctuations in exchange rates, currency devaluations, inflation and other macro-economic monetary policies; the occurrence of temporary stoppages or precautionary suspension of operations at its mines for safety or environmental incidents (including natural disasters) and unplanned maintenance; Sibanye-Stillwater’s ability to hire and retain senior management and employees with sufficient technical and/or production skills across its global operations necessary to meet its labour recruitment and retention goals, as well as its ability to achieve sufficient representation of historically disadvantaged South Africans in its management positions, or maintain required board gender diversity; failure of Sibanye-Stillwater’s information technology, communications and systems; the adequacy of Sibanye-Stillwater’s insurance coverage; social unrest, sickness or natural or man-made disaster in surrounding mining communities, including informal settlements in the vicinity of some of Sibanye-Stillwater’s South African-based operations; and the impact of contagious diseases, including global pandemics. Further details of potential risks and uncertainties affecting Sibanye-Stillwater are described in Sibanye-Stillwater’s filings with the Johannesburg Stock Exchange and the United States Securities and Exchange Commission, including the 2025 Integrated Report and the Annual Financial Report for the fiscal year ended 31 December 2025 on Form 20-F filed with the United States Securities and Exchange Commission on 24 April 2026 (SEC File no. 333-234096). These forward-looking statements speak only as of the date of the content. Sibanye-Stillwater expressly disclaims any obligation or undertaking to update or revise any forward-looking statement (except to the extent legally required). These forward-looking statements have not been reviewed or reported on by the Group’s external auditors. NON-IFRS1 MEASURES The information contained in this report may contain certain non-IFRS measures, including, among others, adjusted EBITDA, notional free cash flow, AISC, AIC, and normalised earnings. These measures may not be comparable to similarly-titled measures used by other companies and are not measures of Sibanye-Stillwater’s financial performance under IFRS Accounting Standards. These measures should not be considered in isolation or as a substitute for measures of performance prepared in accordance with IFRS Accounting Standards. Sibanye-Stillwater is not providing a reconciliation of the forecast non-IFRS financial information presented in this report because it is unable to provide this reconciliation without unreasonable effort. The forecast non-IFRS financial information presented has not been reviewed or reported on by the Group’s external auditors. 1 IFRS refers to
International Financial Reporting Standards Accounting Standards (IFRS Accounting Standards) as issued by the International Accounting Standards Board (IASB) MINERAL RESOURCES AND MINERAL RESERVES Sibanye-Stillwater’s Mineral Resources and Mineral Reserves are estimates at a particular date, and are affected by fluctuations in mineral prices, the exchange rates, operating costs, mining permits, changes in legislation and operating factors. Sibanye-Stillwater reports its Mineral Resources and Mineral Reserves in accordance with the rules and regulations promulgated by each of the United States Securities and Exchange Commission (SEC) and the JSE at all managed operations, development, and exploration properties. WEBSITES References in this document to information on websites (and/or social media sites) are included as an aid to their location and such information is not incorporated in, and does not form part of, this report. OUR BUSINESS SOUTHERN AFRICA OPERATIONS INTERNATIONAL OPERATIONS ANCILLARY INFORMATION SIBANYE-STILLWATER MINERAL RESOURCES AND MINERAL RESERVES 2025 101
ADMINISTRATION AND CORPORATE INFORMATION SIBANYE STILLWATER LIMITED (SIBANYE-STILLWATER) Incorporated in the Republic of South Africa Registration number 2014/243852/06 Share code: SSW and SBSW Issuer code: SSW ISIN: ZAE000259701 LISTINGS JSE: SSW NYSE: SBSW WEBSITE www.sibanyestillwater.com REGISTERED AND CORPORATE OFFICE Constantia Office Park Bridgeview House, Building 11, Ground floor Cnr 14th Avenue & Hendrik Potgieter Road Weltevreden Park 1709 South Africa Private Bag X5 Westonaria 1780 South Africa Tel: +27 11 278 9600 Fax: +27 11 278 9863 COMPANY SECRETARY LERATO MATLOSA Email: lerato.matlosa@sibanyestillwater.com DIRECTORS Dr Vincent Maphai* (Chairman) Dr Richard Stewart (CEO)+ Charl Keyter (CFO) Dr Elaine Dorward-King* Harry Kenyon-Slaney* ^ Prof Jeremiah Vilakazi# Dr Lindiwe Mthimunye++ Keith Rayner# Dr Peter Hancock* Philippe Boisseau* Richard Menell# Dr Sindiswa Zilwa* Dr Terence Nombembe* Timothy Cumming# * Independent non-executive # Non-executive ^ Lead independent director + Appointed as executive director 1 March 2025 and as CEO on 1 October 2025 ++ Appointed as independent non-executive director 26 August 2025 INVESTOR ENQUIRIES JAMES WELLSTED Executive Vice President: Investor Relations and Corporate Affairs Mobile: +27 83 453 4014 Email: james.wellsted@sibanyestillwater.com or ir@sibanyestillwater.com JSE SPONSOR J.P. MORGAN EQUITIES SOUTH AFRICA PROPRIETARY LIMITED Registration number 1995/011815/07 1 Fricker Road, Illovo Johannesburg 2196 South Africa Private Bag X9936 Sandton 2146 South Africa AUDITORS BDO Wanderers Office Park 52 Corlett Drive Illovo 2196 Private Bag X60500 Houghton 2041 South Africa Tel: +27 11 488 1700 AMERICAN DEPOSITARY RECEIPTS TRANSFER AGENT BNY MELLON SHAREOWNER CORRESPONDENCE (ADSS) Mailing address of agent: Computershare PO Box 43078 Providence, RI 02940-3078 Overnight/certified/registered delivery: Computershare 150 Royal Street, Suite 101 Canton, MA 02021 US toll free: + 1 888 269 2377 Tel: +1 201 680 6825 Email: shrrelations@cpushareownerservices.com TATYANA VESSELOVSKAYA Relationship Manager - BNY Mellon Depositary Receipts Email: tatyana.vesselovskaya@bnymellon.com TRANSFER SECRETARIES SOUTH AFRICA COMPUTERSHARE INVESTOR SERVICES PROPRIETARY LIMITED Rosebank Towers 15 Biermann Avenue Rosebank 2196 PO Box 61051 Marshalltown 2107 South Africa Tel: +27 11 370 5000 Fax: +27 11 688 5248 FORMS OF PROXY TO MEETING SCRUTINEERS The Meeting Specialist Proprietary Limited JSE Building One Exchange Square 2 Gwen Lane Sandown Sandton, 2196 South Africa CONTACT Farhana Adam Tel: +27 84 433 4836 Izzy van Schoor Tel: +27 81 711 4255 Michael Wenner Tel: +27 61 440 0654 e-mail: proxy@tmsmeetings.co.za OUR BUSINESS SOUTHERN AFRICA OPERATIONS INTERNATIONAL OPERATIONS ANCILLARY INFORMATION SIBANYE-STILLWATER MINERAL RESOURCES AND MINERAL RESERVES 2025 102
RSA GENERIC MINING PERMIT CONDITIONS The following is an extract of the key, generic Mining Permit conditions, as applicable to the South African operations. 1. Mining right renewal applications are to be submitted 60 working days prior to the date of expiry of the right 2. The holder of a MR must continue with mining operations, failing which the right may be suspended or cancelled 3. The terms of the right may not be varied or amended without the consent of the Minister of Mineral and Petroleum Resources 4. The Holder shall be entitled to abandon or relinquish the right of the area covered by the right entirely or in part. Upon abandonment or relinquishment the Holder must: a. Furnish the Regional Manager with all prospecting and/or mining results and/or information, as well as the general evaluation of the geological, geophysical and borehole data in respect of such abandoned area; and b. Apply for a closure certificate in terms of Section 43(3) of the MPRDA 5. The holder shall pay royalties to the State in accordance with Section 25(2)g of the MPRDA throughout the duration of the mining right 6. Mining operations must be conducted in accordance with the Mining Work Programme (MWP) and any amendment to the MWP and an approved Environmental Management Plan (EMP) or Environmental Authorisation (EA) 7. The holder shall not trespass or enter into any homestead, house or its curtilage, nor interfere with or prejudice the interests of the occupiers and/or owners of the surface of the mining right area except to the extent to which such interference or prejudice is necessary for the purposes of enabling the holder to properly exercise the holder’s rights under the mining right 8. The holder must dispose of all minerals derived from mining at competitive market prices which shall mean in all cases, non- discriminatory prices or non-export parity prices 9. A shareholding, an equity, an interest or participation in the mining right or joint venture, or a controlling interest in a company/JV may not be encumbered, ceded, transferred, mortgaged, let, sublet, assigned, alienated or otherwise disposed of without the written consent of the Minister, except in the case of a change of controlling interest in listed companies 10. All boreholes, shafts, adits, excavations and openings created by the holder shall be sealed, closed, fenced and made safe in accordance with the approved EMP and the Mine Health and Safety Act 11. The holder of the mining right, while carrying out mining operations, should safeguard and protect the environment, the mining area and any person using or entitled to use the surface of the mining area from possible damage or injury 12. The Minister or a person authorised by the Minister shall be entitled to inspect the mining area and the execution of the approved mining right conditions 13. A mining right may be cancelled or suspended subject to Section 47 of the MPRDA if the holder: a. Submits inaccurate, incorrect and/or misleading information in connection with any matter required to be submitted under this act b. Fails to honour or carry out any agreement, arrangement or undertaking, including the undertaking made by the holder in terms of the Broad-Based Socio-Economic Empowerment Charter and Social and Labour Plan c. Breaches any material term and condition of the mining right d. Conducts mining in contravention of the MPRDA e. Contravenes the requirements of the approved EMP f. Contravenes any provisions of this act in any other manner 15. The Holder shall submit monthly returns contemplated in Section 28(2) of the MPRDA no later than the 15th of every month, and maintain all such books, plans and records in regard to mining of the mining area as may be required by the act 16. The holder shall, at the end of each year, following commencement of this mining right, inform the Regional Manager in writing of any new developments and of the future mining activities planned in connection with the exploitation/ mining of the minerals in the mining area 17. Provisions relating to Section 2(d) and Section 2(f) of the MPRDA, relating to the Broad-Based Socio-Economic Empowerment Charter differs in each mining right 18. The mining right does not exempt the holder from complying with the MHSA or any act in South Africa 19. The holder shall, annually, no later than three months before financial year end, submit a detailed implementation plan to give effect to Regulation 46(e)(i), (ii) and (iii) in line with the Social and Labour Plan 20. The holder shall, annually, no later than three months after finalization of its audited annual report, submit a detailed report on the implementation of the previous year’s SLP SLP COMPLIANCE REQUIREMENTS 1. A new Social and Labour Plan is to be submitted and reviewed every 5 years 2. Social and Labour Plan implementation plans must be submitted annually 3. A Social and Labour Plan report is to be submitted annually ENVIRONMENTAL MANAGEMENT COMPLIANCE REQUIREMENTS 1. A performance assessment relating to the EMP is to be conducted biannually or according to the conditions of the approved EMP/EA 2. A performance assessment relating to the Water Use License is to be conducted annually 3. A performance assessment relating to the Atmospheric Emission License is to be conducted annually OUR BUSINESS SOUTHERN AFRICA OPERATIONS INTERNATIONAL OPERATIONS ANCILLARY INFORMATION SIBANYE-STILLWATER MINERAL RESOURCES AND MINERAL RESERVES 2025 103

www.sibanyestillwater.com
RISK FACTORS
In addition to the other information included in this annual report, the considerations listed below could have a material adverse effect on
Sibanye-Stillwater’s business, operating results and financial condition, resulting in a decline in the trading price of Sibanye-Stillwater’s
ordinary shares or American Depositary Shares (ADSs). The risks set forth below comprise the material risks currently known to us. These factors
should be considered carefully, together with the information and financial data set forth in this document.
Risk Factors Summary
The risks which could have a material effect on Sibanye-Stillwater have been classified into six categories. The following is an outline of the
key risks within these categories:
Risks related to environmental, social and corporate governance (ESG)
•Mining is inherently hazardous and the related events that cause disruptions to Sibanye-Stillwater’s mining operations could result in
increased production costs, financial and regulatory liabilities and reputational damage
•Sibanye-Stillwater’s operations are subject to extensive environmental, social and health and safety regulations, which could
impose additional costs and compliance requirements, and Sibanye-Stillwater has faced, and may face further, claims and liability
for breaches, or alleged breaches, of such regulations and other applicable laws
•The failure of a tailings storage facility (TSF) could negatively impact Sibanye-Stillwater’s business, reputation, operating results and
financial condition
•Sibanye-Stillwater’s operations are subject to water use and wastewater regulations, which could impose significant costs and
burden
•Social unrest, including the risk of service delivery protests, sickness or natural or man-made disasters in surrounding mining
communities, including informal settlements in the vicinity of some of Sibanye-Stillwater’s South African-based operations may
disrupt its business or may lead to greater social or regulatory impositions on Sibanye-Stillwater
•The failure of Sibanye-Stillwater’s information, communication or technology platforms or application systems, or the failure to
protect sensitive commercial or personal data, could significantly impact Sibanye-Stillwater’s operations and business
Legal, regulatory and compliance risks
•If Sibanye-Stillwater is unable to implement and maintain an effective system of internal control over financial reporting, it may be
unable to accurately report its results of operations, meet its reporting obligations or prevent fraud
•Sibanye-Stillwater’s mining rights are subject to legislation, which could impose significant costs and burdens and which impose
certain ownership requirements, the interpretation of which may be the subject of dispute
•Title to Sibanye-Stillwater’s properties may be subject to challenge
•If Sibanye-Stillwater loses senior or regional management or is unable to hire and/or retain sufficient technically skilled employees in
any of its regions or sufficient historically disadvantaged persons (HDPs) representation in management positions in South Africa, or
maintain required board gender diversity, Sibanye-Stillwater’s business may be materially adversely affected
•Sibanye-Stillwater is subject to risks associated with litigation and regulatory proceedings
Risks Related to Production Delivery from Operations
•Energy shortages, load curtailment (including the risk of a total blackout) and usage constraints may force Sibanye-Stillwater to
reduce or halt operations
•Economic, political or social factors affecting the regions where Sibanye-Stillwater operates may have a material adverse effect
on Sibanye-Stillwater’s operations and profits
•Due to the mature infrastructure at Sibanye-Stillwater’s mining operations, unplanned breakdowns, statutory mandated
modifications and stoppages may result in production delays, increased costs and industrial accidents
•Sibanye-Stillwater’s operations and profits have been and may be adversely affected by labour unrest and union activity
•Actual and potential supply chain shortages and increases in the prices of production inputs may have a material adverse effect
on Sibanye-Stillwater’s operations and profit
•Sibanye-Stillwater’s mineral reserves and mineral resources are estimates at a specific point in time, based on a number of
technical and economic assumptions, which, if changed, may require Sibanye-Stillwater to lower the estimated mineral reserves
and mineral resources and may not be replaced as depleted
Risks Related to Earnings Delivery
•Changes in the market price for gold, silver, PGMs, zinc and lithium and related by-products may affect the profitability of Sibanye-
Stillwater’s major capital projects, recycling, mining and refining operations and the cash flows generated by those operations
•Because gold and PGMs are generally sold in US dollars, while the majority of Sibanye-Stillwater’s gold production and a
substantial amount of Sibanye-Stillwater’s PGM production costs are denominated in rand, Sibanye-Stillwater’s operating results
and financial condition will be materially affected if there is a material change in the value of the rand
•Sibanye-Stillwater has a large amount of indebtedness. Failure to comply with its debt covenants or difficulties in obtaining
necessary financing could have a material adverse effect on its business, operating results and financial condition
•Depressed or volatile commodity prices may impact Sibanye-Stillwater’s ability to implement its business strategy, fund capital
expenditures and obtain financing
Strategic Risks
•To the extent that Sibanye-Stillwater seeks to further expand its existing mining operations, it may experience challenges
associated with mineral exploration or development of mining projects
•Sibanye-Stillwater’s future growth may not deliver anticipated outcomes in the timeframe anticipated or at all
•Sibanye-Stillwater’s business may be harmed if it fails to adapt to technological advances, including artificial intelligence and
other emerging technologies, in a timely and cost-effective manner, which may be complicated by an uncertain regulatory
environment
Risks related to Sibanye-Stillwater’s shares and ADSs
•Sibanye-Stillwater’s non-South African shareholders may face additional investment risk from currency exchange rate fluctuations
since any dividends will be paid in rand
•Sibanye-Stillwater may not pay dividends or make similar payments to its shareholders in the future due to various factors and any
dividend payments made may be subject to withholding tax
Risks related to ESG
Mining is inherently hazardous and the related events that cause disruptions to Sibanye-Stillwater’s mining operations could result in
increased production costs, financial and regulatory liabilities and reputational damage
Mining by its nature involves significant risks and hazards, including environmental hazards, as well as industrial and mining incidents. These
include, for example, seismic events, heat, unusual or unexpected rock formations affecting ore or rock characteristics, ground or slope
failures, rock bursts, sink holes, fires, falls of ground and blockages, flooding, discharges of gasses and toxic substances, contamination of
water, air or soil resources, radioactivity and other incidents or conditions resulting from mining activities including, among other things, shaft
and infrastructure incidents, machinery related incidents, unplanned detonation of explosives, blasting and the transport, loading, storage
and handling of hazardous and other materials.
Sibanye-Stillwater has experienced and continues to remain at risk of experiencing such events, which have and may continue to result in
work stoppages, the precautionary suspension of operations, serious injury and loss of life, including as a result of unauthorised access to its
properties and illegal mining. Sibanye-Stillwater is more susceptible than other mining operations, particularly at its South African operations,
to certain of these risks due to mining at depth. In 2025, Sibanye-Stillwater recorded several safety incidents, including 5 fatalities at its South
African operations and 1 fatality at its United States operations, following which certain of its operations were temporarily suspended. Any
future such incidents could have a material adverse effect on Sibanye-Stillwater’s business, operating results and financial condition.
Seismic activity is of particular concern in the underground mining environment, particularly in South Africa, as a consequence of the extent
and depth of mining. Seismic events have previously caused death and injury to employees and contractors and can result in safety-related
stoppages and impact production. For example, seismicity reduced the mineable area at Driefontein and Kloof in 2023 and 2024, resulting in
reduced production, and in 2025, seismic events disrupted certain work areas and influenced the planning of prospective mining areas at
both operations. At the Kloof operations, seismic activity in 2025 and related geotechnical safety considerations led to the cessation of
mining in certain high-risk areas and the deliberate exclusion of isolated high-grade, high-risk mining areas, resulting in material
underperformance against the operational plan and a reduction in the life of mine from eight years to one year. Seismic activity has also
caused a loss of mining equipment, damage to and destruction of mineral properties and production facilities, monetary losses,
environmental damage and potential legal liabilities. Mining activity may also result in heat-related incidents, which has and could continue
to lead to employee injuries or fatalities, the suspension of operations and mine closures, and could negatively impact planned production
levels.
In addition, Sibanye-Stillwater enters into joint venture and other arrangements wherein it does not control or participate in the day-to-day
operations of certain mines in which it has an interest. If these third parties experience material safety incidents, disruptions and/or fail to
meet rigorous safety requirements, Sibanye-Stillwater’s reputation, business, operating results and financial condition may be materially and
adversely affected.
Furthermore, there are risks that relevant regulators, such as the DMPR in South Africa and the Mine Safety and Health Administration (MSHA)
or the US Occupational Safety and Health Administration (OSHA) in the United States, may impose fines and work stoppages (known as
section 54 stoppages in South Africa (Section 54) and “k-orders” in the United States). This could reduce or halt production, increase
production costs and result in financial and regulatory liability for Sibanye-Stillwater, which could have a material adverse effect on its
business, operating results and financial condition. For example, Sibanye-Stillwater operated at reduced capacity under a k-order following
a fatal incident in November 2023. See also – Sibanye-Stillwater’s operations are subject to extensive environmental, social and health and
safety regulations, which could impose additional costs and compliance requirements, and Sibanye-Stillwater has faced, and may face
further, claims and liability for breaches, or alleged breaches, of such regulations and other applicable laws.
Sibanye-Stillwater’s operations are subject to extensive environmental, social and health and safety regulations, which could impose
additional costs and compliance requirements, and Sibanye-Stillwater has faced, and may face further, claims and liability for breaches, or
alleged breaches, of such regulations and other applicable laws
Sibanye-Stillwater’s operations are subject to extensive environmental, social and health and safety laws, regulations, permitting
requirements and standards in the jurisdictions in which it operates. These regulations oversee, among other things, the protection of the
environment, pollution, water management, waste disposal, occupational health and safety, including mine safety, toxic substances, the
management and sustainable closure of operations, and protection of endangered and other special status species.
The principal legislative frameworks that govern such matters include the Mineral and Petroleum Resources Development Act, 2002
(MPRDA), the National Environmental Management Act, 1998 (Act No. 107 of 1998) (NEMA), the National Water Act, 1998 (Act No. 36 of
1998) (NWA), the National Environmental Management Laws Amendment Act, 2022 (Act No. 2 of 2022) (NEMLAA), the National
Environmental Management: Air Quality Act, 2004 (Act No. 39 of 2004) (Air Quality Act), the National Environmental Management: Waste
Act, 2008 (Act No. 59 of 2008) (Waste Act), the National Heritage Resources Act (Act No. 25 of 1999) (National Heritage Resources Act), the
National Environmental Management: Biodiversity Act (Act No. 10 of 2004) (the Biodiversity Act) and the National Nuclear Regulatory Act
(Act No 47 of 1999) (NNR Act), amongst others, in South Africa, as well as the Clean Air Act (Clean Air Act), the Federal Water Pollution
Control Act (Clean Water Act), the Toxic Substances Control Act (TSCA), the Resource Conservation and Recovery Act (RCRA), the
Emergency Planning and Community Right-to-Know Act (EPCRA), the Endangered Species Act (Endangered Species Act), the National
Environmental Policy Act (NEPA), the Comprehensive Environmental Response, Metals Mines Reclamation Act, the Compensation and
Liability Act (CERCLA) and analogous state laws in the United States as well as the regulatory regimes and applicable permit stipulations
across all of the jurisdictions where Sibanye-Stillwater operates, including Finland, France and Australia.
Sibanye-Stillwater may also be subject to new rules, regulations and frameworks with respect to ESG-related disclosures by virtue of its
operations and the public listing of its securities, such as the proposed Corporate Sustainability Due Diligence Directive (CSDDD) and the
Corporate Sustainability Reporting Directive (CSRD) in the EU and the IFRS sustainability disclosure standards issued by the International
Sustainability Standards Board (ISSB), as well as increasing investor expectations with respect to ESG-related disclosures. Complying with such
requirements and/or market expectations, which may vary or conflict across jurisdictions, may require Sibanye-Stillwater to expend
significant time and resources, and may subject it to heightened exposure to claims that certain of its ESG disclosures are misleading or
overstate potential ESG benefits. This may also result in increased litigation risk from private parties and governmental authorities related to its
emissions reduction or other ESG efforts.
In addition to laws and regulatory requirements, Sibanye-Stillwater is party to environmental and social collaborations with local communities
and interest groups, such as the Good Neighbor Agreement (GNA) in the United States, Social and Labour Plans (SLPs) in South Africa and
the Gulf Communities Agreement (GCA) at Sibanye-Stillwater’s Century zinc tailings retreatment operation (Century operation) in Australia,
which legally bind Sibanye-Stillwater and hold it to higher standards than regulations require.
Alongside compliance with local laws and regulations, Sibanye-Stillwater’s operations are also increasingly subject to stringent stakeholder
expectations, including regarding voluntary conformance to internationally recognised environmental, health and safety and social
standards, performance expectations and benchmarks. Such standards and performance expectations include the World Gold Council’s
Responsible Gold Mining Principles, IFC Performance Standards, the International Council on Mining and Metals (ICMM) Principles, Initiative
on Responsible Mining Assurance, Extractive Industry Transparency Initiative and other World Bank guidelines. In addition, stakeholders
expect Sibanye-Stillwater’s US recycling operations (US Recycling), comprising the Columbus metallurgical complex (part of the US PGM
operations), the Reldan operations (the Pennsylvania site) and Metallix Refining operations (the North Carolina site), to maintain certifications
and accreditations for safety and environmental stewardship. These stakeholder expectations include compliance with stringent
environmental precious metals refining standards addressing safe materials handling and disposal of toxic by-products, logistics and supply
chain accountability, security compliance, and occupational and safety compliance. Relevant certifications include R2, RIOS, LEED, and e-
Steward (for refiners, recyclers and processors).
The environmental and health and safety laws, regulations and frameworks applicable to Sibanye-Stillwater impose significant compliance
costs and may open Sibanye-Stillwater to enforcement actions and potential litigation.
Compliance costs
Sibanye-Stillwater has incurred and may in the future incur significant costs to comply with environmental, health and safety requirements
imposed under existing or new legislation, regulations or permit requirements, or to comply with changes in existing laws and regulations or
the manner in which they are applied. For example, under a number of aforementioned existing or upcoming legislative frameworks,
Sibanye-Stillwater may be required to take specific anti-pollution measures, be subjected to charges and/or taxes for its waste water and air
emissions, remove or remediate previously disposed wastes (including wastes disposed of or released by prior owners or operators, or wastes
disposed of by Sibanye-Stillwater’s operations in compliance with laws in effect in the past that have been subsequently amended), to
clean up contaminated property (including contaminated soil and groundwater), to perform remedial operations to prevent future
contamination or to demolish mine infrastructure and rehabilitate it to set standards.
Existing South African legislation requires Sibanye-Stillwater to fund its closure liabilities and obligations, environmental rehabilitation and
remediation costs, which may be significant. Under NEMA (as amended by NEMLAA), read with the MPRDA, there is a risk that Sibanye-
Stillwater may be unable to fully extinguish its environmental liability in respect of its mining operations if the regulator is unwilling to issue
closure certificates. This would result in Sibanye-Stillwater incurring additional costs relating to prolonged care and maintenance and other
related costs. Further, under the Financial Provision Regulations, 2015 (as amended) (Financial Provisioning Regulations), Sibanye-Stillwater is
required to update its financial provisions for annual environmental rehabilitation and remediation costs, decommissioning and closure
activities and latent or residual environmental impacts (including the pumping and treatment of polluted or extraneous water), which mining
companies have not fully quantified or provided for in the past. These regulations, once effective, will also require annual rehabilitation to be
funded through an operational budget, which could lead to double provisioning (where funds have already been set aside in a
rehabilitation trust fund for annual rehabilitation). Generally, these regulations are strongly opposed by the mining industry, and there has
been industry-wide concern about their ambiguity and implementation.
In the United States, Sibanye-Stillwater is required to post and maintain surety bonds for its reclamation obligations, which are substantial. As
at 31 December 2025, Sibanye-Stillwater had US$128 million (R2.1 billion) of outstanding environmental surety bonds in the United States. In
Queensland, Australia, the Mineral and Energy Resources Financial Provisioning Act, 2018 (the MERFP Act), requires resource companies to
provide surety to the State to guard against their potential failure to comply with their environmental management and rehabilitation
obligations. In fiscal year 2025, Sibanye-Stillwater had surety provisions of US$142 million (R2.4 billion) held by the Queensland Government.
Such financial surety obligations generally increase over time as the underlying rehabilitation cost estimates rise. Failure to secure and
maintain adequate surety coverage could result in the operating permits of the Century operation being revoked.
Enforcement actions
Regulators are increasingly focusing on the enforcement of applicable environmental, health and safety laws and regulations and
permitting requirements, including in South Africa, the United States and other jurisdictions where Sibanye-Stillwater operates. Enforcement
actions may cause Sibanye-Stillwater’s operations to cease or to be suspended, and may include corrective measures requiring capital
expenditures, installation of additional equipment or remedial actions. Non-renewal of permits, the inability to secure new permits, or the
imposition of additional conditions could eliminate or severely restrict Sibanye-Stillwater’s ability to conduct its operations. Adverse permitting
decisions may cause significant delays in the completion of planned development projects and require the Group to incur additional costs
to appeal and/or modify its development plans.
Regulators, such as the DMPR in South Africa, can and do issue, in the ordinary course of operations, directives and/or instructions, such as
Section 54 work stoppages, after routine visits or following safety incidents or accidents to partially or completely halt operations at affected
mines until corrective measures are agreed and implemented. In 2025, Sibanye-Stillwater’s South African gold operations experienced 16
Section 54 work stoppages (2024: 24; 2023: 40) and 21 Section 54 work stoppages at the South African PGM operations (2024: 27; 2023: 39). In
the United States, underground mines, including the Stillwater and East Boulder Operations, are continuously inspected by the MSHA, which
can lead to notices of violation. Any of Sibanye-Stillwater’s US mines could be subject to a temporary or extended shut down because of a
violation alleged by the MSHA, known as a Section 103(k) Order (k-order). In 2025, the United States PGM operations had 4 k-orders issued
(2024: 6; 2023: 4).
In addition, there can be no assurance that unions will not take industrial action, including in response to such accidents, which could lead
to losses in Sibanye-Stillwater’s production. Any additional stoppages in production as a result of regulatory enforcement or union actions
may negatively affect Sibanye-Stillwater’s reputation with regulators and stakeholders.
Sibanye-Stillwater’s mining operations in the United States are located adjacent to the Absaroka-Beartooth Wilderness Area and are situated
approximately 30 miles from the northern boundary of Yellowstone National Park. While Sibanye-Stillwater works closely and cooperatively
with local environmental organisations, the Montana Department of Environmental Quality and the United States Forest Services, there can
be no assurance that future political or regulatory actions will not further restrict or seek to terminate Sibanye-Stillwater’s operations in this
sensitive area.
Litigation
Sibanye-Stillwater has been, and may in the future also be, subject to litigation, arbitration, regulatory proceedings, disputes and other costs,
as well as actions by authorities relating to environmental, climate change, data protection, health and safety matters, including mine
closures, the suspension of operations, legal representation during accident inquiries, investigations and/or inquests and prosecution for
mining accidents as well as significant penalties and fines for noncompliance. Sibanye-Stillwater may also be subject to litigation brought by
members of the community affected by environmental-related impacts, as well as non-governmental organisations (NGOs) and public
bodies. In this regard, recent case law in South Africa has provided a precedent for private prosecution by environmental NGOs for
environmental infringements and non-compliance with key environmental legislation. South African legislation also provides for potential
director, shareholder and lender liability for environmental damage in certain circumstances. Contravention of environmental and health
and safety laws and regulations may also constitute a criminal offence and result in a fine or imprisonment, or both in addition to
administrative penalties.
Some of the principal health risks associated with Sibanye-Stillwater’s mining operations arise from occupational exposure and community
environmental exposure to silica dust, noise and certain hazardous substances, including toxic gases and radioactive particulates. The most
significant occupational diseases affecting Sibanye-Stillwater’s workforce include lung diseases (such as silicosis, tuberculosis (TB), a
combination of the two and chronic obstructive airways disease (COAD)) as well as noise induced hearing loss (NIHL). Employees have
sought and may continue to seek, compensation for certain illnesses, such as silicosis, from Sibanye-Stillwater.
In 2019, Sibanye-Stillwater entered into a R1.4 billion guarantee facility (reduced to R406 million in 2025) with Nedbank Limited in relation to its
obligations under a settlement agreement between several South African mining companies, including Sibanye-Stillwater (collectively, the
Gold Working Group), to compensate all eligible workers (or their surviving relatives) who worked at the Gold Working Group companies’
mines from 12 March 1965 to the effective date of the settlement agreement who suffered from silicosis and silico-tuberculosis. The payment
of compensation for the claims may have an adverse financial impact on Sibanye-Stillwater. For further information, see – Annual Financial
Report – Consolidated financial statements – Notes to the consolidated financial statements – Note 30: Occupational healthcare obligation.
As environmental, health and safety laws and regulations are becoming more complex and stringent, Sibanye-Stillwater may face increased
regulatory and stakeholder scrutiny, which may lead to increased capital expenditures and subject Sibanye-Stillwater to potential
enforcement actions and litigation proceedings. Any significant cost increases, potential enforcement actions or litigation relating to
environmental, health and safety laws and regulations could have a material adverse effect on Sibanye-Stillwater’s business, results of
operations and financial condition.
The failure of a tailings storage facility (TSF) could negatively impact Sibanye-Stillwater’s business, reputation, operating results and financial
condition
Mining companies face inherent risks in their operation of TSFs. TSFs are engineered structures built for the containment of the uneconomical
milled ore residue and water, known as tailings. The use of TSFs exposes Sibanye-Stillwater to certain risks, including the failure of a facility due
to events such as earthquakes, high rainfall, snow melt, overtopping, piping, mud slides or seepage failures. The potential occurrence of a
tailings storage failure at one of Sibanye-Stillwater’s facilities could lead to the loss of human life and/or extensive property and
environmental damage.
Sibanye-Stillwater maintains a Group-wide tailings management system to manage the safety of its facilities, which aligns to the Global
Industry Standard on Tailings Management (GISTM) and international best practice. Although Sibanye-Stillwater has a TSF management
system, the effectiveness of its designs, construction quality or regular monitoring cannot be guaranteed throughout its operations and it
cannot be guaranteed that these measures will prevent the failure of one or more of its TSFs or that such potential failure will be detected in
advance. Sibanye-Stillwater may also be required to undertake remedial work to reinforce its facilities if a vulnerability is discovered, which
may require it to reduce or suspend operations while remediation takes place.
In addition, although Sibanye-Stillwater generally requires its partners to maintain such systems, it cannot guarantee that its partners maintain
similar safety precautions or monitoring systems on their TSFs. There is no assurance that any safety measures implemented will prevent the
failure of any TSF.
The failure of a TSF could lead to multiple legal proceedings and investigations, which could include securities class actions, criminal
proceedings and public civil actions (against Sibanye-Stillwater or individuals) for significant amounts of damages. Furthermore, the
elimination of the “conventional” practice of storing wet tailings (e.g. by alternatively filtering, “dry” stacking and compacting the tailings)
could require the research and development of new technologies, which could lead to additional large expenditures. Following TSF failures
in South Africa in 2022, Brazil in 2015 and 2019 and Canada in 2014 (none of which were associated with Sibanye-Stillwater) and other tailing
storage facility failures, additional environmental and health and safety laws and regulations are being considered globally, including in
jurisdictions where Sibanye-Stillwater operates. In addition, changes in laws and regulations may impose more stringent conditions in
connection with the construction of TSFs, particularly with respect to upstream TSFs, the licensing process of projects and operations, the
ability to procure appropriate insurance coverage with respect to tailings facilities and increased criminal and civil liability for companies,
officers and contractors. For example, in 2020, the ICMM, the United Nations Environment Programme (UNEP) and the Principles for
Responsible Investment (PRI) established an international tailings standard, the GISTM. ICMM members, including Sibanye-Stillwater, have
committed to conform with the GISTM for all of their facilities. Sibanye-Stillwater may incur significant costs to maintain compliance with such
standards or to bring new facilities into compliance.
Furthermore, the unexpected failure of a TSF could lead to the need for a large expenditure on contingencies and on recovering the regions
and people affected, extensive and permanent environmental damage and the payment of penalties, fines or other money damages or
civil claims.
The occurrence of any such risks could have a material adverse effect on Sibanye-Stillwater’s business, operating results and financial
condition.
Sibanye-Stillwater’s operations are subject to water use and wastewater regulations, which could impose significant costs and burden
Sibanye-Stillwater’s operations are subject to regulatory controls on their usage and disposal of waste water and solid waste. Under South
African and US law, mining operations are subject to water use licences and/or authorisations that govern each operation’s water usage
and that require, among other things, mining operations to achieve and maintain certain water quality limits regarding all water discharges.
All of Sibanye-Stillwater’s operations hold the required water-related permits for current water-related activities, although at certain
operations in South Africa (Driefontein, Beatrix, Burnstone, Kloof, Rand Uranium, Ezulwini, Marikana, Rustenburg and Kroondal), water use
licences for future activities, issuable under the National Water Act, 1998 (Act No. 36 of 1998) (NWA), are currently under review and
amendment by the Department of Water and Sanitation (DWS) for final issuance.
In addition, the DWS intends to roll-out a waste discharge charge system for all waste-related activities that may impact on water resources,
and in this regard published a revised Pricing Strategy for Raw Water Use Charges in June 2024, with an effective date of April 2026.
However, the implementation timeline for this charge system has not yet been finalised and remains under review, with the DWS planning a
phased implementation approach targeted for completion by 2030. Once fully implemented, the water discharge charge system may
have significant cost implications for Sibanye-Stillwater’s operations in South Africa.
Sibanye-Stillwater’s South African PGM operations are heavily dependent on external water sources to facilitate the functioning of its mines.
Sibanye-Stillwater’s South African Gold operations are largely independent of external water inputs, but these operations still require licences
to abstract water and to discharge water into the natural environment. These licences are essential to enable the operations to manage
water levels and support the safe and uninterrupted continuation of mining activities. Any loss of the Group’s water use licencing, or a
substantial decrease in the capacity of the local government or water boards to provide fresh water to these operations, may cause it to
cease operations until such services are reinstated. Should any of the aforementioned occur, Sibanye-Stillwater expects to incur significant
expenditure to achieve and maintain compliance with the licence requirements at each of its operations. Any failure on Sibanye-Stillwater’s
part to achieve or maintain compliance with the requirements of these licences could result in Sibanye-Stillwater being subject to remedial
actions, substantial claims, penalties, fees and expenses, significant delays in operations, criminal proceedings or the revocation of the
relevant water use licence, which could curtail or halt production at the affected operation. Any of the above, and any significant
constraints to availability of water, particularly at Sibanye-Stillwater’s South African PGM operations, could have a material adverse effect on
Sibanye-Stillwater’s business, operating results and financial condition.
Sibanye-Stillwater has identified a risk of potential long-term acid mine drainage (AMD) issues. AMD relates to the acidification and
contamination of naturally occurring water resources by pyrite-bearing ore contained in underground mines and in rock dumps, tailings
storage facilities and pits on the surface. Should Sibanye-Stillwater’s current preventative and active AMD and water management
measures be unsuccessful, the Group may fail to comply with its water use licence requirements and expose Sibanye-Stillwater to liabilities
and unforeseen costs associated with the pumping and treatment of polluted or extraneous water whether during operation or in the post-
closure context.
Social unrest, including the risk of service delivery protests, sickness or natural or man-made disasters in surrounding mining communities,
including informal settlements in the vicinity of some of Sibanye-Stillwater’s South African-based operations, may disrupt its business or may
lead to greater social or regulatory impositions on Sibanye-Stillwater
There are a number of informal settlements located in the vicinity of some of Sibanye-Stillwater’s South African-based operations. These
settlements are populated by mining company employees (including Sibanye-Stillwater employees), the families of mining company
employees and others. As at 31 December 2025, approximately 33% (2024: 34%; 2023: 43%) of Sibanye-Stillwater’s South African-based
workforce opted to receive a “living out allowance” and management expects that a number of these individuals reside in informal
settlements. In recent years, the size of these settlements has grown substantially. Poor living conditions in these settlements may lead to the
spread of disease or other health hazards, which may increase absences or affect the productivity of employees. The population of such
settlements or the surrounding communities may also demand jobs, improved delivery of social services or infrastructure from the local
mining operations, including Sibanye-Stillwater. Any such demands or other demands from these communities may lead to increased costs
on Sibanye-Stillwater. Such demands may also lead to protests, including service delivery protests related to poor service delivery in such
communities, or other actions that may hinder Sibanye-Stillwater’s ability to operate, including incurring expenses to defend its rights through
initiating or defending against litigation proceedings.
In addition, in December 2019, the South African Minister of the DMPR (then DMRE Minister) published the Housing and Living Conditions
Standard for implementation, requiring miners, including Sibanye-Stillwater, to revise its current housing and living condition plans under the
Group’s social and labour plans (SLPs). The Housing and Living Conditions Standards were submitted to the DMPR (then DMRE) and are
being implemented, including applications by Sibanye-Stillwater for the eviction of illegally occupied houses earmarked for employee
ownership. Sibanye-Stillwater estimates spending on its Housing and Living Conditions Plans for the South African PGM and gold segments to
amount to R2.6 billion (US$157 million) and R2.7 billion (US$163 million), respectively, over the next five years. If actual spending exceeds the
amounts estimated, it could have a material adverse effect on Sibanye-Stillwater’s business, operating results and financial condition.
The failure of Sibanye-Stillwater’s information, communication or technology platforms or application systems, or the failure to protect
sensitive commercial or personal data, could significantly impact Sibanye-Stillwater’s operations and business
Sibanye-Stillwater utilises and is reliant on various internal and external information, communication and technology platforms or application
systems, such as SAP, Microsoft, mine technical and other applications, to support its business activities. Damage or interruption of Sibanye-
Stillwater’s information, communication or technology platforms or application systems (including systems of third party vendors that it relies
on, as well as those used in connection with newly acquired or recently integrated operations), whether due to accidents, old or obsolete
information technology platforms or application systems and equipment, human error, natural events or malicious acts (including cyber-
attacks), may lead to important data, including commercially or personally sensitive information, being irretrievably lost, exposed or
damaged, thereby adversely affecting Sibanye-Stillwater’s business, operating results and financial condition.
Information technology systems that Sibanye-Stillwater utilises (including systems operated by third party vendors) store voluminous personal
information related to employees and sensitive information relating to suppliers and customers as well as recipients of bursaries and social
investments payments from Sibanye-Stillwater. The information security management system protecting Sibanye-Stillwater’s information,
communication and technology infrastructure and network has been and may continue to be subject to security breaches (e.g. cybercrime
or activists) or other incidents in the future that can result in misappropriation of funds, increased health and safety risks to people, disruption
to its operations, environmental damage, loss of intellectual property, disclosure of commercially or personally sensitive information, legal
proceedings or regulatory investigations or actions and liability, other costs and reputational damage.
In July 2024, Sibanye-Stillwater detected a cybersecurity attack on the Company’s IT systems and undertook measures to contain,
investigate and remediate the effects of the attack. While the cybersecurity attack had limited impact on the Group’s core operations, the
incident caused temporary system outages which resulted in the implementation of back-up manual processes on certain systems. As a
result, certain operations, including the Columbus metallurgical complex at the US PGM operations, experienced short-term operational
delays. No material losses were recognised in connection with the incident. The Company continues to monitor potential liabilities arising
from this incident, including as related to pending class action litigation. While Sibanye-Stillwater does not currently believe that this incident
or pending litigation arising from this incident will have a material adverse effect on the Group’s business, operating results or financial
condition, there is no guarantee that further operational, legal or regulatory impacts will not materialise.
In addition, given the increasing sophistication and evolving nature of cybersecurity threats, including sophisticated cyber-attacks such as
phishing and ransomware attacks, the possibility of further events occurring in the future cannot be ruled out. This is particularly the case with
new and evolving technologies such as artificial intelligence (AI), including generative AI. As these technologies continue to improve and
gain widespread use, Sibanye-Stillwater may experience cybersecurity attacks using AI, which may be difficult to detect and defend
against. Sibanye-Stillwater performs periodic safety testing and annual disaster recovery testing which includes reviews of recovery
procedures and security controls, and all identified critical applications have been replicated at alternative data centres throughout
Sibanye-Stillwater’s operations. Despite these measures, there is still a risk of inadequate or failed disaster recovery. An extended failure of
critical system components, caused by accidental actions, such as failed hardware or failed network infrastructure, or malicious actions,
including those resulting from a cybersecurity attack, could result in a significant environmental incident, commercial loss or interruption to
operations. In addition, Sibanye-Stillwater has incurred and may in the future incur significant costs to protect against or repair damage
caused by disruptions or security breaches in the future, such as rebuilding internal systems, implementing additional threat protection
measures, defending against litigation, responding to regulatory inquiries, or taking remedial steps with respect to third parties, among
others.
In addition, the interpretation and application of consumer, privacy and data protection laws in South Africa, the United States, the EU,
Australia and elsewhere are uncertain and evolving. It is possible that regulators may interpret and apply these laws in a manner that is
inconsistent with Sibanye-Stillwater’s data processes and practices. Complying with these various laws is difficult and could cause Sibanye-
Stillwater to incur significant costs or require it to change its business practices. This includes, among other things, compliance with South
Africa’s data privacy legislation, the Protection of Personal Information Act, 2013 (POPIA) and the EU’s General Data Protection Regulation
(GDPR). While Sibanye-Stillwater seeks to comply with additional legislation relating to cybersecurity breaches, such as the South African
Cybercrimes Act, applicable United States state data breach notification laws and the SEC’s final rules on cybersecurity risk management,
strategy, governance, and incident disclosure, there is no guarantee that the Group’s efforts will meet the evolving privacy, data protection
and cybersecurity standards and regulations. Security breaches compromising confidential and proprietary data have historically been a
significant risk for the mining sector, and failure to comply with such applicable legislation may also lead to reputational damage, substantial
penalties, fines and/or imprisonment, depending on the severity of the infraction. Sibanye-Stillwater may also have insufficient cyber
insurance coverage for any cybersecurity incidents. See – Sibanye-Stillwater’s insurance coverage may not adequately satisfy all potential
claims and exposures.
Mining companies are required to operate in ways that provide benefits to affected communities. Failure to comply with these requirements
can result in legal suits, additional operational costs, investor divestment and loss of “social licence to operate”, which could adversely
impact Sibanye-Stillwater’s business, operating results and financial condition
Mining companies face increasing pressure over their “social licence to operate”, which can be interpreted as the acceptance of the
activities of these companies by stakeholders. While formal permission to operate is ultimately granted by host governments, many mining
activities require social permission from host communities and influential stakeholders to carry out operations effectively and profitably.
Mining companies are under pressure to demonstrate that, while they seek a satisfactory return on investment for shareholders, the
environment, human rights and other key sustainability issues are responsibly managed and stakeholders, such as employees, host
communities and the governments of the countries in which they operate, also benefit from their commercial activities. The potential
consequences of these pressures and the adverse publicity in cases where companies are believed to be creating insufficient social and
economic benefit or are perceived to not be responsibly managing other sustainability issues may result in additional operating costs, higher
capital expenditures, reputational damage, active community opposition (possibly resulting in delays, disruptions and stoppages),
allegations of human rights abuses, legal suits, regulatory intervention and investor withdrawal.
In order to maintain its social licence to operate, Sibanye-Stillwater may need to design or redesign parts of its mining operations to minimise
their adverse impact on such communities and the environment, either by changing mining plans to avoid such adverse impact, by
modifying operations, by changing planned capital expenditures or by relocating the affected people to an agreed location. In South
Africa, socio-economic challenges including high unemployment and the migration of job seekers into mining towns are placing increasing
pressure on Sibanye-Stillwater to fund or provide community infrastructure, employment opportunities and broader social support at a level
that may not be financially or operationally sustainable. In addition, the legacy of the mining industry continues to fuel anti-mining sentiment
in some of the communities in which Sibanye-Stillwater operates, which has been exacerbated by forced resettlement of residents,
pervasive misinformation related to Sibanye-Stillwater or the industry in general, environmental incidents, blasting, injuries and fatalities
sustained on Sibanye-Stillwater’s mining properties, including as a result of unauthorised access and illegal mining, violent crime rates and
high levels of unemployment. For example, the official unemployment rate in South Africa was 33.2% in the second quarter of fiscal 2025
mainly due to slow economic growth and poor infrastructure. There is no assurance that a prolonged economic downturn will not result in an
extended period of high unemployment, further exacerbating anti-mining sentiment in South Africa. Furthermore, the rise of ESG factors in
investment decisions may result in divestments of certain parts of the mining sector or increased difficulties with access to finance, or access
to affordable finance.
Responsive measures may require Sibanye-Stillwater to take costly and time-consuming remedial measures, including the full restoration of
livelihoods of those impacted, and remediation of the environment. In addition, Sibanye-Stillwater is obliged to comply with the terms and
conditions of all the mining rights it holds in South Africa. In this regard, the approved SLPs which form part of Sibanye-Stillwater’s mining
rights, must make provision for local economic development, among other obligations. See – Sibanye-Stillwater’s mining rights are subject to
legislation, which could impose significant costs and burdens and which impose certain ownership requirements, the interpretation of which
may be the subject of dispute. In addition, Sibanye-Stillwater has several joint venture arrangements and associated investments, and the
companies which Sibanye-Stillwater partners with may apply different corporate governance standards and responsible citizen procedures.
As Sibanye-Stillwater has a long history of mining operations in certain regions or has purchased operations that have a long history, issues
may arise regarding historical as well as potential future environmental or health impacts in those areas.
Delays in projects attributable to a lack of community support or other community-related disruptions or delays can translate directly into a
decrease in the value of a project or into an inability to bring the project to, or maintain, production. The cost of measures and other issues
relating to the sustainable development of mining operations have placed significant demands on Sibanye-Stillwater’s resources and could
increase capital and operating costs and have a material adverse effect on Sibanye-Stillwater’s reputation, business, operating results and
financial condition.
An actual or alleged breach or breaches in governance processes, or fraud, bribery and corruption may lead to public and private censure,
regulatory penalties and loss of licences or permits and may impact negatively upon Sibanye-Stillwater’s empowerment status and may
damage Sibanye-Stillwater’s reputation
The legal and regulatory framework in which Sibanye-Stillwater operates is complex, and its governance and compliance policies and
processes may not prevent potential breaches of law or accounting or other governance practices. Sibanye-Stillwater’s code of ethics,
compliance policies and operating codes, and other applicable standards and guidance, may not prevent instances of fraudulent
behaviour and dishonesty, nor guarantee compliance with legal and regulatory requirements.
To the extent that Sibanye-Stillwater suffers from any actual or alleged breach or breaches of relevant anti-money laundering, anti-bribery or
counter-terrorism laws (including legislation in South Africa, the United States, such as the US Foreign Corrupt Practices Act of 1977, the EU
and elsewhere) under any circumstances, they may lead to regulatory, civil or criminal fines, litigation, public and private censure and loss of
operating licences or permits and may impact negatively upon Sibanye-Stillwater’s empowerment status and may damage its reputation.
The occurrence of any of these events could have a material adverse effect on Sibanye-Stillwater’s business, operating results and financial
condition.
Regulation of greenhouse gas (GHG) emissions may have a materially adverse effect on Sibanye-Stillwater’s operations
Energy is a significant production input and input cost for Sibanye-Stillwater’s mining and processing operations, with its principal energy
sources being electricity, purchased petroleum products, coal, propane and natural gas. A number of governments or governmental
bodies, including the United Nations Framework Convention on Climate Change (UNFCCC), have introduced or are contemplating
regulatory changes in response to the impact of climate change, including restricting GHG emissions in jurisdictions in which Sibanye-
Stillwater operates. Such regulation may impact Sibanye-Stillwater’s operating costs, limit or modify its operations and have a materially
adverse effect on the competitiveness of the commodities it produces.
For example, the South African government introduced a carbon tax under the Carbon Tax Act with effect from 1 June 2019, imposing a tax
on carbon dioxide equivalent (CO2e) emissions which exceed applicable tax-free allowances. As a result of these tax-free allowances,
Sibanye-Stillwater’s effective carbon tax rate is much lower than the statutory carbon tax rate: 2025 (statutory rate: R236 per tonne of CO2e
emissions, effective rate: R12 to R94 per tonne); 2024 (statutory rate: R190 per tonne of CO2e emissions, effective rate: R10 to R75 per tonne)
and 2023 (statutory rate: R159 per tonne, effective rate: R8 to R63 per tonne). For fiscal 2025, due to the 60% basic tax-free allowance
applicable under the Carbon Tax Act, Sibanye-Stillwater’s maximum effective carbon tax rate was R94 per tonne, meaning the statutory
rate of R236 was reduced by 60%.
To prepare South Africa for the structural and sustainable transition to a climate‐resilient and low carbon economy, the Carbon Tax Act was
amended in 2022 to include progressive increases in the carbon tax rate, set to increase from R236 for fiscal 2025 to R462 in fiscal 2030, with
further increases to be announced thereafter. Coupled with the gradual phasing out of the tax-free allowances, Sibanye-Stillwater’s
effective carbon tax rate is expected to increase over time.
A carbon fuel levy was also introduced under the Customs and Excise Act, 1964 as part of the current South African fuel levy regime. The
carbon fuel levy applies to stationary and non-stationary mobile emissions resulting from the use of liquid fuels, primarily petrol and diesel. The
9c/litre carbon fuel levy on diesel, which came into effect on 5 June 2019, was increased to 17c/litre on 2 April 2025, as a result of the
increase in the carbon tax rate.
In addition, the South African government enacted the Climate Change Act 22 of 2024 (Climate Change Act) in July 2024, which imposes
“carbon budgets” on entities in certain high-emitting industries, such as mining. Drafts of the proposed carbon budget and mitigation plan
regulations were published for comment in August 2025, and finalisation is pending. The draft regulations propose that carbon budgets will
be set for consecutive five-year periods. The carbon budgets are intended to operate as statutory limits for CO2e emissions. It is proposed
that the failure to submit a mitigation plan or to implement an approved mitigation plan will lead to a fine or other punitive measures.
Amendments to the Carbon Tax Act are proposed to introduce a higher rate of R640/tCO2e for emissions exceeding an allocated carbon
budget, to commence once the mandatory carbon budget system is operational and the South African Minister of Finance (Minister of
Finance) brings the higher carbon tax rate provisions into force by notice. The elevated rate applies to the volume of emissions that exceed
the allocated carbon budget. The draft regulations propose that the tax-free allowances will not apply to these exceedance tonnes,
meaning that the rate would be punitive and allowance-free. Furthermore, the previous tax-free allowance of 5% tied to carbon budgets,
provided for under the Carbon Tax Act, ceased on 31 December 2025. Sibanye-Stillwater’s carbon tax costs under the current regime will
depend on (i) updates to national GHG monitoring, reporting and verification requirements that affect the quantification and verification of
emissions, and (ii) the final form and timing of the carbon budget and mitigation plan regulations and related amendments to the Carbon
Tax Act, including changes to carbon tax rates and the availability of allowances and offsets. Sibanye-Stillwater had a net carbon tax credit
of R0.15 million for the year ended 31 December 2025 (2024: R2 million expense; 2023: R2 million credit), which comprised a current year
carbon tax expense of R3.76 million, offset by a prior year adjustment of R3.92 million relating to the Beatrix operations.
A number of other regulatory initiatives are underway in countries in which Sibanye-Stillwater operates that seek to reduce or limit industrial
GHG emissions. These regulatory initiatives will be either voluntary or mandatory and are likely to impact Sibanye-Stillwater’s operations
directly or indirectly by affecting the cost of doing business, for example by increasing the costs of its suppliers or customers. Inconsistency of
regulations particularly between developed and developing countries may affect both Sibanye-Stillwater’s decision to pursue opportunities
in certain countries and its cost of operations.
Sibanye-Stillwater’s reliance on coal-intensive grid electricity increases the embedded emissions of certain products. If export destinations
implement carbon border adjustment mechanisms (CBAM), such as the EU Carbon Border Adjustment Mechanism, EU importers of covered
goods would be required to purchase CBAM certificates at prices linked to the EU Emissions Trading System. The amount payable is reduced
only by the explicit South African carbon tax actually paid on the same embedded emissions. Accordingly, when the South African effective
carbon tax is lowered by allowances and offsets, limited credit may be available under CBAM, increasing the ‘top-up’ payable and
potentially affecting the competitiveness of covered exports. Sibanye-Stillwater’s exposure will depend on whether its exported products fall
within covered goods, their embedded emissions intensity, and the specific terms of each regime, as well as the Company’s ability to
produce and verify plant-level embedded emissions data to EU standards.
In the United States, Sibanye-Stillwater is also subject to legislative and regulatory initiatives that are underway to limit GHG emissions. The US
Congress has considered legislation that would control GHG emissions through a “cap and trade” programme and several US states have
already implemented programmes to reduce GHG emissions. The US Environmental Protection Agency’s (the EPA) “Tailoring Rule” makes
certain large stationary sources and modification projects subject to permitting requirements for GHG emissions under the Clean Air Act.
New or modified sources subject to permitting for conventional pollutants will be required to comply with Best Available Control
Technologies (BACT) for GHGs if the new source or the modification will result in an annual increase of 75,000 tons per year of CO2e. In 2022,
the US Supreme Court limited the EPA’s authority under provisions of the Clean Air Act to regulate greenhouse gas emissions without clear
authorisation from the US Congress. It is unclear the full extent to which this may impact the EPA’s ability to impose additional regulations.
Sibanye-Stillwater is also subject to GHG reporting requirements for specified large GHG emission sources in the United States. Sibanye-
Stillwater’s United States PGM operations hold a Title V Major Air Quality Permit, which requires Sibanye-Stillwater to annually calculate its
GHG emissions and compare these amounts against reporting thresholds. Because current levels are below reporting thresholds, the United
States PGM operations are not currently required to report GHG emissions. Additionally, US federal agencies may consider GHG emissions as
part of NEPA reviews. Recent regulatory developments relating to the consideration of GHG emissions under NEPA have created uncertainty
as to how such emissions will be assessed in future NEPA reviews. It remains uncertain whether, in the future, Sibanye-Stillwater will be required
to mitigate its GHG emissions in connection with any NEPA review.
Sibanye-Stillwater is also subject to GHG emission regulations in other jurisdictions in which it operates, such as Finland and France, which
impose obligations based on those from the UNFCCC and EU regulations, such as the EU’s Emission Trading System Directive (2003/87/EC)
and the EU Directive on the Geological Storage of CO2 (2009/31/EC). There can be no assurance that Sibanye-Stillwater will be able to
meet its voluntary targets relating to GHG emissions or comply with targets that may be imposed upon the mining industry by external
regulators. Furthermore, additional, new and/or different regulations in this area, such as the imposition of stricter limits than those currently
contemplated, could be enacted, all of which could have a material adverse effect on Sibanye-Stillwater’s business, financial condition,
results of operations and prospects.
Regulation of GHG emissions in the jurisdictions of Sibanye-Stillwater’s end-user customers and value chain participants could also have an
adverse effect on the demand for certain of its products, which may in turn, have a material adverse effect on Sibanye-Stillwater’s
production levels, business, operating results and financial condition. Additionally, Sibanye-Stillwater may in the future be required to
calculate Scope 3 or value chain emissions, which will incur increased costs, particularly as Scope 3 emissions relate to other organisations’
emissions and are therefore subject to a range of uncertainties and challenges.
Sibanye-Stillwater may not meet its decarbonisation targets in the timeframe anticipated, or at all
As a commercial consumer of power, Sibanye-Stillwater’s ability to reduce its GHG emissions is impacted by its mix of energy suppliers,
including Sibanye-Stillwater’s ability to reduce its dependence on Eskom in South Africa, which accounted for approximately 92% of its total
Scope 1 and Scope 2 GHG emissions for the year ended 31 December 2025. See – Regulation of greenhouse gas (GHG) emissions may have
a materially adverse effect on Sibanye-Stillwater’s operations. To reduce its emissions, Sibanye-Stillwater aims to diversify its energy mix with
renewable projects. For example, in 2023 and 2024, Sibanye-Stillwater entered into power purchase agreements to obtain energy from wind
and solar photovoltaic projects in South Africa, including the Castle wind farm and the Springbok solar photovoltaic plant, both of which
reached commercial operation in 2025. However, there is no guarantee that the energy produced from these projects will be sufficient to
reduce Sibanye-Stillwater’s reliance on Eskom and other non-renewable sources of energy, or that future renewable energy projects will be
successfully completed within the expected time frame or meet the anticipated performance standards, including with respect to the
reduction of GHG emissions. See also – Sibanye-Stillwater’s growth strategy may not deliver anticipated outcomes in the timeframe
anticipated or at all. In addition, Sibanye-Stillwater’s ability to diversify its energy mix in South Africa may also be impacted by government
policies or actions, including the liberalisation of the electricity supply industry and technological innovations, including electrification.
However, there is no guarantee that such market enhancement will develop as expected, or at all.
In certain aspects of Sibanye-Stillwater’s operations, its ability to reduce GHG emissions depends on the actions of third parties and
technological solutions and innovation. For example, diesel-fuelled haul trucks are a significant contributor to GHG emissions at Sibanye-
Stillwater’s United States PGM operations, but reduction of emissions from transportation equipment will depend in part upon the
development and availability of commercially viable alternative-fuelled mining vehicles by Sibanye-Stillwater’s third-party suppliers.
The Group expects to incur additional costs in its efforts to decarbonise, the totality of which cannot currently be estimated with accuracy.
Failure by Sibanye-Stillwater to achieve or maintain its decarbonisation performance targets and credentials may result in significant
reputational damage, make it harder to obtain or maintain third-party contracts or financing or result in regulatory enforcement and fines,
which may materially affect its business, operating results and financial condition.
The physical impacts of climate change may adversely affect Sibanye-Stillwater’s mining operations, workforce and supply chain, damage
its mining assets and equipment and impose significant costs and burdens
Sibanye-Stillwater’s operations, workforce, supply chain, mining assets and equipment may be exposed to changing weather patterns
resulting from climate change, particularly changes in the frequency, intensity and/or duration of intense storms, drought, flooding, wildfire,
and other extreme weather events and patterns. For example, operations were suspended at the Century operation in Queensland,
Australia, following record levels of rainfall in March 2023, and similar disruptions were experienced in the first quarter of 2024 as a result of
severe regional weather. In October 2024, the Century operation was further impacted by a regional bushfire. Although primary
infrastructure was safeguarded, there was extensive loss of surface piping, including the feed and water lines connecting the hydro mine to
the processing plant and other key service lines. Due to the amount of piping required for remediation, operations were suspended for 6
weeks, resulting in lower production levels in the fourth quarter of 2024.
Such potential physical impacts of climate change on Sibanye-Stillwater’s operations are highly uncertain, and would vary by operation
based on particular geographic circumstances. In particular, damage to, or destruction of, mining assets or equipment could lead to
substantial costs, delays in mining or processing and/or legal liabilities. As a result, Sibanye-Stillwater may face production interruptions,
increased operational costs associated with power and supply chain disruption, project delays and increased production pricing. In
addition, the potential for overall decreases in precipitation could affect the availability of water needed for Sibanye-Stillwater’s operations,
leading to increased operating costs, or in extreme cases, disruptions to mining operations.
In addition, as part of Sibanye-Stillwater’s commitment to implementing the GISTM, it may be required to undertake additional measures to
mitigate the environmental impact at its tailings facilities, including physical impacts arising from climate change. Any such obligations could
increase operational expenses or required capital investments.
Legal, regulatory and compliance risks
If Sibanye-Stillwater is unable to implement and maintain an effective system of internal control over financial reporting, it may be unable to
accurately report its results of operations, meet its reporting obligations or prevent fraud
Pursuant to Section 404 of the Sarbanes-Oxley Act of 2002, US reporting companies, including Sibanye-Stillwater, are required to include a
management report on its internal control over financial reporting in its annual report, including management’s assessment of the
effectiveness of its internal control over financial reporting. In addition, an independent registered public accounting firm must attest to and
report on the effectiveness of the Company’s internal control over financial reporting. In connection with the preparation of its consolidated
financial statements for the year ended 31 December 2023, Sibanye-Stillwater identified a material weakness in its internal control over
financial reporting due to design and operating deficiencies which resulted from insufficient evidence of management review and
performance of control procedures, including the level of precision in the execution of controls and procedures to ascertain completeness
and accuracy of information produced by the Company (IPC). These deficiencies impacted cash and cash equivalents in the South African
region and platinum group metals (PGM) inventory at Stillwater Mining Company, and certain inventory in process at Western Platinum
Proprietary Limited.
During the preparation of the financial statements for the year ended 31 December 2024, Sibanye-Stillwater further identified control
deficiencies in the Southern African region relating to the management of user access in the Company’s Information Technology General
Controls (ITGC) environment, and controls relying on these related systems, which in the aggregate, constituted a material weakness as of
31 December 2024. These deficiencies specifically relate to insufficient monitoring of user access controls that restrict user and privileged
access to key Information Technology (IT) applications within the ERP system, business supporting systems and related data to appropriate
company personnel, as well as insufficient monitoring of access management to the Active Directory network layer that provides centralised
authentication and authorisation of users to the environment.
Management initiated remedial measures to further enhance its processes and controls over financial reporting and actively engaged to
formulate a comprehensive plan for remediation of the material weaknesses as discussed in Item 15 Controls and Procedures. For the
financial year ended 31 December 2025, Sibanye-Stillwater successfully implemented these remedial plans and, following sufficient time for
testing and evaluation, concluded that the controls are now designed, implemented, and operating effectively to provide reasonable
assurance that a material misstatement to the consolidated financial statements would be prevented, or detected and corrected. As a
result, the previously identified material weaknesses have been remediated in the 2025 financial year. Management will continue to monitor
the effectiveness of these remedial measures in future assessments and will make any necessary changes to maintain internal control over
financial reporting.
There can be no assurance, however, that the measures Sibanye-Stillwater has taken to date, and actions it may take in the future, will be
sufficient to prevent or avoid potential future material weaknesses. Furthermore, the integration of acquired businesses may present
particular challenges in extending the Company's system of internal control over financial reporting to new operations, which may operate
in unfamiliar regulatory environments or utilise different systems and processes. See – Acquisitions, business combinations, development
projects and joint ventures may expose Sibanye-Stillwater to new or increased regulatory oversight, compliance requirements and
operational risks, including in geographies in which it is unfamiliar. If Sibanye-Stillwater is unable to successfully design, implement, and test
effective internal controls over financial reporting for newly acquired businesses, in addition to maintaining controls across its existing
operations, it may be unable to conclude that the Group's controls are effective. In addition, current controls and any new controls that
Sibanye-Stillwater develops may become inadequate because of changes in conditions in its business.
Sibanye-Stillwater’s mining rights are subject to legislation, which could impose significant costs and burdens and which impose certain
ownership requirements, the interpretation of which may be the subject of dispute
Sibanye-Stillwater’s right to own and exploit mineral deposits is governed by the laws and regulations of the jurisdictions in which the mineral
properties are located. Sibanye-Stillwater’s mineral resources and mineral reserves are located in countries where mining rights could be
suspended or cancelled should it breach its obligations in respect of the acquisition and exercise of these rights.
In all of the countries where Sibanye-Stillwater operates, the formulation or implementation of governmental policies on certain issues may
be unpredictable. This may include changes in laws relating to mineral rights and ownership of mining assets and the right to prospect and
mine, variation of conditions, and, in extreme cases, nationalisation, expropriation or nullification of existing rights, concessions, licences,
permits, agreements and contracts.
Sibanye-Stillwater’s operations in South Africa are subject to legislation regulating the exploitation of mineral resources through the granting
of rights required to prospect and mine for minerals, which includes the Mineral and Petroleum Resources Development Act, 2002 (MPRDA)
as well as Broad-Based Socio-Economic Empowerment Charter contemplated in section 100(2)(1) of the MPRDA, a voluntary code designed
to effect the entry and participation of historically disadvantaged South Africans (HDSAs) into the mining industry and increase their
participation in the South African economy.
The MPRDA also requires, among other things, that mining companies submit SLPs to the DMPR, which set out their commitments relating to
human resource development, labour planning and local economic development. In addition to significant reputational damage,
companies that fail to comply with such commitments may be sanctioned, required to undertake remedial action and ultimately, may have
their mining rights suspended or cancelled.
There is no guarantee that any steps Sibanye-Stillwater has already taken or might take in the future will ensure the retention of its existing
mining rights, the successful renewal of its existing mining rights, the granting of applications for new mining rights or that the terms of
renewals of its mining rights would not be significantly less favourable than the terms of its current mining rights. For example, in March 2021,
Sibanye-Stillwater submitted an application for a mining right at Akanani prior to expiry of its converted prospecting right. However, the
DMPR (then DMRE) granted a prospecting right to a third-party applicant based on what Sibanye-Stillwater believes is an incorrect
interpretation of the prevailing legislation and case law. In 2023, Sibanye-Stillwater referred the dispute to the High Court for review, however,
the outcome of the dispute remains uncertain. Failure by Sibanye-Stillwater to comply with mineral rights legislation or to renew mining leases
in any of the jurisdictions in which it operates may cause it to lose the right to mine, fail to acquire new rights to mine and may have a
material adverse effect on Sibanye-Stillwater’s business, operating results and financial condition.
In addition, South Africa’s changing black economic empowerment (BEE) policies may adversely affect Sibanye-Stillwater’s mining rights
and its ability to conduct operations. Under section 47 of the MPRDA, the DMPR Minister may suspend or cancel the existing mining rights or,
under section 23(3) of the MPRDA, refuse to grant applications for new mining rights by mining companies, including Sibanye-Stillwater,
should such holders of mining rights be deemed not to be in compliance with the requirements of the MPRDA as read with South Africa’s
mining industry empowerment requirements. See – Environmental and Regulatory Matters – South Africa – Mining Rights. If the DMPR Minister
were to determine that Sibanye-Stillwater is not in compliance with the requirements of the MPRDA, for any reason, including HDSA
ownership requirements, Sibanye-Stillwater may challenge such a decision in court which may be costly and unsuccessful or may be
required to engage in remedial steps, including changes to management and actions that require shareholder approval.
Furthermore, on 20 May 2025, the DMPR Minister published the draft Mineral Resources Development Bill, 2025 (2025 Bill), which seeks to
amend the MPRDA. The proposed amendments would introduce new restrictions, compliance obligations and penalties for mining
companies. Key provisions include a requirement for ministerial consent for the transfer of a prospecting or mining right, however, effective
ownership could potentially be transferred without ministerial approval by a sale of shares in the right holder. The 2025 Bill would also establish
a two-year transitional period for owners of historic residue stockpiles and residue deposits located outside of their mining areas to apply for
mining rights over such deposits, failing which custodianship would revert to the State with the risk of rights subsequently being granted to
third parties. The 2025 Bill further proposes to grant the Minister authority to make regulations relating to the promotion of transformative
broad-based black economic empowerment (B-BBEE) ownership requirements by amending section 107 of the MPRDA, which could create
uncertainty around future compliance obligations. The 2025 Bill also introduces enhanced sanctions, with various offences attracting fines of
up to 10% of the right holder’s annual turnover in South Africa and its exports during the preceding financial year. If enacted in its current
form, the 2025 Bill could impose significant additional costs and compliance burdens on Sibanye-Stillwater and could adversely affect its
business, operating results and financial condition.
Title to Sibanye-Stillwater’s properties may be subject to challenge
Certain of Sibanye-Stillwater’s properties may be subject to the rights or the asserted rights of various occupants or claimants to land under
restitution and other legislation, which could have an impact on Sibanye-Stillwater’s ability to develop or operate its mining interests. For
example, in South Africa, the Extension of Security of Tenure Act (1997), the Restitution of Land Rights Act (1994) and the Prevention of Illegal
Eviction from and Unlawful Occupation of Land Act (1998) and the Labour Tenants Act (1996) protect various rights to claim and/or occupy
land, provided certain conditions and requirements are met. Such legislation is complex and sets out the requirements as to how landowners
are to deal with certain rights. There is no assurance that Sibanye-Stillwater will be able to successfully predict when these landowner rights
will be challenged, which could therefore negatively affect the business results of new or existing projects. Where consultation with
occupants or claimants to land is statutorily or otherwise mandated, disputes may lead to reduced access to properties, delays in
operations or financial loss and such disputes may be time-consuming and costly to resolve. For example, in 2018, Sibanye-Stillwater lodged
an eviction application against certain former contractors of Aquarius Platinum Limited (Aquarius), who remained on the premises following
a protracted labour dispute with Aquarius. Sibanye-Stillwater was initially unsuccessful in the Land Claims Court, and in 2018, the South
African Supreme Court of Appeals ruled that termination notices under Section 8 of Extension of Security of Tenure Act, 1997 (ESTA) must be
served on the occupants. In 2022, Section 8 and Section 9 notices were served, and Sibanye-Stillwater launched an additional application in
the Land Claims Court which was heard in 2023. Although the application was successful in the first instance, the respondents were granted
leave to appeal. A proposed settlement was not accepted and the matter remains subject to further proceedings.
Title to Sibanye-Stillwater’s properties, particularly undeveloped ones, may also be subject to challenge. Title review does not necessarily
preclude third parties from contesting ownership. Sibanye-Stillwater’s US properties in Montana include a number of unpatented mining and
mill site claims. The validity of unpatented mining claims on public lands is often uncertain, and possessory rights of claimants may be subject
to challenge.
In addition, Sibanye-Stillwater pays annual maintenance fees and has obtained mineral title reports and legal opinions for some of the
unpatented mining claims or mill sites making up portions of its US properties, in accordance with applicable laws and what Sibanye-
Stillwater believes is standard industry practice. However, Sibanye-Stillwater cannot be certain that applicable laws will not be changed nor
that Sibanye-Stillwater’s possessory rights to any of its unpatented claims may not be deemed defective and challenged.
As a result, any such legislation could change the cost of holding unpatented mining claims and could significantly affect Sibanye-
Stillwater’s ability to develop ore reserves located on unpatented mining claims. All of the foregoing could adversely affect the economic
and financial viability of future mining operations at such mines.
If Sibanye-Stillwater loses senior or regional management in any of its regions or is unable to hire and/or retain sufficient technically skilled
employees or sufficient historically disadvantaged persons (HDPs) representation in management positions in South Africa, or maintain
required board gender diversity, Sibanye-Stillwater’s business may be materially adversely affected
Sibanye-Stillwater’s ability to operate or expand effectively depends largely on the experience, skills and performance of its senior and
regional management teams and technically skilled employees. However, the global mining industry, including Sibanye-Stillwater, continues
to experience a shortage of qualified management and technically skilled employees. In particular, Sibanye-Stillwater has historically
experienced shortages in technically skilled employees and high turnover at its United States PGM operations, which continued to affect
productivity and unit costs in 2025.
Additionally, in connection with the 2018 Mining Charter, mining companies are required to ensure sufficient HDPs participation in
management and core and critical skills, and failure to do so could result in fines, the loss or suspension of mining rights or other instructions
issued to Sibanye-Stillwater in terms of the MPRDA. See – Sibanye-Stillwater’s mining rights are subject to legislation, which could impose
significant costs and burdens and which impose certain ownership requirements, the interpretation of which may be the subject of dispute.
Sibanye-Stillwater is also legislatively required to take proactive steps to achieve an equitable representation of HDPs at all occupational
levels and to report on the extent to which its plan is being achieved. If Sibanye-Stillwater is unable to hire or retain appropriate
management and technically skilled personnel or is unable to obtain sufficient HDP representation in management positions, or if there are
not sufficient succession plans in place, this could have a material adverse effect on Sibanye-Stillwater’s business, result in the imposition of
fines and have a negative effect on production levels, operating results and financial position.
Further, Sibanye-Stillwater is required to comply with sectoral employment equity targets set by the South African Minister of Employment and
Labour in terms of the Employment Equity Amendment Act, 2022 (Act No. 4 of 2022) (EEAA), which came into effect on 1 January 2025. From
1 September 2025, designated employers operating in the mining sector, including Sibanye-Stillwater, have been required to implement a 5-
year employment equity plan to meet specific sectoral targets for designated groups, including targets for representation of historically
disadvantaged racial groups, women and persons with disabilities across different levels of the organisation. The inability to hire and/or retain
suitably qualified persons from designated groups may affect Sibanye-Stillwater's efforts in achieving sectoral targets, and failure to comply
with these targets could result in Sibanye-Stillwater being fined or denied a compliance certificate under the EEAA.
In addition, the JSE Listings Requirements mandate that listed companies have a broad diversity policy focused on the promotion of various
diversity attributes including gender diversity and report on gender representation to their stakeholders. Similarly, the MPRDA requires that at
least 20% of Board members are women. There can be no assurance that Sibanye-Stillwater will be able to recruit, attract and/or retain
qualified members of its Board and satisfy gender and diversity requirements under the JSE Listings Requirements, the MPRDA, the EEAA or
any other law that may become applicable to the Company, which may expose Sibanye-Stillwater to financial penalties and adversely
affect its reputation.
Sibanye-Stillwater is subject to risks associated with litigation and regulatory proceedings
As with most large corporations, Sibanye-Stillwater is, from time to time, involved as a party in litigation, arbitration, regulatory proceedings
and other disputes. Litigation, arbitration, regulatory proceedings and other types of disputes involve inherent uncertainties and, as a result,
Sibanye-Stillwater faces risks associated with adverse judgments or outcomes in such cases. In any such dispute, even where Sibanye-
Stillwater may ultimately prevail on the merits, Sibanye-Stillwater may expend significant costs and management time defending its rights,
lose certain rights or benefits during the pendency of any such litigation, arbitration, regulatory proceeding or other dispute, or suffer
negative publicity or reputational damage as a result of its involvement. For example, proceedings commenced by Appian Capital Advisory
(Appian) in May 2022 in the High Court of England & Wales relating to the termination of a proposed acquisition resulted in a ruling in favour
of Appian in October 2024, with Sibanye-Stillwater and Appian ultimately entering into a settlement agreement in November 2025. See –
Annual Financial Report – Consolidated financial statements – Notes to the consolidated financial statements – Note 29.2: Other provisions.
Sibanye-Stillwater is currently engaged in a number of legal and regulatory proceedings, the outcome of which remains uncertain. There
can be no assurance as to the outcome of any litigation, arbitration, regulatory proceeding or other dispute, and the adverse determination
of material litigation could have a materially adverse effect on Sibanye-Stillwater’s business, operating results and financial condition.
Sibanye-Stillwater’s financial flexibility could be constrained by South African Exchange Control Regulations
South Africa’s Exchange Control Regulations restrict the export of capital from South Africa. Transactions between South African residents
(including companies) and non-residents (excluding residents of the Republic of Namibia and the Kingdoms of Lesotho and Eswatini, known
collectively as the Common Monetary Area (CMA)) are subject to exchange controls enforced by the South African Reserve Bank (SARB).
While South African exchange controls have been relaxed in recent years, South African companies remain subject to restrictions on their
ability to deploy capital outside of the CMA. As a result, Sibanye-Stillwater’s ability to raise and deploy capital outside the CMA is restricted.
These restrictions could hinder Sibanye-Stillwater’s financial and strategic flexibility, particularly its ability to borrow funds from non-South
African sources, including the repayment of such borrowings and, in some cases, its ability to guarantee the obligations of subsidiaries. These
restrictions may affect the manner in which Sibanye-Stillwater finances its transactions outside South Africa and the geographic distribution
of its debt.
Social, political and economic uncertainty and instability in Zimbabwe and targeted sanctions against certain Zimbabwean entities may
affect future foreign investment in the country
One of Sibanye-Stillwater’s joint ventures, Mimosa, is a shallow underground PGM and base metal mining and processing operation located
in Zimbabwe. The joint venture is held by Sibanye-Stillwater and Impala Platinum Holding Limited (Implats) on a 50:50 basis. Zimbabwe’s
social, political and economic climate is currently highly uncertain, and the economy has been subject to significant volatility for many
years.
Zimbabwe as well as certain Zimbabwean nationals, have also been the subject of targeted sanctions by the United States, EU and the
United Kingdom. The sanctions are limited in scope, targeting only designated individuals and entities, including certain members of the
government, who are deemed to be undermining democratic institutions and processes in Zimbabwe.
Under the Minerals Marketing Corporation Act, 1983 (MMCZ Act), the Mineral Marketing Corporation of Zimbabwe (MMCZ) is the sole legal
exporter of all minerals mined in Zimbabwe and is entitled to a commission in relation to all sales, as an agent to the mining companies,
which is stipulated by the MMCZ Act. There is no requirement, legal or otherwise, for MMCZ to be involved in Mimosa’s operations or
management, and Sibanye-Stillwater has no contractual or other relationship with MMCZ outside of the MMCZ Act requirements. Mimosa
received an exemption from having to comply with the MMCZ Act from 4 August 2021, and in 2024, the MMCZ provided Mimosa notice of its
intention to revoke such exemption. The exemption itself has not yet been formally revoked. However, following the removal of MMCZ from
the United States Office of Foreign Assets Control (US OFAC) sanctions list in 2024, and the subsequent confirmation by Mimosa's principal
bankers that transacting with MMCZ since its removal from the sanctions list would not expose Mimosa to US OFAC penalties, MMCZ
requested that Mimosa resume settlement of export commissions to MMCZ’s bank accounts. This process resumed accordingly in July 2025.
While any commissions paid are not currently expected to be material, there can be no guarantee that this will be the case in future, or that
other requirements will not be imposed with respect to the MMCZ Act.
In 2020, the Zimbabwean Government introduced a 5% export tax on semi-processed platinum group metal concentrates to provide an
incentive for the development of processing facilities in Zimbabwe. The tax was deferred until 1 January 2025, at which point it became
legally effective. Mimosa sought a further deferment and was granted a concessionary rate of 3% on the value of platinum in concentrate
exported from 1 January 2025 to 31 December 2025, which has subsequently been extended to apply from 1 January 2026 to 31 December
2027. Moreover, Mimosa has entered into a local toll smelting arrangement to produce PGM-enriched matte for export. Current legislation
prescribes a 2.5% export tax on PGM-enriched matte, though the Zimbabwe Revenue Authority is not currently collecting this tax whilst
negotiations are underway for the export tax on PGM-enriched matte to be deferred or waived. There is uncertainty as to whether the
Zimbabwean Government will continue to defer or waive the 2.5% export tax on PGM-enriched matte, and if such deferral or waiver is not
granted, the enforcement of the full statutory export tax rate may have a material adverse effect on Mimosa's business. In addition, the
Finance Act No. 7 of 2025 includes a provision indicating that the export tax on PGM concentrates will increase to 10%, although this
increase is not expected to apply to Mimosa until after 31 December 2027.
Further, the Zimbabwean Government also introduced a 7% royalty on platinum, which the members of the Platinum Producers Group have
appealed to reduce to around 3%, with the royalty reviewed in line with movements in platinum prices, up to a maximum of 5%. It is
uncertain if the Zimbabwe Government will grant the requested reduction in the royalty rate, and if not granted, the combination of export
taxes and the 7% platinum royalty may adversely impact the financial viability of projects in Zimbabwe.
Continued economic and political uncertainty in Zimbabwe and targeted sanctions against certain Zimbabwean entities may affect future
foreign investment in the country and may lead to the imposition of further exchange controls, restrictions on the ownership of Sibanye-
Stillwater’s assets and its ability to raise funds for or operate its business and export minerals and metals from Zimbabwe. Should such events
occur, they may have an adverse effect on Sibanye-Stillwater’s business and operations in Zimbabwe as well as its financial condition.
Risks Related to Production Delivery from Operations
Energy shortages, load curtailment (including the risk of a total blackout) and usage constraints may force Sibanye-Stillwater to reduce or
halt operations
In recent years, major geopolitical events have significantly impacted the availability of energy sources globally. As a result of the ongoing
war in Ukraine, embargoes were placed on Russian gas and European countries sought to reduce their reliance on Russian energy supplies.
In addition, conflict in the Middle East, including in the context of recent developments in Iran, has led to severe disruption to global energy
supply chains. See – Actual and potential supply chain shortages and increases in the prices of production inputs may have a material
adverse effect on Sibanye-Stillwater’s operations and profits. This has, in turn, led to increased volatility in global energy costs across oil and
gas, increased commodity prices and demand for renewable energy components and, in certain jurisdictions, risk of energy supply
constraints. While Sibanye-Stillwater has implemented alternative and emergency power supplies, there is no guarantee they will be
sufficient to prevent material production losses in the future.
In South Africa, Sibanye-Stillwater’s operations depend on electrical power generated by the South African state utility, Eskom, which
generates and supplies the bulk of electricity in the South African market. Electricity supply in South Africa has been constrained over the
past decade as a result of various factors, including poor management, adverse weather events, civil unrest, continued poor generation
performance and reliability, diesel shortages and the slow connection of new generation capacity and regulatory hurdles in relation to the
generation of electricity by independent power producers. These supply constraints have led to the emergency reduction of national
electricity demand through the implementation of load shedding and load curtailment.
Under load curtailment, Sibanye-Stillwater’s South African operations are required to reduce power demand which can result in production
losses. In 2023, the levels and duration of load curtailments hit record highs, affecting approximately 1.4% of total production output at
Sibanye-Stillwater’s South African PGM operations. While the situation improved significantly in 2024, achieving more than 275 consecutive
days without load shedding, and continued to improve in 2025, with only 63 hours of load curtailment and no load shedding or curtailment
events since May 2025, there is no guarantee that such improvements can be maintained. In addition, while the Castle wind farm and
Springbok solar photovoltaic plant, which reached commercial operation in 2025, may partly reduce Sibanye-Stillwater’s reliance on Eskom
and lessen exposure to future load curtailment, there can be no assurance that the energy produced from these renewable projects will be
sufficient to offset the impact of future curtailment requirements or that Sibanye-Stillwater will be able to comply with such requirements
without incurring material production losses.
Eskom’s inability to fully meet the country’s demand has led, and may continue to lead, to further load shedding, load curtailment, rolling
blackouts and possibly a total blackout due to a collapse of the grid. There is no assurance that Eskom’s efforts to protect the national
electricity grid will prevent a partial or complete national blackout, which would have a material adverse effect on Sibanye-Stillwater’s
business, operations, operating results and financial condition, including permanent loss or damage to mining infrastructure due to flooding.
In addition to supply constraints, severe weather events and labour unrest in South Africa has disrupted, and may in the future disrupt, the
supply of coal to power stations operated by Eskom or may incapacitate the power stations directly, resulting in curtailed supply. For
example, in November 2023, a heat wave across South Africa resulted in higher power station efficiency losses and higher national demand.
This, combined with unplanned power station outages, resulted in significant national load shedding and load curtailment at Sibanye-
Stillwater’s SA operations. Eskom may also face regulatory enforcement action that may disrupt its supply of electricity. For example, in 2021,
Eskom received unfavourable decisions from the DFFE for multiple power generation facilities in response to its applications for the
postponement of air quality Minimum Emission Standards set out in terms of the Air Quality Act. If implemented, the decisions will result in
Eskom having to shut down 16,000MW of installed coal fired capacity. Eskom has appealed against the adverse decision and the issue
remains unresolved. Eskom subsequently received an exemption in March 2025 to continue operating several power stations outside of the
Minimum Emissions Standards through April 2030. In September 2025, Eskom launched review proceedings challenging the exemption's
conditions due to concerns that the compliance timeline poses a risk to security of supply. This exemption is also subject to separate legal
challenges by environmental and other non-profit organisations on the basis that it is too lenient. The outcome of these proceedings remains
uncertain and could result in further disruption to Eskom's electricity supply capacity. Energy shortages may also occur as a result of copper
cable theft (and other non-ferrous metals) at its SA operations. For example, theft of metal resulted in the collapse of a pylon in February
2022, which cut power supply to Sibanye-Stillwater’s Cooke shafts. See also – Theft of gold, PGM and production inputs, cable theft, as well
as illegal mining, may occur on some of Sibanye-Stillwater’s properties. These activities could disrupt Sibanye-Stillwater’s business and can
expose Sibanye-Stillwater to liability.
In addition, power fluctuations and/or energy constraints leading to curtailment have occurred and do occur at Sibanye-Stillwater’s
operations in Europe, the United States and Zimbabwe, which can cause operational outages, production losses and/or additional
production costs.
Further disruptions or constraints in electricity or other energy supply to Sibanye-Stillwater’s operations could have a material adverse effect
on its business, operating results and financial condition.
Economic, political or social factors affecting the regions where Sibanye-Stillwater operates may have a material adverse effect on Sibanye-
Stillwater’s operations and profits
Sibanye-Stillwater's principal operations are in southern Africa and the United States, with its domicile and a majority of its operations located
within South Africa. Changes to or increased instability in the economic, political or social environment in these regions, particularly in South
Africa or surrounding countries, could create uncertainty, which discourages investment in the region and may affect an investment in
Sibanye-Stillwater. In addition, socio-political instability and unrest may also disrupt Sibanye-Stillwater’s business and operations, compromise
safety and security, increase costs, affect employee morale, impact Sibanye-Stillwater’s ability to deliver on its operational plans, create
uncertainty regarding mining licences and cause reputational damage, any of which could have a material adverse effect on Sibanye-
Stillwater’s business, operating results and financial condition. The impacts of such social factors may be more acute in the mining sector. For
example, in the context of increased inflation and unemployment, there has been a rise in attempts to use illegal methods, including
extortion, threats and force, to obtain lucrative procurement contracts. Furthermore, such social and economic factors, along with the
prevalence of organised crime in South Africa, has, and may continue to pose, significant safety risks to Sibanye-Stillwater personnel.
Civil unrest, high levels of unemployment, particularly among the youth, and a shortage of critical skills in South Africa, despite increased
government expenditure on education and training, remain issues and deterrents to foreign investment. The volatile and uncertain labour
environment, which severely impacts on the local economy and investor confidence, has also been a factor in the country’s downgrade in
national credit ratings to non-investment grade, making investment more expensive and difficult to secure. See risk factors entitled –
Sibanye-Stillwater’s operations and profits have been and may be adversely affected by labour unrest and union activity and – The
continued status of South Africa’s credit rating as non-investment grade may have an adverse effect on Sibanye-Stillwater’s ability to secure
financing or could result in any such financing being available only at greater cost. This may restrict Sibanye-Stillwater’s future access to
international financing and could have a material adverse effect on Sibanye-Stillwater’s business, operating results and financial condition.
A further source of potential economic and political instability in South Africa relates to the proposed nationalisation of the South African
Reserve Bank (SARB). The South African Reserve Bank Amendment Bill of 2018 (SARB Amendment Bill) proposes to nationalise the SARB by
making the state the sole shareholder of the SARB and empowering the Minister of Finance to appoint all directors of the SARB. This proposal
was announced by the President of South Africa in 2019 and public hearings were held in July 2025, though the SARB Amendment Bill
remains under consideration in the National Assembly and has not been enacted. The SARB's independence and mandate remain
constitutionally protected, with the Constitution of South Africa expressly obliging the SARB to perform its functions independently. Moreover,
the shareholders of the SARB do not influence the SARB’s regulatory or supervisory decisions. However, despite these constitutional and
legislative protections, the nationalisation of the SARB could negatively impact investor perception of the SARB's independence and raise
concerns about potential political influence over monetary policy. Whilst state ownership of central banks is common globally, with most
central banks being wholly state-owned yet maintaining operational independence, any economic or political instability arising from a
nationalisation process or any deterioration in investor confidence may create complications relating to the movement of funds into or out
of South Africa and impact the general business environment in South Africa, including for companies such as Sibanye-Stillwater. Any such
negative impact on the South African economy may materially adversely affect Sibanye-Stillwater's business, operating results and financial
condition.
While the South African government has stated that it does not intend to nationalise mining assets or mining companies, certain political
parties favour a policy of nationalisation. See – Sibanye-Stillwater’s operations and financial condition could also be adversely affected by
policies and legislation related to greater state intervention in the mining industry and potentially the expropriation of mining assets without
compensation. Any potential, or actual proceedings, to nationalise any of Sibanye-Stillwater’s assets could halt or curtail operations,
resulting in a material adverse effect on Sibanye-Stillwater’s business, operating results and financial condition and could cause the value of
Sibanye-Stillwater’s securities to decline rapidly and dramatically, possibly causing investors to lose the entirety of their respective
investments.
In addition, economic and political instability in regions outside jurisdictions where Sibanye-Stillwater operates, including in surrounding
countries or geopolitical events, such as the ongoing war in Ukraine and political instability and armed conflict in the Middle East, including
in the context of recent developments in Iran and more broadly in the Middle East region, may result in unavoidable uncertainties and
events that could negatively affect costs of business or availability of supplies, cause volatility in currency exchange rates, commodity
prices, interest rates and worldwide political, regulatory, economic or market conditions and contribute to instability in political institutions,
regulatory agencies and financial markets any of which could have a material adverse effect on Sibanye-Stillwater’s business, operating
results and financial condition.
Due to the mature infrastructure at Sibanye-Stillwater’s mining operations, unplanned breakdowns, statutory mandated modifications and
stoppages may result in production delays, increased costs and industrial accidents
Nearly all of Sibanye-Stillwater’s operating shafts and processing plants across its operations are relatively mature. Maintaining this
infrastructure requires skilled people, capital allocation, management and regular, planned maintenance. Once a shaft, processing plant or
refinery has reached the end of its intended lifespan or needs modification to comply with the applicable regulatory standards and to
continue operating reliably, more than normal maintenance, care and remediation is required. In addition, the breakdown of certain critical
infrastructure and components, including as a result of operating errors, may temporarily halt production. Although Sibanye-Stillwater has
comprehensive inspection and maintenance strategies in place, incidents resulting in production delays, increased costs or industrial
accidents may occur. There is also a risk that delays in procuring critical spares for major repairs may result in disruptions to production. Such
incidents may have a material adverse effect on Sibanye-Stillwater’s business, operating results and financial condition.
Sibanye-Stillwater’s operations and profits have been and may be adversely affected by labour unrest and union activity
Sibanye-Stillwater’s workforce is unionised across most of its operations, with a total of approximately 88% unionised employees (excluding
DRDGOLD, Keliber, Sandouville, Century, North Carolina site and Pennsylvania site operations) as of 31 December 2025. Organised labour
dynamics in the mining sector, particularly in South Africa, are volatile and uncertain and, as such, they have had, and may in the future
have, a material adverse impact on Sibanye-Stillwater’s operations, production and financial performance. Union activity and labour unrest
in South Africa may result in industrial disputes and extended negotiations that have, along with other factors, negatively affected South
Africa’s sovereign debt rating and subsequently the credit ratings of the country’s leading mining companies. Sibanye-Stillwater has in the
past, and may in the future, experience strikes and work stoppages, including both protected and unprotected industrial action. Wage
disputes, and any resulting industrial actions, are difficult to control and can lead to significant disruptions at Sibanye-Stillwater’s operations,
expose it to liability and materially and adversely affect its business, operating results and financial condition. In addition, rivalries between
unions, such as AMCU and NUM, may also destabilise labour relations in the mining sector. For example, in October 2023, sit-in protests were
initiated by workers affiliated with an unrecognised rival union at two gold mines in South Africa (neither of which was operated by Sibanye-
Stillwater) resulting in hundreds of workers remaining underground for several days. Although such incidents are not related to Sibanye-
Stillwater’s normal operations, they may impact ongoing labour relations at Sibanye-Stillwater and in South Africa, in general.
In addition, Sibanye-Stillwater has in the past, and may in the future, undertake restructuring processes in response to, among other things,
the cost structure of an operation, commodity prices, currency exchange rates, operating shafts reaching their end-of-life, acquisitions, and/
or business combinations, which may result in the retrenchment of employees. Such restructurings may lead to labour unrest, reduced
production levels and reputational harm to Sibanye-Stillwater, which could have a material adverse effect on Sibanye-Stillwater’s business,
operating results and financial condition. In addition, there is no guarantee that any such process will provide the cost savings or other
benefits anticipated by management whether due to labour unrest, reduced production or other factors.
In the United States, Sibanye-Stillwater’s employees located at the US PGM operations, which include the Stillwater and East Boulder mines
and the Columbus metallurgical complex, are covered by two collective bargaining agreements with the United Steel Workers Local 11-001
(USW). Sibanye-Stillwater and the USW agreed to one-year contract extensions in June 2025. The Stillwater Mine and Columbus contract
expires on May 31, 2026, and the East Boulder Mine contract expires on July 31, 2026. Sibanye-Stillwater is subject to the risk of strikes and
other labour disputes at its US PGM operations, and its ability to alter labour costs is restricted by the fact that unionised employees are party
to collective bargaining agreements.
In the event that further industrial relations-related interruptions were to occur at any of Sibanye-Stillwater’s operations, other mines’
operations or in other industries that impact its operations, or that increased employment-related costs were to occur due to union or
employee activity, such as wage negotiations, these may have a material adverse effect on its business, production levels, production
targets, results of operations, financial condition, reputation and future prospects. In addition, lower levels of mining activity can have a
longer-term impact on production levels and operating costs, which may affect operating life. Mining conditions can deteriorate during
extended periods without production and Sibanye-Stillwater will not recommence mining until health and safety conditions are considered
appropriate to do so.
Actual and potential supply chain shortages and increases in the prices of production inputs may have a material adverse effect on
Sibanye-Stillwater’s operations and profits
Sibanye-Stillwater’s results of operations may be affected by general cost increases due to the availability and pricing of critical spares, raw
materials and other essential production inputs, including, for example, gas, diesel, electricity, explosives, fuel, steel products, cyanide and
other reagents required at its mining and processing operations. The price and quality of raw materials may be substantially affected by
changes in global supply and demand, along with weather conditions, governmental controls and other relevant factors. In recent years,
global markets have been adversely impacted by various credit crises and significant fluctuations in fuel and energy costs and metals
prices, including as a result of the COVID-19 pandemic and due to significant fluctuations in commodity prices as a result of the
continuance of the war in Ukraine and the economic sanctions imposed on Russia in connection therewith. In addition, recent
developments in Iran, and conflict in the Middle East region more broadly, have resulted in an effective shutdown of the Strait of Hormuz,
through which a significant proportion of global oil and gas supplies transit, which has led to severe disruption to global energy supply
chains. Prolonged conflict in the region could lead to even more significant and sustained increases in oil and gas prices, heightened freight
and logistics costs, delays or interruptions in the delivery of critical mining equipment, consumables and spare parts, and increased costs of
existing and alternative supply arrangements. A sustained interruption in the supply of any materials essential to the Group’s operations
could require Sibanye-Stillwater to find acceptable substitute suppliers and could require Sibanye-Stillwater to pay higher prices for such
materials. Sibanye-Stillwater may also be required to increase investments in critical spare inventory to compensate for increased delivery
lead times or potential unavailability of items, which may impact its working capital requirements.
The prices of certain of Sibanye-Stillwater’s production inputs are impacted by, among other things, the prices of oil and steel, which may be
volatile. For example, in fiscal year 2025, the price of oil fluctuated between US$55 and US$79 (2024: US$65 and US$88) per barrel of Brent
Crude. As at 31 March 2026, the price of oil was US$101 per barrel of Brent Crude. Recent geopolitical developments, including the ongoing
conflict in the Middle East involving Iran, have contributed to increased volatility in crude oil prices and have affected fuel prices (including
petrol and diesel) in South Africa and globally. Such volatility may result in increased input costs and contribute to inflationary pressures on
Sibanye-Stillwater’s production expenses. During fiscal 2025, the Group’s South African operations also experienced price increases
exceeding inflation on imported spares, steel related products, ammonia-based products, fuel, oil and electricity.
Any significant increase in the prices of these materials will increase Sibanye-Stillwater’s operating costs and affect production
considerations.
Because Sibanye-Stillwater’s operations are regionally concentrated, disruptions in these regions could have a material adverse impact on
the operations
Sibanye-Stillwater’s South African PGM operations (Marikana, Rustenburg, Kroondal and Platinum Mile) are located between the two towns
of Rustenburg and Brits and the majority of its gold mining operations are located in the north western and south western margins of the
Witwatersrand Basin in South Africa. While Sibanye-Stillwater has recently diversified its operations into a number of additional new
jurisdictions beyond its first international expansion into the United States, including Finland and Australia, and into new metals, this
diversification has only reduced its reliance on South African gold and PGM production to a limited extent. As a result, any adverse
economic, political or social conditions affecting these regions or surrounding regions, as well as natural disasters or coordinated strikes or
other work stoppages, could have a material adverse effect on Sibanye-Stillwater’s business, operating results and financial condition.
Contagious diseases, including global pandemics, pose risks to Sibanye-Stillwater in terms of lost productivity and increased costs
Sibanye-Stillwater’s operations have been and may in future be impacted by the spread of contagious diseases and global pandemics
(such as COVID-19). Employee or contractor absences due to such illnesses have in the past, and may in the future, lead to labour shortages
or disruptions to Sibanye-Stillwater’s production (including potential temporary cessation) and increased operational costs. In addition, a
pandemic or the fear thereof could adversely affect global economies and financial markets, resulting in volatility or an economic
downturn, which may in turn impact global metals prices and the Group's ability to raise sufficient capital to finance ongoing projects. Any
actions taken by governments or regulators in response to such outbreaks, including travel-related restrictions, could result in the inability of
Sibanye-Stillwater’s suppliers to deliver components or raw materials on a timely basis and may limit or prevent Sibanye-Stillwater’s
management and employees and other important third-parties from travelling to, or visiting, Sibanye-Stillwater’s operations.
The spread of contagious diseases such as respiratory diseases may be exacerbated by communal housing and close quarters. The spread
of such diseases could impact employees’ productivity, treatment costs and, therefore, operational costs, which may in turn have a material
adverse effect on Sibanye-Stillwater’s business, operating results and financial condition.
Sibanye-Stillwater’s mineral reserves and mineral resources are estimates at a specific point in time, based on a number of technical and
economic assumptions, which, if changed, may require Sibanye-Stillwater to lower the estimated mineral reserves and mineral resources
and may not be replaced as depleted
The mineral reserves and mineral resources of Sibanye-Stillwater are estimates based on assumptions regarding, among other things,
Sibanye-Stillwater’s costs, expenditures, commodity prices, currency exchange rates, metallurgical and mining recovery assumptions, which
may prove inaccurate due to a number of factors, many of which are beyond its control. Mineral reserves are classified as proved or
probable, to reflect the level of confidence in both the underlying techno-economic and mineral resources. The mineral resource estimates
that feed into the mineral reserves depend on statistical inferences and structural modelling, drawn from drilling information and face
samples, which may prove to be inaccurate, unreliable or unrepresentative due to the inherent variability and complexity of an orebody.
Although mineral resource classifications take cognisance of the inherent uncertainty, sometimes unexpected geologic conditions, such as
faulting, dykes, “potholes” or poor ground conditions can be encountered as mining proceeds. The effect of these can result in mining area
losses, increased costs and additional dilution of ore grade during mining operations. In the event that Sibanye-Stillwater adversely revises
any of the techno-economic assumptions that underlie its mineral reserves, this may result in a revision of mining plans and/or mineral
reserves.
In addition, commodity price assumptions, including the market price for gold, PGMs, nickel, zinc and lithium, are subject to considerable
uncertainty. Declines in the market prices of such metals may render mineral reserves and mineral resources containing relatively lower
grades of mineralisation uneconomic to exploit, and Sibanye-Stillwater may be required to reduce mineral reserve and mineral resource
estimates, discontinue development at one or more of its properties or write down assets as impaired. In addition, Sibanye-Stillwater may
pursue acquisitions or enter into joint ventures to replace its mineral resources and mineral reserves at its operations or expand its mineral
reserve and mineral resource base; however, there can be no assurance that such efforts will be successful. See – Sibanye-Stillwater’s growth
strategy may not deliver anticipated outcomes in the timeframe anticipated or at all.
Any downward revision or failure to replace mineral reserves and mineral resources may lead to an impairment or write down of assets,
which could have a material adverse effect on its business, operating results, life of operations and financial condition.
Risks Related to Earnings Delivery
Changes in the market price for gold, silver, PGMs, zinc and lithium and related by-products may affect the profitability of Sibanye-
Stillwater’s major capital projects, recycling, mining and refining operations and the cash flows generated by those operations
Sibanye-Stillwater’s revenue from its mining and other operations is primarily derived from the sale of the commodities that it produces. As a
result, it is generally exposed to changes in the gold and PGM prices, which could lead to reduced revenue should the gold or PGM basket
price decline. For example, during the year ended 31 December 2025, the gold price fluctuated between US$2,624/oz and US$4,532/oz, the
platinum price fluctuated between US$894/oz and US$2,535/oz, the palladium price fluctuated between US$866/oz and US$2,024/oz and
the rhodium price fluctuated between US$4,575/oz and US$9,175/oz. Sibanye-Stillwater has in the past, and may in the future, utilise
commodity derivative or other hedging products, including to protect cash flows at times of significant capital expenditure, financing
projects or to safeguard the viability of higher cost operations. In its US Recycling operations, Sibanye-Stillwater regularly enters into fixed
forward sales contracts for metal produced from the processing of precious metal-bearing waste and spent autocatalyst recycling, normally
making these commitments at the time the precious metal-bearing waste material is purchased to achieve price matching between
process feedstock and product. For Sibanye-Stillwater’s fixed forward sales related to recycling, Sibanye-Stillwater is subject to the
customers’ compliance with the terms of the agreements, their ability to terminate or suspend the agreements and their willingness and
ability to pay. There can be no assurance that the use of such commodity derivative or other hedging products will result in outcomes that
are favourable to Sibanye-Stillwater. For example, hedging instruments may fail to prevent losses from being realised in the event of
subsequent decreases in commodity prices or, conversely, may limit the ability of Sibanye-Stillwater to benefit from subsequent increases in
commodity prices. As a result, Sibanye-Stillwater may not realise the anticipated benefits of hedging instruments, and in the absence of such
benefits, there could be a material adverse effect on Sibanye-Stillwater's financial performance.
The market price for gold has historically been volatile and is affected by numerous factors over which Sibanye-Stillwater has no control,
such as general supply and demand, speculative trading activity and global macro-economic drivers. For example, gold has historically
been used as a hedge against unstable or lower economic performance, thus improved economic performance, particularly in the United
States, may have a negative impact on the price for gold. In recent periods, trading in gold has been volatile amid global political, social
and economic uncertainties, and the metal has traded at or near record levels, reaching all-time highs above U.S. $5,000 in the first quarter
of 2026. However, there can be no guarantee that elevated price levels will be sustained, and, if gold prices were to decrease from
currently elevated levels, Sibanye-Stillwater may be exposed to additional risks, including the risk that certain mineral reserves or mineral
resources may no longer be considered economically viable. See – Depressed or volatile commodity prices may impact Sibanye-Stillwater’s
ability to implement its business strategy, fund capital expenditures and obtain financing.
The market price for PGMs has been similarly volatile, and in recent years, has declined precipitously primarily as a result of global
macroeconomic conditions. As of 31 December 2025, the prices of gold, platinum, palladium and rhodium prices were US$4,343/oz,
US$2,054/oz, US$1,796/oz and US$8,050/oz, respectively.
Should the gold or PGM price decline below Sibanye-Stillwater’s production costs, it may experience losses and, should this situation persist
for an extended period, Sibanye-Stillwater may be forced to curtail or suspend some or all of its projects, operations and/or reduce
operational capital expenditures. For example, in 2024, Sibanye-Stillwater completed a Section 189A of the Labour Relations Act, 1995 (LRA)
restructuring process (189A process) at four shafts of the South African PGM operations, partly attributable to a decline in PGM prices making
two of the shafts unprofitable, and two others reaching end of life. Additionally in November 2024, Sibanye-Stillwater completed a
restructuring in Montana which resulted in placing Stillwater West on care and maintenance, following a sustained decline in PGM prices, as
a result of which output is expected to decrease at the US PGM operations, in order to phase expansion capital over the next two to three
years. Sibanye-Stillwater might not be able to recover any losses incurred during, or after, such events.
A sustained period of significant gold or PGM price volatility may also adversely affect Sibanye-Stillwater’s ability to undertake new capital
projects or to make other long-term strategic decisions. In addition, a sustained period of elevated gold prices may present additional risks
to Sibanye-Stillwater. Also see – Depressed or volatile commodity prices may impact Sibanye-Stillwater’s ability to implement its business
strategy, fund capital expenditures and obtain financing.
In addition, changes in supply and demand drivers for PGMs may cause the prices of PGMs to fall over the short or long-term. For example,
PGM prices are linked to demand for catalytic converters in combustion engine and hybrid automobiles, among other things. Beginning in
2022, continued macroeconomic uncertainty, together with persistent inflation and higher interest rates, led to decreased consumer
demand for new vehicles, with vehicles remaining in service for extended periods and fewer vehicles being scrapped. Such decreased
demand contributed to a continued decline in PGM prices through 2024. Although PGM prices showed signs of recovery in 2025, PGM prices
remain sensitive to multiple factors, including global economic conditions that impact automotive, industrial and investment demand, as
well as fluctuations in both primary and secondary supply. Any economic downturn or other event that reduces the sale of automobiles will
also likely impact the price of PGMs. In addition, high PGM prices may cause demand destruction, which would cause the price of such
PGMs to fall. In addition, the increase in the number of electric cars has, and may further in future, reduce the price for PGMs by reducing
demand for catalytic converters (which require PGMs) used in gasoline and diesel powered vehicles.
Sibanye-Stillwater is also impacted by fluctuations in other core metals and by-products. For example, in recent years the market prices for
nickel, zinc, silver and lithium have fluctuated widely. During the year ended 31 December 2025, the price of zinc, silver, chrome and lithium
hydroxide monohydrate fluctuated between US$2,562/tonne and US$3,211/tonne, US$28/tonne and US$79/tonne, US$200/oz and US$295/oz,
and US$8,144/tonne and US$14,866/tonne, respectively. Such fluctuations may affect the profitability of the Group’s operations and the
viability of its major capital investment projects. For example, a decrease in the long-term forecast lithium hydroxide price contributed to an
impairment on the Keliber lithium project at 30 June 2025 and at 31 December 2025. The persistently low lithium hydroxide price has resulted
in a staged start-up for operations at Keliber in 2026, which consists of first initiating ore mining, followed by the concentrator start-up, in order
to minimise losses.
Any of the above could have a material adverse effect on Sibanye-Stillwater’s business, operating results and financial condition.
Because gold and PGMs are generally sold in US dollars, while the majority of Sibanye-Stillwater’s gold production and a substantial amount
of Sibanye-Stillwater’s PGM production costs are denominated in rand, Sibanye-Stillwater’s operating results and financial condition will be
materially affected if there is a material change in the value of the rand
Gold and PGMs are principally sold throughout the world in US dollars, but Sibanye-Stillwater’s costs of production at its operations in South
Africa are primarily incurred in rand. Recent volatility in the rand has made Sibanye-Stillwater’s costs and operating results less predictable
than when currency exchange rates are more stable. Throughout 2023, the rand weakened against the dollar, falling to a yearly average
exchange rate of R18.46 for the year ended 31 December 2023. For the year ended 31 December 2024, the rand recovered marginally to a
yearly average exchange rate of R18.32/US$. For the year ended 31 December 2025, the rand strengthened further to a yearly average
exchange rate of R17.88/US$. See – The continued status of South Africa’s credit rating as non-investment grade may have an adverse
effect on Sibanye-Stillwater’s ability to secure financing or could result in any such financing being available only at greater cost. Any
significant appreciation of the rand against the US dollar would increase Sibanye-Stillwater’s operating costs in US dollar terms, and reduce
revenue in rand terms, which could materially adversely affect its operating results and financial condition from the South African operations.
Conversely, a weakening of the rand may result in higher inflation in South Africa, which would increase the prices Sibanye-Stillwater pays for
products and services. In light of these factors and the likely impact on cash flow, management regularly re-evaluates its current growth
capital expenditure plans, and from time to time, Sibanye-Stillwater utilises currency hedges to protect cash flows.
Certain projects may be deferred or placed on care and maintenance until confidence that commodity prices and/or currency exchange
rate volatility supports the financial viability of the project. Should a strong rand/US dollar exchange rate persist without a corresponding gain
in commodity prices, Sibanye-Stillwater may consider adjusting mine plans, reducing capital expenditure or selling assets and, if necessary,
options to increase funding flexibility. Also see – Sibanye-Stillwater has a large amount of indebtedness. Failure to comply with its debt
covenants or difficulties in obtaining necessary financing could have a material adverse effect on its business, operating results and financial
condition. All of the above could have a material adverse effect on Sibanye-Stillwater’s business, operating results and financial condition.
Sibanye-Stillwater has a large amount of indebtedness. Failure to comply with its debt covenants or difficulties in obtaining necessary
financing could have a material adverse effect on its business, operating results and financial condition
As at 31 December 2025, Sibanye-Stillwater had R39.3 billion (US$2.4 billion) principal amount of indebtedness outstanding (excluding the
Burnstone Debt), in addition to committed undrawn debt facilities of R21.2 billion (US$1.3 billion). Sibanye-Stillwater’s borrowings and credit
facilities contain financial and/or other covenants and restrictions. Such covenants may include restrictions on Sibanye-Stillwater incurring
additional financial indebtedness and obligations to maintain certain financial covenant ratios for as long as any amount is outstanding
under such facilities. Specifically, Sibanye-Stillwater’s borrowing facilities generally permit a maximum leverage ratio (net cash/debt to
adjusted EBITDA) of 2.5:1, calculated on a quarterly basis, although this ratio was temporarily relaxed to 3.5:1 until 30 June 2025, and 3.0:1
until 31 December 2025. The lower commodity prices which prevailed in 2024, following the significant decline in commodity prices over the
course of 2023 coupled with operational and production challenges, resulted in a deterioration of the leverage ratio from a net debt to
adjusted EBITDA ratio of 0.58:1 as at 31 December 2023 to a net debt to adjusted EBITDA ratio of 1.79:1 at 31 December 2024, which
improved to a net debt to adjusted EBITDA ratio of 0.59:1 as at 31 December 2025 following an increase in commodity prices during the
second half of 2025. Sibanye-Stillwater’s overall liquidity position, including its ability to maintain its leverage ratio, may be impacted, among
other factors, by a further decline in commodity prices, prolonged period at current depressed prices or a decline in production, including
as a result of industrial action, shaft incidents, natural events and other operational incidents that constrain production at Sibanye-Stillwater’s
operations. See – Depressed or volatile commodity prices may impact Sibanye-Stillwater’s ability to implement its business strategy, fund
necessary and strategic capital expenditures and obtain financing and – Sibanye-Stillwater’s operations and profits have been and may be
adversely affected by labour unrest and union activity.
Sibanye-Stillwater intends to incur additional indebtedness to develop its projects in furtherance of its strategy. In addition to targeted
borrowings to fund its strategy, in the near-term, Sibanye-Stillwater expects to manage its liquidity needs from cash generated by its
operations, cash on hand, the committed and unutilised debt facilities, as well as additional funding mechanisms. Sibanye-Stillwater, if
necessary, in order to manage its covenants, may also consider additional options to increase funding flexibility which may include, among
others, streaming facilities, prepayment facilities, facility restructuring, or in the event that other options are not deemed preferable by the
Board, an equity capital raise. However, there can be no assurance that funding will be available to Sibanye-Stillwater on acceptable terms,
if at all, and that any of the measures which Sibanye-Stillwater may undertake to increase liquidity or actively manage its covenants would
be successful.
If Sibanye-Stillwater’s cost of debt were to increase or if it were to encounter other difficulties in obtaining financing, its sources of funding
may not match its financing needs, which could have a material adverse effect on Sibanye-Stillwater’s strategy, business, operating results
and financial condition.
Depressed or volatile commodity prices may impact Sibanye-Stillwater’s ability to implement its business strategy, fund capital expenditures
and obtain financing
Commodity prices significantly influence the Group’s revenue, profitability, access to capital and future rate of growth. Lower commodity
prices may reduce Sibanye-Stillwater’s cash flows and borrowing ability and make it more difficult to execute its business strategy, including
capital intensive projects, resource optimisation and organic growth initiatives, as well as its ability to execute and achieve sustainability
plans and targets. For example, between 2023 and 2024, continued macroeconomic uncertainty, together with continued inflation and
higher interest rates, led to a marked decline in PGM prices. As a result of this decline in PGM prices, certain shafts of Sibanye-Stillwater’s
South African and United States PGM operations became unprofitable and the Group completed targeted restructuring consultations in
respect of such operations. Although PGM prices have shown improvement in the short-term, supported by increased demand and supply
constraints resulting from reduced production capacity, there can be no assurance that this recovery will be sustained or that prices will
continue to improve. A continued decline in PGM or other commodity prices impacting the Group’s revenue may cause the Group to
suspend or further restructure certain of its operations, reduce capital expenditure and materially impact its profitability and ability to
execute its strategy.
Reduced or volatile commodity prices, or prolonged depressed commodity market conditions, may also make it harder for Sibanye-
Stillwater to allocate capital or obtain financing on satisfactory terms, which could impact its ability to develop future reserves and lead to a
decline in Sibanye-Stillwater’s earnings potential. Lower long term commodity prices may also impact the economic viability of Sibanye-
Stillwater’s mineral reserves, resulting in a reclassification or reduction in proven reserves and/or resources at affected operations. Moreover,
a sustained period of elevated gold prices may present risks to Sibanye-Stillwater. In recent periods, the price of gold has reached near
record levels, trading above US$5,000 in the first quarter of 2026. Higher gold price assumptions may support increases in mineral reserve and
mineral resource estimates and extensions of life-of-mine plans; however, if gold prices were to decrease from currently elevated levels,
certain mineral reserves or mineral resources may no longer be considered economically viable, which could result in downward revisions to
mineral reserves and mineral resources, reduced mine lives and potential impairments of mining assets. See – Sibanye-Stillwater’s mineral
reserves and mineral resources are estimates at a specific point in time, based on a number of technical and economic assumptions, which,
if changed, may require Sibanye-Stillwater to lower the estimated mineral reserves and mineral resources and may not be replaced as
depleted. Elevated gold prices may also increase competition for, and the acquisition cost of, high-quality development and in-production
assets, and may place upward pressure on costs such as wages, consumables and services. See – Sibanye-Stillwater’s growth strategy may
not deliver anticipated outcomes in the timeframe anticipated or at all.
Any of the foregoing may materially and adversely affect Sibanye-Stillwater’s future business, operating results, financial condition, as well as
its operations, liquidity, or ability to finance planned capital expenditures.
The continued status of South Africa’s credit rating as non-investment grade may have an adverse effect on Sibanye-Stillwater’s ability to
secure financing or could result in any such financing being available only at greater cost
On 14 November 2025, Standard & Poor’s upgraded South Africa’s sovereign credit rating from BB- to BB, with a positive outlook. On 12
September 2025, Fitch Ratings affirmed South Africa’s sovereign credit rating of BB- and maintained a stable outlook. On 5 December 2025,
Moody’s affirmed South Africa's sovereign credit rating as Ba2 with a stable outlook.
The continued status of South Africa’s sovereign credit rating as non-investment grade by Standard & Poor’s, Moody’s or Fitch Ratings may
impact the ability of the private sector to raise capital, making it more difficult for Sibanye-Stillwater to obtain external financing or could
result in any such financing being available only at greater cost or on more restrictive terms than might otherwise be available. Previous
downgrades and the continued status of South Africa’s sovereign credit rating as non-investment grade could also have a material adverse
effect on the South African economy as many pension funds and other large investors are required by internal rules to sell bonds once two
separate agencies rate them as non-investment grade. Any such negative impact on the South African economy may adversely affect
Sibanye-Stillwater’s business, operating results and financial condition.
Energy cost increases may adversely affect Sibanye-Stillwater’s results of operations
Sibanye-Stillwater’s mining operations in South Africa largely depend upon electrical power generated by the state-owned power supply
utility, Eskom. Eskom, which supplied the vast majority of the country’s electricity needs during 2025, has historically experienced financial
difficulties that have been caused by several factors. Some factors include inadequate maintenance and replacement strategy of aging
generation units, the inability for the national transmission grid to accommodate new renewable energy generation, over expenditure on
capital projects, under recovery of revenues from defaulting customers, high levels of indebtedness, inadequate maintenance and high
primary energy costs. More recently, during certain periods of supply-constraint, Eskom has utilised significant amounts of diesel to run its gas
turbines while concurrently losing electricity sales as a result of load shedding or curtailment, which has contributed to above inflation tariff
applications. See – Energy shortages, load curtailment (including the risk of a total blackout) and usage constraints may force Sibanye-
Stillwater to reduce or halt operations.
The electricity supply industry in South Africa, including Eskom tariffs, is regulated by the National Energy Regulator of South Africa (NERSA).
Eskom tariffs are determined through a consultative multi-year price determination (MYPD) process, with recoveries of prudently incurred
over-expenditure in prior years recoverable through supplementary levies under the regulatory clear account (RCA) mechanism. In January
2025, NERSA approved a 12.74% increase for 1 April 2025, a 5.36% increase for 1 April 2026 and a 6.19% increase for 1 April 2027, informed by
NERSA’s assessment of Eskom’s MYPD 6 application. Eskom lodged a judicial review on 2 July 2025 to challenge NERSA’s decision, which was
settled between Eskom and NERSA in August 2025. Concurrently, Eskom has submitted an application to NERSA requesting the restructuring
of regulated electricity tariffs in South Africa, and NERSA approved the Retail Tariff Plan in February 2025.
Combined, these outcomes create uncertainty as to the tariff structure and rates that will ultimately be applicable to Sibanye-Stillwater, and
in the event that existing conditions persist or are exacerbated, the electricity tariff will continue to increase significantly in coming years.
In February 2019, the President of South Africa announced the vertical unbundling of Eskom. While full state ownership will be maintained,
the unbundling is expected to result in the separation of Eskom’s transmission and distribution functions into separate entities, with Eskom’s
generation function being retained in Eskom and Eskom’s management and administrative functions being transferred to a new holding
company, which may require legislative and/or policy reform. The unbundling is currently underway and the agreements related to the legal
separation of the transmission function were concluded in December 2021. Conditions precedent to these agreements were fulfilled in June
2024, and as such the separation of the transmission function has become effective, with this function residing in the National Transmission
Company of South Africa SOC Limited, a wholly-owned subsidiary of Eskom. However, the legal separation of the distribution function has
not yet occurred, and there is no indication as to if and when this will occur. Poor reliability of the supply of electricity and instability in prices
through the unbundling process is expected to continue. Should Sibanye-Stillwater experience further power tariff increases, its business
operating results and financial condition may be adversely impacted.
In the United States, changes in the US energy market, including a potential movement away from coal power, may increase the operating
cost of Sibanye-Stillwater’s US operations, which could have a material adverse effect on its business, operating results and financial
condition.
Geopolitical factors, including ongoing war in Ukraine and conflict in the Middle East, as well as changes in trade policies such as US tariffs,
have contributed to volatility in the availability and price of energy sources globally in 2025. Resulting embargoes, sanctions and trade
restrictions have further contributed to volatility in global energy costs across oil and gas, increased commodity prices and demand for
renewable energy components and, in certain jurisdictions, risk of energy supply constraints. Such volatility may impact the availability and
cost of energy for Sibanye-Stillwater’s operations and projects, and further disruptions to global energy value chains may affect operational
continuity and increase operating costs, which could have a material adverse effect on its business, operating results and financial
condition.
If any of Sibanye-Stillwater’s operations do not perform in line with expectations, Sibanye-Stillwater may be required to write down the
carrying value of its long-term assets, which could affect Sibanye-Stillwater’s profitability and financial condition
Under IFRS Accounting Standards, Sibanye-Stillwater is required to annually test for indicators of impairment of the carrying value of long-
term assets, being assets within the scope of IAS 36 for indicators of impairment, and where indicators of impairment exist, as well as cash
generating units to which goodwill has been allocated irrespective of whether an indicator of impairment exists, Sibanye-Stillwater will have
to perform an impairment test. The Group must perform this test more frequently if it has reason to believe that the expected recoverable
amount (being the higher of (a) fair value less costs of disposal and (b) value in use) of long-term assets, or cash-generating units with
allocated goodwill, may be lower than the carrying value. If the results of operations and cash flows generated by Sibanye-Stillwater’s gold,
PGM, recycling, zinc and lithium operations are not in line with its expectations, it may be required to write down the carrying value of its
assets or investment to the recoverable amount. Any write down could materially affect Sibanye-Stillwater’s profits and financial condition.
Our business is subject to high fixed costs which may impact its profitability
The mining industry, particularly the gold and PGM mining industry, is characterised by high fixed costs. The majority of operating costs of
each mining operation is fixed and does not vary significantly with the production rate and, therefore, a relatively small change in
productivity as a result of, for example, strikes or other work stoppages could have a disproportionate effect on operating and financial
results. Costs are generally more stable than revenues, the latter being driven by commodity price and currency exchange rates, which can
be volatile. Accordingly, changes in revenue due to volatility in input costs, commodity prices or currency exchange rate movements could
have a material adverse effect on Sibanye-Stillwater’s growth or financial performance. See – Actual and potential supply chain shortages
and increases in the prices of production inputs may have a material adverse effect on Sibanye-Stillwater’s operations and profits. Above-
inflation increases in fixed costs such as labour or electricity costs may cause parts of Sibanye-Stillwater’s resources to become
uneconomical to mine and lead to the closure of marginal shafts or other areas at its operations. This would impact on planned production
levels and declared reserves and could have a material adverse effect on Sibanye-Stillwater’s business, operating results and financial
condition. See – Annual Financial Report – Management’s discussion and analysis of the financial statements – Factors affecting Sibanye-
Stillwater’s performance – Costs.
Theft of gold, PGM and production inputs, cable theft, as well as illegal mining, may occur on some of Sibanye-Stillwater’s properties. These
activities could disrupt Sibanye-Stillwater’s business and can expose Sibanye-Stillwater to liability
Sibanye-Stillwater experiences illegal mining activities and theft of precious metal-bearing materials (which may be by employees or third
parties) at its South African-based properties. Incidences of illegal mining and theft remain concerning as a result of challenging social and
economic conditions and the value derived from precious metals and non-ferrous metals driven by local and international criminal
enterprise. In 2025, Sibanye-Stillwater experienced 1,342 incidents of illegal mining and assisting illegal miners at its underground operations
(2024: 1,149), resulting in the arrests of 1,438 illegal miners and 874 employees for assisting illegal mining activities. During the same period,
there have been 1,356 incidents of illegal mining at Sibanye-Stillwater’s surface operations (2024: 1,190), which resulted in the arrests of 264
illegal miners.
Sibanye-Stillwater has also experienced the theft of copper (and other non-ferrous metals) at its SA operations, including from organised
crime syndicates. The theft of such metals poses a risk to Sibanye-Stillwater’s surface infrastructure as well as its underground mines. In 2025,
Sibanye-Stillwater experienced 1,328 incidents of non-ferrous metals theft at its South African gold and PGM operations, a decrease from
1,613 incidents in 2024.
Rising gold, PGM and non-ferrous metal prices have been known to result in increased metals theft. It is possible that mine owners may be
held responsible for the actions of illegal miners or for damages, injuries or fatalities that occur due to their actions. The activities of illegal
miners could also lead to a reduction of mineral reserves, potentially affecting the economic viability of mining certain areas and shortening
the lives of the operations. In South Africa, there has also been an increase in coordinated attacks by organized criminal networks targeting
critical infrastructure, including incidents involving violence against security personnel. Illegal mining, theft, and related criminal activities
may also cause possible operational disruption, project delays, and pollution or damage to property for which Sibanye-Stillwater could
potentially be held responsible and lead to fines or other costs. Disputes with illegal miners can adversely affect Sibanye-Stillwater’s
relationships with local communities. The Artisanal and Small-Scale Mining Policy published on 30 March 2022 by the South African Minister of
the DMPR (then Minister of the DMRE) aims to create a formalised, sustainable, artisanal and small-scale mining industry in South Africa, to
eliminate illegal mining operations and promote job creation. The intention in adopting this policy is, where possible, to formalise artisanal
and small-scale mining and provide for the co-existence of artisanal and small-scale miners and large mining operations. The occurrence of
any of these events could have a material adverse effect on Sibanye-Stillwater’s business, operating results and financial condition.
Sibanye-Stillwater’s operations and financial condition could also be adversely affected by policies and legislation related to greater state
intervention in the mining industry and potentially the expropriation of mining assets without compensation
In recent years, governments, communities, NGOs and trade unions in several jurisdictions have sought and, in some cases, have
implemented greater cost imposts on the mining industry, including through the imposition of additional taxes and royalties. Such resource
nationalism, whether in the form of cost imposts, interference in project management, mandatory social investment requirements, local
content requirements or creeping expropriation could impact the global mining industry and Sibanye-Stillwater’s business, operating results
and financial condition.
On 24 January 2025, the Expropriation Act 13, 2024 (Expropriation Act) was assented to by the President of South Africa and has been signed
into law. The Expropriation Act is not yet effective, and the date on which it will come into force has not been determined. The Expropriation
Act allows the state, subject to due process being followed, to expropriate land without compensation where doing so would be for a
public purpose or in the public interest. Pursuant to section 12(3) of the Expropriation Act, land which falls within one of the following
categories may be subject to expropriation without compensation:
•land not in use, with the owner’s primary purpose not being development or income generation, but benefiting from appreciation
in market value;
•land held by an organ of state, not used for core functions, not reasonably likely to be needed for future activities, and acquired
without consideration;
•land which the owner has abandoned by failing to exercise control over it despite being reasonably capable of doing so; and
•land where the market value is equivalent to or less than the present value of direct state investment or subsidy in its acquisition
and beneficial capital improvement.
Section 5(3) of the MPRDA provides a statutory right of access for the mining right holder to the mining area for the purposes of conducting
mining operations and does not require the holder to own the land on which it conducts operations.
In South Africa, the Government of National Unity (GNU) was formed after the most recent election in May 2024. The GNU’s priorities and
minimum programme have generally aligned with the ANC’s commitments and policies. With respect to the mining industry, while the ANC
has rejected the possibility of mine nationalisation, it supports, among other things, greater state intervention in the mining industry, including
the revision of existing royalties and the imposition of new taxes. For example, Sibanye-Stillwater is engaged in disputes with South African
municipalities regarding the interpretation and application of new legislation relating to the valuation of mining rights for purposes of
calculating municipal rates and taxes. The municipalities have significantly increased the valuations of Sibanye-Stillwater's mining rights,
resulting in substantially higher rates and taxes in respect of mine property. Sibanye-Stillwater is challenging these increased valuations
through legal proceedings, however, there can be no assurance that Sibanye-Stillwater will be successful in these proceedings. Whilst
Sibanye-Stillwater has obtained the right to appeal certain adverse rulings, there can be no assurance that any such appeals will be
successful. If the municipalities' valuations are upheld, Sibanye-Stillwater could face material additional costs, including retrospective
payments covering multiple years across several municipalities, which could have a material adverse effect on Sibanye-Stillwater's business,
operating results and financial condition. The GNU may also adopt policies that involve the South African government taking a more active
role in the mining sector, including through state participation in mining projects or through new regulatory requirements such as the
proposed amendments to the MPRDA pursuant to the 2025 Bill. Such policies may impose additional restrictions, obligations, operational
costs, taxes or royalty payments on mining companies, including Sibanye-Stillwater, any of which could have a material adverse effect on
Sibanye-Stillwater’s business, operating results and financial condition.
Any of the above could have a material adverse effect on Sibanye-Stillwater’s business, operating results and financial condition.
Sibanye-Stillwater’s insurance coverage may not adequately satisfy all potential claims and exposures
Sibanye-Stillwater has an insurance programme, including partial self-insurance. However, Sibanye-Stillwater may become subject to liability
(including that which arises out of class-action or other litigation) against which it has not been insured, cannot insure or is insufficiently
insured, including those relating to past mining activities, tailing disasters, data protection and cybersecurity breaches. In addition, Sibanye-
Stillwater’s existing property and business interruption insurance and liability may not cover a particular event at all or be sufficient to fully
cover Sibanye-Stillwater’s losses, including, without limitation, as a result of natural disasters and other events that could disrupt Sibanye-
Stillwater’s operations, such as public health emergencies, pandemics, COVID-19, climate change-related incidents and losses related to
grid collapse and unplanned load curtailments by Eskom. Sibanye-Stillwater’s existing property and liability insurance contains specific
exclusions and limitations on coverage. For example, should Sibanye-Stillwater be subject to any regulation or criminal fines or penalties,
these amounts would not be covered under its insurance programme. Should Sibanye-Stillwater suffer a major loss, which is insufficiently
covered, future earnings could be affected. In addition, certain classes of insurance may not continue to be available at economically
acceptable premiums. As a result, in the future, Sibanye-Stillwater’s insurance coverage may not fully cover the extent of claims against it or
any cross-claims made.
Sibanye-Stillwater’s US Recycling business relies on supply of precious metal-bearing waste including spent autocatalytic converters from
third-party suppliers
In the United States, Sibanye-Stillwater sources precious metal-bearing waste, including automotive and industrial catalyst materials, from
third-parties through both purchase and tolling arrangements. Sibanye-Stillwater's Columbus recycling operations depend on various third-
party suppliers to source and provide spent autocatalytic materials and other waste streams in a compliant and responsible manner. Whilst
suppliers are contractually required to adhere to responsible sourcing obligations, and Sibanye-Stillwater may suspend or terminate
contracts for non-compliance, any such suspension or termination could reduce the availability of recyclable materials. In addition, Sibanye-
Stillwater’s US Recycling business has a degree of supplier concentration risk, with a limited number of suppliers contributing a significant
portion of the precious metal-bearing feedstock for each metal. The loss of, or reduced supply from, one or more key suppliers could
materially impact volumes and profitability, and Sibanye-Stillwater may be unable to replace lost supply on acceptable terms, particularly in
periods of market or operational disruption. For example, autocatalyst recycling volumes have been negatively affected from 2023 to 2025
by high interest rates, low steel prices, elevated used vehicle prices and depressed PGM prices, all of which have contributed to reduced
automotive scrapping. As a result, used vehicles have remained in circulation longer, reducing available recycle volumes. This contributed
to significantly lower production in the US Recycling business, which declined by 48% in fiscal year 2023, increased marginally by 2% in fiscal
year 2024, and decreased marginally by 2% in fiscal year 2025. Any constraint on suppliers' ability to source feedstock, or the loss of a major
supplier, could further reduce the profitability of the US Recycling business and adversely affect Sibanye-Stillwater's business, operating results
and financial condition.
In connection with its US Recycling operations, Sibanye-Stillwater regularly enters into fixed forward sales contracts for metal produced from
catalyst recycling and for precious metal-bearing waste. For these fixed forward sales, Sibanye-Stillwater is subject to the customers’
compliance with the terms of the agreements, their ability to terminate or suspend the agreements and their willingness and ability to pay.
The loss of any of these agreements or failure of a counterparty to perform could require Sibanye-Stillwater to sell or purchase the
contracted metal in the open market, potentially at a significant loss. Sibanye-Stillwater’s revenues for the year ended 31 December 2025,
included 6% from US recycling sales and tolling fees at its Columbus site in the United States.
Furthermore, should it become necessary at any point to reduce or suspend US PGM primary mining operations, the proportion of costs
allocated to the Columbus recycling segment would increase substantially. Moreover, the ability to operate the smelter and refinery without
significant volumes of primary mine concentrates is likely to require modification to the processing facilities. There is no assurance that the
recycling facilities can operate profitably in the absence of significant primary mine concentrates, or that capital would be available to
complete necessary modifications to the processing facilities.
For its PGMs mined in the United States, Sibanye-Stillwater’s tolling and sales arrangement concentrates all its final refining activity and all
PGM sales from mine production with one entity
Sibanye-Stillwater utilises a single company for all of its precious metals refining services for its United States PGM mining operations, and, with
the exception of certain pre-existing platinum sales commitments, all of Sibanye-Stillwater’s current mined palladium and platinum in the
United States is committed for sale to such company. In addition, this company has the right to bid on any of the Columbus recycling PGM
ounces Sibanye-Stillwater has available in the United States.
This significant concentration of business with a single company could leave Sibanye-Stillwater without precious metal refining services in the
United States should such company experience significant financial or operating difficulties during the contract period. Under such
circumstances, it is not clear that sufficient alternate processing capacity would be available to cover Sibanye-Stillwater’s volumes and
requirements, nor that the terms of any such alternative processing arrangements as might be available would be financially acceptable to
Sibanye-Stillwater. Any such disruption in refining services could have a negative effect on Sibanye-Stillwater’s ability to generate revenues,
profits and cash flows.
Value chain standards are becoming more stringent and may result in increased capital and operating expenditures and decreased
production
In addition to rapidly evolving legal and regulatory requirements in the jurisdictions in which it operates, Sibanye-Stillwater is also subject to
evolving industry and value chain standards, including increasingly stringent offtaker and supply chain requirements. As environmental,
health and safety regulations become stricter globally and there is increased regulation on supply chain transparency and traceability, the
value chains in which Sibanye-Stillwater participates have increasingly adopted heightened requirements. For example, many downstream
users of PGMs such as automobile manufacturers insist on stringent accreditation of all commodities to the extent of specifying Initiative for
Responsible Mining Assurance (IRMA) as the required standard to demonstrate site-level ESG performance. In extreme cases, there is a risk
that costs could exceed the production value in certain of the markets in which the Group participates or is expanding, such as in respect of
its future-facing metals projects.
Sibanye-Stillwater is also subject to responsible sourcing standards for procurement of feedstock from third party suppliers. The Group’s US
Recycling operations source all feedstock from third party suppliers and the South African gold and PGM operations supplement their mined
material with additional feedstock. This procurement from third parties also presents a reputational risk if the Group unintentionally sources
illicit material, particularly if it were related to support for armed conflict, organised crime or human rights abuses.
To the extent that Sibanye-Stillwater is unable to conform with such standards or incurs significant capital expenditures or investments to do
so, its business, operating results and financial condition may be materially impacted.
The impact of protectionist measures such as tariffs on Sibanye-Stillwater’s business, operating results and financial condition is uncertain.
On 2 April 2025, an executive order was issued by the United States government imposing significant increases in tariffs on a broad range of
imported goods, effective 5 April 2025. These measures have triggered retaliatory actions from certain US trading partners and may result in
further retaliatory actions in the future. The continuation or escalation of such tariffs may lead to broader trade conflicts such as trade wars,
which could disrupt global supply chains, reduce international trade, and adversely impact global economic growth and stability.
In particular, the United States has imposed or proposed tariffs on exports from several jurisdictions in which Sibanye-Stillwater operates,
including South Africa, the European Union, Zimbabwe and Australia. The direct and indirect effects of tariffs on the economies of these
jurisdictions, including potential inflationary pressures and reduced economic activity, remain uncertain and could have a material adverse
effect on Sibanye-Stillwater’s business, operating results and financial condition.
Sibanye-Stillwater’s operations involve certain metals, including PGMs, gold and chrome, which are currently excluded from the scope of
the new tariffs. However, there can be no assurance that such exclusions will be maintained, and any future inclusion of these commodities
in tariff schedules could result in reduced demand or increased costs, which could adversely affect Sibanye-Stillwater’s business, operating
results and financial condition.
In addition, the imposition of tariffs on automobile imports may result in increased vehicle prices, which could reduce consumer demand for
automobiles. Any reduction in automobile production or sales as a result of such tariffs may negatively affect demand for PGMs, which
could lead to downward pressure on PGM prices or reduced sales volumes.
Sibanye-Stillwater's US Recycling business is also exposed to tariff-related risks. Tariffs on steel, aluminium and certain machinery have
increased costs for equipment and critical components sourced from international suppliers. The US government is currently investigating
whether to impose tariffs on certain critical minerals, including silver, platinum and palladium, and whilst scrap materials may be exempted,
any such tariffs could adversely impact margins. In addition, proposed expansions to tariff codes for machinery relevant to precious metal
processing could result in additional costs if finalised. Changes to trade agreements or tariff exemptions applicable to scrap materials could
also increase tariff exposure for the US Recycling business. Furthermore, if certain tariffs currently in place are found to be unlawful, the
process to obtain refunds could be protracted, and new tariffs may be introduced under alternative legal mechanisms, creating further
uncertainty.
Any of the foregoing could impact Sibanye-Stillwater’s South African and US PGM operations, which could in turn have a material adverse
effect on Sibanye-Stillwater’s business, operating results and financial condition.
The effect of US tax credits on Sibanye-Stillwater and its subsidiaries is uncertain, particularly in light of recent legislative and regulatory
developments
In August 2022, former US President Biden signed the Inflation Reduction Act (IRA) into law. The IRA amended US tax law by, among other
things, supporting the US-based EV supply chain and identified 50 “critical minerals”, including lithium, palladium and nickel, for such support
by, among other measures, (1) amending the previous version of Section 30D of the US Internal Revenue Code, which provides for a credit
claimable by certain purchasers of electric vehicles (EVs), and (2) providing for a brand new tax credit incentivising manufacturing
conducted within the United States, under Section 45X of the US Internal Revenue Code. The first of these incentives provides a tax credit for
EV purchasers, a portion of which is available only if an applicable percentage of the critical mineral in the EV’s battery is either: (i)
extracted or processed in the United States or in any country with which the United States has a free trade agreement in effect; or (ii)
recycled in North America (the Critical Minerals Requirement). Under the second of the aforementioned incentives, the IRA also added the
new Section 45X of the US Internal Revenue Code, which provides for a tax credit (Section 45X Credit) for the manufacturing and sale to an
unrelated person of certain eligible components within the United States. An eligible component for these purposes importantly includes
certain “applicable critical minerals” including those minerals considered critical for purposes of the aforementioned EV credit, and also
includes certain specified components of clean energy facilities (including facilities using solar photovoltaic and wind energy to produce
electricity). In cases where the Section 45X Credit is claimed in connection with production of applicable critical minerals, the Section 45X
Credit is equal to 10% of the cost to produce or extract such critical mineral. As discussed further below, While the IRA represented a
significant boon to the clean energy and EV industries, many of the IRA tax incentives were rolled back or otherwise curtailed by the One Big
Beautiful Bill Act (OBBBA) of 2025, including, in particular, Section 30D tax credit, which now sunsets as of September 2025.
In October 2024, the US Treasury released taxpayer-favourable final regulations pertaining to the Section 45X Credit providing that, among
other costs, certain direct or indirect material costs and costs related to the extraction or acquisition of raw materials could be taken into
account for purposes of the Section 45X Credit. Specifically, this development represented a material financial benefit for Sibanye-Stillwater's
US Recycling operations, helping to yield total credit values of approximately US$260 million for 2023 and 2024, US$47 million for 2025 (relating
to primary mining) and US$40 million for 2025 (relating to recycling). See – Annual Financial Report – Management’s Discussion and Analysis
of the Financial Statements: Cost of sales..
In July 2025, the US Congress passed the OBBBA, which both (i) significantly shortened the applicability periods of many of the tax incentives
created by or otherwise bolstered by the IRA, and (ii) imposed burdensome new requirements for most such tax incentives. Specifically, the
Section 30D Credit was terminated for EVs acquired after September 30, 2025, effectively repealing the credit as of that date.
Notwithstanding the promulgation of regulations in May 2024 the stringent application of which might have limited the application of the
Section 30D to Sibanye-Stillwater’s operations, Sibanye-Stillwater had been materially benefitting from the credit, and its repeal may
therefore have a material adverse impact on Sibanye-Stillwater’s financial position.
While the Section 45X Credit will generally continue to apply to eligible United States critical mineral production in full until the credit begins
to sunset in 2031, the Section 45X Credit is now subject to certain “foreign entity of concern” (FEOC) requirements, which are designed to
eliminate tax incentives that would otherwise inure to projects with certain ties to China, North Korea, Iran and Russia. Specifically,
immediately as of the OBBBA enactment date of July 4, 2025, a taxpayer hoping to claim the Section 45X Credit cannot (i) be a “prohibited
foreign entity” (PFE), (ii) receive “material assistance” from a PFE, or (iii) produce eligible components under an arrangement deemed to
evidence "effective control" by a “specified foreign entity” (SFE).
For these purposes, a PFE is either (i) An SFE or (ii) a “foreign-influenced entity” (FIE). An SFE includes entities designated as a foreign terrorist
organization by the Secretary of State, entities included on the specially designated nationals and blocked persons list maintained by the US
Treasury Department's Office of Foreign Assets Control, entities alleged by the Attorney General to have engaged in conduct for which a
conviction was obtained under certain laws, as well as certain “foreign controlled entities”. Foreign controlled entities include, for example,
(i) the government of a “covered nation” (i.e., China, Russia, Iran, or North Korea), (ii) an agency or instrumentality of a government of a
covered nation, (iii) a citizen or national of a covered nation without U.S. status as a citizen, national or lawful permanent resident, (iv) an
entity organized under the laws of, or having its principal place of business in, a covered nation, or (v) an entity controlled by any of the
above, including subsidiaries, where control is measured by more than 50% direct or indirect ownership of stock in a corporation, profits
interests or capital interests in a partnership, or other beneficial interest in the entity. Entities publicly traded on exchanges outside of a
covered nation are generally excluded from the definition of a foreign controlled entity.
An entity will be a foreign influenced entity, or FIE, if during the taxable year, (i) an SFE has direct or indirect authority to appoint a board
member, executive officer, or similar individual, (ii) a single SFE owns at least 25% of the entity, (iii) one or more specified foreign entities own
in the aggregate at least 40% of the entity; or At least 15% of the entity's debt is held in the aggregate by one or more specified foreign
entities; or (iv) during the prior taxable year, the entity made an "applicable payment" to an SFE pursuant to a contract, agreement, or other
arrangement which entitles the specified foreign entity (or a related entity) to exercise "effective control" over (a) any qualified facility or
energy storage technology of the taxpayer (or any related person) or (b) the extraction, processing, or recycling of any applicable critical
mineral or production of an eligible component by the taxpayer (or any related person). “Effective control” for these purposes refers to
specific contractual and intellectual property rights pertaining to the applicable project or facility. While the US Treasury Department has
announced that there will be forthcoming regulatory guidance providing more specific details on the implementation of this standard, it
appears that the term “effective control” is to be interpreted broadly.
For purposes of determining whether construction or production of any property includes "material assistance from a prohibited foreign
entity", Section 45X Credit claimants must establish that the "material assistance cost ratio" is less than the "threshold percentage". This ratio
looks to the geographical origin of materials and components that comprise the project generating the Section 45X Credit. The threshold
percentage differs greatly depending on the technology involved. In the case of critical minerals, the baseline threshold percentage would
be a very taxpayer-favorable 0% through 2029, after which point the percentage would rise to 25%. However, forthcoming guidance from
the US Treasury is expected to assign specific threshold percentages to certain critical minerals that would apply prior to 2030.
Meeting these new FEOC requirements is proving to be a challenge for many taxpayers, particularly considering the lack of clear guidance
as to many of the requirements, and the fact that failure to meet or otherwise properly substantiate any one of the requirements generally
has the effect of invalidating the entire Section 45X Credit. Currently, Sibanye-Stillwater is evaluating compliance with the FEOC
requirements in connection with Section 45X Credits it expects to claim for 2025 and beyond, but as of this time cannot guarantee that the
new requirements will not impact the amount of Section 45X Credits claimable or sustainable upon a challenge by tax authorities.
The unavailability of the Section 45X Credit or a change in its value, including as a result of a failure to meet the FEOC requirements, or
further legislative changes, could have a material adverse impact on Sibanye-Stillwater’s financial position. Although US law is technically
settled on the ability to claim a Section 45X Credit for the costs associated with critical minerals giving rise to Section 45X Credits, political
uncertainty in the United States may jeopardise the status and future of the Section 45X Credit. See – Sibanye-Stillwater could be subject to
adverse changes in tax laws, regulations and interpretations or challenges to the Group’s tax positions. Any such changes could jeopardise
the availability of the Section 45X Credit to Sibanye-Stillwater and for the reasons mentioned above, could therefore have a material
adverse effect on Sibanye-Stillwater’s business, operating results and financial condition.
Sibanye-Stillwater could be subject to adverse changes in tax laws, regulations and interpretations or challenges to the Group’s tax positions
Tax laws and regulations are complex and subject to varying interpretations, and Sibanye-Stillwater is subject to regular review and audit by
tax authorities in the jurisdictions in which it operates. Any adverse outcome of such a review or audit could have a negative impact on the
Group’s effective tax rate, tax payments, financial condition or results of operations. In addition, the determination of the Group’s income
tax provision and other tax liabilities requires significant judgement, and there are many transactions and calculations, including in respect of
intragroup transactions, where the ultimate tax determination is uncertain. Any significant failure to comply with applicable tax laws and
regulations in all relevant jurisdictions could give rise to substantial penalties and liabilities. In addition, tax is a complex and evolving area
where laws and regulations are changing regularly leading to the risk of unexpected tax exposures.
In addition, the tax systems in certain jurisdictions in which the Group operates are unpredictable, which gives rise to significant uncertainties
and complicates the Group’s tax planning and business decisions. Government policies and regulations on taxation, customs and excise
duties in emerging markets may change from time to time as is considered necessary for the development of the economy. The tax
authorities in these jurisdictions may be arbitrary in their interpretation of tax laws as well as in their enforcement and tax collection activities.
Changes in government policies on taxation, customs and excise duties, inconsistencies in the interpretation of and decisions relating to tax
laws, or a failure by the Group to meet any of these taxation requirements, could also have an adverse effect on Sibanye-Stillwater’s
business, operating results and financial condition.
Furthermore, the rules dealing with US federal income taxation are constantly under review by persons involved in the legislative process, by
the IRS and by the US Treasury Department. Changes to the tax law, which may have retroactive application, could adversely affect
Sibanye-Stillwater and its shareholders. It cannot be predicted whether, when, in what forms, or with what effective dates, the tax law
applicable to Sibanye-Stillwater or its shareholders will be changed. See – The effect of US tax credits on Sibanye-Stillwater and its subsidiaries
is uncertain, particularly in light of recent legislative and regulatory developments. Shareholders are urged to consult their tax advisors with
respect to tax considerations applicable to them by holding shares in Sibanye-Stillwater and to monitor any potential legislation,
amendments or changes to the relevant tax laws.
Changes in tax laws or regulations increase tax uncertainty, could have a prospective or retroactive application to the Group, and could
have a negative impact on the Group’s effective tax rate or tax payments, any of which could have a material adverse effect on Sibanye-
Stillwater’s business, operating results and financial condition.
Strategic Risks
To the extent that Sibanye-Stillwater seeks to further expand its existing mining operations, it may experience challenges associated with
mineral exploration or development of mining projects
Sibanye-Stillwater aims to expand its operations and mineral reserve base organically through its existing exploration programmes and
investigations, including brownfields exploration and the optimisation and extension of existing mining operations, as well as through
development projects and, from time to time, joint ventures and targeted acquisitions. However, such projects may be capital intensive,
have a long lead time and are subject to risks relating to the location of economic ore bodies, the development of appropriate extractive
processes, cost overruns and delays. Such projects may also be impacted by delay in the receipt of necessary governmental permits and
regulatory approvals and the extension of mining and processing facilities at the mining site. For example, Sibanye-Stillwater has in the past,
and may in the future, require new or amended permits to expand water, rock and tailing storage facilities in respect of its Stillwater
operations. If it is unable to obtain such permits, or do so in a timely manner, its operations would be significantly impacted.
Sibanye-Stillwater is continuing to investigate the exploitation of mineralisation below and adjacent to the current mining areas and
infrastructure limits at its operations. This includes brownfields exploration drilling at selected operations in South Africa, as well as at Stillwater
and at Keliber, to further define mineral resources that can be converted to mineral reserves in the future. Such brownfields exploration and
expansion activities are required to be carefully coordinated with ongoing mining operations and infrastructure constraints, which may be
complex and difficult to execute and may result in operational disruption, delays or increased costs. At Keliber, exploratory drilling is ongoing
as part of its regional lithium exploration, and a Mineral Resource update is currently underway. Sibanye-Stillwater has also been undertaking
exploration activities in conjunction with its joint venture partner, Regulus Resources Ltd (Regulus), at the Altar project, a large porphyry-style
copper-gold deposit in Argentina. There can be no assurance that any exploration or expansion projects will be successful, partially or at all,
and the failure of Sibanye-Stillwater to expand its mineral reserves through such projects could have a material adverse effect on its business,
operating results and financial condition.
Sibanye-Stillwater’s growth strategy may not deliver anticipated outcomes in the timeframe anticipated or at all
As part of its strategy, Sibanye-Stillwater may pursue growth opportunities through a combination of organic initiatives, including the
optimization and expansion of its existing operations, as well as, from time to time, acquisitions, business combination transactions and joint
ventures. Such initiatives are intended, among other things, to expand and replace mineral resources and mineral reserves, improve
operational performance, reduce costs, optimize capital allocation and enhance the overall sustainability of its operations. Historically, the
Group has pursued growth through acquisitions and investments, and between 2021 and 2025, Sibanye-Stillwater made a number of
strategic acquisitions and investments, including the investment in the Keliber lithium project, the acquisitions of the Sandouville nickel
processing facility and Century zinc retreatment tailings operations, the acquisition of the remaining 50% stake in the Kroondal joint venture,
the acquisition of Reldan, a precious metals recycling group, the acquisition of Metallix Refining, a precious metals recycling group, the
merger of the operations of Sibanye Rustenburg Platinum Mines Proprietary Limited with that of Kroondal Operations Proprietary Limited and
the entering into of new chrome joint venture agreements with Glencore Merafe Venture.
The successful execution of Sibanye-Stillwater’s strategy, including its increased focus on organic growth, brownfields exploration and
operational optimization initiatives, is subject to a number of risks, including the ability to identify and implement economically viable
opportunities within the Group’s existing asset base, achieve anticipated efficiencies and cost savings, and deliver projects on time and
within budget. There can be no assurance that such initiatives will deliver the anticipated benefits or returns in the timeframe expected, or at
all.
The acquisition of operating assets for commodities other than gold or PGMs, including for example, the Sandouville nickel processing facility
in France, the Keliber lithium project in Finland and the Century operation in Australia, exposes Sibanye-Stillwater to the risk of operating in
environments and markets in which its senior management has less experience. As a result, it needs to rely on regionalised management
and technical teams. In addition, to the extent Sibanye-Stillwater participates in the development of a project through a joint venture or any
other multi-party commercial structure, there could be disagreements, legal or otherwise, or divergent interests or goals among the parties,
which could jeopardise the success of the project. There can be no assurance that any acquisition, business combination or joint venture, or
the acquisition of any new mining assets or operations, will achieve the results intended or in the timeframe anticipated, and, as such, could
have a material adverse effect on Sibanye-Stillwater’s business, operating results and financial condition. For example, Sibanye-Stillwater
entered into a partnership with Heraeus to develop and commercialise novel electrolyser catalysts for the production of green hydrogen,
the results of which cannot be guaranteed.
Sibanye-Stillwater may face challenges in the integration of acquired assets, such as higher levels of capital expenditure or lower production
levels than expected, which could disrupt its current operations or result in higher costs or worse overall performance than anticipated. For
example, the integration of the Sandouville nickel processing facility into the Group faced various operational and logistical issues and
required high levels of capital expenditure to improve the facility. Despite the improved operational performance in 2023, 2024 and 2025,
Sandouville refinery remained loss making, due to a pre-existing onerous supply contract (which was terminated in 2024), continued
inflationary cost pressures (leading to higher fixed and variable costs), elevated maintenance costs, low installed capacity leading to higher
fixed costs per production unit and a further decline in the average nickel price and nickel cathode premiums. In 2025, production at the
Sandouville refinery was ceased and the facility was placed on care and maintenance. While the Group is currently exploring the potential
of producing precursor cathode active materials at Sandouville, there is no guarantee it will be able to do so, or that economically viable
production can be achieved.
If Sibanye-Stillwater is unable to successfully integrate its acquired assets in a timely and cost-effective manner, the potential benefits of the
acquisition, including the estimated revenue and cost synergies Sibanye-Stillwater expects to achieve, may not be realised. Additionally, the
integration of any acquired assets requires management capacity. There can be no assurance that Sibanye-Stillwater’s current
management team will have sufficient capacity to successfully integrate existing or future assets and operations into Sibanye-Stillwater.
Sibanye-Stillwater may, to the extent it pursues acquisition opportunities, face competition for the acquisition of attractive assets, particularly
during periods of elevated commodity prices, and may be unable to identify suitable assets for acquisition at economically attractive prices
or on acceptable terms. Its ability to pursue or complete acquisitions is also dependent on securing adequate and affordable financing,
which may not be obtained on acceptable terms, if at all. Any decision to acquire properties may be based on a variety of factors,
including historical operating results, estimates and assumptions regarding the extent of the ore reserve, cash and other operating costs,
mineral prices, projected economic returns and evaluations of existing or potential liabilities (including environment liabilities) associated with
the relevant property and its operations and how these factors may change in the future. Other than historical operating results, these
factors are uncertain and could have an impact on revenue, cash and other operating costs, as well as the process used to estimate the
ore reserve. In addition, although Sibanye-Stillwater typically receives representations, warranties and indemnities and conducts general due
diligence with respect to its acquisitions, there can be no assurance that Sibanye-Stillwater identified all the liabilities of, and risks associated
with, its acquisitions or that it will not be subject to unknown liabilities of, and risks associated with, the entities acquired, including liabilities
and risks that may become evident only after Sibanye-Stillwater has been involved in the operational management of the relevant entities.
Any of the foregoing may impact Sibanye-Stillwater’s ability to realise the anticipated benefits of its acquisitions and its business, operating
results and financial condition may be materially impacted.
Sibanye-Stillwater’s business may be harmed if it fails to adapt to technological advances, including artificial intelligence and other
emerging technologies, in a timely and cost-effective manner, which may be complicated by an uncertain regulatory environment
The industry in which Sibanye-Stillwater operates is characterised by rapid technological advancements, including industry-wide
digitalisation, robotic process automation (RPA), machine-learning and advances in artificial intelligence. Sibanye-Stillwater’s ability to
compete effectively and in a cost-effective manner depends, in part, on its ability to adapt to, and adequately invest in, new technology
and related personnel. Insufficient or untimely investment in new technology or personnel may require prolonged use of labour-intensive
modes of work or require it to retain legacy infrastructure that cannot be easily or cost-effectively serviced or upgraded. In addition, the
Group may need to undertake certain technological upgrades in response to heightened safety, environmental or security requirements,
and failure to adopt these improvements may delay or increase the cost of compliance.
Adapting to new technologies may also pose integration-related risks. For example, Sibanye-Stillwater has implemented a hybrid cloud
strategy to leverage advanced cloud-based solutions. Under this approach, centrally hosted data centres will house the primary business
systems in each operational region. The integration and transition to cloud-based solutions could be susceptible to delays or disruptions,
which could result in failing network infrastructure, network outages and a breach of privacy. Cloud-based solutions may also increase
Sibanye-Stillwater’s exposure to cyber-related threats.
Sibanye-Stillwater may also adopt AI and other emerging technologies into its own IT systems or integrate AI within its mining operations. AI
tools may also be utilised by the Group's contractors and third parties that Sibanye-Stillwater conducts business with. The use of AI may not
meet the existing and rapidly evolving regulatory standards and could introduce security or other operational risks that may expose
confidential data, lead to the loss of competitive information and result in operational failures. Limited expertise and skills shortages could
prevent Sibanye-Stillwater from effectively using or promptly implementing AI and other technologies.
Any of the foregoing may impact Sibanye-Stillwater’s ability to deliver on its strategic objectives, including sustainability, safety and cost
optimisation targets, and have a material adverse effect on Sibanye-Stillwater’s business, operating results and financial condition.
Acquisitions, business combinations, development projects and joint ventures may expose Sibanye-Stillwater to new or increased regulatory
oversight, compliance requirements and operational risks, including in geographies in which it is unfamiliar
Sibanye-Stillwater has in the past, and may in the future, pursue opportunities for expansion into new geographies or markets where it has
limited to no prior experience, and which may subject it to new or increased regulatory oversight or requirements. See – Sibanye-Stillwater’s
mining rights are subject to legislation, which could impose significant costs and burdens and which impose certain ownership requirements,
the interpretation of which may be the subject of dispute. For example, the acquisition of Stillwater expanded Sibanye-Stillwater’s operations
into the United States, wherein Sibanye-Stillwater was subject to new regulatory and reporting requirements. In addition, between 2022 and
2023, Sibanye-Stillwater initiated direct operations in Finland and Australia, where the Group had no prior operational experience. Such
expansions may lead to increased costs related to ensuring governance, regulatory, legal and accounting compliance across multiple
regions. Moreover, acquisitions may involve compliance risks, including difficulties in implementing disclosure controls and procedures for
newly acquired businesses, unforeseen challenges in extending internal control over financial reporting to such businesses, and complexities
in performing required assessments of acquired operations within applicable timeframes. See – If Sibanye-Stillwater is unable to implement
and maintain an effective system of internal control over financial reporting, it may be unable to accurately report its results of operations,
meet its reporting obligations or prevent fraud. In addition, future acquisitions, business combinations or joint ventures may change the scale
of Sibanye-Stillwater’s business and operations and may expose it to new geographical, geological, commodity, political, social, labour,
operational, financial, legal, regulatory and contractual risks.
Sibanye-Stillwater’s strategy with respect to future-facing metals is subject to certain risks, and Sibanye-Stillwater may never develop
minerals in sufficient grade or quantities to justify commercial operations
As part of its strategy, Sibanye-Stillwater has made, and may continue to make, strategic investments in future-facing metals development
projects to enhance its positioning in the future green economy. Recent examples of such investments include shareholdings in Keliber in
2021 and the exercise of Sibanye-Stillwater's option in the Mt. Lyell copper mine in 2023. Mineral resource exploration, development, and
operations are complex and are characterised by a number of significant risks, including, among other things, unprofitable efforts resulting
not only from the failure to discover mineral resources, and from finding mineral resources which, though present, are insufficient in quantity
and quality to return a profit from production. Once mineralisation is discovered, it may take a number of years from the initial exploration
phases before production is possible, during which time the potential feasibility of the project may change adversely. For example, the novel
soda pressure leaching technology utilised at Keliber may fail to perform at the expected level as the process is not yet in industrial use and
therefore may result in lower mineral quality and/or higher costs.
No assurance can be given that minerals will be discovered in sufficient grade or quantities to justify commercial operations. Whether an
exploration property will be commercially viable depends on a number of factors, including: the particular attributes of the deposit, such as
size, grade and proximity to infrastructure; metal prices, which are highly cyclical; availability of and effectiveness of technology to recover,
trans-ship, transport and process modules; availability of required personnel, third-party partners and contractors, any required financing;
commercial demand in the marketplace for such metals and government regulations and approvals, including regulations relating to
prices, taxes, royalties, land tenure, land use, and environmental protection. Sibanye-Stillwater’s investments are conditional upon the
receipt of operating permits at the site, and compliance with these regulatory requirements may be expensive and significantly lengthen
the time needed to develop exploration properties.
The precise impact of these factors cannot accurately be predicted, but the combination of these factors may result in a delay or the
inability of Sibanye-Stillwater’s strategic investments to operate or generate an adequate return on invested capital. In addition, value chain
requirements are rapidly evolving in such markets, which may require Sibanye-Stillwater to expend significant time and resources to conform,
as a result of which the profitability of such investments may decline. See – Value chain standards are becoming more stringent and may
result in increased capital and operating expenditures and decreased production.
The prevailing market prices of lithium, copper and other commodities will have a material impact on the commercial success of Sibanye-
Stillwater’s strategy
The profitability of Sibanye-Stillwater’s strategy will be significantly affected by changes in the market price of future-facing metals (e.g.,
lithium and copper) and the cost of power, petroleum fuels, and oil, among other commodities and supply requirements. Prices of such
metals are affected by numerous factors beyond Sibanye-Stillwater’s control, including: prevailing interest rates and returns on other asset
classes; expectations regarding inflation, monetary policy and currency values; speculation; governmental and exchange decisions
regarding the disposal of metal stockpiles; political and economic conditions; available supplies of future-facing metals from mine
production, inventories and recycled metal; sales by holders and producers of future-facing metals; and demand for products containing
lithium and copper. The price of such future-facing metals and other minerals and oil has fluctuated widely in recent years, and if prices
decline or are lower than expected, this could have a material adverse impact on Sibanye-Stillwater’s strategy, revenues and costs base,
and as a result, its business, operating results and financial condition.
The success of Sibanye-Stillwater’s strategy may be impacted if the electric vehicles sector does not develop as anticipated
Demand for the minerals Sibanye-Stillwater intends to mine and/or process as part of its expansion into the future-facing metals sector,
including lithium, nickel and copper, is contemplated to be significantly linked to growing demand for these metals in batteries for EVs as
well as the broader development of a clean energy economy. As a result, the success of Sibanye-Stillwater’s strategy is partially dependent
upon the adoption by consumers of EVs. While it has been projected that demand for such EVs will surge over time, if the market for EVs
does not develop as expected, or develops more slowly than expected, Sibanye-Stillwater’s strategy, along with the climate change
resiliency of its business, may be impacted. Factors that may influence the adoption of alternative fuel vehicles, and specifically EVs, and the
level of nickel and cobalt used, include:
•rate of cost reductions of EVs, including as a result of delays in the battery technology advancements and the inability to achieve
lower unit costs
•the availability of adequate and reliable charging infrastructure needed to support mass adoption of EVs, including the grid
capacity necessary to support EV charging
•consumer confidence in the performance and economics of electric vehicles
•uncertainty in the regulatory timelines associated with the ban on combustion engine vehicles, especially in Europe and North
America
•removal of economic incentives (such as favourable tax treatment) and government regulation promoting lower emissions, fuel
efficiency and alternate forms of energy
•the availability of alternative fuel vehicles, including plug-in hybrids, which may delay the volume requirements for future-facing
metals (owing to smaller battery pack sizes)
•perceived safety of EVs, which may be negatively impacted by incidents such as battery fires
•greater shift to the lithium-iron phosphate cathode chemistry will lower nickel (and cobalt) demand requirements
To the extent that the EV sector does not develop as anticipated, Sibanye-Stillwater’s strategy, including demand for its mineral portfolio
may be adversely affected, which may in turn materially impact its business, operating results and financial condition.
Risks Related to Sibanye-Stillwater’s Shares and ADSs
Sibanye-Stillwater’s non-South African shareholders may face additional investment risk from currency exchange rate fluctuations since any
dividends will be paid in rand
Dividends or distributions with respect to Sibanye-Stillwater’s shares have historically been paid in rand. The US dollar or other currency
equivalent of future dividends or distributions with respect to Sibanye-Stillwater’s shares, if any, will be adversely affected by potential future
reductions in the value of the rand against the US dollar or other currencies. For example, dividends or distributions with respect to Sibanye-
Stillwater’s ADSs are paid in rand to the ADS depositary, who converts such dividend or distribution into US dollar for payment to the relevant
ADS holder. If the exchange rate fluctuates between the time at which the dividend or distribution was declared and conversion and
payment to the ADS holder, the ADS holders may lose some or all of the value of the distribution. In addition, while South African Exchange
Control Regulations have been relaxed in recent years, in the future, it is possible that there will be further changes in South African
exchange controls, such that dividends paid out of trading profits will not be freely transferable outside South Africa to shareholders who are
not residents of the CMA. See – South African Exchange Control Limitations Affecting Security Holders.
Sibanye-Stillwater may not pay dividends or make similar payments to its shareholders in the future due to various factors and any dividend
payments made may be subject to withholding tax
Sibanye-Stillwater’s current dividend policy is to return at least 25% to 35% of normalised earnings to shareholders. Sibanye-Stillwater may pay
cash dividends only if funds are available for that purpose. Whether funds are available depends on a number of factors, including
operational, financial and legal considerations. Given these factors and the Sibanye-Stillwater Board’s discretion to declare cash dividends
or other similar payments, dividends may not be paid in the future. It should be noted that a 20% withholding tax is required to be withheld
on dividends paid by, among others, certain South African resident companies (including Sibanye-Stillwater) to any person, unless an
exemption from or a reduction in the withholding tax is applicable.
The withholding tax on dividends is subject to domestic exemptions or relief in terms of an applicable double taxation treaty. The application
of such domestic exemptions or relief in terms of an applicable double taxation treaty is subject to the making of certain declarations and
undertakings by the beneficial owner of the dividends and providing the same to Sibanye-Stillwater or regulated intermediary making
payment of the dividend. In terms of the US-South Africa Treaty, the dividends tax rate is reduced to 5% of the gross amount of the dividends
if a corporate US holder holds directly at least 10% of the voting stock of a South African company, or alternatively reduced to 15% of the
gross amount of the dividend in all other cases. Based on current legislation, the declaration and undertaking entitling the holder to a
reduced dividend tax must be renewed at least every five years, subject to certain exemptions. See – Taxation – Certain South African tax
considerations – Withholding tax on dividends and Financial information – Dividend Policy and Dividend Distributions.
Sibanye-Stillwater’s shares are subject to dilution, which could adversely affect their trading price
Shareholders’ equity interests in Sibanye-Stillwater will be diluted to the extent of future exercises or issuances, including upon conversion of
the Group’s outstanding Convertible Bonds or any additional rights. Sibanye-Stillwater shares are also subject to dilution in the event that the
Sibanye-Stillwater Board issues new shares in compliance with applicable B-BBEE legislation. See – Sibanye-Stillwater’s mining rights are
subject to legislation, which could impose significant costs and burdens and which impose certain ownership requirements, the
interpretation of which may be the subject of dispute.
In 2023, Stillwater Mining Company issued convertible bonds in the aggregate principal amount of US$500 million. Upon conversion, Sibanye-
Stillwater’s existing shareholders will experience immediate dilution of voting rights and its share price may decline. Furthermore, the
perception that such dilution could occur may cause the Group’s share price to decline. See – Sibanye-Stillwater has a large amount of
indebtedness. Failure to comply with its debt covenants or difficulties in obtaining necessary financing could have a material adverse effect
on its business, operating results and financial condition.
The Sibanye-Stillwater Board has the authority to authorise certain offers and sales of the securities without the vote of, or prior notice to,
Sibanye-Stillwater shareholders. Such additional issuances may involve the issuance of a significant number of ordinary no par value shares
at prices less than the current market price.
Issues of substantial amounts of securities, or the availability of the securities for sale, could adversely affect the prevailing market prices for
the securities and dilute investors’ earnings per share. Further, the issuance of shares in connection with any acquisition of assets (including
another company) subject to compliance with Section 9 and 10 of the JSE Listings Requirements or an amalgamation or merger or scheme
of arrangement in terms of the Companies Act (whether in the form of consideration or otherwise) may result in dilution to existing
shareholders.
A large volume of sales of Sibanye-Stillwater’s shares all at once or in tranches, could decrease the prevailing market price of Sibanye-
Stillwater’s shares and could impair Sibanye-Stillwater’s ability to raise capital through the sale of equity securities in the future. Additionally,
even if substantial sales are not affected, the mere perception of the possibility of these sales could decrease the market price of Sibanye-
Stillwater’s shares and could have a negative effect on Sibanye-Stillwater’s ability to raise capital in the future. Further, anticipated
downward pressure on Sibanye-Stillwater’s ordinary share price due to actual or anticipated sales of shares could cause some institutions or
individuals to engage in short sales of Sibanye-Stillwater’s shares, which may itself cause the price of the shares to decline.
Shareholders outside South Africa may not be able to participate in future issues of securities (including ordinary shares) carried out by or on
behalf of Sibanye-Stillwater
Securities laws of certain jurisdictions may restrict Sibanye-Stillwater’s ability to allow participation by certain shareholders in future issues of
securities (including ordinary shares) carried out by or on behalf of Sibanye-Stillwater. In particular, holders of Sibanye-Stillwater securities who
are located in the United States (including those who hold Sibanye-Stillwater Shares or Sibanye-Stillwater ADSs) may not be able to
participate in securities offerings by or on behalf of Sibanye-Stillwater unless a registration statement under the Securities Act is effective with
respect to such securities or an exemption from the registration requirements of the Securities Act is available thereunder.
Securities laws of certain other jurisdictions may also restrict Sibanye-Stillwater’s ability to allow the participation of all holders in such
jurisdictions in future issues of securities carried out by Sibanye-Stillwater. Holders who have a registered address or are resident in, or who are
citizens of, countries other than South Africa should consult their professional advisers as to whether they require any governmental or other
consent or approvals or need to observe any other formalities to enable them to participate in any offering of Sibanye-Stillwater securities.
Investors in the United States and other jurisdictions outside South Africa may have difficulty bringing actions, and enforcing judgments,
against Sibanye-Stillwater, the directors and the executive officers based on the civil liabilities provisions of the federal securities laws or
other laws of the United States or any state thereof or under the laws of other jurisdictions outside South Africa
Sibanye-Stillwater is incorporated in South Africa. Most of the directors and executive officers reside outside of the United States, and
substantially all of the assets of these persons and approximately 77% of the assets of Sibanye-Stillwater are located outside the United States.
As a result, it may be difficult for investors in the United States to enforce against these persons or Sibanye-Stillwater a judgment obtained in a
United States court predicated upon the civil liability provisions of the federal securities or other laws of the United States or any state thereof.
In addition, investors in other jurisdictions outside South Africa may face similar difficulties.
Investors should be aware that, as a matter of South African law, courts may only award compensation for the loss or damage actually
sustained by the person to whom the compensation is awarded. Consequently, South African courts will not enforce foreign judgments
based on revenue laws, penal claims, or punitive or multiple damages. Furthermore, the South African courts will decline to enforce foreign
judgments deemed contrary to current public policy (as informed by South African constitutional values) or obtained by fraud or similar
misconduct, or where the proceedings offend basic principles of natural justice (for example, inadequate notice or lack of an opportunity
to be heard). Awards of punitive damages, in particular, are unknown to the South African legal system and are regarded as being contrary
to public policy. Whether a judgment is contrary to public policy will depend on the facts of each case. Exorbitant, unconscionable or
excessive awards may be contrary to public policy and contractually stipulated penalties are subject to and limited by the provisions of the
Conventional Penalties Act, 1962. In instances where a party seeks to have a foreign judgment recognised and enforced in South Africa,
South African courts will only enforce judgments deemed final and conclusive, granted by a court or authority in the relevant foreign
jurisdiction that had competency according to South African conflict-of-laws principles (for example, jurisdiction based on residence or
domicile of the defendant, submission to the foreign court, or a sufficient connection between the cause of action and the foreign forum).
Similarly, South African courts will not enter into the merits of a foreign judgment and cannot act as a court of appeal or review over the
foreign court. South African courts will apply their own procedural laws in relation to recognition and enforcement of foreign judgments.
Where an action based on an international contract is brought before a South African court, the capacity of the parties to the contract will
be determined in accordance with South African law. Where a party relies on a foreign law, the content of that foreign law must be proved
to the South African court’s satisfaction and the court may, in certain circumstances, require expert evidence in that regard. It is doubtful
whether an original action based on US federal securities laws or the laws of other jurisdictions outside South Africa may be brought before
South African courts. Further, a plaintiff who is not resident in South Africa may be required to provide security for costs in the event of
proceedings being initiated in South Africa.
Investors should also be aware that a foreign judgment is not directly enforceable in South Africa, but only constitutes a cause of action.
Such a judgment will be enforced by South African courts only if certain conditions are met.
DIRECTORS AND EXECUTIVE MANAGEMENT
Independent Non-Executive Chairman of the Board
Thabane Vincent Maphai (74)
BA (Hons), BPhil (cum laude), MPhil, Catholic University of Leuven; PhD, University of Natal; Advanced Management Programme (Finance for
Senior Executives), Harvard University
Dr. Vincent Maphai was appointed a director of Sibanye-Stillwater on 1 June 2019 and became the non-executive Chairman of Sibanye-
Stillwater, effective 30 September 2019. He is also a non-executive director and chairman of the board of Stadio Holdings Limited. Dr.
Maphai has accumulated over 20 years’ experience in the academic profession, and 20 years as a senior executive in the private sector. He
has served on the boards of various companies as non-executive chairperson and previously as chairman and non-executive director of
Discovery Limited.
Executive Directors
Richard Andrew Stewart (50)
Chief Executive Officer
BSc (Hons), PhD (Geology), University of the Witwatersrand; MBA, Warwick Business School (UK); PrSciNat
Dr. Richard Stewart became executive director and CEO of Sibanye-Stillwater on 1 October 2025. He previously served as Chief Regional
Officer: Southern Africa from 31 May 2022, following his tenure as Group Chief Operating Officer from 1 December 2020. Prior to these roles,
Richard held the position of Executive Vice President: Business Development at Sibanye-Stillwater. Richard has more than 26 years’
experience in South Africa’s geological and mining industries and is a Vice President of the Minerals Council of South Africa and Fellow of
the Geological Society of South Africa. He joined the Group in 2014, and has contributed significantly to a successful and value-accretive
acquisition and growth strategy. Prior to joining Sibanye-Stillwater, he served on the Gold One Executive Committee from 2009, where his last
appointment was Executive Vice President: Technical Services. Prior to this Richard served as CEO of Goliath Gold Limited, held
management positions at the Council for Scientific and Industrial Research (CSIR) Mining Technology division, Dunrose Trading 186
Proprietary Limited trading as Shango Solutions and Uranium One, and was an investment consultant for African Global Capital Proprietary
Limited.
Charl Keyter (52)
Chief Financial Officer
BCom (Accounting), University of Johannesburg; MBA, North-West University; ACMA
Charl Keyter was appointed a director of Sibanye-Stillwater on 9 November 2012, and executive director and CFO on 1 January 2013. He led
the deleveraging of the Group, following the significant growth of Sibanye-Stillwater into a leading diversified metals producer with an
international operating footprint ranking among the world’s top three PGM producers. His career spans more than 31 years in mining and he
previously worked 18 years at Gold Fields in various senior positions, having begun his career in February 1995 as a post-graduate trainee.
Non-Executive Directors
Richard Peter Menell (70)
MA (Natural Sciences, Geology), Trinity College, University of Cambridge; MSc (Mineral Exploration and Management), Stanford University;
FGS, FSAIMM and FAusIMM
Richard (Rick) Menell is a Sibanye-Stillwater non-executive director and was appointed on 1 January 2013. He has over 44 years’ experience
in the mining industry. Previously, he occupied the positions of President of the Minerals Council, President and CEO of TEAL Exploration &
Mining Inc., chairman of Anglovaal Mining Limited and of Avgold Limited, chairman of Bateman Engineering Limited, deputy chairman of
Harmony and of African Rainbow Minerals Limited. He has also been a director of Telkom SA SOC Limited, Standard Bank of South Africa
Limited, Weir Group PLC, Mutual and Federal Insurance Company Limited, Deputy chairman and non-executive director of Gold Fields, and
Senior Advisor to the Credit Suisse Group AG (Credit Suisse Group). Rick is a trustee of the Carrick Foundation and of the Claude Leon
Foundation. He is co-chairman of the City Year South Africa Youth Service Organisation, co-chairman and trustee of the Paleontological
Scientific Trust and was appointed to the board of Perseus Mining as an independent non-executive chairman in 2024. In August 2025 he
was appointed Chairman of Globeleq, a sustainable power developer and operator working throughout sub-Saharan Africa. He serves as a
Trustee of the University of the Western Cape Foundation.
Timothy John Cumming (68)
BSc (Hons) (Engineering), University of Cape Town; MA (PPE), Oxford University
Timothy (Tim) Cumming is a Sibanye-Stillwater non-executive director and was appointed on 21 February 2013. He is the founder and
executive director of Scatterlinks Proprietary Limited, a South African-based company providing leadership development services to senior
business executives as well as strategic advisory services. He has a wealth of experience in financial services, including periods as an
executive at Old Mutual Limited, HSBC Bank PLC (HSBC Bank) and Allan Gray Limited. He is currently also the non-executive chairman of
DRDGOLD Limited, an independent non-executive director of both Nedgroup Investments Limited and RisCura Holdings Proprietary Limited.
During 2025 he resigned as an independent non-executive director of Sasol Limited and as non-executive chairman of RisCura Holdings
Proprietary Limited. Tim started his career as an engineer at Anglo American Corporation of South Africa Limited (Anglo American
Corporation). He worked on a number of gold mines and diamond mines in Southern Africa. He is also the chairman of the Woodside
Endowment Trust and of the Investment Committee of the Mandela Rhodes Foundation.
Elaine Jay Dorward-King (68)
BSc (Chemistry), Maryville College; PhD (Analytical Chemistry), Colorado State University
Dr. Elaine Dorward-King is a Sibanye-Stillwater independent non-executive director and was appointed on 27 March 2020. She is a retired
executive with over 32 years of leadership experience in developing and implementing sustainable development, safety, health and
environmental strategies and programmes in the mining, chemical and engineering consulting sectors. From 2013 to June 2019, Elaine
served as the executive vice president of sustainability and external relations for Newmont Mining Corporation (Newmont), where she led
the development and implementation of strategy, policy and standards across the company in environmental, social responsibility,
community relations, external affairs, government relations and communications areas. She was a member of the Newmont’s executive
leadership team (ELT) and was one of four ELT members on the company’s investment committee. From June 2019 until January 2020, Elaine
was executive vice president of ESG strategy for Newmont. Prior to joining Newmont, Elaine spent 20 years at Rio Tinto PLC (Rio Tinto), where
she held a variety of leadership roles including two years as managing director of Richards Bay Minerals Proprietary Limited (Richards Bay
Minerals), one of the world’s largest producers of mineral sands products, including titanium dioxide feedstock, zircon, rutile and high-grade
iron. She also served as the global head of health, safety and environment for Rio Tinto, a role she held for eight years following other roles of
increasing responsibility. Prior to that, Elaine worked for an engineering consulting firm, EBASCO Environmental, and for Monsanto Chemical
Company, in the agricultural products division. Elaine is a board member of Kenmare Resources PLC, a leading producer of titanium
minerals and zircon and NOVAGOLD Resources Inc., a North American gold exploration and development company.
Harry James Rodolph Kenyon-Slaney (65)
BSc (Hons) (Geology), Southampton University; International Executive Programme, INSEAD (France)
Harry Kenyon-Slaney is the lead independent non-executive director of Sibanye-Stillwater, having first been appointed as a director on 16
January 2019. He is currently Chairman of Gem Diamonds Limited, the senior independent director of WE Soda Ltd and a member of the
Advisory Board of Phoenix Copper Limited, in which roles he uses his wide experience to support operational, health and safety and business
transformation programmes. He was previously a member of the Advisory Board of Schenck Process Holding GmbH until it was sold in 2023
and was a director of Bridon Bekeart Ropes Group until 2018.
Harry, who has more than 43 years of experience in the mining industry, principally with Rio Tinto PLC, is a geologist by training and his
experience spans operations, marketing, projects and business development. Until 2015 he was a member of Rio Tinto’s Group Executive
Committee, where he held the roles of Chief Executive – Energy, and before that, Chief Executive – Diamonds and Minerals. Prior to this, he
led Rio Tinto’s global titanium dioxide business, was chief executive of Rio Tinto’s listed subsidiary, Energy Resources of Australia Limited, was
General Manager Operations at Phalaborwa Mining Company Limited in South Africa, and held senior marketing roles in copper, uranium
and industrial minerals.
Keith Alfred Rayner (69)
BCom, Rhodes University; CTA; CA (SA)
Keith Rayner is a Sibanye-Stillwater non-executive director and was appointed on 1 January 2013. Keith is CEO of KA Rayner Presentations
CC, an advisory and presentation corporation specialising in corporate finance and regulatory advice. He is an independent non-executive
director of Telkom SA SOC Limited. He is a non-executive director of Nexus Intertrade Proprietary Limited, Sabi Gold Proprietary Limited
(dormant), Keidav Properties Proprietary Limited (dormant) and Appropriate Process Technologies Proprietary Limited. He is a member of the
JSE Limited’s Issuer Regulation Advisory Committee and is a member of the Investment Analysts Society. He was previously a director of
Afristrat Investment Holdings Limited and 2 Quins Engineered Business Information Proprietary Limited.
Jeremiah Skhulumi Vilakazi (65)
BA, University of South Africa; MA, Thames Valley University; MA, University of London; MBA, California Coast University
Jeremiah (Jerry) Vilakazi is a Sibanye-Stillwater non-executive director and was appointed on 1 January 2013. Jerry is a Professor in the
Department of Business Management, Unisa. He is currently a non-executive director of Blue Label Telecoms Limited and Cell C Limited. He is
the founder and Chairman of Palama Investments. He previously held the position of Chairman of Netcare Limited and directorships of
Pretoria Portland Cement Company Limited, Goliath Gold Limited, SANPARKS and Computershare Limited. He is a past CEO of Business Unity
South Africa NPC and Managing Director of the Black Management Forum NPC and former director of Commerce and Industry at the South
African Institute of Chartered Accountants. He has served on the King Committee on Corporate Governance which led reforms on
corporate governance in South Africa. In 2010, he was appointed as advisor to Citibank. Jerry served as Chief Director of the Department of
Home Affairs prior to being appointed Public Service Commissioner in 1999 and later serving on the National Planning Commission and the
Presidential Broad-based Black Economic Empowerment Advisory Council. He has also served as Chairman of the Mpumalanga Economic
Growth Agency, Mpumalanga Gambling Board and of the State Information Technology Agency (SOC) Proprietary Limited.
Sindiswa Victoria Zilwa (58)
BCompt (Hons), University of South Africa; CTA; CA (SA); CD(SA); Doctor of Business (Honoris Causa); Advanced Taxation Certificate,
University of South Africa; Advanced Diploma in Financial Planning, University of the Free State; Advanced Diploma in Banking, University of
Johannesburg; Harvard VPAL Cybersecurity Certificate Programme: Managing Risk in the Information Age, Harvard University
Dr. Sindiswa (Sindi) Zilwa is a Sibanye-Stillwater independent non-executive director and was appointed on 1 January 2021. A chartered
accountant by profession, Sindi is an expert in the areas of accounting, auditing, governance, transformation and business management.
Sindi is also a chartered director (SA) and has vast experience as a director in the public and private sectors. Her other current equity listed
board portfolio includes Cell C Limited, Delta Property Fund Limited and she was recently appointed as an independent non-executive
director of ABSA Group Limited with effect from 1 April 2025. She is an author of “The ACE Model-Winning Formula for Audit Committees”,
formerly used by the Institute of Directors to train audit committee members in South Africa, and the author of “Creating Board and
Committee Effectiveness”. She is a member of the South African Institute of Chartered Accountants and Institute of Directors. Sindi was the
co-founder and retired Chief Executive Officer of Nkonki Incorporated, having held the position from 1993 to 2016. Her other former non-
executive directorships over the past five years include Metrofile Limited, Discovery Limited, Massmart Limited and Aspen Pharmacare
Holdings Limited. In 2023, Sindi completed a cybersecurity certificate programme at Harvard University online, entitled “Cybersecurity:
Managing Risk in the Information Age”. On 23 August 2025, Sindi was honoured and awarded an Honorary Doctorate in Business by HBI
University, Connecticut, USA, and the prestigious Black Excellence Lifetime Achievement Award, a recognition of her remarkable and
impactful journey in the accountancy profession in business, entrepreneurship, governance, and transformation.
Terence Mncedisi Nombembe (64)
BCom, University of Transkei; BAccSc (Hons), University of South Africa; CA (SA); Doctor of Accounting Science (Honoris Causa), Walter Sisulu
University
Terence Nombembe is a Sibanye-Stillwater independent non-executive director and was appointed in September 2024. Terence has
expertise in accounting, auditing, risk management, corporate governance, and stakeholder management. Terence was the chief
executive officer of the South African Institute of Chartered Accountants (SAICA) from 2014 to 2019, and before that, he was the Auditor-
General of South Africa from 2006 to 2013. Terence was most recently a non-executive director of the South African Reserve Bank (SARB),
having stepped down from that role in 2023. Honorary awards received by Terence include the Jorg Kandutsch Excellence Award from the
International Organisation of Supreme Audit Institutes (2010), Doctor of Accounting Science (honoris causa) from the Walter Sisulu University
(2014), Unisa’s Chancellor’s Calabash Award – Outstanding Alumnus (2014), Honorary Member of the Golden Key International Honour
Society (2015), and Doctor of Commerce (honoris causa) from the University of Pretoria (2025). Terence is an Independent Non-Executive
Director of the Nedbank Group Limited and Nedbank Limited and serves as a member of its Group Audit Committee and Group Risk and
Capital Management Committee.
In compliance with the Sarbanes-Oxley Act, the Board has identified Terence Nombembe as the Audit Committee’s financial expert.
Philippe François Marie-Joseph Boisseau (64)
MSc (Theoretical Physics), École Polytechnique
Philippe Boisseau has over 26 years of executive leadership experience. He is the former CEO of Compañía Española de Petróleos, S.A.
(CEPSA), a Spanish multinational oil and gas, chemicals, and renewable energy business, from 2019 to 2021. He also acted as Senior Advisor
to the CEO and the Board of CEPSA in 2022. Before joining CEPSA, he was a Senior Advisor to Carlyle International Energy Partners.
Previously, he worked at TotalEnergies SA (Total) for over two decades. His career at Total spans oil, gas and power value chains and all
geographies. Distinctively well-rounded, he has headed up refining and upstream businesses, has been responsible for Total’s business in the
Middle East and the Gas and Power global Division. He was instrumental in establishing and leading Total’s New Energies division from 2007
to 2016. With a very large international experience, including expatriations in the US and Argentina, Philippe has been a member of Total’s
Executive Committee for 5 years, leading the Retail and Marketing and the New Energies Global Divisions.
His functional experience encompasses a broad spectrum, from operations, sales and marketing to building partnerships, mergers and
acquisitions, restructuring, integrating, developing and investing in major projects. He is a global energy leader with a profound strategic
and operational understanding of technology, markets, investors, consumers and regulations.
Philippe is a non-executive director of Centrica PLC and serves as a member of the Audit and Risk Committee, the Nominations Committee
and the Safety, Environment and Sustainability Committee. He also serves as non-executive director and Chairman of the audit and risks
Committee of Exolum S.A., a Spanish Energy Company. Philippe was a board member at I-Pulse Inc. from 2017 to 2021. Philippe served as a
Senior Advisor to Sibanye-Stillwater in 2023 to refine the company’s strategic approach towards prioritising metals and energy investments.
His advisory role with Sibanye-Stillwater ended before his appointment on the board.
Peter James Hancock (62)
PhD (Metallurgical Engineering), McGill University; MSc (Metallurgical Engineering), Dalhousie University; BE (Metallurgical Engineering),
Dalhousie University
Peter Hancock is a Sibanye-Stillwater independent non-executive director and was appointed on 6 May 2024. He is a mining industry
executive with more than 30 years of experience with Glencore plc overseeing nickel mining operations, developing and commercialising
process technologies and ramping up nickel projects. As vice president of Glencore’s Nickel assets in Western Australia, Peter oversaw the
Murrin Nickel-Cobalt mining operations. In his time as president of Koniambo Nickel SAS in New Caledonia from 2011 to 2016, Peter led the
completion, commissioning, and ramp-up of a US$7 billion greenfield Nickel Mine project. He previously led the Brunswick Smelter and also
led Technology and Business Development for Noranda Zinc. Earlier in his career, he contributed to significant advancements in his field as a
program leader and research engineer at the Noranda Technology Center. More recently, he served as strategic advisor to Nemaska
Lithium Inc. and IX Metals. Peter is an independent non-executive director of Sherritt International Corporation where he is currently serving
as Interim CEO. He was previously chair of the Resources, Operations, Capital, and Sustainability Committee and also served as chair of the
Sherritt HR Committee.
Lindiwe Mthimunye (52)
BCom, University of Cape Town; Post Graduate Diploma in Accounting, University of Cape Town; Post Graduate Diploma in Tax Law,
University of the Witwatersrand; MCom, University of Cape Town; DBA, Geneva Business School; CA (SA)
Dr. Lindiwe Mthimunye is a Sibanye-Stillwater independent non-executive director and was appointed on 26 August 2025. Dr. Lindiwe
Mthimunye is a seasoned Chartered Accountant with over 24 years of experience spanning the oil & gas, property investment and
management, and investment banking sectors. Her career reflects a strong commitment to strategic leadership, financial discipline and
governance excellence. Lindiwe began her career in 1999 at Rand Merchant Bank, specialising in structured and project finance. She
contributed to landmark infrastructure deals, including the award-winning financing of the Albert Luthuli Hospital, and was recognised by
ABSIP for excellence in the field. In 2006, she founded Palau Structured Solutions, advising on transactions in infrastructure public-private
partnerships and B-BBEE acquisitions, and later led financial operations at Bakoro Property Group, achieving successful portfolio exits. From
2013, she served as Group CFO at PetroSA, driving strategic initiatives such as cost optimisation, IFRS transition, and capital raising. Since
2016, Lindiwe has been active in the energy sector. In 2024, she completed her doctoral studies focused on ESG integration and its
investment implications for South Africa’s coal industry. Lindiwe also serves on other significant boards, including Blue Label Telecoms Limited,
as an Independent Non-Executive Director from 2022, and Sabvest Capital Ltd as a Non-Executive Director and previously Metrofile Holdings
Limited, as an Independent Non-Executive Chairman from 2025 until her resignation in December 2025.
Rotation of directors
In accordance with Sibanye-Stillwater’s Memorandum of Incorporation (MOI), one third of the directors shall retire from office at each
annual general meeting (AGM) and stand for election. The first to retire are those directors appointed as additional members of the Board,
followed by the longest-serving members. Retiring directors can be immediately re-elected by the shareholders at the AGM. The Board
conducted a formal fit‑and‑proper evaluation for all directors standing for election and re‑election through an external board evaluation
process. Dr. L. Mthimunye will stand for election at the AGM and Dr. Vincent Maphai, Mr. Charl Keyter, Mr. Richard Menell and Prof. Jeremiah
Vilakazi are to be re-elected at the AGM. These directors were confirmed to be fit and proper to serve.
Director changes
The following Director retirement(s) and/or (re-)appointment(s) have been announced since 31 December 2025:
•Timothy Cumming will retire from the Board at the next AGM and is not available for re-election.
C-Suite Management
Richard Cox (53)
Chief Regional Officer: Southern Africa region
Stanford Executive Program, Stanford University Graduate School of Business; MBA (cum laude), Gordon Institute of Business Science; BSc
(Mining), University of the Witwatersrand
Richard Cox has held the position of Chief Regional Officer: Southern Africa region from 1 July 2025. Richard joined Sibanye-Stillwater in
November 2020 as Senior Vice-President: Strategy Advisor before being promoted to Executive Vice President: South Africa region gold
operations in February 2021 and Executive Vice President: Processing, South Africa region in April 2024. He has 30 years’ experience in the
mining industry, with extensive experience in both the gold and PGM mining sectors. Richard has occupied various leadership roles across a
range of commodities and geographies, including at Anglo American Platinum (now Valterra Platinum), at Anglo American North Americas
in project work and at AngloGold Ashanti's South African and Malian operations.
Robert van Niekerk (61)
Chief Technical and Innovation Officer
National Higher Diploma (Metalliferous Mining), Technikon Witwatersrand; BSc (Mining Engineering), University of the Witwatersrand; South
African Mine Manager’s Certificate of Competency
Robert van Niekerk was appointed as Chief Technical and Innovation Officer for the Group from 31 May 2022 expanding his previous role as
Chief Technical Officer. Previously he served as the Executive Vice President: Group Technical Services (from April 2020). Between 2013 and
2020 he held several positions in the Group, including Executive Vice President: SA PGM operations, Divisional CEO: Platinum and Executive
Vice President: Organisational Effectiveness. Prior to joining Sibanye-Stillwater (in February 2013), he was the Senior Vice President and Group
Technical Head of Mining at Gold Fields. He previously occupied several senior operational and executive management positions at
Harmony, Anglo American Platinum Limited (Anglo American Platinum), Uranium One and Gold One. Robert began his mining career in
1982 as a Learner Official and progressed through the ranks at a number of underground and surface mining operations locally and outside
of South Africa.
Themba George Nkosi (53)
Chief People and Culture Officer
BA Hons (Employment Relations), University of Johannesburg; BTech (Human Resources), Peninsula Technikon; Human Resources Executive
Programme, University of Michigan; Business Sustainability Management Course, University of Cambridge (Institute for Sustainability
Leadership); Certificate in Energy Efficiency and Sustainability, University of Cape Town
Themba Nkosi has served as the Chief People and Culture Officer at Sibanye-Stillwater since October 2023. He joined the Group in July 2016
and has held several senior executive roles, including Executive Vice President: Human Capital, EVP Corporate Affairs, and Chief
Sustainability Officer. Before joining Sibanye-Stillwater, he was Human Resources Director for sub-Saharan Africa at the PepsiCo Incorporated
and General Manager for HR and Corporate Affairs at ArcelorMittal South Africa Limited.
Mika Seitovirta (64)
Chief Regional Officer: Europe
MSc (Econ), University of Vaasa, Finland
Mika Seitovirta was appointed Chief Regional Officer: Europe on 14 December 2021. Mika has gained extensive international experience
through his senior leadership roles in global companies across a wide range of industries. He has previously served as CEO of Outokumpu Oyj
and Glaston Corporation, as Managing Director of Hartwall Oyj/Scottish & Newcastle PLC and as Executive Chairman of Ferrovan Oy. In
addition to his current roles as Executive Chairman of Keliber Oy, and Chairman of Metroauto Oy and K. Hartwall Oy Ab, Mika has also
served as a Senior Advisor and Executive Coach for the Boston Consulting Group Inc. Mika’s significant experience in the European
automobile industry, including various positions held for more than a decade at Volvo and in the European ferroalloys industry, proves
invaluable to the growth of Sibanye-Stillwater’s battery metals business in Europe.
Charles Carter (63)
Chief Regional Officer: Americas
BA (Hons), University of Cape Town; D.Phil, Oxford University
Charles Carter joined the Group on 1 June 2022 as Chief Regional Officer: Americas. He has held executive roles in gold exploration, mining
and refining in South Africa, Colombia and the United States during a 25 year career at AngloGold prior to joining Sibanye-Stillwater. He is a
past chairman of the Denver Gold Group Inc. and has been a director of Rand Refinery Proprietary Limited. Executive accountabilities at
AngloGold included Group Strategy, Corporate Finance and Business Development, Investor Relations and Communications, Global HR,
and executive lead for the Colombia business. Charles began his career at Anglo American Corporation and has also worked for RFC
Corporate Finance Limited. In addition to his graduate studies, he has also completed management development programmes at the
Colorado School of Mines, Kellogg School of Management at Northwestern University and Harvard University.
Melanie Naidoo-Vermaak (51)
Chief Sustainability Officer
BSc, BSc (Hons), University of KwaZulu Natal; MSc (Sustainable Development), University of Johannesburg; MBA, University of Southern
Queensland
Melanie Naidoo-Vermaak was appointed as the Chief Sustainability Officer on 1 January 2024. Her expertise in sustainable development has
been built over 22 years in the private mining and public sectors in South Africa as well as in international environmental management
exposure gained in the United Kingdom, Australia, Papua New Guinea, Fiji and in Africa. Before joining Sibanye-Stillwater, she worked at
leading international mining companies, including Harmony, De Beers Consolidated Mines Limited, BHP Billiton Limited and Anglo American
PLC. Melanie is a member of the Minerals Council South Africa’s environmental policy committee. Melanie held various directorships in her
capacity as Senior Executive and Prescribed Officer at Harmony. These included Chemwes Proprietary Limited, Covalent Water Company
Proprietary Limited, First Uranium Proprietary Limited, Nuclear Fuels Association of South Africa Proprietary Limited, Tswelopele Beneficiation
Operation Proprietary Limited, Platistone Kalgold Proprietary Limited, Golden Core Trade and Invest Proprietary Limited, Harmony Moab
Khotsong Operations Proprietary Limited, Mine Waste Solutions Proprietary Limited, Margaret Water Company Non-Profit Company, Virginia
Jewellery School Non-Profit Company, Virginia Sports Academy Non-Profit Company, Harmony Community Trust, Harmony Environmental
Trust, Harmony Social Trust and Wonderfontein Trust.
Mduduzi Bhulose (44)
Executive Vice President: Business Development
BSc. Mining Engineering and Graduate Diploma in Engineering (GDE) in Mining, University of Witwatersrand; MBA, University of Pretoria (GIBS)
Mdu was appointed Executive Vice President (EVP): Business Development on 1 October 2025, bringing over 21 years of experience in
Mining and Investment. Before joining Sibanye-Stillwater, he served as Head of Listed Equities at the Public Investment Corporation (PIC),
joining the PIC in 2016 as Portfolio Manager (Resources).
After earning his degree in Mining Engineering, Mdu launched his career at Anglo American Platinum (now Valterra Platinum), where he
held various positions within the Anglo American Group. His roles included Strategy Manager at Anglo American Platinum and Mineral
Economist at Anglo American Technical. In addition, he spent over five years as an analyst at Rand Merchant Bank, working in both the
Asset Management and Investment Banking Divisions.
Former Directors and C-Suite Management
Former C-Suite Management
Neal John Froneman (66)
Chief Executive Officer
BSc Mech Eng (Ind Opt), University of the Witwatersrand; BCompt, University of South Africa; PrEng
Neal Froneman was the executive director and CEO of Sibanye-Stillwater from 1 January 2013 until his retirement effective 1 October 2025.
Over the past ten years he has led the transformation of Sibanye-Stillwater from a 1.5Moz South Africa-based gold miner into a leading
diversified metals producer with an international operating footprint. The company now ranks as the world’s top primary producer of PGM
metals with a leading position in the PGM recycling industry. Under Neal’s leadership, Sibanye-Stillwater has begun building an international
portfolio of battery metal operations along with growing involvement in the circular economy and tailings reprocessing businesses. Neal’s
career spans nearly 40 years during which time he worked at Gold Fields Limited (Gold Fields), Harmony Gold Mining Company Limited
(Harmony) and JCI Limited. In April 2003, Neal was appointed CEO of Aflease Gold Limited (Aflease Gold), which, through a series of reverse
take-overs, became Gold One International Limited (Gold One) in May 2009. He was primarily responsible for the creation of Uranium One
Incorporated (Uranium One) from the Aflease Gold uranium assets. During this period, he was CEO of Aflease Gold and Uranium One until his
resignation from Uranium One in February 2008. He held the CEO position at Gold One until his appointment at Sibanye-Stillwater. Since 2021,
he has been appointed as a member of the Wits Foundation Board of Governors. He also serves on the councils of international mining
bodies including the ICMM and the World Gold Council. Neal was appointed as chairman of the World Gold Council during 2023 and
currently serves as both a director and Chairman of Business Against Crime SA, a non-profit organisation.
Lerato Legong (47)
Chief Legal Officer
LLB, University of Pretoria
Lerato Legong was the Chief Legal Officer of Sibanye-Stillwater until his resignation on 31 May 2025. He has over 23 years’
experience and has served both in South African and international private practice and as in-house counsel in the mining industry.
Prior to joining Sibanye-Stillwater on 16 March 2020, he held management positions at South32 Limited and served as head of legal
at the Minerals Council South Africa. He has also held legal positions at Mintails Limited, Anglo Operations Limited and Sasol Oil
Proprietary Limited.
ENVIRONMENTAL AND REGULATORY MATTERS
South Africa
Environmental
Overview
Sibanye-Stillwater’s SA operations are subject to various laws and regulations relating to the protection of the environment. In particular, the
Constitution of South Africa, 1996 (South African Constitution) grants the right to an environment that is not harmful to human health or
wellbeing, and to the protection of that environment for the benefit of present and future generations through reasonable legislation and
other measures that secure ecologically sustainable development. In addition, the South African Constitution and various environmental
legislation enacted and implemented since 1996, grant legal standing to a wide range of interest groups to enforce their environmental
rights against private entities as well as the South African government.
South African environmental legislation requires companies with activities that are reasonably expected to have environmental impacts to
obtain authorisations, permits, licences and other approvals to ensure such companies assess the extent of such impacts and put
reasonable measures in place to manage and mitigate these impacts.
The most critical and applicable environmental legislation for the mining industry in South Africa are the MPRDA, the Air Quality Act, the
Waste Act, the NEMA and the NWA. Under the One Environmental System (OES), the DMPR Minister (previously, the DMRE Minister) (and thus
by delegation, the prescribed officials of the DMPR) is the Competent Authority for all environmental issues within the mining industry,
including the approval or rejection of environmental authorisations (EAs) under the NEMA framework for listed activities pertaining to
prospecting and mining operations. The Minister of the DFFE is the Appeal Authority for any applications/authorisations approved or rejected
by the DMPR Minister. Under the transitional arrangements between the MPRDA and the NEMA, all Environmental Management Programmes
(EMPRs) previously approved under the MPRDA are deemed to be approved under NEMA.
NEMA contains the following four key provisions: (i) company directors, in their personal capacity, may be held liable for any environmental
degradation and/or the remediation thereof; (ii) every holder of a mining right will remain responsible for any environmental liability, pollution
or ecological degradation, the pumping and treatment of polluted or extraneous water and the management and sustainable closure
thereof, notwithstanding the issuance of a closure certificate; (iii) the DMPR Minister is obliged to appoint environmental mineral resource
inspectors to monitor the compliance of mining companies, as well as the enforcement of provisions insofar as it relates to prospecting,
exploration, mining or production; and (iv) a duty of care to the environment is imposed on all persons to take reasonable measures to
prevent pollution and environmental degradation.
Financial Provisioning Regulations
The Financial Provisioning Regulations require mining companies to make financial provision for degradation and rehabilitation available
prior to the commencement of mining activities to ensure adequate funding upon mine closure. Various vehicles may be utilised, including
financial guarantees, approved insurance products provided by recognised financial institutions, cash deposits into an account
administered by the Minister, and rehabilitation trust funds that comply with section 37A of the Income Tax Act. Mining companies are also
required to undertake progressive rehabilitation on an ongoing basis in respect of environmental rehabilitation. For holders of mining titles
who applied for such titles prior to 20 November 2015, compliance with the Financial Provision Regulations was temporarily suspended in
February 2024. The transitional period for existing rights and permits was extended to 19 February 2024 and new entrants have been required
to comply since 20 November 2015. With respect to 2025 reporting, compliance is expected under the Financial Provisioning Regulations
until publication in the Government Gazette. Sibanye-Stillwater will continue to assess the quantum of its financial provision in line with the
updated methodologies stipulated by the Financial Provisioning Regulations.
Carbon Tax
Energy is a significant input and cost to Sibanye-Stillwater’s mining and processing operations, with its principal energy sources being
electricity and purchased petroleum products. A number of governments or governmental bodies, including the United Nations Framework
Convention on Climate Change (UNFCCC), have introduced or are contemplating regulatory changes in response to the potential impact
of climate change, including in jurisdictions in which Sibanye-Stillwater operates.
For companies that are required to register as carbon tax entities under the Carbon Tax Act, final carbon tax liability is calculated as gross
carbon dioxide equivalent (CO2e) emission, less allowances that are built into the carbon tax design. Net CO2e emission is multiplied by the
applicable carbon tax rate to determine carbon tax liability. During the initial transition phase, tax-free allowances were introduced to ease
the impact of the initial implementation of the tax. These allowances range from 60% to 75% of emissions across sectors, with additional
allowances and offsets of up to 95% for the mining sector. The Carbon Offset Regulations, 2019 (Carbon Offset Regulation) outline the
eligibility criteria for offset projects (which include certain types of renewable energy, energy efficiency and onsite cogeneration projects),
the procedures for claiming offset allowances and the administration thereof. Offset usage limits will increase under Phase 2 of the carbon
tax implementation, which began on 1 January 2026. Companies are allowed to use such offset projects to offset up to a maximum of 5% to
10% of their total CO2e emissions to reduce their tax liability.
It is expected that Sibanye-Stillwater’s carbon tax liability will increase with Phase 2, during which the carbon tax rates will increase and
certain Phase 1 tax-free allowances are anticipated to be recalibrated or reduced. During Phase 2, carbon tax rates are set to increase
from R236 (fiscal 2025) to R462 (fiscal 2030). In addition, a higher carbon tax rate of R640/tCO2e will apply to the portion of CO2e emissions
which exceed the mandatory carbon budget to be allocated to companies under the Climate Change Act 22 of 2024 (Climate Change
Act). The Carbon Tax Act will be amended to include and operationalise the higher rate once the DFFE publishes the carbon budget
regulations, with implementation anticipated from 1 January of the year following their finalisation.
The Climate Change Act was enacted by the South African government in July 2024 and is expected to update the CO2e reporting regime
applicable to Sibanye-Stillwater. Under the Climate Change Act, the South African government will implement measures to address climate
change through sectoral emission targets and will mandate major emitting companies to comply with mandatory carbon budgets. Draft
National Greenhouse Gas Carbon Budget and Mitigation Plan Regulations have been published for comment, with finalisation pending.
Major emitters will be required to operate within allocated multi-year carbon budgets and to prepare and implement mitigation plans. The
administrative interface between these budgets and the carbon tax is being clarified through concurrent amendments to the Carbon Tax
Act. The start date for the first mandatory budget cycle and final budget allocation methodologies remain subject to the publication of final
regulations. Companies that have been allocated a carbon budget will further be required to prepare a greenhouse gas mitigation plan for
approval by the Minister of Forestry, Fisheries and the Environment. At the time of the first mandatory carbon budget cycle, all approved
pollution prevention plans under the Air Quality Act and the National Pollution Prevention Plans Regulations, 2017 must be deemed to be
greenhouse gas mitigation plans for the purposes of Climate Change Act.
The implementation and roll-out of Sibanye-Stillwater’s Energy and Decarbonisation Strategy, which includes the introduction of renewable
energy in the form of solar and wind into Sibanye-Stillwater's energy mix, is expected to reduce its Scope 2 emissions, which in turn is
anticipated to reduce the financial impact of its indirect exposure to carbon tax in its supply chain. For further information regarding Carbon
Tax and other risks related to Sibanye-Stillwater’s CO2e emissions, see – Risk Factors – Regulation of greenhouse gas emissions may materially
adversely affect Sibanye-Stillwater’s operations.
Air Quality Act
Under the Air Quality Act, the South African government has established minimum emissions standards for certain activities that result in air
emissions and for which atmospheric emission licences (AELs) must be held. The new plant standards or minimum emissions standards for all
existing plants were effective as of 31 March 2025. Non-compliance with the conditions of an AEL as well as the minimum emissions
standards under the Air Quality Act, is an offence. Emissions are reported to the regulator in accordance with the AEL conditions. Air
dispersion modelling is conducted as part of air quality impact assessments. This is used to predict air quality concentrations at receptor
locations in nearby communities. The AEL reports, which include results of stack emissions, are in place to demonstrate levels of compliance.
Waste Act
The Waste Act regulates, among other things, the identification, investigation, remediation, rehabilitation and inventorying of contaminated
land. The Waste Act requires that waste management licences (WMLs) are obtained for activities relating to the establishment and
reclamation of residue deposits and residue stockpiles.
The Waste Act also provides for waste licensing requirements for general and hazardous waste for listed activities ranging from storage of
waste salvage yards and wastewater treatment plants through to disposal by landfill. Sibanye-Stillwater currently has a number of licenced
waste management facilities, such as its Beatrix operations, Rustenburg operations, Marikana operations and the Precious Metals Refinery.
These facilities are managed in compliance with the Waste Act. In addition, the waste management activities at some of Sibanye-
Stillwater’s facilities are regulated by and managed through the existing approved EMPRs, in accordance with the transitional provisions
contained in the Waste Act and its regulations.
The Waste Act, pursuant to further regulations, also provides for registration with the DFFE of all operations generating hazardous waste or
operating waste disposal facilities; quarterly reporting by disposal facilities of quantities of waste received for disposal; classification of waste
and landfills which determines the disposal obligations and other requirements according to the waste classification regulations. Detailed
waste classifications and associated safety data sheets have been developed for all of Sibanye-Stillwater’s hazardous wastes where
relevant (e.g. the PGM operations, and waste disposed to landfills have been assessed and are directed to the relevant class of landfill).
The Waste Act further defines the requirements and risk-based assessment process to be undertaken to have waste streams excluded from
the definition of waste, provided there is a defined beneficial use for this waste. Sibanye-Stillwater has identified waste ash and calcium
sulphate as potential waste streams that fall within the parameters of these regulations, with submission to be made to obtain approval on
exclusions.
In 2023, NEMLAA introduced key changes to the regulation of management of residue deposits and stockpiles, such that residue stockpiles
and residue deposits no longer qualify as waste, or require a WML under the Waste Act. Instead, residue stockpiles and deposits will be
regulated under NEMA once the relevant NEMLAA sections come into effect.
Water Use
Under South African law, mining operations are subject to water use licences (WULs) and general authorisations that govern each
operation’s water usage and that require, among other things, mining operations to achieve and maintain certain water quality limits
regarding all water discharges. The NWA provides for the management of all surface and groundwater resources, including the protection
of the water systems for ecological requirements. The NWA, as well as the associated notices published thereunder provide for conditions
that must be adhered to and dictate the requirements for water use authorisation for various water uses that contain activity specific
requirements based on the specialist information submitted by means of the application process. All of Sibanye-Stillwater’s SA operations
hold the necessary water-related permits for current water-related activities, issued by the Department of Water and Sanitation. At certain
operations in South Africa, water use licences for future activities are currently under review.
On 17 November 2023, the Minister of Water and Sanitation published the National Water Amendment Bill that proposed amendments to
the NWA, including introducing a penalty of up to R10 million in fines or a maximum imprisonment term of 10 years, or both, for certain water
law infringements as well as potential directors’ liability.
A Waste Discharge Charge System is being implemented by the DWS to enhance water resource management. Once fully implemented,
the system will provide additional mechanisms for managing water resources effectively. As part of this rollout, the DWS has recently started
imposing a water resource management charge related to waste discharge, pursuant to the Pricing Strategy for Raw Water Use Charges
established in 2007. The DWS plans to extend the discharge charge to cover all waste-related activities impacting water resources and, to
this end, published a revised Pricing Strategy for Raw Water Use Charges on 21 June 2024, which is expected to become effective in April
2026. Once fully implemented, the Waste Discharge Charge System may have significant cost implications for Sibanye-Stillwater’s SA
operations. See – Risk Factors – Risks related to ESG – Sibanye-Stillwater’s operations are subject to water use and wastewater regulations,
which could impose significant costs and burdens.
Biodiversity Act
The Biodiversity Act aims to protect the natural diversity within South Africa, particularly threatened and endangered species, as well as the
protection of essential ecosystems and the associated services. The Biodiversity Act necessitates certain management requirements and
permits for any restricted activity involving a specimen of a listed threatened or protected species.
National Nuclear Regulator Act (NNR Act)
Sibanye-Stillwater undertakes activities which are regulated by the NNR Act. The NNR Act requires Sibanye-Stillwater to obtain authorisation
from the National Nuclear Regulator and undertake activities in accordance with the conditions of such authorisations. Each of Sibanye-
Stillwater’s South African gold operations possesses and maintains a Certificate of Registration as required by the NNR Act.
National Environmental Management Laws Amendment Act, 2022 (NEMLAA)
NEMLAA came into effect on 30 June 2023. NEMLAA has made certain changes to the National Environmental Management Act (NEMA),
the Waste Act, the Air Quality Act, the Biodiversity Act and a number of other specific environmental laws. Notable amendments include:
•NEMA amended to expressly provide for “progressive rehabilitation”, expanding vehicles that may be utilised for financial provision
(which includes parent company guarantees as well as insurance guarantees) and to enable drawdowns of financial provision up
to ten years before the final decommissioning and closure;
•regulation of residue stockpiles and deposits shifted from the Waste Act to NEMA; and
•requiring applicants for rectification under section 24G of NEMA to undertake certain measures, including suspending,
investigating, assessing and/or remediating the adverse impacts of certain activities and increasing the maximum administrative
fine to R10 million.
Enforcement of Environmental Laws
The NEMA (for the mining industry enforced by the DMPR), the MPRDA (enforced by the DMPR) and the NWA (enforced by the DWS) all
contain provisions for the appointment of environmental management inspectors, which have sweeping authority and mandates to
enforce environmental legislation. There are certain new environmental laws and regulations, such as NEMLAA and the Financial Provisioning
Regulation, which were viewed as having a negative impact on the growth and development of the mining industry. To date, Sibanye-
Stillwater’s approach has been to work with the South African government and the Minerals Council to positively influence new and
emerging legislation as far as possible in the interest of the industry as well as in the interest of the environment.
National Heritage Resources Act (NHRA)
The National Heritage Resources Act, Act No. 25 of 1999 (NHRA), aims to protect and conserve national and provincial heritage sites and
resources, requiring permits if such sites or resources are to be affected. The NHRA is administered by the South African Heritage Resources
Agency (SAHRA) at a national level, and by various provincial heritage resources authorities at a provincial level. Non-compliance with the
NHRA is an offence and may result in significant fines or imprisonment.
Health and Safety
Mining health and safety performance is regulated by the South African Mine Health and Safety Act, 1996 (MHSA). The MHSA, among others,
requires the employer to ensure, as far as reasonably practicable, that operating mines provide and maintain, as far as reasonably
practicable, a safe and healthy working environment. For non-operating mines where no closure certificate has been issued, the employer
must take reasonable steps to continuously prevent injuries, ill health, loss of life or damage of any kind from occurring at or because of the
mine. Employees have the right to leave a dangerous and/or unsafe working place. The MHSA describes the powers and functions of the
Mine Health and Safety Inspectorate (MHSI), within the jurisdiction of the DMPR, as part of the process of enforcement.
As legally required, all employees are represented in formal joint management/employee health and safety committees, through their
representatives, to help monitor and advise on occupational health and safety programmes.
In terms of the MHSA, an employer is obligated, among others, to ensure, as far as reasonably practicable, that mines are designed,
constructed and equipped to provide conditions for safe operation and a healthy working environment, and the mines are commissioned,
operated, maintained and decommissioned in such a way that employees can perform their work without endangering their health and
safety or that of any other person. Every employer must ensure, as far as reasonably practicable, that people who are not employees, but
who may be directly affected by the activities at a mine, are not exposed to any health and safety hazards. If there is reason to believe that
any occurrence, practice or condition at a mine endangers or may endanger the health or safety of any person, the MHSA authorises MHSI
inspectors to restrict or stop, partially or wholly, operations at any mine or a workplace, and require an employer to take steps to rectify the
occurrence, practice or condition before such restriction or stoppage can be lifted. The principal safety risks associated with mining
operations in South Africa include technical complexity, depth of operations, intensity of labour, the narrow nature of ore body and maturity
of mines.
The principal health risks arise from occupational exposure to silica dust, noise, heat and certain hazardous chemicals. The most significant
occupational diseases affecting Sibanye-Stillwater's workforce include lung diseases such as silicosis, TB, a combination of both, and COAD,
as well as NIHL.
The Occupational Diseases in Mines and Works Act, 1973 (ODMWA) governs compensation paid to mining employees who contract certain
occupational illnesses, such as silicosis. The South African Constitutional Court has ruled that a claim for compensation under ODMWA does
not prevent an employee from seeking compensation from an employer in a civil action under common law (either as individuals or as a
class). In 2018, the Gold Working Group, including Sibanye-Stillwater, agreed to the Settlement Agreement, which was approved by the
Gauteng High Court in Johannesburg, to compensate all eligible workers (or their surviving relatives) suffering from silicosis and silico-
tuberculosis who worked in the Gold Working Group companies’ mines from 12 March 1965 to 26 July 2019, the date of the Settlement
Agreement. The terms of the Settlement Agreement are confidential. See – Annual Financial Report – Consolidated financial statements –
Notes to the consolidated financial statements – Note 30: Occupational healthcare obligation.
A failure to comply with the MHSA is a criminal offence for which an employer, or any other person, may be charged and, if successfully
prosecuted, be fined or imprisoned, or both. The MHSI also has the power to impose administrative fines upon an employer in the event of a
breach of the MHSA. The maximum administrative fine that may be imposed is R1 million per transgression.
Mining Rights
The Mineral and Petroleum Resources Development Act, 2002 (MPRDA)
Under the MPRDA Regulations, which came into effect in 2004, prospecting rights may be granted for an initial maximum period of five years
and can be renewed once upon application for a further period not exceeding three years. Mining rights are valid for a maximum period of
30 years, and can be renewed upon application for further periods, each of which may not exceed 30 years. A wide range of factors and
principles will be considered by the DMPR Minister when exercising his discretion whether to grant or renew these rights. A prospecting or
mining right can be suspended or cancelled if the holder conducts prospecting or mining operations in breach of the MPRDA, a term or
condition of the right or an environmental management plan, programme or environmental authorisation (as may be applicable), or if the
holder of the right submits false, incorrect or misleading information to the DMPR. The MPRDA sets out a process which must be followed
before the DMPR Minister is entitled to suspend or cancel the prospecting or mining right.
The MPRDA also empowers the DMPR Minister to develop a Broad-Based Socio-Economic Empowerment Charter for the South African
Mining Industry to set the framework, targets and timetable for effecting entry of HDPs into the mining industry and to allow such South
Africans to benefit from the exploitation of the country’s mineral resources.
The MPRDA requires mining companies to submit annual reports on HDP ownership and implementation of the approved SLP applicable to
the mining right in question, setting out their commitments, among other things, to human resource and local economic development.
Under the MPRDA, mining companies must undertake “meaningful consultations” with interested or affected parties in applying for mining
rights, including providing a reasonable opportunity for affected parties to comment on the impact of such prospecting or mining activities
on their right of use of the land. The definition of interested and affected parties includes host communities, landowners (traditional and title
deed owners); traditional authority; land claimants; lawful land occupiers; holders of informal land rights; the Department of Agriculture,
Land Reform and Rural Development; any other person (including on adjacent and non-adjacent properties) whose socio-economic
conditions may be directly affected by the proposed prospecting or mining operation; and the local municipality and the relevant
Government Departments, agencies and institutions responsible for the various aspects of the environment and for infrastructure which may
be affected by the proposed project.
Mining right holders are furthermore required to prepare closure reports in accordance with the provisions of NEMA and the EIA Regulations.
Section 96 of the MPRDA provides for internal appeals. The amended MPRDA Regulations, which came into force on 27 March 2020,
prescribe the procedure for the lodgment and adjudication of internal appeals.
Draft Mineral Resources Development Bill 2025 (2025 Bill)
On 20 May 2025, the DMPR Minister published the draft Mineral Resources Development Bill, 2025 (2025 Bill) for public comment. The 2025 Bill
seeks to amend the MPRDA to regulate associated minerals and provide new restrictions, compliance obligations and penalties for mining
companies. Key proposed changes to the MPRDA include:
•Ministerial consent required for transfers of any prospecting or mining right under section 11 of the MPRDA.
•A two‑year transitional period to apply to owners of historic residue stockpiles and deposits. Owners of stockpiles within their mining
areas have exclusive rights to amend their work programmes to include these deposits. Owners of stockpiles outside their mining
areas have two years to apply for a mining title, failing which custodianship reverts to the Government, risking a grant to third
parties.
•Section 107 amendments would authorise the MPRDA to grant the DMPR Minister authority to make regulations relating to the
promotion of transformative elements of B-BBEE ownership requirements by amending section 107 of the MPRDA. The 2025 Bill
defines broad based economic empowerment as having the meaning assigned to it in the B-BBEE Act (as defined below). The
relationship between the empowerment regulations under the MPRDA and the B-BBEE Act remains to be clarified.
•Various offences under the 2025 Bill would result in fines not exceeding 10% of the right holder’s annual South African turnover and
exports during the preceding financial year.
The 2025 Bill has contributed to increased regulatory uncertainty for mining companies in South Africa, including DRDGOLD and
Sibanye‑Stillwater (in the case of Sibanye‑Stillwater, including as a result of its majority interest in DRDGOLD). The potential impact of the 2025
Bill on DRDGOLD’s business is significant, including as a result of the proposed requirement to apply for a mining right to process movable
historical tailings and the proposed amendments to the MPRDA that would allow the DMPR Minister to set beneficiation targets for the
mining industry and exercise greater control over the beneficiation of minerals in South Africa.
DRDGOLD and Sibanye-Stillwater have submitted representations to the DMPR Minister expressing its concerns regarding these proposed
amendments. In addition, the Minerals Council of South Africa, which advocates on behalf of mining companies such as DRDGOLD and
Sibanye-Stillwater, has submitted a comprehensive written response to the DMPR Minister in relation to the 2025 Bill. The 2025 Bill remains in
draft form and the timing, final terms and practical impact of any amendments to the MPRDA remain uncertain.
Geoscience Regulations
On 30 March 2022, the DMPR Minister published the Geoscience Act Regulations, 2022 (Geoscience Regulations) to manage and promote
mineral exploration, knowledge and investment in South Africa. The Geoscience Regulations establish the Council for Geoscience (CGS), to
which it is mandatory for mining and exploration companies to submit certain geoscience data related to their prospecting and
reconnaissance activities, as applicable. It also places an obligation on owners of onshore and offshore geoscience data, and information
not related to prospecting and reconnaissance, to submit geoscience data and information to the CGS. The interpretation of the
Geoscience Regulations may be subject to dispute in future and could impose significant costs and burdens on Sibanye Stillwater’s business
if found to be applicable to mining operations held under its mining rights in South Africa. It may also impact Sibanye-Stillwater’s business
given the proprietary nature of the data and information.
2018 Mining Charter
On 27 September 2018, the Broad-Based Socio-Economic Empowerment Charter for the Mining and Minerals Industry, 2018 (2018 Mining
Charter) was published and came into effect on the same day. In September 2021, the High Court of South Africa held that the 2018 Mining
Charter is a policy document and does not, per se, bind holders of mining titles, unless its terms have been lawfully incorporated into such
mining titles. The High Court of South Africa also set aside various provisions of the 2018 Mining Charter. Following the judgment, the 2018
Mining Charter recognises the “once empowered, always empowered” principle in relation to existing rights and requires that all
applications for new mining rights, excluding renewal applications, must have a minimum of 30% HDP ownership. The DMPR confirmed that it
does not intend on appealing the outcome of the judgment.
For further information on the 2018 Mining Charter see – Sibanye-Stillwater’s mining rights are subject to legislation, which could impose
significant costs and burdens and which impose certain ownership requirements, the interpretation of which is the subject of dispute.
While the constitutional and legislative processes required for the amendments to the MPRDA may be lengthy, to the extent necessary to
comply with legislative changes, Sibanye-Stillwater may in the future be required to adjust the ownership structure of its mining assets in order
to meet B-BBEE requirements, which may be prescribed by law at such time. Sibanye-Stillwater may also incur significant costs or have to
issue additional shares as a result of changes in the interpretation of existing laws and guidelines or the imposition of new laws relating to HDP
ownership requirements, which may have a material adverse effect on Sibanye-Stillwater’s business, operating results and financial
condition.
The Broad-Based Black Economic Empowerment Act, 2003 (B-BBEE Act) and the Broad-Based Black Economic Empowerment
Amendment Act, 2013 (B-BBEE Amendment Act)
The B-BBEE Act establishes a national policy on broad-based black economic empowerment with the objective of increasing the
participation of black people in the economy. The B-BBEE Act provides for various measures to promote B-BBEE, including empowering the
Minister of Trade, Industry and Competition to issue the Codes of Good Practice for Broad-based Black Economic Empowerment (B-BBEE
Codes), with which organs of state and public entities and parties interacting with them or obtaining rights and licences from them would be
required to comply. The B-BBEE Act and the B-BBEE Codes do not require the DMPR to apply the B-BBEE Codes when determining the
qualification criteria for the issuing of mining rights, nor do they require that the DMPR apply the B-BBEE Codes as a requirement for the
retention of existing mining rights. The B-BBEE Codes will nevertheless apply to mining companies if they wish to be scored for the purpose of
contracting with state institutions. B-BBEE also has a cascading effect, even where a particular company does not interact with the South
African government or the public sector. In order to score highly on the procurement element of the scorecard, companies need to ensure
that as many of their service providers as possible also score highly on the scorecard and will, therefore, give preference to service providers
who have good B-BBEE credentials. Whilst compliance with the B-BBEE Codes is more often a commercial imperative as opposed to a legal
one, a public company listed on the JSE must annually submit a compliance report (in terms of section 13G(2) of the B-BBEE Act) to the B-
BBEE Commission in the prescribed form.
In 2014, the B-BBEE Amendment Act, 2013 (B-BBEE Amendment Act) was brought into operation. Under the B-BBEE Amendment Act, the B-
BBEE Act overrides the provisions of any other law in South Africa that conflict with the B-BBEE Act, provided any such conflicting laws were in
force immediately prior to the effective date of the B-BBEE Amendment Act. This provision came into effect on 24 October 2015 and, on 27
October 2015, the Minister for Trade, Industry and Competition published a government gazette notice declaring an exemption in favour of
the DMPR from applying the requirements contained in section 10(1) of the B-BBEE Act for a period of 12 months. The exemption can be
read as confirmation that the Department of Trade, Industry and Competition sees the B-BBEE Codes as “applicable” to the Mining Industry
after the exemption was lifted on 27 October 2016.
This raises the question of whether the B-BBEE Act and the B-BBEE Codes may overrule the Mining Charter (which for the purposes of
comparison with the B-BBEE Act, would include later iterations of the Mining Charter) in the future. There is no clarity on this point at this
stage. The revised Broad-Based Black Economic Empowerment Codes of Good Practice (the Revised BEE Codes) became effective on 1
May 2015. Both the B-BBEE Amendment Act and the Revised BEE Codes expressly stipulate that where an economic sector in South Africa
has a sector code in place for B-BBEE purposes, companies in that sector must comply with the Sector Code. For purposes of the B-BBEE Act,
the Mining Charter (as amended) is not a Sector Code. It is not clear at this stage how the Mining Charter and Revised BEE Codes relate to
each other. On 17 February 2016, the Minister of Trade, Industry and Competition published a gazette notice which repealed and confirmed
the validity of a number of Sector Codes. The omission of the Mining Charter from the notice can be interpreted as confirmation that the
Mining Charter is not contemplated as a Sector Code. This supports the interpretation that the B-BBEE Act was not intended to trump the
Mining Charter. While it is not clear how this will be interpreted, it appears that the B-BBEE Act and the B-BBEE Codes will not overrule the
Mining Charter in the future. However, this remains undetermined in law and may be resolved through either government clarification or
judicial intervention.
Housing and Living Conditions Standard
The Housing and Living Conditions Standard (Housing Standard) was published by the DMPR Minister in December 2019. Among other things,
the Housing Standard provides that:
•an existing mining right holder must, within a period of twelve months from the date of publication of the Housing Standard, submit
a detailed Housing and Living Conditions Plan;
•a new mining right holder must, within a period of 12 months from the date of the granting of the mining right, consult with
organised labour, the relevant municipality and the Department of Human Settlements regarding its mine employee housing and
living conditions needs;
•a mining right holder who intends developing accommodation for its mine employees shall, after consultation with relevant
stakeholders, where feasible, acquire land within close proximity of the mine operations and plan housing needs in support of
compact, integrated and mixed land use environment; and
•a mining right holder must offer employees a range of housing options, which includes, among others, rental accommodation,
private home ownership, government subsidised home ownership and living out allowance.
Under South African case law, the Housing Standard (as with the Mining Charter) does not have the status of law, as would be the case with
legislation and regulations. As such, the MPRDA does not entitle the DMPR to cancel or suspend a mining right in terms of section 47 of the
MPRDA on the basis of a failure to comply with the Housing Standard. Furthermore, section 93 of the MPRDA does not authorise the DMPR to
issue directives for failures to comply with the Housing Standard. However, in practice the DMPR may issue directives in the absence of the
requisite statutory authority. In this instance, the mining right holder would be entitled to challenge that exercise of public power by the
DMPR.
Mine Community Resettlement Guidelines, 2019
The DMPR Minister published Mine Community Resettlement Guidelines, 2022 (the Guidelines) on 30 March 2022. Some of the key provisions
of the Guidelines are as follows:
•the Guidelines apply to both applicants and existing holders of mining rights, prospecting rights and mining permits in terms of the
MPRDA where prospecting or mining activities will have the effect of displacement or resettlement of the affected parties;
•the Guidelines require applicants and holders to make provision for development of a Resettlement Plan, Resettlement Action Plan
and Resettlement Agreement. Furthermore, the Guidelines provide that no mining activity shall commence until a Resettlement
Agreement is reached on the appropriate amount of compensation as a result of resettlement of the affected parties. An
applicant or holder, where feasible, must provide financial assistance to affected parties. The Guidelines also envisage a “party to
party dispute resolution process” that must be invoked prior to embarking on the regional manager-led process in section 54 of the
MPRDA.
Employment Equity Amendment Act, 2022
In April 2023, President Cyril Ramaphosa signed into law the Employment Equity Amendment Act, 2022 (EEAA), which became effective on 1
January 2025. The EEAA amends the existing Employment Equity Act, 1998 (EEA) with new measures to promote diversity and equality in the
workplace. The key aspects of the EEAA include the introduction of sectoral numerical targets, as set by the South African Minister of
Employment and Labour (Minister of Employment and Labour), the purpose of which is to ensure the equitable representation of people
from designated groups (historically disadvantaged groups of people based on race, gender and disability) at all occupational levels in the
workforce. Additionally, Sibanye-Stillwater must comply with sectoral employment equity targets established by the South African Minister of
Employment and Labour in the Employment Equity Act, 2022 (Act No. 4 of 2022). From 1 September 2025, designated employers operating in
the mining sector, including Sibanye-Stillwater, have been required to implement a 5-year employment equity plan to achieve specific
sectoral targets for designated groups. These targets include representation thresholds for historically disadvantaged racial groups, women
and persons with disabilities across top management, senior management, professionally qualified and middle management and skilled
technical occupational levels. Failure to comply with these targets may result in Sibanye-Stillwater being fined and not being issued with a
certificate of compliance with the EEA. Employers will still be required to set their own targets for the semi-skilled and unskilled occupational
levels.
The Royalty Act
The Mineral and Petroleum Resources Royalty Act, 2008 (Royalty Act) imposes a royalty on the transfer of refined and unrefined mineral
resources extracted from within South Africa for the benefit of the National Revenue Fund.
The royalty in respect of refined minerals (which include gold and PGMs, where PGMs are refined and smelted to a 99.9% purity) is
calculated by multiplying the gross sales of the refined mineral during the year of assessment by the percentage determined by dividing EBIT
by the product of 12.5 times gross sales, plus an additional 0.5%. EBIT refers to taxable mining income (with certain exceptions such as no
deduction for interest payable and foreign exchange losses) before assessed losses but after capital expenditure. A maximum royalty of 5%
of revenue is applicable in respect of refined minerals.
The royalty in respect of unrefined minerals (including PGMs) is calculated by multiplying the gross sales of the unrefined mineral during the
year of assessment by the percentage determined by dividing EBIT by the product of 9 times gross sales, plus an additional 0.5%. EBIT refers to
taxable mining income (with certain exceptions such as no deduction for interest payable and foreign exchange losses) before assessed
losses but after capital expenditure. A maximum royalty of 7% of revenue is applicable in respect of unrefined minerals.
Sibanye-Stillwater currently pays a royalty based on the refined and unrefined minerals royalty calculation as applied to its gross sales.
Exchange Controls
South African law provides for Exchange Control Regulations which, among other things, restrict the outward flow of capital from South
Africa to countries not forming part of the Common Monetary Area (CMA), the latter consisting of South Africa, Namibia, Lesotho and
Eswatini. The Exchange Control Regulations, which are administered by the Financial Surveillance Department of the South African Reserve
Bank (SARB), regulate international transactions involving South African residents, including companies.
SARB approval, or approval by a SARB appointed authorised dealer (as appropriate) is therefore required for Sibanye-Stillwater and its South
African subsidiaries to incur and/or repay loans from or to non-South African residents, including non-South African Group companies.
Similarly, Sibanye-Stillwater and its South African subsidiaries would require SARB approval in order to guarantee obligations of any of
Sibanye-Stillwater’s subsidiaries with regard to commitments towards or funds obtained from non-residents of the CMA.
Transfers of funds from South Africa for the purchase of offshore assets or shares in offshore entities or for the creation or expansion of business
ventures offshore also require SARB approval. A SARB appointed authorised dealer may approve such investment if the investment is a new
outward foreign direct investment (minimum 10% interest) where the total investment does not exceed R5 billion per company per calendar
year.
Sibanye-Stillwater must also obtain approval from the SARB for any fundraising involving a currency other than South African Rand. It is
possible that the SARB may impose conditions on Sibanye-Stillwater’s use of the proceeds of any such capital raising, such as limits on
Sibanye-Stillwater’s ability to retain the proceeds of the fundraising outside South Africa or requirements that Sibanye-Stillwater seeks further
SARB approval prior to applying any such funds to a specific use.
United States
Environmental
Overview
In the United States, Sibanye-Stillwater’s US operations are subject to extensive federal, state and local government controls and regulations,
including regulation of mining and exploration activities which could involve the discharge of materials and contaminants into the
environment, the investigation and clean-up of such discharges, disturbance of land, reclamation of disturbed lands, associated potential
impacts to threatened or endangered species, management of waste materials, and other environmental concerns.
In particular, statutes including, but not limited to, the Clean Air Act, the Clean Water Act, the Toxic Substances Control Act (the TSCA), the
RCRA, the EPCRA, the Endangered Species Act, the NEPA and CERCLA impose permit requirements, effluent standards, air emission
standards, waste handling and disposal restrictions and other design and operational requirements, as well as record keeping and reporting
requirements, upon various aspects of mineral exploration, extraction and processing. In addition, the existing mining operations may
become subject to additional environmental control and mitigation requirements if applicable federal, state and local laws and regulations
governing environmental protection, land use and species protection are amended or become more stringent in the future.
In addition, the federal regulation under the RCRA governing the manner in which secondary materials and byproducts of mineral
extraction and beneficiation are handled, stored and reclaimed or reused is subject to frequent review by regulatory agencies.
Generally, compliance with the applicable environmental rules and regulations in the United States requires Sibanye-Stillwater US operations
to obtain permits issued by federal, state and local regulatory agencies and to file various reports that track operational monitoring,
compliance, performance, records maintenance activities and measure its operational effect on the environment. Certain permits require
periodic renewal or review of their conditions.
Climate Change and CO2e Emissions Regulations
In the United States, Sibanye-Stillwater is subject to legislative and regulatory initiatives that are underway to limit GHG emissions. The US
Congress has considered legislation that would control CO2e emissions through a “cap and trade” program and several US states have
already implemented programs to reduce CO2e emissions. In addition, the US Supreme Court determined in a 2007 ruling that GHG
emissions are “air pollutants” within the meaning of the federal Clean Air Act. In response, the United States Environmental Protection
Agency (EPA) promulgated an endangerment finding paving the way for regulation of CO2e emissions under the Clean Air Act. In 2010, the
EPA issued a final rule, known as the “Tailoring Rule”, which makes certain large stationary sources and modification projects subject to
permitting requirements for GHG emissions under the Clean Air Act. In June 2014, the US Supreme Court invalidated portions of the federal
Tailoring Rule, but the ruling upheld the EPA’s authority to require new or modified facilities that are already subject to permitting
requirements for conventional pollutants to comply with Best Available Control Technology (BACT) for CO2e, as well. New or modified
sources subject to permitting for conventional pollutants will be required to apply BACT for CO2e if the new source or the modification will
result in an annual increase of 75,000 tons per year of CO2e.
Sibanye-Stillwater is also subject to CO2e reporting requirements for specified large CO2e emission sources in the United States. Portions of
Sibanye-Stillwater’s US operations hold a Title V Major Air Quality Permit, which requires Sibanye-Stillwater to annually calculate the CO2e
emissions from the US operations and compare these amounts against reporting thresholds. Because current levels are well below reporting
thresholds, the Sibanye-Stillwater’s US operations are not currently required to report CO2e emissions. Portions of Sibanye-Stillwater’s US
operations also hold a Synthetic Minor Source Permit, which requires Sibanye-Stillwater to report an annual air emission inventory. Pursuant to
this licence, Sibanye-Stillwater is required to report its Scope 1 CO2e emissions at the state level in respect of its Pennsylvania facility.
Additionally, the US federal agencies may consider GHG emissions as part of NEPA reviews. In 2025, the White House Council on
Environmental Quality removed its NEPA implementing regulations and directed federal agencies to adopt or revise their own procedures
regarding how agencies consider GHG emissions in NEPA assessments. As a result, it is uncertain how GHG emissions will be assessed in future
NEPA reviews, and it remains uncertain whether, in the future, Sibanye-Stillwater will be required to mitigate its GHG emissions in connection
with any NEPA review.
In February 2026, the EPA finalised a rule rescinding the 2009 endangerment finding for GHG emissions under the Clean Air Act. The extent to
which this action may affect the future regulation of GHG emissions, including permitting requirements applicable to Sibanye-Stillwater’s US
operations, remains uncertain.
Clean Air Act
In the United States, Sibanye-Stillwater’s US operations are subject to the federal Clean Air Act and comparable state and local laws and
regulations. These laws and regulations regulate emissions of air pollutants from various industrial sources, including ventilation exhaust, rock
crushing activities, and mill processing used at Sibanye-Stillwater’s US PGM operations’ mines as well as smelting and refining stack emissions
from its processing operations, and also imposes various monitoring and reporting requirements. For example, the smelting and refining
operations are subject to particulate matter, carbon monoxide and nitrogen oxide limits under the federal New Source Performance
Standards (NSPS), in addition to stringent sulphur dioxide (SO2) limits at the Sibanye-Stillwater’s US PGM smelting operations. The Pennsylvania
site operations are similarly subject to various limits related to the emission of particulate matter (PM), nitrogen dioxide (NOx), Volatile
Organic Compounds (VOCs), mercury, and other pollutants.
Additionally, as its operations continue to grow and expand, ventilation demands, and associated emissions continue to escalate resulting in
increases in ventilation exhaust emissions. Air quality laws and regulations may require that Sibanye-Stillwater’s US operations obtain pre-
approval for the construction or modification of certain projects or facilities expected to produce or significantly increase air emissions,
obtain and strictly comply with air permits containing various emission and operational limitations and utilise specific emission control
technologies to limit emissions.
In 2025, US federal legislation overturned recent amendments to EPA regulations under the Clean Air Act that had restricted the ability of
certain major sources of hazardous air pollutants to be reclassified as area sources (which are generally subject to less stringent regulatory
requirements). In January 2026, the EPA revised its regulations accordingly, reinstating the prior framework. The extent to which this change
will affect Sibanye-Stillwater’s US operations is uncertain and will likely depend on the classification and permitting status of its facilities.
Hazardous Substances and Waste
In the United States, Sibanye-Stillwater’s US operations are subject to environmental laws and regulations relating to the management and
release of hazardous substances, solid wastes and hazardous wastes. These laws generally regulate the generation, storage, treatment,
transportation and disposal of solid and hazardous wastes and may impose strict joint and several liability for the investigation and
remediation of affected areas where hazardous substances may have been released or disposed. For instance, the CERCLA, and
comparable state laws impose liability, without regard to fault or the legality of the original conduct, on certain classes of persons that
contributed to the release of a hazardous substance into the environment.
While some of the industrial wastes generated by Sibanye-Stillwater’s US operations are excluded from hazardous wastes regulations, it also
generates industrial wastes that are subject to the requirements of the RCRA and comparable state statutes, as well as the TSCA with
respect to the Pennsylvania site operations.
Sibanye-Stillwater’s US operations annually reports to the EPA, as well as the United States Forest Service (USFS) and the Montana
Department of Environmental Quality (Montana DEQ) with respect to the US PGM operations and the Pennsylvania Department of
Environmental Protection (DEP) with respect to the Pennsylvania site operations, in relation to releases of hazardous or toxic substances to
the extent they exceed certain federal and state thresholds.
Water Discharges
In the United States, Sibanye-Stillwater’s US operations are subject to the federal Clean Water Act and analogous state laws that impose
restrictions and strict controls on the discharge of pollutants into waters, and construction activities in waters and wetlands. The scope of
these regulated waters has been subject to controversy in recent years, culminating in the issuance of a revised definition of “waters of the
United States” by the EPA in December 2022, which exerts federal jurisdiction under the Clean Water Act over traditional navigable waters,
the territorial seas, interstate waters, as well as upstream water resources that significantly affect those waters. In addition, certain state
regulations and the general permits issued under the Federal National Pollutant Discharge Elimination System program prohibit the discharge
of pollutants and chemicals. Spill prevention, control and countermeasure requirements of federal laws require appropriate containment
berms and similar structures to help prevent the contamination of regulated waters in the event of a tank spill, rupture or leak.
In addition, the Clean Water Act and analogous state laws require individual permits or coverage under general permits for discharges of
storm water runoff from certain types of facilities. For example, these permits may require Sibanye-Stillwater’s US PGM operations to monitor
and sample the storm water runoff from certain of its facilities. Federal and state regulatory agencies can impose administrative, civil and
criminal penalties for non-compliance with discharge permits or other requirements of the Clean Water Act and analogous state laws and
regulations.
During 2015, Sibanye-Stillwater’s US PGM operations completed renewal of water discharge permits at both its Stillwater and East Boulder
mines. These permits were renewed in 2023. These renewed permits include more stringent water quality discharge limits including a
compliance schedule for Sibanye-Stillwater’s US PGM operations to meet compliance with the new permits, due to some nuances and
uncertainties in Montana’s regulatory scheme for nutrients.
Endangered Species Act
The Endangered Species Act was established to protect endangered and threatened species. Pursuant to that act, if a species is listed as
threatened or endangered, restrictions may be imposed on activities that would harm the species or that would adversely affect that
species’ habitat. Similar protections are offered to migratory birds under the Migratory Bird Treaty Act. The US Fish and Wildlife Service
designates the species’ protected habitat as part of the effort to protect the species. A protected habitat designation or the mere presence
of threatened or endangered species could result in material restrictions to use of land.
Diesel Particulate Matter
In an effort to protect the health of employees Sibanye-Stillwater’s US PGM operations employs various measures to comply with the MSHA’s
limits on diesel particulate matter (DPM) exposure for underground miners. These measures include using catalytic converters, diesel
particulate filters, and enhanced ventilation regimens, modifying certain mining practices underground that tend to create concentrations
of DPM, and utilising various blends of biodiesel fuel.
Permitting and Reclamation
Operating Permits 00118 and 00149 issued by Montana DEQ encompass approximately 2,414 acres at the Stillwater Mine located in Stillwater
County, Montana and 1631 acres at the East Boulder Mine located in Sweet Grass County, Montana. The permits delineate lands that may
be subject to surface disturbance. Sibanye-Stillwater’s US PGM operations employs concurrent reclamation wherever feasible. Operating
permits in respect of the Pennsylvania site operations are issued by the Pennsylvania DEP.
Reclamation regulations affecting Sibanye-Stillwater’s US PGM operations are promulgated and enforced jointly by the Montana DEQ and
the USFS. For regulatory purposes, reclamation means returning the post-mining land to a state which has stability and utility comparable to
adjacent, undisturbed areas. Major reclamation requirements include stabilisation and re-vegetation of disturbed lands, controlling storm
water and drainage from portals and waste rock dumps, removal of roads and structures, the treatment and elimination of process solutions,
the reclamation of major tailings storage facilities and the treatment and management of mine water prior to discharge in compliance with
standards and visual mitigation.
Permits governing air and water quality are issued to Sibanye-Stillwater’s US PGM operations by the Montana DEQ and to Sibanye-Stillwater’s
Pennsylvania site operations by the Pennsylvania DEP, which has been delegated such authority by the federal government. Operating
permits issued to the Company by the Montana DEQ, the Pennsylvania DEP and the USFS do not have an expiration date but are subject to
periodic reviews. The reviews evaluate bonding levels, monitor reclamation progress, and assess compliance with all applicable permit
requirements, mitigation measures and state and federal environmental standards. Closure and reclamation obligations are reviewed and
reassessed by the agencies on a five-year rotating schedule. Bonding and financial guarantees are posted with the agencies to cover final
reclamation costs at the end of the reconciliation and reassessment process.
Health and Safety
Sibanye-Stillwater’s US PGM operations are subject to regulation by the MSHA under the Federal Mine Safety and Health Act (FMSH Act).
MSHA inspects Sibanye-Stillwater’s US PGM mine operations on a regular basis and issues various citations and orders when it believes a
violation has occurred under the FMSH Act. Sibanye-Stillwater’s US PGM, Pennsylvania site and North Carolina site operations are also subject
to general occupational standards administered by the Occupational Safety and Health Administration.
Under the Dodd-Frank Wall Street Reform and Consumer Protection Act (Dodd-Frank Act), each operator of a coal or other mine is required
to include certain mine safety results within its periodic reports filed with the SEC. In accordance with the reporting requirements included in
Section 1503(a) of the Dodd-Frank Act and Item 104 of Regulation S-K (17 CFR 229.104), the required mine safety results regarding certain
mining safety and health matters for each of Sibanye-Stillwater’s mine locations that are covered under the scope of the Dodd-Frank Act
are included in Exhibit 16 Mine Safety Disclosures of this Annual Report on Form 20-F.
Europe
Finland
Environmental
The national environmental protection legislation in Finland is strongly linked to EU legislation. In general, the EU Regulations are binding
legislative acts. While EU directives set out goals that all EU members must achieve, it is up to individual countries to enact local laws to reach
these goals.
The central governing environmental regulation in Finland is the Environmental Protection Act (57/2014), which requires an environmental
permit for activities that pose a risk of pollution. There are also various permit, notification and registration procedures to ensure regulated
activities are carried out in an environmentally sustainable manner.
Land use and nature conservation are outside of the scope of the Environmental Protection Act and regulated separately. The Water Act
(587/2011) governs the use of water and the Waste Act (646/2011) guides waste management and the recovery of waste.
In addition to environmental legislation, the prevention of accidents and other polluting incidents is regulated by chemicals legislation.
Parties are liable to restore the environment if damage occurs, however, a supervisory authority may initiate measures to restore the polluted
environment. Compensations for damage, as well as the costs of restoration work, is governed by the Act on Compensation for
Environmental Damage (737/1994). Additionally, there is a statutory environmental damage insurance used to compensate damages. The
EU Environmental liability Directive (2004/35/EC) is effected through the Act on the Remediation of Certain Environmental Damages
(383/2009), amendments to the Nature Conservation Act (1096/1996) and the Water Act.
Environmental Impact Assessment and Environmental Permitting
Environmental Impact Assessments (EIA) in Finland are regulated through the Act on Environmental Impact Assessment Procedure (252/2017,
as amended) and the Decree on Environmental Impact Assessment Procedure (277/2017, as amended). Large-scale projects with
potentially significant environmental impacts require an EIA, requiring impacts of a project to be assessed at the preparation stage. The EIA
processes required for the Keliber mining operations in Syväjärvi and Rapasaari, concentrator in Päiväneva and chemical plant in Kokkola
have been completed. Keliber has initiated EIA and zoning processes aimed at increasing the efficiency for the current 18-year LOM in
mining operations and derisking Rapasaari water balance management prior to the commencement of the planned Rapasaari mining
operations.
Legally valid environmental permits were acquired for the Syväjärvi Mine and the Kokkola Lithium refinery in 2021 and 2022, respectively, with
amendment applications relating to certain permitting conditions submitted in October 2024 and June 2024, respectively. The permit
decision relating to Kokkola Lithium Refinery amendment application was received in 2025 and is already legally valid. A joint environmental
permit for the Rapasaari mine and Päiväneva concentrator has been legally valid since April 2024 following a Vaasa administrative court
ruling, which also included sending certain permit conditions back to the permitting authority (Regional State Administrative Agency for
Western and Inland Finland) for further review. These conditions pertain to the placement of Rapasaari mine waste rock streams and
magnetic waste stream from the concentrator, the closure plan for the extractive waste areas and the associated financial guarantees. In
December 2025, the permitting authority further requested that Keliber supplement its Syväjärvi permit amendment application relating to
the permanent storage of sulfidic waste rock. The amendment application is scheduled to be submitted in April 2026, with a permit decision
expected to be given in June 2026.
For the Päiväneva concentrator, the application concerning the permit conditions subject to further review was submitted in May 2024, with
the permit decision obtained in June 2025. An NGO appealed the decision, and the Vaasa Administrative Court gave its ruling on 29
December 2025, in practice dismissing the appeal and only added two permit conditions of limited significance. The NGO subsequently
submitted an appeal to the Supreme Administrative Court who will next decide whether it will grant leave to appeal and review the matter.
Keliber believes that there are no grounds for the Supreme Administrative Court to grant leave to appeal, and the court's decision on leave
to appeal is expected in less than six months. As the initial permit decision included an enforcement order, Keliber is still able to commence
production despite of the appeal.
For the Rapasaari mine, the application concerning the permit conditions subject to further review was submitted in March 2025 and the
respective permit decision is expected during the second quarter of 2026. Keliber received the environmental permit required for the
analcime sand storage area at Hoikkaneva in October 2025.
Air pollution control
The Finnish national legislation for air pollution control covers both ambient air quality limits and air pollutant emission limits. The limits and
targets for ambient air quality are based on the Air Quality Directive (2008/50/EC) and Directive relating to arsenic, cadmium, mercury,
nickel and polycyclic aromatic hydrocarbons in ambient air (2004/107/EU) that have been implemented by a Government Decree
(113/2017). Emission reduction is based on EU Directives that are primarily implemented by the Environmental Protection Act and emission
limits for operations are defined in environmental permits.
Nature Conservation and Biodiversity
The Finnish Constitution states that the protection of its nature, biodiversity, environment and national heritage is a common, national
responsibility. The Nature Conservation Act (1096/1996) governs Finnish conservation requirements and establishes the Natura 2000 Network,
a network of protected areas in the European Union that aims to ensure the survival of Europe’s most valuable and threatened species and
habitats. In Finland, environmental permits impose requirements for the monitoring and protection of directive species of flora and fauna at
operational sites within and surroundings potential impact zones.
Where necessary, Natura assessments are included in the EIAs. The Vionneva Natura site (code FI1000019) is close to the Rapasaari Mine and
a separate Natura assessment has been made for it. The Natura assessment relating to the Vionneva Natura site and Keliber’s planned
Hoikkaneva permitting process was revisited in 2024 as a part of the environmental impact assessment for Hoikkaneva. At Kokkola, the
Rummelön-Harrbådan Natura area (code FI1000003) is located over 2 kilometres from the Lithium Hydroxide Chemical Refinery and no
separate assessment was needed.
Land Use Planning
The Finnish land use planning system has three levels: the regional plan, the general master plan/partial general master plan and the local
detailed plan. Regional plans set out the principles of land use and community structure in a region based on national and local land use
goals. The Ostrobothnia provincial plan is currently being updated, however the status of the plan is not expected to impact the project.
A general master plan or partial general master plan indicates the general principles of land use in the municipality and steers the drawing
up of local detailed plans based on the Land Use and Building Act 132/1999. A partial general master plan was required for Syväjärvi,
Rapasaari, Outovesi and Länttä with three different municipalities (Kokkola, Kaustinen, Kruunupyy). These partial general master plans are
now legally valid in all areas.
A local detailed plan provides a comprehensive description of what, and on what principles, will be built in a particular area and how the
area will otherwise be used. A local detailed plan will be needed when a building is erected. The local detailed plan for Päiväneva and
Rapasaari area became legally valid in 2022.
Waste Management and Circular Economy
The Finnish national legislation governing waste management consists of Waste Act (646/2011), Environmental Protection Act (86/2000) and
Government Decrees enacted under them: the Government Decree on Extractive Waste (190/2013) and the Waste Decree (179/2012). In
addition to these, Finland has prepared a Strategic Programme for Circular Economy that sets out objectives and indicators for the use of
natural resources. The programme includes economic incentives such as increased tax for landfilled waste and a tax for extracting minerals,
but also financing for circular economy solutions.
Keliber has waste management plans for each site as part of environmental permit applications. The plan indicates the types of waste
fractions and estimated amounts of waste generated during operations. The plan sets out ways to recycle waste and operators who handle
different waste fractions. The waste management plan will be updated before commencing operations and reviewed annually during
operation. Waste management includes record keeping of all waste generated. It must be annually reported to the supervising authority
through an electronic log system.
Climate Change Legislation
Climate change legislation is mainly based on the obligations from the UN’s Climate Convention and EU regulations such as the EU’s Emission
Trading System Directive (2003/87/EC), EU Directive on the Geological Storage of CO2 (2009/31/EC). The Climate Change Act (423/2922)
governs climate change policy planning and related monitoring setting also the national climate objectives.
Following adoption of the CSRD in the EU, Finnish companies will be progressively required to assess their Carbon footprint on Scope 1, 2 and
3 emissions and make relevant disclosures in their annual integrated report. Following EU Taxonomy regulation, Finnish companies will be
progressively required to declare the proportion and their activity deemed environmentally sustainable according to a common framework.
Keliber completed an LCA assessment in April 2024, which produced information regarding its future carbon footprint and the most
significant contributors of Scope 1, 2 and 3 emissions. A climate change risk assessment was also completed in June 2024 to identify and
assess climate-related risks and opportunities. Based on the information gathered in these assessments, Keliber has drafted a
decarbonisation plan and in October 2024 established a working group to effectuate the plan.
Health and Safety
Dam Safety
The Dam Safety Act (494/2009) aims to ensure dam safety during its life cycle and covers planning, construction, maintenance, and
operation phases. The Kainuu Centre for Economic Development, Transport, and the Environment (ELY) officially supervises dam safety,
except emergency and rescue procedures which are supervised by rescue authorities. A statement regarding dam safety from the
supervising authority (Kainuu ELY) is required as part of the environmental permit application if the project contains dams covered by this
legislation.
The waste and tailings ponds at Päiväneva concentrator area are covered by dam safety legislation and the statement from the supervising
authority was included in the environmental permit application. The permit applications for both sites have been submitted to the Permitting
Authority, the Finnish Safety and Chemicals Agency.
Chemical Safety
The legislation concerning chemicals is mainly regulated at the EU level. The Seveso III Directive (2012/18/EU) covers major accident hazards
involving dangerous substances. The REACH regulation (1272/2008 EC) governs the chemicals market and production, registration,
evaluation, authorisation and restriction. The CLP Regulation (1272/2008) covers the classification, labelling and packaging of chemicals. The
Seveso III Directive is implemented in Finnish legislation through the Act on the Safe Handling and Storage of Dangerous Chemicals and
Explosives (390/2005). The CLP and REACH regulations are covered in the Chemicals Act (599/2013). Large scale chemical storage and
handling operations need a permit granted by the Finnish Safety and Chemicals Agency.
The Päiväneva concentrator and Kokkola Lithium Hydroxide Refinery will need an operating permit to handle and store dangerous
chemicals. The products and byproducts that are not classified as waste will need to be registered according to the REACH regulation.
Fire Safety
The Rescue Act (379/2011) imposes the duties on various parties to prevent, prepare for and limit the consequences of fires and accidents.
All Keliber workplaces in Finland have a rescue plan as required. The requirements for constructions, such as emergency exits and access
roads, civil defence shelters and alarms are implemented in the construction permit.
Occupational Safety
The Occupational Safety Act (738/2002) applies to all work carried out in an employment contract and leased labour. It also applies to
contractors. The Government Decree on the Safety of Construction Work (2005/2009) enacted under this Act sets further requirements for
construction projects. The Act on the Contractor’s Obligations and Liability when Work is Contracted Out (1233/2006) aims to ensure
observance of the terms of employment and imposes an obligation on the client to ensure the contracting partner’s compliance.
Mining Rights
Mining and exploration permitting
The Mining Act (621/2011) governs the exploration and exploitation of a deposit, gold panning in state-owned area, termination of related
operations and the proceedings for establishing the mining area. The objective of the Mining Act is to promote mining and ensure that
social, economic, and ecological sustainability is considered in operations. Finnish Safety and Chemicals Agency (TUKES) acts as the mining
authority referred to in the Mining Act and monitors compliance with it. All mines in Finland require a mining permit and a mining safety
permit from TUKES. The proceedings establishing a mining area give the holder of a mining permit (or the holder of a redemption permit for a
mining area) use of the mining area for mining operations. The National Land Survey of Finland (NLS) initiates the proceedings to establish a
mining area once TUKES has granted a mining permit. The compensations for landowners are defined in this process.
If the handling and storing of dangerous chemicals and explosives on site is considered large scale, a separate permit for handling and
storing chemicals from TUKES is also needed. Exploration activities need a permit from TUKES if activities are conducted on land owned by
another landowner and when the activities are outside of the scope of prospecting work defined in the Mining Act. The exploration permit
does not authorise exploitation, but the permit holder has a priority for the mining permit.
Keliber holds legally valid mining permits for the Syväjärvi, Rapasaari and Länttä mines and a mining safety permit for the Syväjärvi mine.
France
Environmental
The Environmental Code provides a statutory framework for environmental protection in France.
Environmental liability (responsabilité environnementale) is regulated under the Environmental Code. Under the environmental liability
regime, an operator causing specific damage to the environment (including, for example, contamination of soil, contamination of water,
impact on protected species) is responsible for remediation, even in the absence of fault or negligence. If the remediation measures are not
carried out, administrative sanctions (such as consignment, compulsory execution, suspension, administrative fine, penalty payment) and
criminal sanctions (fines up to EUR 500,000 for companies) may be imposed.
The environmental harm regime (préjudice écologique) is a tortious liability regime under the Civil Code. Under the environmental harm
regime, any person responsible for an environmental harm is under an obligation to repair it, even in the absence of fault or negligence. The
sanctions may consist of preventive measures and compensation. Compensation is primarily in kind. If compensation-in-kind measures are
impossible or insufficient, the judge may order the person responsible for the environmental harm to pay damages.
Environmental authorisation
The operation of the Sandouville hydrometallurgical plant is subject to an environmental authorisation. Under the environmental
authorisation regime provided for in the Environmental Code, a single environmental authorisation covers several authorisations such as the
authorisation related to the safeguarding of water (known as a water law authorisation or IOTA) and the Installation Classified for the
Protection of the Environment (ICPE) authorisation. Sandouville’s environmental authorisations are renewed every five years conditioned on
the performance of a hazard study to assess ongoing environmental impact. Sandouville’s environmental authorisation was renewed on 2
October 2024 and will be valid for five years. Additional permitting request actions are presently being prepared to adapt the site to pCAM
(pre-cursor cathode active material) production in connection with the GalliCam Project.
Pursuant to the Environmental Code, the operation of facilities that present significant risks of pollution or accident is subject to the
establishment of financial guarantees, intended to ensure, according to the nature of the dangers or inconveniences of each category of
facility, the monitoring of the site and the maintenance of the safety of the facility, including possible interventions in the event of an
accident before or after closure, and the rehabilitation after closure. These financial guarantees do not cover compensation owed by the
operator to third parties who may suffer harm as a result of pollution or accidents caused by the facility.
The ICPE regulation also sets remediation obligations for the last operator of the site at the end of the site's operation. The parent company
may be found liable if its subsidiary operating the site is bankrupt or in case of gross negligence. Alternatively, liability of the landowner may
be sought, but only in case of negligence or if it has caused the pollution.
Air pollution control
The EU Air Quality Directives (2008/50/EC) and Directive relating to arsenic, cadmium, mercury, nickel and polycyclic aromatic hydrocarbons
in ambient air (2004/107/EU) have been transposed in the Environmental Code, which provides that such limits are set in the environmental
authorisation. Emissions of industrial pollutants in the atmosphere are declared on a regular basis and subjected to a dedicated tax (TGAP
“Taxe Générale sur les Activités Polluantes”).
Water pollution control
The French “water law” (Loi sur l’Eau) applied since 1964 aims at improving water repartition and limit water pollution. All water intensive
industries consuming and releasing water in the natural environment are subject to limits in terms of quantity and quality set in the
environmental authorisation. Emissions of industrial pollutants in natural water are declared on a regular basis and subject a dedicated tax
(“Redevance Pollution de l’Eau”) aiming at financing the work of regional water agencies.
Carbon emissions
French emissions legislation is based on the obligations from the UN’s Climate Convention and EU regulations such as the EU’s Emission
Trading System Directive (2003/87/EC) and the EU Directive on the Geological Storage of CO2 (2009/31/EC).
The French Multi-Annual Energy Plan (MAEP) establishes priorities for government action regarding energy policy for Metropolitan France in
the next decade. Every 5 years the Multi-Annual Energy Plan is updated, the second 5-year period is revised and a subsequent 5-year period
is added. The MAEP is governed by the Energy Code, amended by the law of 17 August 2015 on the energy transition for green growth. It
most notably covers aspects relating to improvement of energy efficiency and reductions in primary energy consumption, especially fossil
fuel consumption and promotion of the use of renewable and recovered energies. Following adoption of CSRD, French companies will be
required to progressively assess their carbon footprint on Scope 1, 2, 3 emissions and will be required to make relevant disclosures in their
annual integrated report. EU Taxonomy regulation will also require French companies to progressively declare the proportion of activities
deemed environmentally sustainable according to a common framework.
In January 2024, Sandouville Nickel refinery performed its environmental footprint (Scope 1, 2 and 3 emissions) and life cycle analysis of all its
products according to ISO 14040.
Waste Management and Circular Economy
National legislation governing waste management in France is located in the Environmental Code. In addition, objectives related to circular
economy and indicators for the use of natural resources are included in the Environmental Code.
Pursuant to the waste management regime, an administrative liability is set on the producer of waste or on the holder of waste.
Sandouville hydro-metallurgical plant produces hazardous waste, which must be handled pursuant to the provisions of the Environmental
Code.
Health and Safety
Chemical Safety
Chemical safety in France is mainly regulated at EU level. The Seveso III Directive (2012/18/EU) is to control major accident hazards involving
dangerous substances. The REACH Regulation (1272/2008 EC) governs the chemicals market and production: the registration, evaluation,
authorisation, and restriction. The CLP Regulation (1272/2008) covers the classification, labelling and packaging of chemicals. The Seveso III
Directive is implemented in France in the Environmental Code.
In addition, Law of 30 July 2003 on the prevention of technological and natural risks and the repair of damages (known as Risks Law) has
introduced technological risk prevention plans (PPRT), a tool for controlling urban development in areas where there are high-risk industrial
sites, which correspond to the Seveso “high threshold" regime.
Sandouville hydrometallurgical plant is subject to a “high threshold" classification and is thus subject to specific requirements. The operator is
required to prepare a written document defining its major accident prevention policy.
Fire Safety
Fire safety requirements for construction and maintaining buildings are set out in the National Code regarding construction and prevention
of major incidental scenarios, the National Labour Code and in applicable operating permits, including with respect to emergency
planning, interconnection of response with neighbouring activities and protection against major incidents.
Occupational Safety
The Labour Code imposes on employers a general obligation to ensure the safety and protect the health of employees. An occupational
risk assessment document (DUERP) is compulsory in all companies as soon as the first employee is hired. In the DUERP, the employer must
record the results of the assessment of the health and safety risks to which employees may be exposed.
Australia
Environmental
The Century zinc tailings retreatment operation, located in Queensland, is Sibanye-Stillwater’s sole operating asset in Australia. As such,
Sibanye-Stillwater’s operations in Australia are primarily subject to the environmental laws and regulations of the State of Queensland which
require, among other things, that Sibanye-Stillwater obtains necessary environmental approvals, environmental licences, works approvals
and mining approvals to implement and carry out its mining operations.
The Environmental Protection Act 1994 (Qld) (EP Act) is Queensland's primary environmental legislation. The object of the EP Act is to protect
the Queensland environment alongside ecologically sustainable development. The EP Act requires authority for certain environmentally
relevant activities, including mining, and makes certain adverse impacts to the environment unlawful unless they are authorised by an
environmental authority or other approval.
Environmental authorities have been granted to Sibanye-Stillwater for the following activities:
•mining at the Century operation, and activities ancillary to mining, such as waste disposal, mineral processing and fuel burning
•port operations at the Port of Karumba, including bulk material handling
These environmental authorities contain conditions that must be complied with in carrying out the relevant activities. Port operations are also
regulated by a development approval issued under Queensland's planning framework. The Century to Karumba underground slurry pipeline
is operated in accordance with a corridor licence and an operational licence under the Transport Infrastructure Act 1994 (Qld). The
operational licence requires compliance with an Environmental Management Plan attached to the licence.
The Federal Environment Protection and Biodiversity Conservation Act 1999 (Cth) (EPBC Act) also applies to activities in Queensland. The
EPBC Act regulates impacts to specific "matters of national environmental significance" including listed threatened species, migratory
species and World Heritage places. Although Sibanye-Stillwater’s existing operations at Century and the Port of Karumba do not currently
require any referral or approval under the EPBC Act, a substantial expansion or change to these activities could trigger additional
requirements.
Health and Safety
Work health and safety law in Australia is regulated by the States. In respect of the Queensland operations, the following laws apply:
•The Mining and Quarrying (Safety and Health) Act 1999 (Qld) regulates metalliferous mines in Queensland, including the Century
operation. Mine operators and the site senior executives have primary obligations to ensure that the risk to workers and other
persons arising from operations at the mine is at an "acceptable level", being as low as reasonably achievable and within
acceptable limits. To that end, they must develop and implement an appropriate safety and health management system for the
mine. Mine workers must be consulted in the development of that system. Contracting businesses performing work at mines have a
primary obligation to ensure the safety and health of persons is not adversely affected by the way the contractor undertakes work
at the mine, including by ensuring they comply with the applicable safety and health management system.
•The Work Health and Safety Act 2011 (Qld) is the general safety law that regulates work and workplaces in Queensland (but it
does not apply to mines). However, this legislation applies to the pipeline that carries slurry concentrates (outside the boundary of
the mine) to the Port of Karumba. It places a primary duty on all persons conducting a business or undertaking (including
corporations) to, so far as is reasonably practicable, ensure the health and safety of their workers, and that the safety and health
of other persons is not adversely affected by the conduct of the business or undertaking. Workers must be consulted in the
identification of hazards, risks and controls to ensure that risk is eliminated or minimised to the extent reasonably practicable.
The safety laws referred to above each place an additional obligation on the officers of corporations to exercise due diligence to ensure
the corporation complies with its obligations under the relevant safety laws. They also contain "industrial manslaughter" offences that apply
to corporations and their officers.
Additionally, particular maritime safety laws apply to the operation of ships and other vessels in State and Commonwealth territorial waters
(including those involved in the transfer and transportation of product from Queensland ports).
Mineral Rights
In Australia, the ownership of land is separate from the ownership of most minerals, which are the property of the State in which they are
located and are thus regulated by the States. The mining tenure required for the Century operation was granted under the Century Zinc
Project Act 1997 (Qld). The mining tenure is administered under the Mineral Resources Act 1989 (Qld) (MR Act) and the Mineral and Energy
Resources (Common Provisions) Act 2014 (Qld) (MERCP Act).
The MR Act regulates the grant and conditions for resource authorities, provision of security to the State, application processes, payment of
royalties to the State and offences. The MERCP Act largely deals with the registration of dealings such as caveats and mortgages, land
access, and provides an overlapping resource authority regime.
Land Claims/Heritage
Native Title
Native Title is regulated by the Native Title Act 1993 (Cth) (NTA). The object of the NTA is to provide for the recognition and protection of
Native Title, and establishes ways in which future acts affecting Native Title may proceed. Where Native Title exists, any dealings in the land
must comply with the NTA. Resource activities may affect Native Title rights, in which case the Native Title party is entitled to seek
compensation.
Century Mining Pty Ltd (CML), the State of Queensland and the Waanyi, Mingginda and Gkuthaarn and Kukatj Native Title Groups are the
parties to the Gulf Communities Agreement (GCA). The GCA was entered into to provide Native Title consent for the grant of the mining
leases and other associated tenures required for the Century operation. CML is also a party to a number of other agreements with Native
Title parties and Traditional Owners in relation to the Century operation.
Cultural Heritage
Aboriginal cultural heritage is a separate and distinct concept to Native Title. Cultural heritage may exist in relation to all areas regardless of
the Native Title status of the land. In Queensland, Aboriginal cultural heritage is regulated by the Aboriginal Cultural Heritage Act 2003 (Qld)
(ACHA). The object of the ACHA is to provide recognition, protection and conservation of Aboriginal cultural heritage.
The GCA contains commitments and processes with respect to Aboriginal cultural heritage in the area of the Century mining leases. As the
GCA was entered into before the ACHA commenced, it is treated as an ‘existing agreement’ under the ACHA.
Mt Lyell Copper Project, Tasmania
In November 2023, Sibanye-Stillwater acquired Copper Mines of Tasmania Pty Ltd, which owns the Mt Lyell Copper Project in Tasmania,
Australia. The project is currently in care and maintenance. A feasibility study considering the re-establishment of operations was completed
at the end of fiscal 2025. A similar regime as described above for Queensland applies under Tasmanian law.
DIVIDEND POLICY AND DIVIDEND DISTRIBUTION
Sibanye-Stillwater may make distributions from time to time, provided that any such distribution is pursuant to an existing legal obligation of
Sibanye-Stillwater or a court order or has been authorised by resolution of the Board in respect of cash dividends paid out of retained
income, capitalisation issues or scrip dividends incorporating an election to receive either capitalisation shares or cash (save in the case of a
pro rata distribution to all shareholders which results in shareholders holding shares in an unlisted entity which requires the sanction of an
ordinary resolution), and provided further that:
•dividends be paid to shareholders registered as at a date subsequent to the date of declaration or date of confirmation of the
dividend, whichever is the later;
•it reasonably appears that Sibanye-Stillwater will satisfy the ‘solvency and liquidity’ test as set out in the Companies Act
immediately after completing the proposed distribution; and
•no obligation is imposed by Sibanye-Stillwater, if it is a distribution of capital, that such capital be used to subscribe for shares in
Sibanye-Stillwater.
Sibanye-Stillwater must complete any such distribution fully within 120 business days after the Board acknowledges that the ‘solvency and
liquidity’ test has been applied as aforesaid, failing which it must again comply with the above.
Sibanye-Stillwater must hold all unclaimed distributions due to the shareholders of Sibanye-Stillwater in trust subject to the laws of prescription,
and accordingly may release any distributions once the prescriptive period of three years in relation to those dividends has expired.
Sibanye-Stillwater’s dividend policy is to return at least 25% to 35% of normalised earnings to shareholders and after due consideration of
future requirements the dividend may be increased beyond these levels. The Board, therefore, considers normalised earnings in determining
what value will be distributed to shareholders. The Board believes normalised earnings provides useful information to investors regarding the
extent to which results of operations may affect shareholder returns. Normalised earnings is defined as earnings attributable to the owners of
Sibanye-Stillwater excluding gains and losses on financial instruments and foreign exchange differences, impairments and related
compensation, gain/loss on disposal of property, plant and equipment, occupational healthcare expenses, restructuring costs, transaction
costs, share-based payment expenses on B-BBEE transactions, gain on acquisitions, net other business development costs, share of results of
equity-accounted investees, all after tax and the impact of non-controlling interest and changes in estimated deferred tax rate. For a
reconciliation of profit attributable to the owners of Sibanye-Stillwater to normalised earnings, see– Annual Financial Report – Consolidated
financial statements – Notes to the consolidated financial statements – Note 13: Dividends.
In line with Sibanye-Stillwater’s Dividend policy and its Capital Allocation Framework, the Board of Directors resolved to declare a final
dividend of 131 SA cents per share for the year ended 31 December 2025 (2024: nil). With the interim dividend of nil (2024: nil) SA cents per
share, the total dividend for the year ended 31 December 2025 was 131 SA cents (2024: nil).
There is no arrangement under which future dividends are waived or agreed to be waived.
THE LISTING
Sibanye-Stillwater’s ordinary shares trade on the JSE under the trading symbol “SSW”. Sibanye-Stillwater’s ADSs trade on the NYSE under the
trading symbol “SBSW”.
MEMORANDUM OF INCORPORATION
General
Sibanye-Stillwater is a public company registered in South Africa under the Companies Act 71 of 2008, as amended (Companies Act), which
limits the liability of Sibanye-Stillwater shareholders (the Shareholders), and is governed by the Sibanye-Stillwater Memorandum of
Incorporation (MOI). Sibanye-Stillwater was registered as a public company in South Africa on 6 July 2018. Sibanye-Stillwater’s registration
number is 2014/243852/06.
The MOI is not required to include, and does not include, the details of the objects and purpose of Sibanye-Stillwater.
Dividends and payments to Sibanye-Stillwater Shareholders
Sibanye-Stillwater may make payments (including the payment of dividends) to the Shareholders from time to time in accordance with
provisions of the Companies Act, the listings requirements of the JSE Limited (JSE) (JSE Listings Requirements) and the MOI. As read together,
these prohibit any payment (including the payment of any dividend) to a company’s shareholders if there are reasonable grounds for
believing that:
•the company and the group is, or would be, after the payment, unable to pay its debts as they become due in the ordinary
course of business for a period of 12 months after the date of making such payment; or
•the assets of the company and the consolidated assets of the group fairly valued would, after the payment, be less than the
liabilities of the company and the consolidated liabilities of the group, fairly valued.
Subject to the above requirements, and, in certain circumstances, approval of Shareholders by way of an ordinary resolution, the Sibanye-
Stillwater board of directors (Board) may from time to time declare a payment to be made to Shareholders and to the holders of share
warrants (if any) in proportion to the number of the shares in Sibanye-Stillwater (Sibanye-Stillwater Shares) held by them.
Sibanye-Stillwater must hold all unclaimed dividends due to the Shareholders in trust, subject to the laws of prescription, and accordingly
may release any dividends once the prescriptive period in relation to those dividends has prescribed. Sibanye-Stillwater shall be entitled at
any time to delegate its obligations in respect of unclaimed dividends or other unclaimed distributions, to any one of its bankers from time to
time.
Sibanye-Stillwater directors (Directors) may resolve that any return of capital made to all or any Shareholders whose registered addresses are
outside South Africa will, subject to any exchange control regulations then in force, be paid in such other currencies as may be stipulated by
the Directors. The Directors may also stipulate the date for converting Rand to those currencies and the provisional rate of exchange,
provided that the date for conversion must be within a period of thirty days prior to the date of payment.
Voting rights
Every Shareholder, or proxy representative of a Shareholder, who is present at a Shareholders’ meeting has one vote on a show of hands,
regardless of the number of Sibanye-Stillwater Shares he or she holds or represents or, in the case of a proxy representative, the number of
Shareholders he or she represents, unless a poll is demanded. Every Shareholder is, on a poll, entitled to one vote per Sibanye-Stillwater Share
held. A poll may be demanded by: (i) not less than five persons having the right to vote on that matter; or (ii) a person or persons entitled to
exercise not less than one tenth of the total voting rights entitled to vote on that matter; or (iii) the chairperson of the meeting. Neither the
Companies Act nor the MOI provide for cumulative voting.
A Shareholder is entitled to appoint a proxy representative to attend, speak and vote at any meeting on his or her behalf. The proxy
representative need not be a Shareholder. There are limitations on the proxy representative’s powers namely that the proxy representative
cannot delegate the authority granted to him or her as a proxy representative.
To the knowledge of management, none of the beneficial Shareholders listed in the Shareholder Information section hold voting rights which
are different from those held by other Shareholders. See – Annual Financial Report – Shareholder information.
Issue of additional shares and pre-emptive rights
Shareholder approval is required for any issuance of additional Sibanye-Stillwater Shares, other than if Sibanye-Stillwater Shares are issued
pursuant to a pro rata rights offer to all Shareholders, provided that the voting power of the class of Sibanye-Stillwater Shares subject to the
offer is less than 30% of the voting power of all Sibanye-Stillwater Shares of that class held by Shareholders immediately before the issue. An
issue of Sibanye-Stillwater Shares that meets or exceeds this 30% threshold requires Shareholder approval by way of a special resolution.
Shareholders, by ordinary resolution, which requires an independent vote in the case of specific authority, may either convey a general or
specific authority to the Board to issue Sibanye-Stillwater Shares for cash. Such authority is valid for the period provided in the applicable
resolution, but may be revoked by ordinary resolution, as the case may be, at any time. General authority may only be valid until the earlier
of the next annual general meeting and 15 months after the authority was granted.
The JSE Listings Requirements, as read with the MOI, requires that any new issue of equity shares by Sibanye-Stillwater must first be offered to
existing Shareholders in proportion to their shareholding in Sibanye-Stillwater unless, among other things, the issuance to new Shareholders is:
•pursuant to a Shareholder-approved employee share incentive scheme;
•to raise cash through a general issuance at the discretion of the Board to the general public of less than 30% of the issued share
capital in any one fiscal year at an issue price with a discount not exceeding 10% of the 30 business day weighted average
trading price prior to the date that the application is made to the JSE to list the shares, provided that a 50% majority of the votes
cast by Shareholders at a general meeting or annual general meeting must approve the granting of such authority to the Board;
•to raise cash through a specific issuance of Sibanye-Stillwater Shares for cash, provided that a 50% majority of the votes cast by
Shareholders, other than parties and their associates participating in the specific issue for cash, vote in favour of the resolution to
issue the shares;
•a capitalisation issue;
•an issue for an acquisition of assets (including another company) subject to compliance with Sections 8 and 9 of the JSE Listings
Requirements or a fundamental transaction, amalgamation or merger in terms of the Companies Act; or
•in terms of option rights or conversion rights.
In terms of the Companies Act, an issue of equity shares by Sibanye-Stillwater must be approved by a special resolution of Shareholders if the
Sibanye-Stillwater Shares are to be issued, among other things, to:
•a Director, future Director, prescribed officer or future prescribed officer of Sibanye-Stillwater; or
•a person related or inter-related to Sibanye-Stillwater, or to a Director or to a prescribed officer of Sibanye-Stillwater,
unless the issue of Sibanye-Stillwater Shares is, among other things:
•under an agreement underwriting the Sibanye-Stillwater Shares;
•in proportion to existing holdings, and on the same terms and conditions that have been offered to all the Shareholders;
•pursuant to an employee share scheme that satisfies the requirements of section 97 of the Companies Act; or
•pursuant to an offer to the public as defined in section 95(1)(h), read with section 96, of the Companies Act.
Transfer of Sibanye-Stillwater Shares
The transfer of any certificated Sibanye-Stillwater Shares will be implemented in accordance with the provisions of the Companies Act using
the then common form of transfer. Dematerialised Sibanye-Stillwater Shares which have been traded on the JSE are transferred on the
STRATE system and delivered three business days after each trade. The transferor of any Sibanye-Stillwater Share is deemed to remain the
holder of that Sibanye-Stillwater Share until the name of the transferee is entered in Sibanye-Stillwater’s securities register (the Sibanye-
Stillwater Register) for that Sibanye-Stillwater Share. Since Sibanye-Stillwater Shares are traded through STRATE, only Sibanye-Stillwater Shares
which have been Dematerialised may be traded on the JSE. Accordingly, Shareholders who hold Sibanye-Stillwater Shares in certificated
form will need to Dematerialise their Sibanye-Stillwater Shares in order to trade on the JSE.
General meetings of Sibanye-Stillwater Shareholders
The Board may convene general meetings of the Shareholders and a general meeting may also be convened on a requisition by
Shareholders made pursuant to the Companies Act. Sibanye-Stillwater is obligated to hold an annual general meeting once in every
calendar year, but no more than 15 months after the date of the previous annual general meeting.
All general meetings require 15 business days’ plus seven calendar days’ notice in writing of, among other things, the place, day and time of
the meeting to the Shareholders. Documents related to the meeting (e.g., proxy forms, resolutions, financial statements) must be made
available to the Shareholders with the notice.
Business may be transacted at any meeting of the Shareholders only while a quorum of the Shareholders is present. Shareholders
representing at least 25% of the voting rights which are entitled to be exercised in respect of at least one matter to be decided at that
Shareholders’ meeting present personally or by proxy representative and entitled to vote constitute a quorum for a general meeting and an
annual general meeting. However, a Shareholders’ meeting may not begin unless there are three Shareholders present at a meeting in
person or by proxy representative.
The annual general meeting deals with and disposes of all matters prescribed by the MOI and the Companies Act, including, among other
things:
•the re-appointment or appointment of auditors and designated individual partner;
•the election of audit committee members;
•general approval in respect of section 44 and section 45 of the Companies Act;
•general authority to issue a predetermined number of unissued authorised Shares;
•general authority to issue Shares for cash in terms of the JSE Listings Requirements;
•general authority to repurchase Shares in terms of the JSE Listings Requirements and Companies Act;
•approval of non-executive Directors' fees in terms of section 66(9) of the Companies Act;
•advisory endorsement of the Company's Remuneration policy in terms of the JSE Listings Requirements;
•advisory endorsement of the Company's Remuneration implementation report in terms of the JSE Listings Requirements;
•the presentation of the consolidated and company audited annual financial statements (annual financial statements) and report
of the independent external auditors;
•the presentation of the social and ethics committee report;
•the election of social and ethics committee members; and
•the election of new and rotating Directors.
Annual report and accounts
Sibanye-Stillwater is required to keep the accounting records and books of accounts up to date as is necessary to present the state of affairs
of Sibanye-Stillwater and to explain the financial position of Sibanye-Stillwater as prescribed by the Companies Act. Apart from the
Shareholders and holders of beneficial interests in Sibanye-Stillwater, no person has the right to inspect any account, book or document of
Sibanye-Stillwater (other than the Sibanye-Stillwater Register), except as conferred by the Companies Act, the Promotion of Access to
Information Act 2 of 2000 or authorised by Directors.
The Directors will cause to be prepared and published company and consolidated annual financial statements, an annual report and
notice of annual general meeting as required by the Companies Act and the JSE Listings Requirements within four months of the fiscal year-
end. Sibanye-Stillwater will notify the Shareholders and the holders of beneficial interests in Sibanye-Stillwater of the publication of any
annual financial statements and make the same available to every Shareholder who so requests a copy of the annual report and annual
financial statements. Not later than three months after the first six months of its fiscal year, Sibanye-Stillwater will make available to every
Shareholder an interim report for the previous six-month period.
Changes in capital or objects and powers of Sibanye-Stillwater
The Shareholders may, by the passing of a special resolution, among other things:
•increase Sibanye-Stillwater’s authorised share capital;
•consolidate and reduce the number of the issued no par value Sibanye-Stillwater Shares, if any;
•subdivide all or any portion of Sibanye-Stillwater Shares into shares of a smaller amount than is fixed by the MOI;
•reduce Sibanye-Stillwater’s authorised share capital and, if required by law, its issued share capital;
•alter the provisions of the MOI with respect to the objects and powers of Sibanye-Stillwater, if any are stated therein; and
•subject to the provisions of the Companies Act, or any other South African law governing companies, and the JSE Listings
Requirements and any other stock exchange upon which the shares of Sibanye-Stillwater may be quoted or listed from time to
time, allow Sibanye-Stillwater to acquire shares issued by itself or in any subsidiary of Sibanye-Stillwater from time to time.
Variation of rights
All or any of the rights, privileges or conditions attached to Sibanye-Stillwater Shares may be varied by a special resolution of Shareholders
passed in accordance with the provisions of the Companies Act; provided that, in circumstances where a Shareholder dissents to such
variation which materially and adversely affects his or her rights, that Shareholder shall be entitled to be paid the fair value for his or her
shares in accordance with the provisions of section 37(8) of the Companies Act, as read with the appraisal rights provided for in section 164
of the Companies Act.
Distribution of assets on liquidation
In the event of a voluntary or compulsory liquidation, dissolution or winding-up, the assets remaining after payment of all the debts and
liabilities of Sibanye-Stillwater, including the cost of liquidation, shall be dealt with by a liquidator who may, among other things, divide
among the Shareholders any part of the assets of Sibanye-Stillwater, and may vest any part of the assets of Sibanye-Stillwater as instructed at
a meeting of Shareholders in an inter vivos trust for the benefit of Shareholders. If so resolved at a meeting of Shareholders, the division of
assets is not required to be done in accordance with the legal rights of the Shareholders in their capacities as Shareholders.
Purchase of shares
The Companies Act and the JSE Listings Requirements permit the establishment of share incentive schemes for the purpose of purchasing
shares of a company for the benefit of its employees, including salaried directors. These share incentive schemes are permitted to extend
loans to Sibanye-Stillwater employees, other than non-salaried Directors, for the purpose of purchasing or subscribing for Sibanye-Stillwater
Shares.
Sibanye-Stillwater or any subsidiary or subsidiaries of it may, if authorised by ordinary resolution, acquire its own shares; provided that, there
are no reasonable grounds for believing that Sibanye-Stillwater and the group would not satisfy the solvency and liquidity test in compliance
with the Companies Act. The procedure for acquisition of Sibanye-Stillwater Shares by Sibanye-Stillwater is regulated by the MOI, the
Companies Act and the JSE Listings Requirements.
Directors
The minimum number of Directors shall be 4 (four) and the maximum shall be 15 (fifteen). However, the failure by Sibanye-Stillwater to have
the prescribed minimum number of Directors shall not invalidate anything done by the Board. If the number of Directors falls below the
minimum in the MOI, the remaining Directors shall not act after a period of three months from the date the deficiency in the minimum
number of Directors arose, except for the purpose of filling such vacancy or for the purpose of calling a meeting of Shareholders in order to
fill such vacancy. One third of the Board shall be required to retire from office at the annual general meeting held each year. The retiring
Director shall be eligible for re-election.
There are no qualifications prescribed by Sibanye-Stillwater for a person to serve as a Director or alternate Director, other than the
requirements stipulated in the Companies Act.
Directors may be paid their travelling and other expenses which are necessarily incurred by them in connection with the business of Sibanye-
Stillwater, and in attending the meetings of the Board or of committees thereof, and if any Director shall be required to perform extra
services, to go or to reside abroad or otherwise, or be specially occupied about Sibanye-Stillwater’s business, such Director shall be entitled
to receive remuneration as approved by a special resolution by the Shareholders.
If a Director has a personal financial interest in a matter to be considered by the Board, the Director must disclose such personal financial
interest before the matter is considered at the meeting and must, among other things, disclose any information relating to the matter, and
known to the Director, disclose any insights and not take part in the decision to execute any documents on behalf of Sibanye-Stillwater in
relation to the matter. However, a decision by the Board or a transaction/agreement approved by the Board will be valid despite any
personal financial interest of a Director or a person related to a Director if it was ratified or approved by ordinary resolution of the
Shareholders or declared valid by a court of law.
Borrowing powers
The Board may exercise all the powers of Sibanye-Stillwater to borrow money and to give all or any part of its property as security whether
outright or as security for any debt, liability or obligation of Sibanye-Stillwater or of any third party. Sibanye-Stillwater has unlimited borrowing
powers. Furthermore, the Board may create and issue debt instruments, as contemplated in section 43(1)(a) of the Companies Act, on such
terms and conditions and in such manner as the Board may from time to time determine, in accordance with the requirements of section 43
of the Companies Act, provided that, for so long as Sibanye-Stillwater is listed on the JSE, a debt instrument issued by Sibanye-Stillwater may
not grant special privileges regarding attending and voting at general meetings and the appointment of Directors, as contemplated in the
JSE Listings Requirements.
The Board’s borrowing powers may only be changed by special resolution of the Shareholders amending the MOI.
Non-South African shareholders
There are no limitations imposed by South African law or by the MOI on the rights of non-South African Shareholders to hold or vote Sibanye-
Stillwater Shares.
Rights of minority shareholders and directors’ duties
Majority shareholders of South African companies have no fiduciary obligations under South African common law to non-controlling
shareholders. However, under the Companies Act, a shareholder may, under certain circumstances, seek relief from the court if he or she
has been unfairly prejudiced by the company. There may also be common law personal actions available to a shareholder of a company.
In South Africa, the common law and the Companies Act impose on directors duties to, among other things, act with care, skill and
diligence, act in good faith and for a proper purpose and to conduct the company’s affairs honestly and in the best interests of the
company.
Disclosure of beneficial interest in and ownership of Sibanye-Stillwater Shares
Disclosure by Sibanye-Stillwater Shareholders
Under South African law, a registered holder of Sibanye-Stillwater Shares who is not the holder of the beneficial interest in such shares is
required to disclose the identity of the person on whose behalf that security is held and the identity of each person with a beneficial interest
in the securities so held, the number and class of securities held for each such person with a beneficial interest, and the extent of each such
beneficial interest. This information must be disclosed in writing to Sibanye-Stillwater within five business days after the end of every month
during which a change has occurred in the information or more promptly or more frequently to the extent so provided by the requirements
of a central securities depository. The information must otherwise be provided by the registered holder to any person requesting the
information on payment by such requesting person of a prescribed fee charged by the registered holder of securities. This disclosure
obligation applies in addition to the notification requirement of section 122 of the Companies Act described below. Moreover, Sibanye-
Stillwater may, by notice in writing, require a person who is a registered Shareholder, or whom Sibanye-Stillwater knows or has reasonable
cause to believe has a beneficial interest in Sibanye-Stillwater Shares, to confirm or deny whether or not such person holds the Sibanye-
Stillwater Shares or a beneficial interest therein and, if the Sibanye-Stillwater Shares are held for another person, to disclose to Sibanye-
Stillwater the identity of the person on whose behalf the Sibanye-Stillwater Shares are held. Sibanye-Stillwater may also require the person to
give particulars of the extent of the beneficial interest held during the three years preceding the date of the notice.
Under the Companies Act, “beneficial interest” generally means the right to: (i) receive or participate in any distribution in respect of the
company’s securities; (ii) exercise or cause to be exercised, in the ordinary course, any or all of the rights attaching to the company’s
securities; or (iii) dispose or direct the disposition of the company’s securities, or any part of a distribution in respect of the securities.
Under section 122 of the Companies Act, a Shareholder is required to notify Sibanye-Stillwater within three business days if it acquires or
disposes of a beneficial interest in Sibanye-Stillwater Shares such that its shareholding amounts to or ceases to amount to a 5% multiple when
measured against the issued Sibanye-Stillwater Shares at that time.
Disclosure by Sibanye-Stillwater
Under the JSE Listings Requirements and the Companies Act, as the case may be, and pursuant to the General Laws (Anti-Money
Laundering and Combatting Terrorism Financing) Amendment Act 22 of 2022, as a public company listed on the JSE, Sibanye-Stillwater is
obligated to:
•establish and maintain a register of the beneficial interest disclosures described above, including, in particular, a register of persons
who hold a beneficial interest equal to or in excess of 5% of the total number of securities issued by the company (BI Register);
•publish in its annual financial statements a list of the persons who hold a beneficial interest equal to or in excess of 5% of the total
number of securities of that class issued by Sibanye-Stillwater, together with the extent of those beneficial interests;
•disclose to the South African Takeover Regulation Panel and deliver to the Shareholders by means of a SENS announcement,
every notification received from the Shareholders in terms of section 122 of the Companies Act, unless it relates to the disposal of
any beneficial interest of less than 1% of the issued Sibanye-Stillwater Shares at that time; and
•file with the Companies and Intellectual Property Commission (CIPC), together with its annual returns, a copy of the Sibanye-
Stillwater Register and BI Register (except to the extent there is an applicable CIPC exemption).
The BI Register is to be updated within ten business days of notification by the Shareholders. Sibanye-Stillwater will be obliged to submit a
copy of the notification, applicable CoR Form and BI Register to the CIPC, which will maintain a register of the notices pursuant to section
122 of the Companies Act.
Periodic and beneficial ownership reporting under US securities laws
Under the Exchange Act, for so long as Sibanye-Stillwater continues to qualify as a “foreign private issuer”, Sibanye-Stillwater is required to
publicly file with the SEC annual reports on Form 20-F within four months of the end of the financial year covered by the report, subject to an
extension of up to 15 calendar days if a Form 12b-25 notification of late filing is submitted to the SEC. As a foreign private issuer, Sibanye-
Stillwater is also required to publicly file with the SEC on Form 6-K material information that it makes or is required to make public pursuant to
South African law, files or is required to file with any stock exchange on which the Sibanye-Stillwater Shares trade and which was made
public by that exchange, or is otherwise distributed or required to be distributed to the Shareholders.
Any person who acquires more than 5% of Sibanye-Stillwater Shares (whether in the form of Sibanye-Stillwater Shares or Sibanye-Stillwater
ADSs) is subject to an obligation to file reports of beneficial ownership with the SEC, the NYSE and Sibanye-Stillwater. Generally, these reports
are filed on a Schedule 13D. However, a short form, Schedule 13G, may be filed in lieu of Schedule 13D in certain circumstances.
Following amendments to Regulation 13D-G adopted by the SEC in October 2023, a Schedule 13D must be filed within five days after an
acquisition of securities that brings the acquirer above the 5% level, and must be amended within two days of a material change in the facts
disclosed in the filing. A Schedule 13G must be filed (by the Shareholder, as it is the individual responsibility of each beneficial owner of more
than 5% of company shares to make the filing and not Sibanye-Stillwater’s responsibility) within 45 calendar days of the end of each
calendar year, although Shareholders who did not acquire the securities with the purpose or effect of changing or influencing control of the
issuer (a “passive investor”), and who is a beneficial owner of 20% or less of a relevant class of equity securities, must file within ten days of the
acquisition of securities that triggers the obligation. Effective 30 September 2024, a Schedule 13G must now also be filed within 45 calendar
days of the end of each quarter in which beneficial ownership exceeds 5%, except with respect to passive investors with 20% or less of a
relevant class of equity securities, who must file within five days of the relevant triggering event. “Beneficial owner”, a technical term defined
in Rule 13d-3 under the Exchange Act, generally encompasses not only the record owner of securities, but also any person who has the
power to either direct the investment of, or exercise the power to vote, such securities. In addition, a person is deemed to be a beneficial
owner of a security if he or she has the right to acquire beneficial ownership of the security, including through the exercise of an option,
within 60 days.
MATERIAL CONTRACTS
The following are material contracts not entered into in the ordinary course of business that were entered into, novated or amended by
Sibanye-Stillwater in the period under review.
2026 and 2029 Notes
On 16 November 2021 Stillwater Mining Company (Stillwater), as a subsidiary of Sibanye-Stillwater, issued at face value US$1.2 billion of senior
notes (the 2021 Senior Notes) to an indenture dated 16 November 2021 among Sibanye-Stillwater, The Bank of New York Mellon and certain
guarantors. The 2021 Senior Notes offering comprises of two tranches, US$675 million 4.000% senior notes due 2026, which bear interest at a
rate of 4.000% per annum (the 2026 Notes) and US$525 million 4.500% senior notes due 2029, which bear interest at a rate of 4.500% per
annum (the 2029 Notes) (together the 2026 and 2029 Notes). The 2026 and 2029 Notes are denominated in US Dollars, mature and become
due and payable on 16 November 2026 and 16 November 2029, respectively. Interest is paid semi-annually in arrears. The 2026 and 2029
Notes are fully and unconditionally guaranteed, jointly and severally by Sibanye Stillwater Limited, Kroondal Operations Proprietary Limited,
Sibanye Rustenburg Platinum Mines Proprietary Limited, Sibanye Gold Proprietary Limited and Western Platinum Proprietary Limited. On 14
June 2023, Eastern Platinum Proprietary Limited and Sibanye Stillwater Sandouville Refinery acceded to the 2021 Senior Notes as additional
guarantors, and on 7 August 2024, Keliber Oy and Keliber Technology Oy acceded to the 2021 Senior Notes as additional guarantors. The
guarantees rank equally in right of payment to all existing and future senior debt of the guarantors.
At any time on or after 16 November 2023, in the case of the 2026 Notes, or 16 November 2025, in the case of the 2029 Notes, Stillwater may
redeem all or part of the 2026 Notes or 2029 Notes by paying the relevant price (expressed as a percentage of the principal amount of the
2026 Notes or 2029 Notes plus an applicable premium) plus accrued and unpaid interest on the 2026 Notes or 2029 Notes. In addition, prior
to 16 November 2023, Stillwater may have redeemed up to 35% of the original aggregate principal amount of the 2026 Notes or 2029 Notes
with the net proceeds from certain equity offerings. If Sibanye-Stillwater undergoes a change of control, Sibanye-Stillwater or Stillwater will be
required to make an offer to purchase each of the 2026 Notes and 2029 Notes at a purchase price equal to 101% of the principal amount of
each of the Notes, plus accrued and unpaid interest to the date of purchase. In the event of certain developments affecting taxation,
Stillwater may redeem all, but not less than all, of the 2026 and 2029 Notes.
Sibanye-Stillwater used the proceeds of the 2026 and 2029 Notes to redeem its US$550 million of 7.125% senior notes due 2025 (the 2025
Notes), as well as general corporate purposes, including advancing Sibanye-Stillwater’s battery metals strategy through, among other things,
investments and accretive acquisitions and improving earnings diversification. For information on Sibanye-Stillwater’s 2026 and 2029 Notes,
see – Annual Financial Report – Consolidated financial statements – Notes to the consolidated financial statements – Note 27.4: 2026 and
2029 Notes.
US$1 billion revolving credit facility
In April 2023, Sibanye-Stillwater announced the refinancing of its US dollar revolving credit facility (USD RCF). The USD RCF was upsized from
US$600 million to US$1 billion, with options for Sibanye-Stillwater to: (i) increase the facility size by a further US$200 million; and (ii) have EUR as
an optional currency. The key terms of the USD RCF, which involved a syndicate of ten international banks, include maintaining the existing
financial covenants of net debt to EBITDA covenant 2.5x and EBITDA to Net Finance Charges of 4x. On 26 July 2024, an amendment was
executed for an increase of certain financial covenants, most significantly that the 12-month trailing ratio of Consolidated Net Borrowings to
Consolidated EBITDA shall not exceed 3.5:1 between 30 June 2024 and 30 June 2025 inclusive, 3.0:1 between 1 July 2025 to 31 December
2025 inclusive, and 2.5:1 thereafter. An additional margin bracket was added, with the US$1 billion RCF including a margin of 2.20% if over
3.0x leverage. The USD RCF matures on 6 April 2027 following approval of the first of two potential one year extensions available on request
from Sibanye-Stillwater, the first extension which was executed and approved in 2024. The facility is guaranteed, jointly and severally by
Sibanye Stillwater Limited, Kroondal Operations Proprietary Limited, Sibanye Rustenburg Platinum Mines Proprietary Limited, Sibanye Gold
Proprietary Limited, Stillwater Mining Company Inc., Western Platinum Proprietary Limited, Eastern Platinum Proprietary Limited and Sibanye
Stillwater Sandouville Refinery. On 7 August 2024, Keliber Oy and Keliber Technology Oy acceded to the US$1 billion RCF as additional
guarantors. See – Annual Financial Report – Consolidated Financial Statements – Notes to the Consolidated Financial Statements – Note 27.1
US$1 billion RCF.
R6.5 billion revolving credit facility
In November 2019, Sibanye-Stillwater entered into a R5.5 billion revolving credit facility (Rand RCF) which was due to mature on 11
November 2024 following two one-year extensions. On 16 August 2024, the Rand RCF was refinanced and upsized from R5.5 billion to R6.0
billion. The refinanced Rand RCF matures in August 2027, subject to approval of two potential further one year extensions available on
request from Sibanye-Stillwater. The refinanced facility also includes the option to further increase the Rand RCF by R1 billion during the term
through the inclusion of additional lenders. In December 2024 Sibanye-Stillwater executed R500 million of the accordion option resulting in an
increased facility size of R6.5 billion. The facility is guaranteed, jointly and severally by Sibanye Stillwater Limited, Kroondal Operations
Proprietary Limited, Sibanye Rustenburg Platinum Mines Proprietary Limited, Sibanye Gold Proprietary Limited, Stillwater Mining Company Inc.,
Western Platinum Proprietary Limited and Eastern Platinum Proprietary Limited. See – Annual Financial Report – Consolidated financial
statements – Notes to the consolidated financial statements – Note 27.3: R6.5 billion RCF and – Annual Financial Report – Consolidated
financial statements – Notes to the consolidated financial statements – Note 27.2: R5.5 billion RCF.
US$500 million convertible bond
On 28 November 2023, Stillwater Mining Company Inc., as a subsidiary of Sibanye-Stillwater, issued US$500m convertible bonds due
November 2028 (the convertible bonds) pursuant to a Trust Deed dated 28 November 2023 among Stillwater Mining Company Inc., The Bank
of New York Mellon and certain guarantors. The convertible bonds bear interest at a rate of 4.250% per annum, and are convertible into new
and/or existing shares of Sibanye-Stillwater (Convertible Bonds). On 28 May 2024 shareholders approved of the issuance of the shares
required terminating the Convertible Bond holders option to receive a cash amount equal to the value of the underlying ordinary shares. The
convertible bonds are fully and unconditionally guaranteed, jointly and severally by Sibanye Stillwater Limited, Kroondal Operations
Proprietary Limited, Sibanye Rustenburg Platinum Mines Proprietary Limited, Sibanye Gold Proprietary Limited, Western Platinum Proprietary
Limited and Eastern Platinum Proprietary Limited. The proceeds of the convertible bond was used to preserving the balance sheet for
funding existing operations and projects through a lower commodity price environment and was also applied to funding the Reldan
acquisition. See – Annual Financial Report – Consolidated financial statements – Notes to the consolidated financial statements – Note 27.5:
US$ Convertible Bond.
€500 million green loan financing facility
On 22 August 2024, Sibanye-Stillwater executed a €500 million green loan financing facility (the Green Loan) through its subsidiary Keliber
Technology Oy in connection with the Keliber lithium project. The Green Loan proceeds are used for the capital expenditure funding for the
construction and development of its lithium mining, processing, and refining facilities in Kaustinen, Kronoby, and Kokkola.
The Green Loan comprises a €250 million Export Credit Agency (ECA) guaranteed tranche financed by banks, a €150 million tranche from
the European Investment Bank (EIB), and a €100 million syndicated commercial bank tranche. Finnvera, the Finnish state-owned ECA,
guarantees 80% of the €250 million ECA tranche. The EIB’s €150 million financing supports the green transition in Europe and regional
development, marking its first support for mining critical raw materials in the EU. The Green Loan is governed by a "Green Financing
Framework" in alignment with the Loan Market Association’s 2023 Green Loan Principles and has received a "Medium Green" classification
from S&P Global Ratings.
The Green Loan has an amortising repayment profile tied to the project's cash flows, with ultimate maturities of 7 to 8 years. It carries a
variable interest rate linked to EURIBOR with a competitive margin. The borrower is Keliber Technology Oy, and the facilities are fully and
unconditionally guaranteed, jointly and severally, by Sibanye Stillwater Limited, Stillwater Mining Company, Sibanye Gold Pty Ltd, Sibanye
Rustenburg Platinum Mines Pty Ltd, Kroondal Operations Pty Ltd, Eastern Platinum Pty Ltd, Western Platinum Pty Ltd, Sibanye Stillwater’s
Sandouville Refinery SAS, and Keliber Oy. See – Annual Financial Report – Consolidated financial statements – Notes to the consolidated
financial statements – Note 27.7: Keliber loan facilities.
US$500 million streaming agreement with Franco-Nevada
On 28 February 2025, Sibanye-Stillwater completed a US$500 million streaming agreement with Franco-Nevada (Barbados) Corporation, a
wholly-owned subsidiary of Franco-Nevada Corporation (Franco-Nevada) in exchange for the sale of gold and platinum streams with
reference to the Marikana, Kroondal and Rustenburg operations.
Under the terms of the agreement, Sibanye-Stillwater received an upfront cash payment of US$500 million on 28 February 2025 in exchange
for the future delivery of gold and platinum, as follow: (1) Gold ounces equal to 1.1% of 4E PGM oz contained in concentrate produced until
delivery of 87,500 oz of gold. Thereafter, gold ounces equal to 0.75% of 4E PGM oz contained in concentrate produced will be delivered until
the delivery of 237,000 oz of gold. Thereafter, 80% of the gold contained in concentrate for the remaining life of mine will be delivered; (2)
Platinum ounces equal to 1.0% of platinum contained in concentrate produced until delivery of 48,000 oz of platinum. Thereafter, 2.1% of
platinum contained in concentrate produced will be delivered until a total delivery of 294,000 oz of platinum, whereafter the platinum
stream will end.
Sibanye-Stillwater will receive a production payment equal to 5% per ounce of the spot gold price on the date of each gold delivery until
the delivery of 237,000 oz of gold, which will increase to 10% of the spot gold price thereafter. A production payment equal to 5% of the spot
platinum price on the date of each platinum delivery will also be paid by Franco-Nevada until the end of the platinum stream. The
production payment may change depending on certain scenarios, and Sibanye-Stillwater may elect to substitute platinum deliveries with
gold ounces and vice versa. See – Annual Financial Report – Consolidated financial statements – Notes to the consolidated financial
statements – Note 31: Deferred revenue.
Deposit agreement
In connection with the establishment of an ADS facility in respect of Sibanye-Stillwater Shares, Sibanye-Stillwater entered into the Sibanye-
Stillwater Deposit Agreement with the ADS Depositary among Sibanye-Stillwater, the ADS Depositary, you, as a Sibanye-Stillwater ADS Holder,
and all owners and holders from time to time of ADSs issued thereunder (the Sibanye-Stillwater Deposit Agreement). The Sibanye-Stillwater
Deposit Agreement sets out Sibanye-Stillwater ADS Holders’ rights, as well as the rights and obligations of the ADS Depositary. New York law
governs the Sibanye-Stillwater Deposit Agreement and the Sibanye-Stillwater ADSs. See – Exhibits – 2.4 Description of securities registered
under Section 12 of the Exchange Act.
Fees and expenses
The Depositary will charge any party depositing or withdrawing ordinary shares or any party surrendering ADSs or to whom ADSs are issued:
| | |
Persons depositing or withdrawing shares or ADS holders must pay | | |
US$5.00 (or less) per 100 Sibanye-Stillwater ADSs (or portion of 100 Sibanye-Stillwater ADSs) | | Issuance of Sibanye-Stillwater ADSs, including issuances resulting from a distribution of ordinary shares or rights or other property or cancellation of Sibanye-Stillwater ADSs for the purpose of withdrawal, including if the deposit agreement terminates |
US$.05 (or less) per ADS (or a portion thereof) | | Any cash distribution pursuant to the Deposit Agreement |
A fee equivalent to the fee that would be payable if securities distributed to you had been ordinary shares and those ordinary shares had been deposited for issuance of ADSs | | Distribution of securities distributed to holders of deposited securities which are distributed by the Depositary to Sibanye- Stillwater’s ADS holders |
US$.05 (or less) per ADSs per calendar year | | |
Registration or transfer fees | | Transfer and registration of shares on Sibanye-Stillwater’s share register to or from the name of the Depositary or its agent when you deposit or withdraw ordinary shares |
Expenses of the Depositary | | Cable, telex and facsimile transmissions (when expressly provided in the deposit agreement) converting foreign currency to US dollars |
Taxes and other governmental charges the Depositary or the custodian have to pay on any ADS or share underlying an ADS, for example, stock transfer taxes, stamp duty or withholding taxes | | |
Any charges incurred by the Depositary or its agents for servicing the deposited securities | | |
The Depositary collects its fees for delivery and surrender of ADSs directly from investors depositing shares or surrendering ADSs for the
purpose of withdrawal or from intermediaries acting for them. The Depositary collects fees for making distributions to investors by deducting
those fees from the amounts distributed or by selling a portion of distributable property to pay the fees. The Depositary may collect its annual
fee for depositary services by deduction from cash distributions or by directly billing investors or by charging the book-entry system accounts
of participants acting for them. The Depositary may generally refuse to provide fee-attracting services until its fees for those services are
paid.
From time to time, the Depositary may make payments to Sibanye-Stillwater to reimburse and/or share revenue from the fees collected from
ADS holders, or waive fees and expenses for services provided, generally relating to costs and expenses arising out of establishment and
maintenance of the ADS program. In performing its duties under the Deposit Agreement, the Depositary may use brokers, dealers or other
service providers that are affiliates of the Depositary and that may earn or share fees or commissions.
The Depositary may convert currency itself or through any of its affiliates and, in those cases, acts as principal for its own account and not as
agent, adviser, broker or fiduciary on behalf of any other person and earns revenue, including, without limitation, transaction spreads, that it
will retain for its own account. The revenue is based on, among other things, the difference between the exchange rate assigned to the
currency conversion made under the Deposit Agreement and the rate that the Depositary or its affiliate receives when buying or selling
foreign currency for its own account. The Depositary makes no representation that the exchange rate used or obtained in any currency
conversion under the Deposit Agreement will be the most favourable rate that could be obtained at the time or that the method by which
that rate will be determined will be the most favourable to ADS holders, subject to the Depositary’s obligations under the Deposit
Agreement. The methodology used to determine exchange rates used in currency conversions is available upon request.
In fiscal 2025, BNYM paid US$1.4 million to Sibanye-Stillwater as reimbursement for costs incurred over the year in connection with the ADS
program.
Payment of taxes
You will be responsible for any taxes or other governmental charges payable on your ADSs or on the deposited securities underlying your
ADSs. The Depositary may deduct the amount of any taxes owed from any payments to you. It may also restrict or refuse the transfer of your
Sibanye-Stillwater ADSs or restrict or refuse the withdrawal of your underlying deposited securities until you pay any taxes owed on your
Sibanye-Stillwater ADSs or underlying securities. It may also sell deposited securities to pay any taxes owed.
You will remain liable if the proceeds of the sale are not enough to pay the taxes. If the Depositary sells deposited securities, it will, if
appropriate, reduce the number of Sibanye-Stillwater ADSs held by you to reflect the sale and pay to you any proceeds, or send to you any
property, remaining after it has paid the taxes.
US Holders
As of 31 March 2026, 410 record holders of Sibanye-Stillwater’s ordinary shares, holding an aggregate of 1,000,268,672 ordinary shares 41.70%,
including shares underlying Sibanye-Stillwater’s ADSs, were listed as having addresses in the United States.
TAXATION
Certain South African tax considerations
The discussion in this section sets out the material South African tax consequences of the purchase, ownership and disposition of Sibanye-
Stillwater’s ordinary shares or ADSs under current South African law. Changes in the law may alter the tax treatment of Sibanye-Stillwater’s
ordinary shares or ADSs, possibly on a retroactive basis.
The following summary is not a comprehensive description of all of the tax considerations that may be relevant to a decision to purchase,
own or dispose of Sibanye-Stillwater’s ordinary shares or ADSs and does not cover tax consequences that depend upon your particular tax
circumstances. In particular, the following summary addresses tax consequences for holders of ordinary shares or ADSs who are not residents
of, or who do not carry on business in, South Africa and who hold ordinary shares or ADSs as capital assets (that is, for investment purposes).
For the purposes of the income tax treaty between South Africa and the United States and South African tax law, a United States resident
that owns Sibanye-Stillwater ADSs will be treated as the owner of the Sibanye-Stillwater ordinary shares represented by such ADSs. Sibanye-
Stillwater recommends that you consult your own tax adviser about the consequences of holding Sibanye-Stillwater’s ordinary shares or
ADSs, as applicable, in your particular situation.
Withholding tax on dividends
Withholding tax on dividends applies to dividends declared by South African resident companies to shareholders, including non-resident
shareholders or non-resident ADS holders at a rate of 20%. Generally, under the terms of the double tax treaty entered into between South
Africa and the United States (the Treaty) the tax charged on dividends may not exceed 5% of the gross amount of the dividends if the
beneficial owner of the shares, being a resident of the United States, is a company holding directly at least 10% of the voting stock of the
company paying the dividends and 15% of the gross amount of the dividends in all other cases, provided certain qualifying requirements in
terms of the Treaty are met. Further, making payment of the net dividend by applying a rate of withholding tax less the statutory rate is
subject to the beneficial owner of the dividends making certain declarations and undertakings and providing same to the company or
regulated intermediary making payment of the dividend.
Income tax and capital gains tax
Non-resident holders of ordinary shares or ADSs should not be subject to capital gains tax in South Africa with respect to the disposal of those
ordinary shares or ADSs unless (i) that non-resident shareholder (together with connected persons) holds 20% or more of the equity shares in a
company that derives 80% or more of its value from immovable property, which includes mining and prospecting rights, situated in South
Africa; or (ii) the shares are effectively connected with a permanent establishment of that non-resident shareholder in South Africa.
The effective tax rate at which capital gains tax is levied depends on the nature of the taxpayer and applies to the capital gain realised on
disposal. For example, a company’s effective rate will be 21.6% for years of assessment ending on or after 31 March 2023 (22.4% prior to that
date). Where the non-resident shareholder is subject to capital gains tax in South Africa as envisaged above and disposes of the shares, the
purchaser of the ordinary shares or ADSs will be obliged to withhold, unless the amounts payable by the purchaser to or for the benefit of the
seller in aggregate do not exceed R2 million, a percentage (between 7.5% and 15%, depending on the nature of the seller) of the purchase
consideration for the ordinary shares or ADSs payable to the non-resident shareholders and pay such amount over to the South African
Revenue Service within 14 days where the purchaser is a South African resident or within 28 days where the purchaser is a non-resident.
Where a double tax treaty applies, this could potentially reduce the South African capital gains tax, or deny South Africa the taxing rights, on
such income, depending on the wording of the relevant double tax treaty. If the statutory amount to be withheld proves to be excessive as
compared to the amount of capital gains tax which will arise, the non-resident seller may request a directive from the South African
Revenue Service to have a lower amount withheld.
Global minimum tax
South Africa has enacted the OECD/G20 Pillar Two global minimum tax framework through two complementary statutes: the Global
Minimum Tax Act, 2024 (the Global Minimum Tax Act), and the Global Minimum Tax Administration Act, 2024, both effective for fiscal years
commencing on or after 1 January 2024. These provisions apply to multinational enterprise groups with consolidated turnover of at least EUR
750 million. The Global Minimum Tax Act has two areas of focus: the income inclusion rule (IIR) and the domestic minimum top-up tax (DMTT).
The IIR imposes a tax on South African-parented multinational groups with foreign subsidiaries where the effective tax rate is below 15%. The
DMTT applies to low-taxed profits of foreign inbound multinational groups with subsidiaries in South Africa.
If Sibanye-Stillwater falls within the scope of Pillar Two, the DMTT may apply where the jurisdictional effective tax rate for South Africa is below
15% in a given fiscal year. Although South Africa’s statutory corporate tax rate exceeds 15%, the effective tax rate is calculated on financial
accounting income with specified adjustments and adjusted covered taxes on a jurisdictional basis. With respect to foreign jurisdictions in
which the Group has subsidiaries, the IIR may impose a top-up tax at the South African level if a foreign jurisdiction’s effective tax rate falls
below 15%.
Securities transfer tax
No Securities Transfer Tax (STT) is payable in South Africa with respect to the issue of a security.
STT is charged at a rate of 0.25% upon the transfer of securities issued by a company or a close corporation incorporated in South Africa,
and the transfer of securities listed on an exchange in South Africa which are issued by a company incorporated outside South Africa,
subject to certain exemptions.
A “transfer” is broadly defined and includes the transfer, sale, assignment or cession or disposal in any other manner of a security. The
cancellation or redemption of a security is also regarded as a transfer unless the company is being liquidated. However, the transfer of a
security that does not result in a change in beneficial ownership of such security is not regarded as a transfer.
In respect of the transfer of a listed security, STT is levied on the amount of the consideration for that security declared by the person who
acquires that security, or if no amount of consideration is declared, or if the amount so declared is less than the lowest price of the security,
the closing price of that security. With regard to the transfer of an unlisted security, STT is levied on the greater of the consideration given for
the acquisition of the security or the market value of an unlisted security. In the case of a transfer of a listed security, either the member, the
participant or the person to whom the security is transferred is liable for the tax. The tax must be paid by the 14th day of the month following
the transfer in the case of a listed security, and within two months from the end of the month in which the transfer took place in the case of
an unlisted security.
Interest withholding tax
Although not specifically applicable to non-resident shareholders or non-resident ADS holders, interest withholding tax will be levied at a rate
of 15% on any interest paid for the benefit of any foreign person to the extent that the interest is regarded as being from a source within
South Africa. There is, however, a specific exemption from interest withholding tax on any interest incurred on a listed debt (i.e. debt listed on
a recognised exchange). In addition, where interest withholding tax is levied, such interest withholding tax may be reduced by an
applicable double taxation treaty.
South African Exchange Control Limitations Affecting Security Holders
The discussion below relates to exchange controls in force as of the date of this annual report. These controls are subject to change at any
time without notice. It is not possible to predict whether existing exchange controls will be abolished, continued or amended by the South
African government in the future. Investors are urged to consult a professional adviser as to the exchange control implications of their
particular investments.
South African law provides for Exchange Control Regulations which, among other things, restrict the outward flow of capital from South
Africa (other than to countries which fall within the Common Monetary Area (CMA) consisting of South Africa, Namibia, Lesotho and
Eswatini). The Exchange Control Regulations, which are administered by the Financial Surveillance Department of the SARB, regulate
international transactions involving South African residents, including companies that are incorporated or registered as external companies
in South Africa.
There are no exchange control restrictions on the remittance, in full, of cash dividends declared out of trading profits to non-residents of the
CMA by Sibanye-Stillwater, provided the share certificates held by non-resident Sibanye-Stillwater shareholders have been endorsed with
the words “non-resident” or, where dematerialised, the residential status of the electronic record is flagged accordingly (i.e. non-resident or
emigrant) by the various participants in the central depository. The same endorsement requirement, however, will not be applicable to non-
resident holders of ADSs. Pre-approval by the SARB is required where dividends in specie are declared by Sibanye-Stillwater.
ADSs representing ordinary shares of Sibanye-Stillwater are freely transferable outside South Africa between persons who are not residents of
the CMA. The proceeds from the sale of ordinary shares on the JSE by shareholders who are not residents of the CMA are freely remittable to
such shareholders, provided that the shares are flagged as non-resident held (the shares on the JSE have been dematerialised). Additionally,
where ordinary shares are sold on the JSE on behalf of shareholders of Sibanye-Stillwater who are not residents of the CMA, the proceeds of
such sales will be freely exchangeable into foreign currency and remittable to them. In such case, no share certificates need to be
endorsed as the shares on the JSE have been dematerialised.
Acquisitions of Sibanye-Stillwater's ordinary shares held by South African residents by non-South African purchasers solely for a cash
consideration equal to the fair value of the ordinary shares is generally permissible. Such acquisitions would require SARB pre-approval in
certain circumstances, such as if the consideration for the acquisition is shares in a non-South African company or if the acquisition is
financed by a loan from a South African lender. If SARB denies approval of an acquisition of assets of a South African company, this may
result in an inability to complete the acquisition. Subject to this limitation, there are no restrictions on equity investments in South African
companies and a foreign investor may invest freely in the ordinary shares and ADSs of Sibanye-Stillwater.
US federal income tax considerations
The following discussion summarises the material US federal income tax consequences of the acquisition, ownership and disposition of
ordinary shares and ADSs by a US Holder. As used herein, the term “US Holder” means a beneficial owner of ordinary shares or ADSs that is for
US federal income tax purposes:
•citizen or resident of the United States;
•a corporation created or organised under the laws of the United States, any state thereof or the District of Columbia;
•an estate the income of which is subject to US federal income tax without regard to its source; or
•a trust if a court within the United States is able to exercise primary supervision over the administration of the trust and one or more
US persons have the authority to control all substantial decisions of the trust, or the trust has validly elected to be treated as a
domestic trust for US federal income tax purposes.
The US federal income tax treatment of a partner in an entity or arrangement treated as a partnership for US federal income tax purposes
that holds ordinary shares or ADSs will depend upon the status of the partner and the activities of the partnership. If you are an entity or
arrangement treated as a partnership for US federal income tax purposes, you should consult your tax adviser concerning the US federal
income tax consequences to you and your partners of the acquisition, ownership and disposition of ordinary shares or ADSs by you.
This summary only applies to US Holders that hold ordinary shares or ADSs as capital assets. This summary is based upon:
•the current federal income tax laws of the United States, including the Internal Revenue Code of 1986, as amended (the Code), its
legislative history, and existing and proposed regulations promulgated thereunder;
•current IRS practice and applicable US court decisions; and
•the income tax treaty between the United States and South Africa (the Treaty) all as of the date hereof and all subject to change
at any time, possibly with retroactive effect.
This summary assumes that the obligations of the Depositary under the Deposit Agreement and any related agreements will be performed in
accordance with their terms.
This summary is of a general nature and does not address all US federal income tax consequences that may be relevant to you in light of
your particular situation (including consequences under the alternative minimum tax or the net investment income tax), and does not
address state, local, non-US or other tax laws (such as estate and gift tax laws). For example, this summary does not apply to:
•investors that own (directly, indirectly, or by attribution) 5% or more of Sibanye-Stillwater’s stock (by vote or value);
•financial institutions;
•insurance companies;
•individual retirement accounts and other tax-deferred accounts;
•tax-exempt organisations;
•dealers in securities or currencies;
•investors that hold ordinary shares or ADSs as part of straddles, hedging transactions or conversion transactions for US federal
income tax purposes;
•persons that have ceased to be US citizens or lawful permanent residents of the United States;
•investors that hold ordinary shares or ADSs in connection with a trade or business conducted outside the United States;
•US citizens or lawful permanent residents living abroad; or
•investors whose functional currency is not the US dollar.
Sibanye-Stillwater does not believe that it was a passive foreign investment company (PFIC) for US federal income tax purposes for its most
recent taxable year, and does not expect to be a PFIC for its current taxable year or in the foreseeable future. However, Sibanye-Stillwater’s
possible status as a PFIC must be determined annually and therefore may be subject to change. If Sibanye-Stillwater were to be treated as a
PFIC, US Holders of ordinary shares or ADSs would be required (i) to pay a special US addition to tax on certain distributions and gains on sale
and (ii) to pay tax on any gain from the sale of ordinary shares or ADSs at ordinary income (rather than capital gains) rates in addition to
paying the special addition to tax on this gain. Additionally, dividends paid by Sibanye-Stillwater would not be eligible for the reduced rate
of tax described below under “Taxation of Dividends”, and additional reporting requirements could apply. The remainder of this discussion
assumes that Sibanye-Stillwater is not a PFIC for US federal income tax purposes. You should consult your own tax advisers regarding the
potential application of the PFIC regime.
The summary of US federal income tax consequences set out below is for general information only. You are urged to consult your tax
advisers as to the particular tax consequences to you of acquiring, owning and disposing of the ordinary shares or ADSs, including your
eligibility for the benefits of the Treaty and the applicability and effect of state, local, non-US and other tax laws and possible changes in tax
law.
US Holders of ADSs
For US federal income tax purposes, a US Holder of ADSs generally will be treated as the owner of the corresponding number of underlying
ordinary shares held by the Depositary for the ADSs, and references to ordinary shares in the following discussion refer also to ADSs
representing the ordinary shares.
Deposits and withdrawals of ordinary shares by US Holders in exchange for ADSs will not result in the realisation of gain or loss for US federal
income tax purposes. Your tax basis in withdrawn ordinary shares will be the same as your tax basis in the ADSs surrendered, and your holding
period for the ordinary shares will include the holding period of the ADSs.
Taxation of dividends
Distributions paid out of Sibanye-Stillwater’s current or accumulated earnings and profits (as determined for US federal income tax purposes),
before reduction for any South African withholding tax paid by Sibanye-Stillwater with respect thereto, will generally be taxable to you as
non-US source dividend income, and will not be eligible for the dividends received deduction allowed to corporations. Distributions that
exceed Sibanye-Stillwater’s current and accumulated earnings and profits will be treated as a non-taxable return of capital to the extent of
your basis in the ordinary shares and thereafter as capital gain. However, we do not maintain calculations of our earnings and profits in
accordance with US federal income tax accounting principles. You should therefore assume that any distribution by us with respect to the
shares will be reported as ordinary dividend income. You should consult your own tax advisers with respect to the appropriate US federal
income tax treatment of any distribution received from us.
Dividends paid by Sibanye-Stillwater generally will be taxable to non-corporate US Holders at the reduced rate normally applicable to long-
term capital gains, provided that either (i) Sibanye-Stillwater qualifies for the benefits of the Treaty, or (ii) with respect to dividends paid on
the ADSs, the ADSs are considered to be “readily tradable” on the NYSE. You will be eligible for this reduced rate only if you are an individual,
and have held the ordinary shares or ADSs for more than 60 days during the 121-day period beginning 60 days before the ex-dividend date.
For US federal income tax purposes, the amount of any dividend paid in Rand will be included in income in a US dollar amount calculated
by reference to the exchange rate in effect on the date the dividends are received by you (in the case of ordinary shares) or the Depositary
(in the case of ADSs), regardless of whether they are converted into US dollars at that time. If you or the Depositary, as the case may be,
convert dividends received in Rand into US dollars on the day they are received, you generally will not be required to recognise foreign
currency gain or loss in respect of this dividend income.
Effect of South African withholding taxes
A US Holder may generally be entitled, subject to certain limitations, to a foreign tax credit against its US federal income tax liability, or a
deduction in computing its US federal taxable income, for South African income taxes withheld by Sibanye-Stillwater (at a rate not
exceeding any applicable treaty rate). The rules governing foreign tax credits are complex and final Regulations issued by the U.S. Treasury
(the Final FTC Regulations) have imposed additional requirements that must be met for a foreign tax to be creditable and Sibanye-Stillwater
does not intend to determine whether such requirements will be met in the case that non-U.S. taxes are withheld (if any). However, the IRS
has issued notices indicating that the U.S. Treasury and the IRS are considering proposing amendments to the Final FTC Regulations and
allow taxpayers, subject to certain conditions, to defer the application of many aspects of the Final FTC Regulations until the date when a
notice or other guidance withdrawing or modifying this temporary relief is issued (or any later date specified in such notice or other
guidance). The rules governing foreign tax credits are complex. You should consult your tax adviser concerning the applicability of the
foreign tax credit, deductibility and source of income rules to any South African tax withheld, including the impact of the Treaty.
Taxation of a sale or other disposition
Upon a sale or other disposition of ordinary shares or ADSs, other than an exchange of ADSs for ordinary shares and vice versa, you will
generally recognise US source capital gain or loss for US federal income tax purposes equal to the difference between the amount realised
and your adjusted tax basis in the ordinary shares or ADSs, in each case as determined in US dollars. This capital gain or loss will be long-term
capital gain or loss if your holding period in the ordinary shares or ADSs exceeds one year. The deductibility of capital losses is subject to
significant limitations. You should consult your tax adviser about how to account for proceeds received on the sale or other disposition of
ordinary shares or ADSs that are not paid in US dollars.
To the extent you incur Securities Transfer Tax in connection with a transfer or withdrawal of ordinary shares as described under – Certain
South African Tax Considerations – Securities Transfer Tax above, such securities transfer tax will not be a creditable tax for US foreign tax
credit purposes. You should consult your tax adviser regarding the proper U.S. federal income tax treatment of any Securities Transfer Tax in
your particular circumstances.
Backup withholding and information reporting
Payments of dividends and other proceeds with respect to ordinary shares or ADSs by US persons will be reported to you and to the IRS as
may be required under applicable US Treasury Regulations. Backup withholding may apply to these payments if you fail to provide an
accurate taxpayer identification number or certification of exempt status or fail to comply with applicable certification requirements. Some
holders are not subject to backup withholding. You should consult your tax adviser about these rules and any other reporting obligations that
may apply to the ownership or disposition of ordinary shares or ADSs, including requirements related to the holding of certain “specified
foreign financial assets”.
DOCUMENTS ON DISPLAY
Sibanye-Stillwater will also file annual and special reports and other information with the SEC. You may read and copy any reports or other
information on file at the SEC’s public reference room at the following location:
100 F Street, N.E.
Washington, D.C. 20549
Please call the SEC at 1-800-SEC-0330 for further information on the public reference room. The SEC filings are also available to the public
from commercial document retrieval services. Sibanye-Stillwater’s SEC filings may also be obtained electronically via the EDGAR system on
the website maintained by the SEC at http://www.sec.gov.
The above information may also be obtained at the registered office of Sibanye-Stillwater and on its website accessible at http://
www.sibanyestillwater.com/news-investors/reports/annual.
REFINING AND MARKETING
Sibanye-Stillwater has appointed Rand Refinery Proprietary Limited (Rand Refinery) to refine all of Sibanye-Stillwater’s South African-
produced gold. Rand Refinery is a private company in which Sibanye-Stillwater together with its subsidiary DRDGOLD Limited holds an
effective 44.4% interest, with the remaining interests held by other South African gold producers. Sibanye-Stillwater’s treasury department
then sells the gold at a price benchmarked against the London morning or afternoon price fixing. Two business days after the sale of gold,
Sibanye-Stillwater receives a payment in US dollars equal to the value of the gold as calculated at the price set by the London price fixing at
the time of the sale. Rand Refinery then invoices Sibanye-Stillwater for the refining charges. For details on the transactions and balances
between Sibanye-Stillwater and Rand Refinery for the fiscal years ended 31 December 2025, 2024 and 2023, see – Annual Financial Report –
Consolidated financial statements – Notes to the consolidated financial statements – Note 37 Related-party transactions. For the period
between 1 January 2026 and 31 March 2026, the following are the transactions and balances between Sibanye-Stillwater and Rand
Refinery: Sibanye-Stillwater did not receive any dividends or interest income, Sibanye-Stillwater had R406 million sales of gold and Sibanye-
Stillwater incurred R9 million in refining fees. As of 31 March 2026, Sibanye-Stillwater had R7 million of trade payables relating to Rand
Refinery. Rand Refinery is accredited by the London Bullion Market Association (LBMA) and maintains Good Delivery status.
Sibanye-Stillwater’s US PGM operations and Columbus recycling business make use of a single company for all of its precious metals refining
services, and all of the US PGM operations’ current mined palladium and platinum is committed for sale to such company.
This significant concentration of business with a single company could leave the US PGM operations without precious metal refining services
should such company experience significant financial or operating difficulties during the contract period. Under such circumstances, it is not
clear that sufficient alternative processing capacity would be available to cover the US PGM operations’ requirements, nor that the terms of
any such alternate processing arrangements as might be available would be financially acceptable to the US PGM operations. See – Risk
Factors – Risks related to Earnings Delivery – For its PGMs mined in the United States, Sibanye-Stillwater’s tolling and sales arrangement
concentrate all its final refining activity and all PGM sales from mine production with one entity.
Sibanye-Stillwater, through its wholly owned recycling operations at the Pennsylvania site and North Carolina site, processes and refines a
range of precious metal recovered primarily from industrial manufacturing waste streams, post-consumer electronics, automotive scrap and
jewelry.
Materials are processed and refined across a broad spectrum of purity levels, ranging from low-grade e-scrap shred with minimal precious
metal content to high-grade ingots reaching up to 99.9% purity. Our outputs include powders and sweeps. In addition, we produce copper-
based ingots that range from trace precious metal content to high-purity compositions. These materials are then directed to a diverse
network of downstream partners, with routing determined by product form, purity, and overall metal composition.
While the disclosure of refining partners for recycled gold is voluntary, Sibanye-Stillwater is committed to transparency. During 2025, Sibanye-
Stillwater’s Pennsylvania site and North Carolina site worked with a number of third-party refiners for gold refining, all of whom maintain Good
Delivery status with the LBMA or are accredited by the London Platinum and Palladium Market (LPPM) or are recognised members of the
Responsible Minerals Initiative (RMI).
Concentrate from the Platinum mile PGM operation is purchased by Valterra Platinum. 4E PGMs from the Rustenburg operations (and from
the Kroondal operations with effect from 1 September 2024) are toll refined by Valterra Platinum and returned to Sibanye-Stillwater in
concentrate form for sale. Refined PGMs are sold by Sibanye-Stillwater directly to customers (4E from Rustenburg and 6E from Marikana),
with International Commercial Terms (Incoterms) varying based on specific customer requirements. Payments are primarily received in US
dollars, and payment terms vary depending on the nature of the sale and a customer’s credit rating and range from pre-payment up to four
days from delivery.
Zinc concentrate from Century is sold either through traders or directly to smelters in Australia, South Korea and China, following which it is
treated into a refined 99.995% zinc metal. Refined zinc metal is then sold by third parties to end users. The main sources of demand for zinc
are for use as a coating to protect iron and steel from corrosion (galvanised metal), as alloying metal to make bronze and brass, as zinc-
based die casting alloy and as rolled zinc.
JSE CORPORATE GOVERNANCE PRACTICES COMPARED WITH NYSE LISTING STANDARDS
As a foreign private issuer with shares listed on the NYSE, Sibanye-Stillwater is subject to certain corporate governance requirements imposed
by the NYSE. Under section 303A.11 of the NYSE Listing Standards, a foreign private issuer such as Sibanye-Stillwater may follow its home
country corporate governance practices in lieu of certain of the NYSE Listing Standards on corporate governance. Sibanye-Stillwater’s home
country corporate governance practices are regulated by the JSE Listings Requirements. The following is a summary of the significant ways
in which South Africa’s corporate governance standards and Sibanye-Stillwater’s corporate governance practices differ from those followed
by domestic companies under the NYSE Listing Standards.
The NYSE Listing Standards require that the non-management directors of US-listed companies meet at regularly scheduled executive
sessions without management. The JSE Listings Requirements do not require such meetings of listed company non-executive directors.
Sibanye-Stillwater’s non-management directors meet regularly without management.
The NYSE Listing Standards require US-listed companies to have a nominating/corporate governance committee composed entirely of
independent directors. The JSE Listings Requirements do not require the appointment of such a committee. Sibanye-Stillwater has a
Nominating and Governance Committee, which currently comprises six non-executive directors, three of whom are independent under the
JSE Listings Requirements and NYSE Listing Standards. The Nominating and Governance Committee is chaired by the Chairman of the
Sibanye-Stillwater Board.
The NYSE Listing Standards require US-listed companies to have a compensation committee composed entirely of independent directors.
The JSE Listings Requirements require compliance with the King IV Governance Code, which states that the remuneration committee should
comprise solely of non-executive members, with the majority of such members being independent. Sibanye-Stillwater has appointed a
Remuneration Committee, currently comprised of seven Board members, five of whom are independent under the King IV Governance
Code and JSE Listings Requirements.
The NYSE Listings Standards require US-listed companies to have an audit committee composed entirely of independent directors. The
Companies Act requires that the Audit Committee members be approved by shareholders on an annual basis at a company’s annual
general meeting. The Companies Act and the JSE Listings Requirements also require an audit committee composed entirely of independent
directors. Sibanye-Stillwater has appointed an Audit Committee, currently comprised of five Board members, all of whom are independent
non-executive directors, as defined under the Companies Act, the JSE Listings Requirements and the NYSE Listing Standards.
The Companies Act and the JSE Listings Requirements require the appointment of a Social and Ethics Committee. Sibanye-Stillwater has
appointed a Social Ethics and Sustainability Committee, currently comprised of ten Board members, six of whom are independent non-
executive directors under the JSE Listings Requirements.
Sibanye-Stillwater Information and Securities Transactions Policy
Sibanye-Stillwater has adopted the Sibanye-Stillwater Information and Securities Transactions Policy which sets out requirements in relation to
dealings in Sibanye-Stillwater securities by directors, prescribed officers, employees and contractors of the Sibanye-Stillwater Group and
anyone else acting on Sibanye-Stillwater's behalf in any jurisdiction. The Information and Securities Transactions Policy is designed to ensure
compliance with applicable insider trading and market abuse regulations, including the JSE Listings Requirements.
Cybersecurity
Cyber response strategy
Following the cyber-attack detected in July 2024, the Group enhanced its cyber response strategy which was presented to the Audit
Committee, showcasing the Group’s defences against cyber threats. This strategy reflects a proactive approach to safeguarding our digital
infrastructure. Recognising the ever-evolving nature of cybersecurity challenges, our strategy incorporates robust measures to detect,
respond to, and where required disclose cyber incidents.
The Group's cybersecurity strategy and approach includes:
•Mitigation of risks and vulnerabilities through performance of risk assessments to identify and assess potential cyber risks. The cyber
and IT risks is incorporated into the Group’s strategic risk register which forms part of the Group’s risk management process
•Ensuring standards and compliance through development and implementation of comprehensive Information Security
Management System policies such as the Information and Communication Technology (ICT) Code of conduct, Information
security, Vulnerability, Backup and ICT disaster recovery policies, in alignment to international standards on ICT security
•Responding to cybersecurity incidents through Intrusion detection and prevention by implementation of industry best practice
technologies to protect our network Fostering a cyber awareness culture through conducting security awareness training by
continuously educating and creating awareness amongst users with an equal responsibility with respect to cybersecurity
•Defense-in-depth security through regular backup of critical data and testing restoration
•To protect against cyber threats, the Group employs various layers of security protection which includes the human layer,
perimeter, network, endpoint, application and data security layers to protect mission critical assets
•The Group follows a business impact assessment process (BIA) to ensure that ICT has visibility of business critical systems which are
supported by ICT
Cybersecurity response plan
The Group’s cybersecurity response plan is defined in three steps which includes internal control, external reliance, and increased audit
frequency.
Cyber breach incident response and process
The Group’s cybersecurity response plan is defined in three steps which includes internal control, external reliance, and increased audit
frequency.
To assist with any cyber breach incidents Sibanye-Stillwater has engaged the services of an external consultant for an on-demand cyber
incident response service providing technical support and expertise when required. This external consultant is experienced in incident
investigation, response, containment and has access to world-leading incident response support. Sibanye-Stillwater has incorporated terms
and conditions around privacy, confidentiality, security, integrity and availability of information into the agreements of third parties. All third
parties are notified of their responsibility to report any security incidents to the Sibanye-Stillwater relationship manager. The relationship
manager will then follow the internal incident and response procedure.
The cyber breach internal response process comprises the following:
Assess and contain
•Triage by performing an internal impact assessment and categorisation. Based on the severity and complexity, the external
contracted security company might be contacted
•Contacting key individuals including but not limited to the CFO, VP Group ICT and management from the affected business area
head of department (HOD) and notifying the Group’s insurer
•Core response process triggered through confirmation of alert level and incident categorisation
Core response
•Incident management team oversee, communicate and engage support
•Capture and analyse data using the contracted external security consultant
•Assess materiality of the of the cyber breach and potential impact with limited stakeholders and disclosure counsel
•If the breach is determined to be material an assessment is then escalated to an extended team
•The extended team includes VP Group ICT, Manager ICT: Infrastructure, Unit Manager Security, Manager ICT: Information
Management, Senior Manager SOX Ethics and Policies, Compliance Manager, Manager Financial Reporting, Manager Risk and
Insurance, VP Protection Services, VP Investor Relations and other relevant party that can add value to the process to be
determined on a case by case basis
•A disclosure assessment is performed using evaluation criteria in line with Sibanye-Stillwater's regulatory requirements. Relevant
disclosures are prepared as required
•Review solution and remediation steps considering all potentially impacted areas
•Contain/mitigate the threat by remediation through fully removing or closing the incident and confirming successful remediation
or recover if required
Close out and review
•Close out and review the incident logged
•For each incident being closed out, we consider whether the cybersecurity incident has materially affected or is reasonably likely
to materially affect the business strategy, operations, or financial condition and update the risk assessment and strategic register
as required
Management oversight of cybersecurity risk and incidents
The Sibanye-Stillwater management team responsible for cybersecurity has extensive experience in all areas required to maintain an
effective and safe ICT landscape. ICT team members responsible continuously engage in seminars, security forums and security briefs to
ensure we remain up to date with industry developments. The VP group ICT reports the Cybersecurity strategy and posture directly to the
Audit Committee. Members of the ICT team have undergone formal training and certification of auditor on ISO27001:2013 with the 2022
version transition.
Management have created a cybersecurity strategy which involves leveraging several technologies, processes, skill sets, and risk mitigation
products to manage the cyber risk holistically. Preventative and detective security measures are in place to reduce the risk of an incident
occurring and causing business disruptions. Disaster recovery processes are in place and tested annually to ensure the continuity of business
systems.
Vulnerability assessments conducted by contracted specialised third parties provide Group ICT management with an independent view of
the capabilities to respond to an incident and whether the appropriate controls are in place to mitigate against offensive threats. Following
the assessment, the issues identified are tracked and remediated. Management then focuses on remediating the issues raised in the report.
The main focus is to ensure continuous improvement and preventing reoccurrence of the same incident in the environment. The results of
the independent assessments over the past financial periods have indicated a strong security posture.
Management reviews cyber risks in several forums as part of the Group ICT Risk Management process. Whilst the risk of a cybersecurity
incident event cannot be fully mitigated, Sibanye-Stillwater has taken further measures to receive technical, legal, and forensic support
should a significant incident occur.
Governance
The Board and Audit committee oversee the ICT governance in Sibanye-Stillwater. The Board and Audit Committee delegate responsibility
for the implementation of an ICT Governance framework to the Vice President Group ICT who is held accountable for the effectiveness of
the cybersecurity programme and strategy. The Audit committee is informed quarterly about any change in cybersecurity risks or upon
recognition of any material cybersecurity incident which may need to be reported.
Training
Sibanye-Stillwater launched a #CyberSafe platform, designed to instil a culture of cybersecurity awareness throughout the company. The
Group has also partnered with a global company called KnowBe4, the world’s largest integrated Security Awareness Training and Simulated
Phishing platform. Employee training in cybersecurity is compulsory, and the risk scores of employees is shared with their head of department
and team leaders. Sibanye-Stillwater has an incident response process in place should an employee notice any cybersecurity related
events.
Data classification and leakage prevention
The implementation of a content management platform (includes data classification and automated labelling) has achieved significant
milestones, including configuring the auto-labelling and classification functionalities for documents within the Group's environment.
Sibanye-Stillwater enlisted third-party experts to scan the Group's environment to gain insights into the various types of data present,
evaluate the application of data retention policies to documents, and pinpoint the location of personally identifiable information within the
environment. Sibanye-Stillwater analysed the findings and considered the Group's options for data loss prevention (DLP).
Sibanye-Stillwater is working to enhance the Group's DLP policies to adapt to evolving risks and emerging threats. Management believes
that these ongoing efforts, coupled with the utilisation of a robust content management features and the proactive strategies of data
classification and automated labelling, have led to improved content management efficiency, heightened data protection capabilities,
and increased adherence to data governance policies.
Cyberattack event
While there have been no material cybersecurity incidents that have affected Sibanye-Stillwater for the period covered by this annual
report, in July 2024, Sibanye-Stillwater experienced a cyberattack targeting its global ICT infrastructure. The Group experienced temporary
system outages, which resulted in the implementation of back-up manual processes on certain systems.
As a result, certain operations, including the Columbus metallurgical complex at the US PGM operations, experienced short-term operational
delays. As a result of the attack, an unauthorised party gained access to certain business information and personal information mainly
related to current and former employees. The Group provided notice to impacted individuals and to regulatory agencies as required by
applicable law, including U.S. federal and state law. Impacted individuals were offered complimentary credit monitoring and identity
restoration services.
No material losses were recognised in connection with the incident. Through proactive measures and a timely response by the ICT Security
team, with oversight and involvement from Sibanye-Stillwater’s Audit Committee and internal audit function, the Group mitigated the
immediate risks and took the opportunity to initiate long-term enhancements in its cybersecurity posture. While the Group continues to
monitor the impact of this incident, including other potential liabilities and pending class action litigation, Sibanye-Stillwater does not
currently believe this incident or the pending litigation will have a material adverse effect on our business, operations, or financial results.
In Sibanye-Stillwater's ongoing efforts to strengthen and enhance our cybersecurity maturity, the Group maintained its ISO 27001
accreditation for its South Africa region and successfully transitioned to the 2022 version of the standard. The Group's strategy includes
expanding its ISO 27001 accreditation to additional regions. Furthermore, Sibanye-Stillwater has been proactive in data management, data
classification, and preparing for potential threats across all regions. Sibanye-Stillwater has procured tools for personal information
identification and managed threat hunting, enhancing the Group's ability to detect and mitigate threats.
Sibanye-Stillwater continues to focus on employee cybersecurity training. An increased awareness of cybersecurity among employees is
reflected in improved metrics on security awareness and phishing susceptibility across our operations. In September 2024, the Group
conducted a SAPA (Security Awareness Proficiency Assessment), a tool provided by KnowBe4 to measure an organisation's security
awareness proficiency, which revealed a significant improvement across all seven categories when comparing the initial assessment
conducted in October 2023.
This positive shift highlights the impact of Sibanye-Stillwater's CyberSafe programme in raising cyber awareness within the organisation,
around threats, such as phishing, social engineering, and malware. Post-incident, several strategic interventions were undertaken to further
bolster security defences and address vulnerabilities exposed during the attack.
ITEM 15: CONTROLS AND PROCEDURES
(a) Evaluation of Disclosure Controls and Procedures
Sibanye-Stillwater has carried out an evaluation, under the supervision and with the participation of management, including the CEO and
CFO of Sibanye-Stillwater, of the effectiveness of the design and operation of Sibanye-Stillwater’s disclosure controls and procedures (as
defined in Exchange Act Rule 13a - 15(e)) as of the end of the period covered by this annual report.
The term “disclosure controls and procedures”, as defined in Rules 13a-15(e) and 15d-15(e) under the Exchange Act, means controls and
other procedures of a company that are designed to ensure that information required to be disclosed in the reports that it files or submits
under the Exchange Act are recorded, processed, summarised and reported, within the time periods specified in the SEC’s rules and forms.
Disclosure controls and procedures include, without limitation, controls and procedures designed to ensure that information required to be
disclosed by a company in the reports that it files or submits under the Exchange Act is accumulated and communicated to the company’s
management, including its principal executive officer and principal financial officer, as appropriate to allow timely decisions regarding
required disclosure. In designing and evaluating the disclosure controls and procedures, management recognises that any controls and
procedures, no matter how well designed and operated, can provide only reasonable assurance of achieving the desired control
objectives.
Based upon that evaluation, Sibanye-Stillwater’s CEO and CFO concluded that, as of 31 December 2025, Sibanye-Stillwater’s disclosure
controls and procedures were effective.
(b) Management’s Report on Internal Control over Financial Reporting
Sibanye-Stillwater’s management is responsible for establishing and maintaining adequate internal control over financial reporting. The
Exchange Act defines internal control over financial reporting in Rule 13a - 15(f) and 15d - 15(f) as a process designed by, or under the
supervision of, the company’s principal executive and principal financial officers and effected by the company’s board of directors,
management and other personnel, to provide reasonable assurance regarding the reliability of financial reporting and the preparation of
financial statements for external purposes in accordance with IFRS Accounting Standards, as issued by the IASB, and includes those policies
and procedures that:
•pertain to the maintenance of records that in reasonable detail accurately and fairly reflect the transactions and dispositions of
the assets of the company;
•provide reasonable assurance that transactions are recorded as necessary to permit preparation of financial statements in
accordance with IFRS Accounting Standards, as issued by the IASB, and that receipts and expenditures of the company are being
made only in accordance with authorisations of management and directors of the company; and
•provide reasonable assurance regarding prevention or timely detection of unauthorised acquisition, use or disposition of the
company’s assets that could have a material effect on the consolidated financial statements.
Because of its inherent limitations, internal control over financial reporting may not prevent or detect misstatements. Also, projections of any
evaluation of effectiveness to future periods are subject to risk that controls may become inadequate because of changes in conditions, or
that the degree of compliance with the policies or procedures may deteriorate.
Sibanye-Stillwater acquired Metallix Refining Inc. group of entities (Metallix) on 4 September 2025. Management has excluded from its
assessment of internal control over financial reporting as of 31 December 2025, Metallix’s internal control over financial reporting associated
with 1.38% of consolidated total assets and 1.28% and 7.05% of consolidated revenues and loss for the year, respectively, included in the
consolidated financial statements as of and for the year ended 31 December 2025. Sibanye-Stillwater’s management, under the supervision
and with the participation of its CEO and CFO, assessed the effectiveness of its internal control over financial reporting as of 31 December
2025. In making this assessment, Sibanye-Stillwater’s management used the criteria set forth in Internal Control - Integrated Framework (2013)
issued by the Committee of Sponsoring Organisations of the Treadway Commission (COSO). Based upon this assessment, and using those
criteria, Sibanye-Stillwater’s management has concluded that the Company’s internal control over financial reporting was effective as of 31
December 2025.
Remediation of previously reported material weaknesses
A material weakness is a deficiency, or a combination of deficiencies, in internal control over financial reporting, such that there is a
reasonable possibility that a material misstatement of the Company’s annual or interim financial statements will not be prevented or
detected on a timely basis.
Management concluded that material weaknesses existed as of 31 December, 2024 related to: (1) insufficient evidence of management
review and performance of control procedures, including the level of precision in the execution of controls and procedures to ascertain
completeness and accuracy of information produced by the company (IPC) over platinum group metals (“PGM”) inventory at Stillwater
Mining Company and certain inventory in process at Western Platinum Proprietary Limited; and (2) ineffective Information Technology
General Controls (“ITGC”) in respect of management of user access at the South African operations. These ITGC deficiencies specifically
related to:
•insufficient monitoring of user access controls that restrict user and privileged access to key Information Technology ("IT")
applications within the ERP system, business supporting systems and related data to appropriate company personnel.
•insufficient monitoring of access management to the Active Directory network layer that provides centralized authentication and
authorization of users to the environment.
Management remediated the material weaknesses reported in Sibanye-Stillwater’s annual report on Form 20-F for the fiscal year ended 31
December 2024:
•Management completed remediation efforts in respect of enhanced level of precision present in management review
documentation over platinum group metals inventory at Western Platinum Proprietary Limited and Stillwater Mining Company,
including the implementation of review procedures over information produced by the company (“IPC”) and enhanced stock
count procedures.
•Management also implemented and sufficiently completed its remediation over the design and execution of ITGC controls and
controls related to systems at the Southern African operations to restrict user access of employees whose employment is in process
of being terminated and privileged users, extension of Single Sign-On capabilities to employment termination dates, finalised and
enhanced the IT security model, improved IT governance and re-emphasised the importance of retaining sufficient documented
evidence of a high standard and quality to support conclusions of controls executed.
During 2025, the Company’s management also successfully completed the testing necessary to conclude that the controls in respect of the
above deficiencies were effectively designed and operating effectively. As a result of the successful implementation of the remediation
plans and the testing of the design and operating effectiveness of the newly designed and enhanced controls, the Company’s
management has concluded that the two material weaknesses have been remediated as of 31 December 2025.
(c) Attestation Report of the Registered Public Accounting Firm
The effectiveness of our internal control over financial reporting as of 31 December, 2025 has been audited by BDO South Africa Inc., an
independent registered public accounting firm as stated in its report which is included in the following pages of this annual report on Form
20-F.
See –Annual Financial Report – Report of independent registered public accounting firm
(d) Changes in Internal Control Over Financial Reporting
During 2025, we took substantial steps to improve our control environment by executing our remediation plan to address the previously
reported material weaknesses. Except as described above, there has been no changes in Sibanye-Stillwater's internal control over financial
reporting (as such term is defined in Rules 13a-15(f) and 15d-15(f) under the Exchange Act) that occurred during fiscal 2025 that has
materially affected, or is reasonably likely to materially affect, Sibanye-Stillwater's internal control over financial reporting.
EXHIBITS
The following instruments and documents are included as Exhibits to this annual report.
| | |
| | |
| | |
| | |
| | |
| | |
| | |
| | |
| | |
| | |
| | |
| | |
| | |
| | |
| | |
| | |
| | |
| | |
| | |
| | |
| | XBRL Taxonomy Extension Scheme Linkbase Document |
| | XBRL Taxonomy Extension Calculation Linkbase Document |
| | XBRL Taxonomy Extension Definition Linkbase Document |
| | XBRL Taxonomy Extension Label Linkbase Document |
| | XBRL Taxonomy Extension Presentation Linkbase Document |
† Confidential treatment has been requested over certain parts of this exhibit. Portions of this exhibit have been redacted in compliance
with Item 601(a)(6) and Item 601(b)(10) of Regulation S-K. Schedules have been omitted pursuant to Item 601(a)(5) of Regulation S-K. The
Company hereby undertakes to supplementally furnish copies of any omitted schedules to the SEC upon request.
SIGNATURES
The registrant hereby certifies that it meets all of the requirements for filing on Form 20-F and that it has duly caused and authorised the
undersigned to sign this annual report on its behalf.
| | | |
SIBANYE STILLWATER LIMITED | | |
| | |
| | |
| | | |
| | | |
| | | |