Pay vs Performance Disclosure - USD ($)
Dec. 31, 2024
Dec. 31, 2025
Jun. 30, 2024
Jun. 30, 2023
Jun. 30, 2022
Jun. 30, 2021
| Value of Initial Fixed $100 Investment Based on: | Company Selected Performance Measure | |||||||||||||||||||||||||||||||||||||||||||||||||
| Year | Summary Compensation Table Total for PEO ($)(1) | Compensation Actually Paid for PEO ($)(2) | Average Summary Compensation Table Total for Non-PEO NEOs ($)(3) | Average Compensation Actually Paid for Non-PEO NEOs ($)(4) | Total Shareholder Return ($)(5) | Peer Group Total Shareholder Return ($)(5)(6) | (GAAP) Net Income (Loss) ($000s)(7) | Adjusted Operating Income (Loss) ($000s)(8) | ||||||||||||||||||||||||||||||||||||||||||
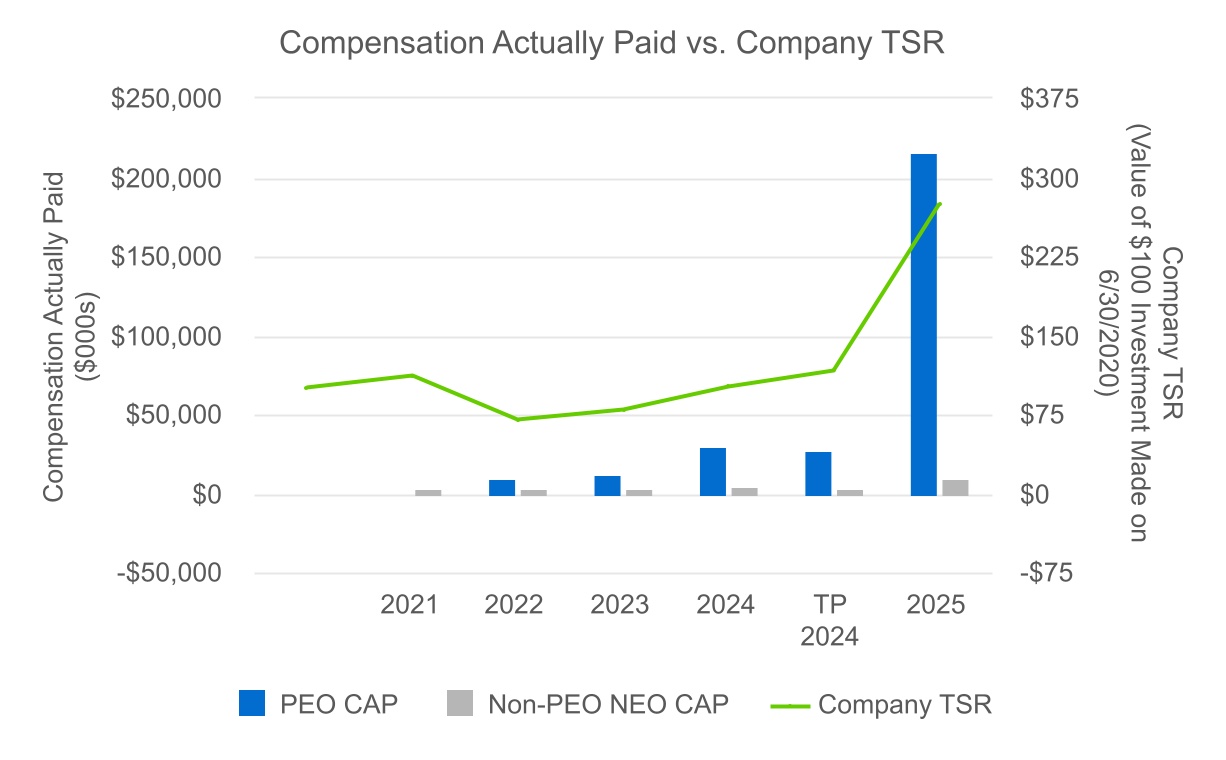
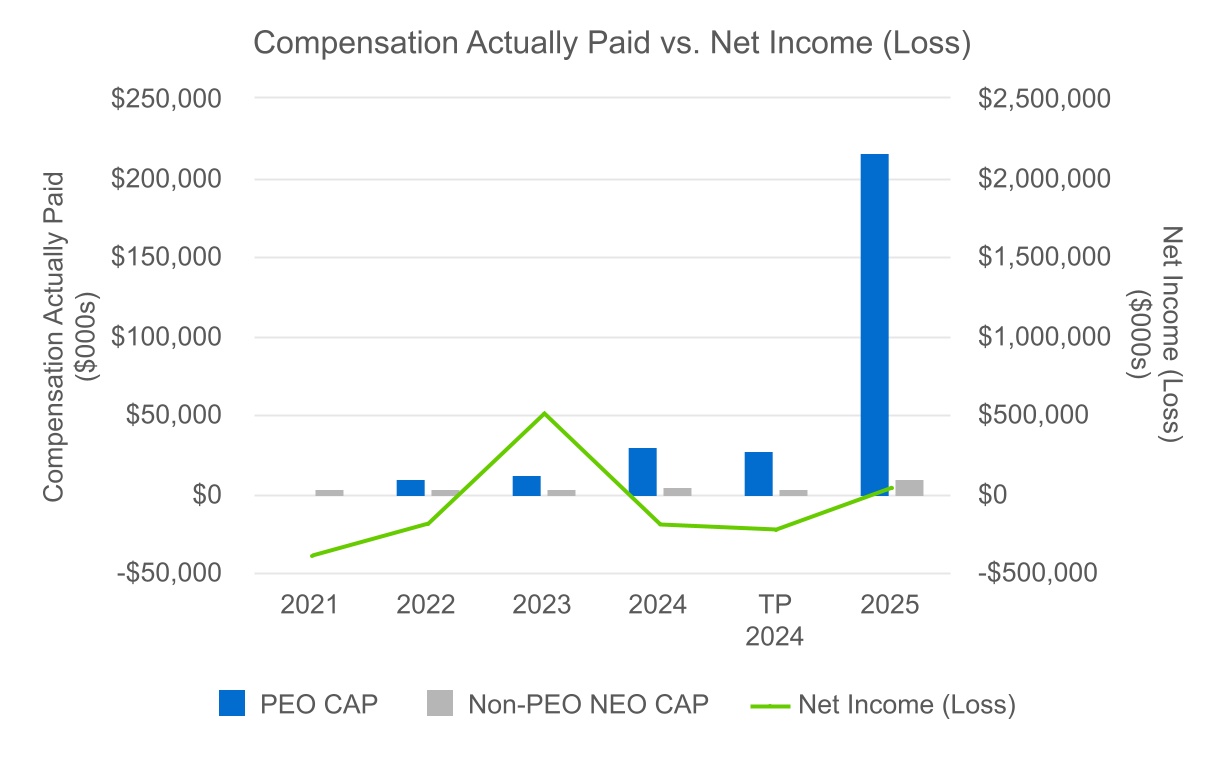
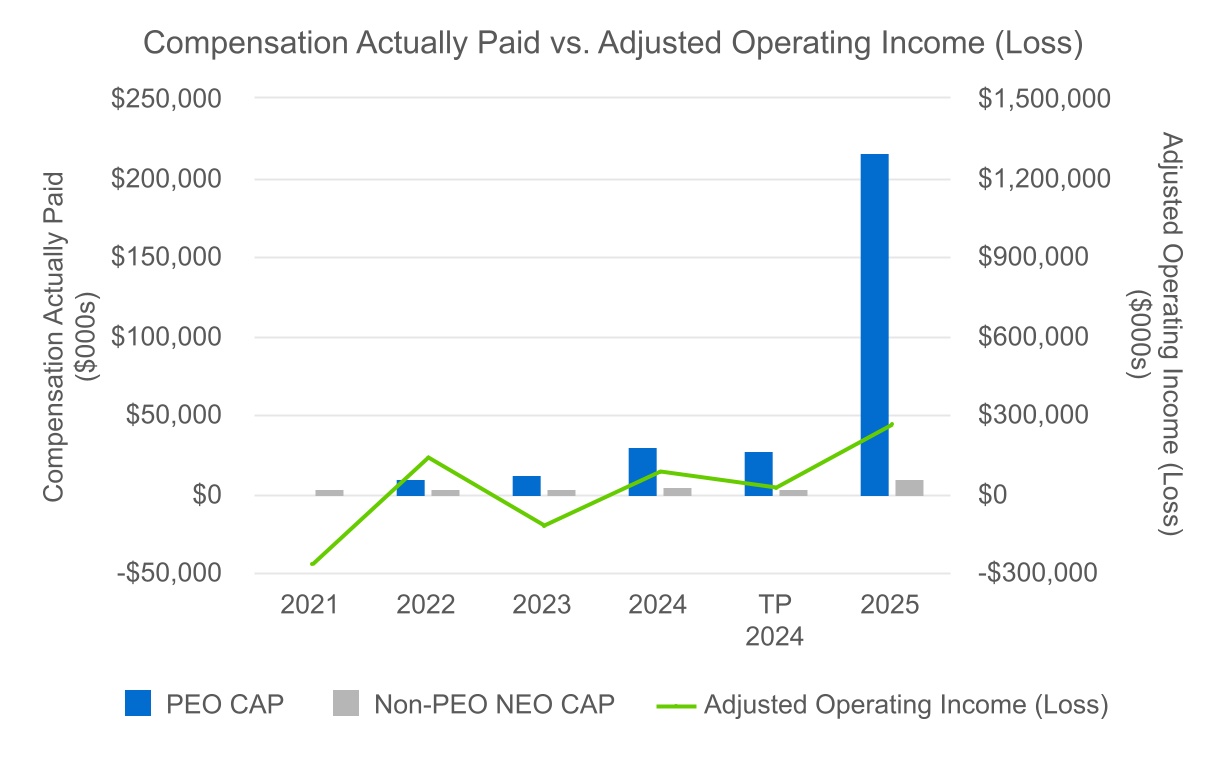
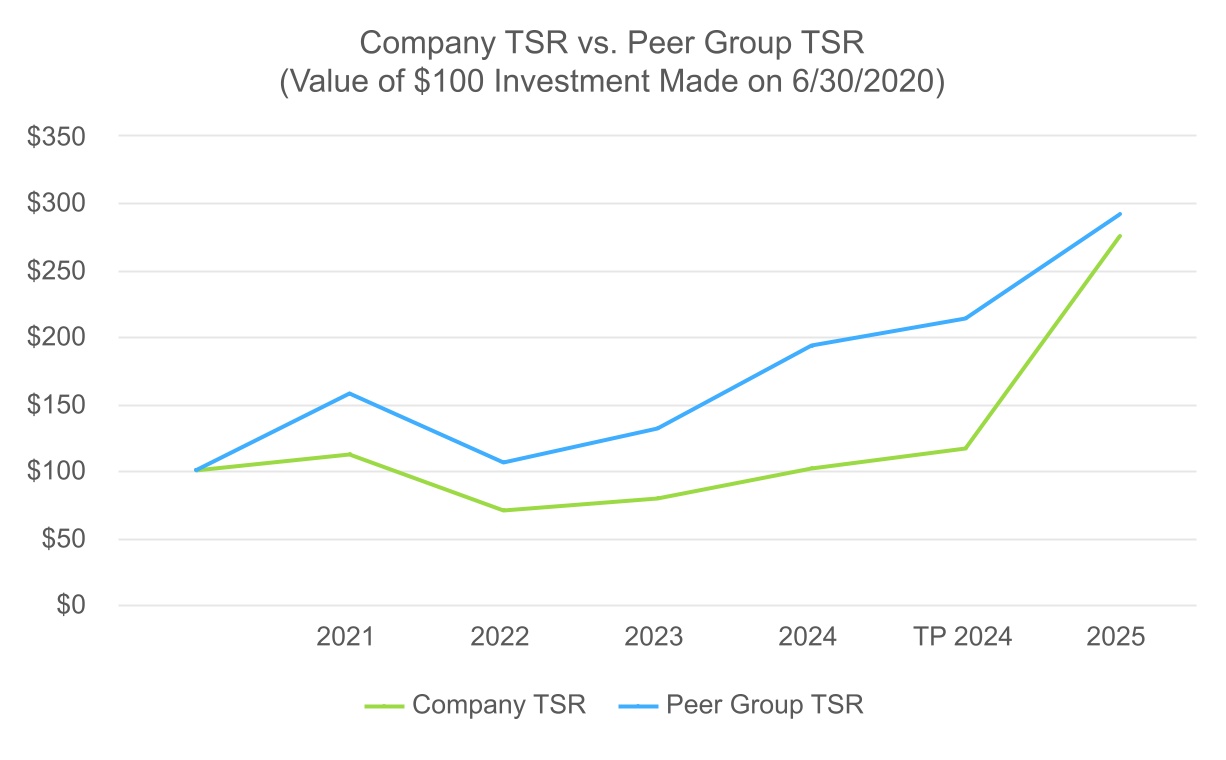
| 2025 | 14,284,275 | 215,581,326 | 4,734,461 | 9,617,714 | 274.58 | 291.10 | 33,405 | 261,824 | ||||||||||||||||||||||||||||||||||||||||||
| TP 2024 | 17,997,716 | 27,631,283 | 3,155,081 | 3,655,625 | 116.44 | 213.79 | (231,233) | 22,662 | ||||||||||||||||||||||||||||||||||||||||||
| 2024 | 27,441,193 | 29,168,063 | 4,625,124 | 4,492,350 | 101.25 | 193.67 | (200,649) | 80,731 | ||||||||||||||||||||||||||||||||||||||||||
| 2023 | 16,310,205 | 12,079,152 | 3,038,031 | 2,642,673 | 79.10 | 131.39 | 505,680 | (122,520) | ||||||||||||||||||||||||||||||||||||||||||
| 2022 | 19,243,679 | 9,274,510 | 3,756,214 | 2,727,399 | 70.16 | 105.96 | (190,147) | 133,555 | ||||||||||||||||||||||||||||||||||||||||||
| 2021 | 8,323,840 | (741,453) | 3,228,102 | 3,411,600 | 111.96 | 157.08 | (395,560) | (271,012) | ||||||||||||||||||||||||||||||||||||||||||
(3)The dollar amounts reported under “Average Summary Compensation Total for Non-PEO NEOs” represent the average of the amounts reported for the Company’s NEOs as a group (excluding Mr. Dolan) in the “Total” column of the Summary Compensation Table in each applicable reporting period. The NEOs included for purposes of calculating the average amounts in each applicable reporting period are as follows: (i) for 2025, Robert Langer, Jennifer Koester, David Granville-Smith, Christopher Winters, Andrea Greenberg, Laura Franco and Gregory Brunner; (ii) for the 2024 Transition Period, Jennifer Koester, Andrea Greenberg, David Granville-Smith, Gregory Brunner and David F. Byrnes; (iii) for 2024, David F. Byrnes, Jennifer Koester, Andrea Greenberg, David Granville-Smith, Gregory Brunner, and Gautam Ranji; (iv) for 2023, Andrea Greenberg, David Granville-Smith, Gautam Ranji, Gregory Brunner, David F. Byrnes, Jamal H. Haughton, and Philip G. D’Ambrosio; (v) for 2022, Andrea Greenberg, David F. Byrnes, Jamal H. Haughton, Philip G. D’Ambrosio, Andrew Lustgarten, Mark H. FitzPatrick, and Scott S. Packman; and (vi) for 2021, Andrew Lustgarten, Mark H. FitzPatrick, Scott S. Packman, and Philip G. D’Ambrosio.
(6)As permitted by SEC rules, the peer group referenced for purposes of “Peer Group Total Shareholder Return” is the S&P 500 Media & Entertainment Index, which is the industry index reported in our Annual Report on Form 10-K in accordance with Regulation S-K Item 201(e). In prior years, we used the Bloomberg Americas Entertainment Index; however, that index was discontinued in 2025 by Bloomberg. Accordingly, we have used the S&P 500 Media & Entertainment Index as a replacement for the discontinued index and because the Bloomberg Americas Entertainment Index was discontinued, we are unable to compare our cumulative total return with that index.
| James L. Dolan | |||||||||||
| 2025 | |||||||||||
| Total Compensation as reported in Summary Compensation Table | 14,284,275 | ||||||||||
| Subtract change in pension value as reported in Summary Compensation Table | — | ||||||||||
| Add pension value attributable to covered reporting period’s service and any change in such value attributable to plan amendments made in covered reporting period | — | ||||||||||
| Subtract value of equity awards as reported in Summary Compensation Table | (13,027,275) | ||||||||||
| Add reporting period-end fair value of equity awards granted in covered reporting period that were unvested at end of covered reporting period | 60,215,259 | ||||||||||
| Add change in fair value from end of prior reporting period to vesting date for awards made in prior reporting periods that vested during covered reporting period | 3,166,503 | ||||||||||
| Add vesting date fair value of equity awards granted in covered reporting period that vested during covered reporting period | — | ||||||||||
Add change in fair value from end of prior reporting period to end of covered reporting period for awards granted in prior reporting periods that were unvested at end of covered reporting period(a) | 150,942,564 | ||||||||||
| Subtract fair value of awards forfeited in covered reporting period determined at end of prior reporting period | — | ||||||||||
| Add dividends or other earnings paid on stock or option awards in covered reporting period that are not otherwise included in total compensation for covered reporting period | — | ||||||||||
Compensation Actually Paid to PEO*(a) | 215,581,326 | ||||||||||
______________
* Note: Numbers in rows may not sum due to rounding.
(a)Includes change in fair value of Company awards granted prior to the MSGE Distribution.
| Non-PEO NEO Averages | ||||||||
| 2025 | ||||||||
| Total Compensation as reported in Summary Compensation Table | 4,734,461 | |||||||
| Subtract change in pension value as reported in Summary Compensation Table | (2,970) | |||||||
| Add pension value attributable to covered reporting period’s service and any change in such value attributable to plan amendments made in covered reporting period | — | |||||||
| Subtract value of equity awards as reported in Summary Compensation Table | (2,450,214) | |||||||
| Add reporting period-end fair value of equity awards granted in covered reporting period that were unvested at end of covered reporting period | 2,772,220 | |||||||
| Add change in fair value from end of prior reporting period to vesting date for awards made in prior reporting periods that vested during covered reporting period | 492,922 | |||||||
| Add vesting date fair value of equity awards granted in covered reporting period that vested during covered reporting period | 97,754 | |||||||
Add change in fair value from end of prior reporting period to end of covered reporting period for awards granted in prior reporting periods that were unvested at end of covered reporting period(a) | 4,404,735 | |||||||
| Subtract fair value of awards forfeited in covered reporting period determined at end of prior reporting period | (431,194) | |||||||
| Add dividends or other earnings paid on stock or option awards in covered reporting period that are not otherwise included in total compensation for covered reporting period | — | |||||||
Compensation Actually Paid to Non-PEO NEOs*(a) | 9,617,714 | |||||||
______________
* Note: Numbers in rows may not sum due to rounding.
(a)Includes change in fair value of Company awards granted prior to the MSGE Distribution.
•AOI; and
•Company business unit strategic objectives.
PAY VERSUS PERFORMANCE | ||
CAP represents an amount calculated in accordance with the SEC’s prescribed formula pursuant to Dodd-Frank and does not represent compensation actually paid to or earned by our NEOs in any reporting period. Neither the Compensation Committee nor the Company directly used this information when making compensation-related decisions for any reporting period. For further information concerning the Company’s variable pay-for-performance philosophy and how the Company aligns executive compensation with Company performance, refer to the “Compensation Discussion and Analysis” section of this proxy statement.
Cumulative Total Shareholder Return is calculated by dividing the sum of the cumulative amount of dividends for the measurement period, assuming dividend reinvestment, and the difference between the company’s share price at the end and the beginning of the measurement period by the company’s share price at the beginning of the measurement period.Reflects Net Income as reported in our Transition Report on Form 10-KT or Annual Report on Form 10-K for the relevant reporting period, as applicable. Net Income (Loss) Attributable to Sphere Stockholders was $33,405 in 2025, $(231,233) in the 2024 Transition Period, $(200,649) in fiscal year 2024, $502,772 in fiscal year 2023, $(194,395) in fiscal year 2022, and $(377,192) in fiscal year 2021. Financial Performance Measures
As described in greater detail in the “Compensation Discussion & Analysis” section of this proxy statement, our approach to executive compensation is designed to directly link pay to performance, recognize both corporate and individual performance, promote long-term stock ownership, attract, retain and motivate talented executives, and balance risk and reward while taking into consideration stakeholder feedback as well as market trends and practices. Analysis of the Information Presented in the Pay versus Performance Table
While we utilize several performance measures to align executive compensation with performance, all of those measures are not presented in the Pay versus Performance Table. Moreover, the Company generally seeks to incentivize long-term performance, and therefore does not specifically align the Company’s performance measures with CAP for a particular reporting period. In accordance with Item 402(v) of Regulation S-K, we are providing the following graphic descriptions of the relationships between information presented in the Pay versus Performance Table.