Pay vs Performance Disclosure
Dec. 31, 2025
USD ($)
Dec. 31, 2024
USD ($)
Dec. 31, 2023
USD ($)
Dec. 31, 2022
USD ($)
Dec. 31, 2021
USD ($)
Year | Summary Compensation Table Total for PEO ($) | Compensation Actually Paid to PEO ($) | Average Summary Compensation Table Total for Non-PEO NEOs ($) | Average Compensation Actually Paid to Non-PEO NEOs ($) | Value of Initial Fixed $100 Investment Based On: | Net Income (Loss) ($ in thousands) | Star Rating | |||||||||||||||||||||||||||||||||||||||||||
Total Shareholder Return ($) | Peer Group Total Shareholder Return ($) | |||||||||||||||||||||||||||||||||||||||||||||||||
(a) | (b)1 | (c)2 | (d)3 | (e)4 | (f)5 | (g)6 | (h)7 | (i)8 | ||||||||||||||||||||||||||||||||||||||||||
2025 | $ | 1,319,385 | $ | (3,076,416) | $ | 1,481,158 | $ | 289,564 | $ | 14.67 | $ | 95.91 | $ | (85,549) | 3.50 | |||||||||||||||||||||||||||||||||||
2024 | $ | 9,476,723 | $ | 23,936,110 | $ | 3,290,481 | $ | 7,351,147 | $ | 19.66 | $ | 78.23 | $ | (43,009) | 4.00 | |||||||||||||||||||||||||||||||||||
2023 | $ | 10,154,701 | $ | 10,673,790 | $ | 1,677,797 | $ | 1,836,836 | $ | 5.94 | $ | 78.90 | $ | (213,361) | 3.50 | |||||||||||||||||||||||||||||||||||
2022 | $ | — | $ | (39,375,427) | $ | 9,284,785 | $ | 2,340,139 | $ | 5.81 | $ | 74.06 | $ | (338,844) | 3.50 | |||||||||||||||||||||||||||||||||||
2021 | $ | 389,569,439 | $ | 62,373,190 | $ | 37,030,665 | $ | (16,627,248) | $ | 23.22 | $ | 93.07 | $ | (587,756) | 3.50 | |||||||||||||||||||||||||||||||||||
(1) The dollar amounts reported in column (b) are the amounts of total compensation reported for the PEO in the "Total Compensation" column of the Summary Compensation Table in each applicable year. The names of the PEOs in each applicable year are as follows:
(a) 2025, 2024 and 2023: Andrew Toy
(b) 2021 and 2022: Vivek Garipalli
(2) The dollar amounts reported in column (c) represent the CAP for the corresponding fiscal year. In accordance with the requirements of Item 402(v) of Regulation S-K, the adjustments described in the “Adjustments Table” below in Footnote 4 were made to Mr. Toy’s total compensation to determine the compensation actually paid. | ||||||||||||||
(3) The dollar amounts reported in column (d) represent the average of the amounts reported for the Non-PEO NEOs in the “Total” column of the Summary Compensation Table in each applicable year. The names of each of the Non-PEO NEOs included for purposes of calculating the average amounts in each applicable year are as follows: | ||||||||||||||
(a) 2025: Peter Kuipers, Jamie Reynoso, Conrad Wai, and Brady Priest | ||||||||||||||
(b) 2024: Peter Kuipers, Jamie Reynoso, Conrad Wai, Brady Priest, Scott Leffler, and Terry Ronan | ||||||||||||||
(c) 2023: Jamie Reynoso, Scott Leffler, Brady Priest, and Karen Soares | ||||||||||||||
(d) 2022: Mark Herbers, Andrew Toy, Scott Leffler, Joseph Martin, and Brady Priest | ||||||||||||||
(e) 2021: Mark Herbers, Andrew Toy, Jamie Reynoso, Prabhdeep Singh, and Joseph Wagner | ||||||||||||||
(4) The dollar amounts reported in column (e) represent the average CAP amount for the Non-PEO NEOs specified in Footnote 3, as computed in accordance with Item 402(v) of Regulation S-K. The adjustments made to the average total compensation for the Non-PEO NEOs for each year to determine the CAP amounts are described in the "Adjustments Table" below: | ||||||||||||||
(a) 2025, 2024 and 2023: Andrew Toy
(b) 2021 and 2022: Vivek Garipalli
(6) Peer group TSR is the value of $100 at the end of the measurement period assuming invested in the peer group index as of the beginning of the measurement period. The beginning of the measurement period for this purpose is assumed to be the date of the closing of the Business Combination (January 7, 2021). The peer group used for this purpose is the following published industry index: Nasdaq Health Care Index.
Adjustments Table | ||||||||
2025 | ||||||||
* | PEO | Average of Non-PEO NEOs | ||||||
Total Compensation from Summary Compensation Table | 1,319,385 | 1,481,158 | ||||||
Subtract: the amounts reported in the Summary Compensation Table in respect to all equity awards | — | (293,982) | ||||||
Add: the fair value of all equity awards granted during the year that were outstanding and unvested as of the end of the year, with the value calculated as of the end of year end | — | 191,905 | ||||||
Add: the positive or negative year-over-year change in fair value of all equity awards granted in prior years and remain outstanding and unvested as of the end of the year, with the value calculated as of year end | (3,984,386) | (1,326,996) | ||||||
Add: the positive or negative year-over-year change in fair value of all equity awards granted and vested during the year, with the final value calculated as of the vesting date | — | — | ||||||
Add: the positive or negative year-over-year change in fair value of all equity awards granted in prior years and that vested during the year, with the final value calculated as of the vesting date | (411,415) | 237,479 | ||||||
Subtract: the prior year’s year end value ascribed to any equity awards for which the vesting conditions were not met (and awards were therefore forfeited) as of the end of or during the year | — | — | ||||||
Compensation Actually Paid (CAP) | (3,076,416) | 289,564 | ||||||
*The Company does not sponsor or maintain a defined benefit pension plan, and no such benefits are provided to our NEOs; therefore, no adjustments have been made to the Summary Compensation Table totals for changes in pension values. | ||||||||
The valuation assumptions used to calculate the fair values were updated as of each measurement date and may differ from those disclosed as of the grant date: | ||||||||
a. For outstanding options, a Black Scholes model was used to calculate the fair value, with (i) expected term being calculated using the simplified method as of the grant date less elapsed time from the grant date to the valuation date, for options in-the-money on the valuation date, and at the midpoint of the vesting and contractual term, for options out-of-the-money on the valuation date; (ii) volatility being calculated using the same method as discussed in our Annual Report; (iii) risk-free rates based on the US Treasury Rate Yield Curve Rates, adjusted to approximate zero coupon yields using the “bootstrap” technique, as of the expected term calculated for each valuation date, and interpolated linearly; and (iv) dividend yield of 0% because the Company does not issue dividends, which is also consistent with the calculations discussed in the Annual Report. | ||||||||
b. For RSUs, the closing price of our Class A Common Stock on the valuation date was utilized. | ||||||||
c. For PRSUs for which the relevant performance period remains outstanding, a Monte Carlo model was used to simulate the Company stock prices in order to determine if the vesting condition is met. The model discounts the value of the PRSU at the assumed vesting date based on the risk-free rate. A similar methodology was used to determine the volatility, risk-free rate and dividend yield assumptions as those described for options above. | ||||||||
(5) Total shareholder return (“TSR”) is the value of $100 at the end of the measurement period assuming invested in our stock as of the beginning of the measurement period. The beginning of the measurement period for this purpose is assumed to be the date of the closing of the Business Combination (January 7, 2021). | ||||||||
(6) Peer group TSR is the value of $100 at the end of the measurement period assuming invested in the peer group index as of the beginning of the measurement period. The beginning of the measurement period for this purpose is assumed to be the date of the closing of the Business Combination (January 7, 2021). The peer group used for this purpose is the following published industry index: Nasdaq Health Care Index. | ||||||||
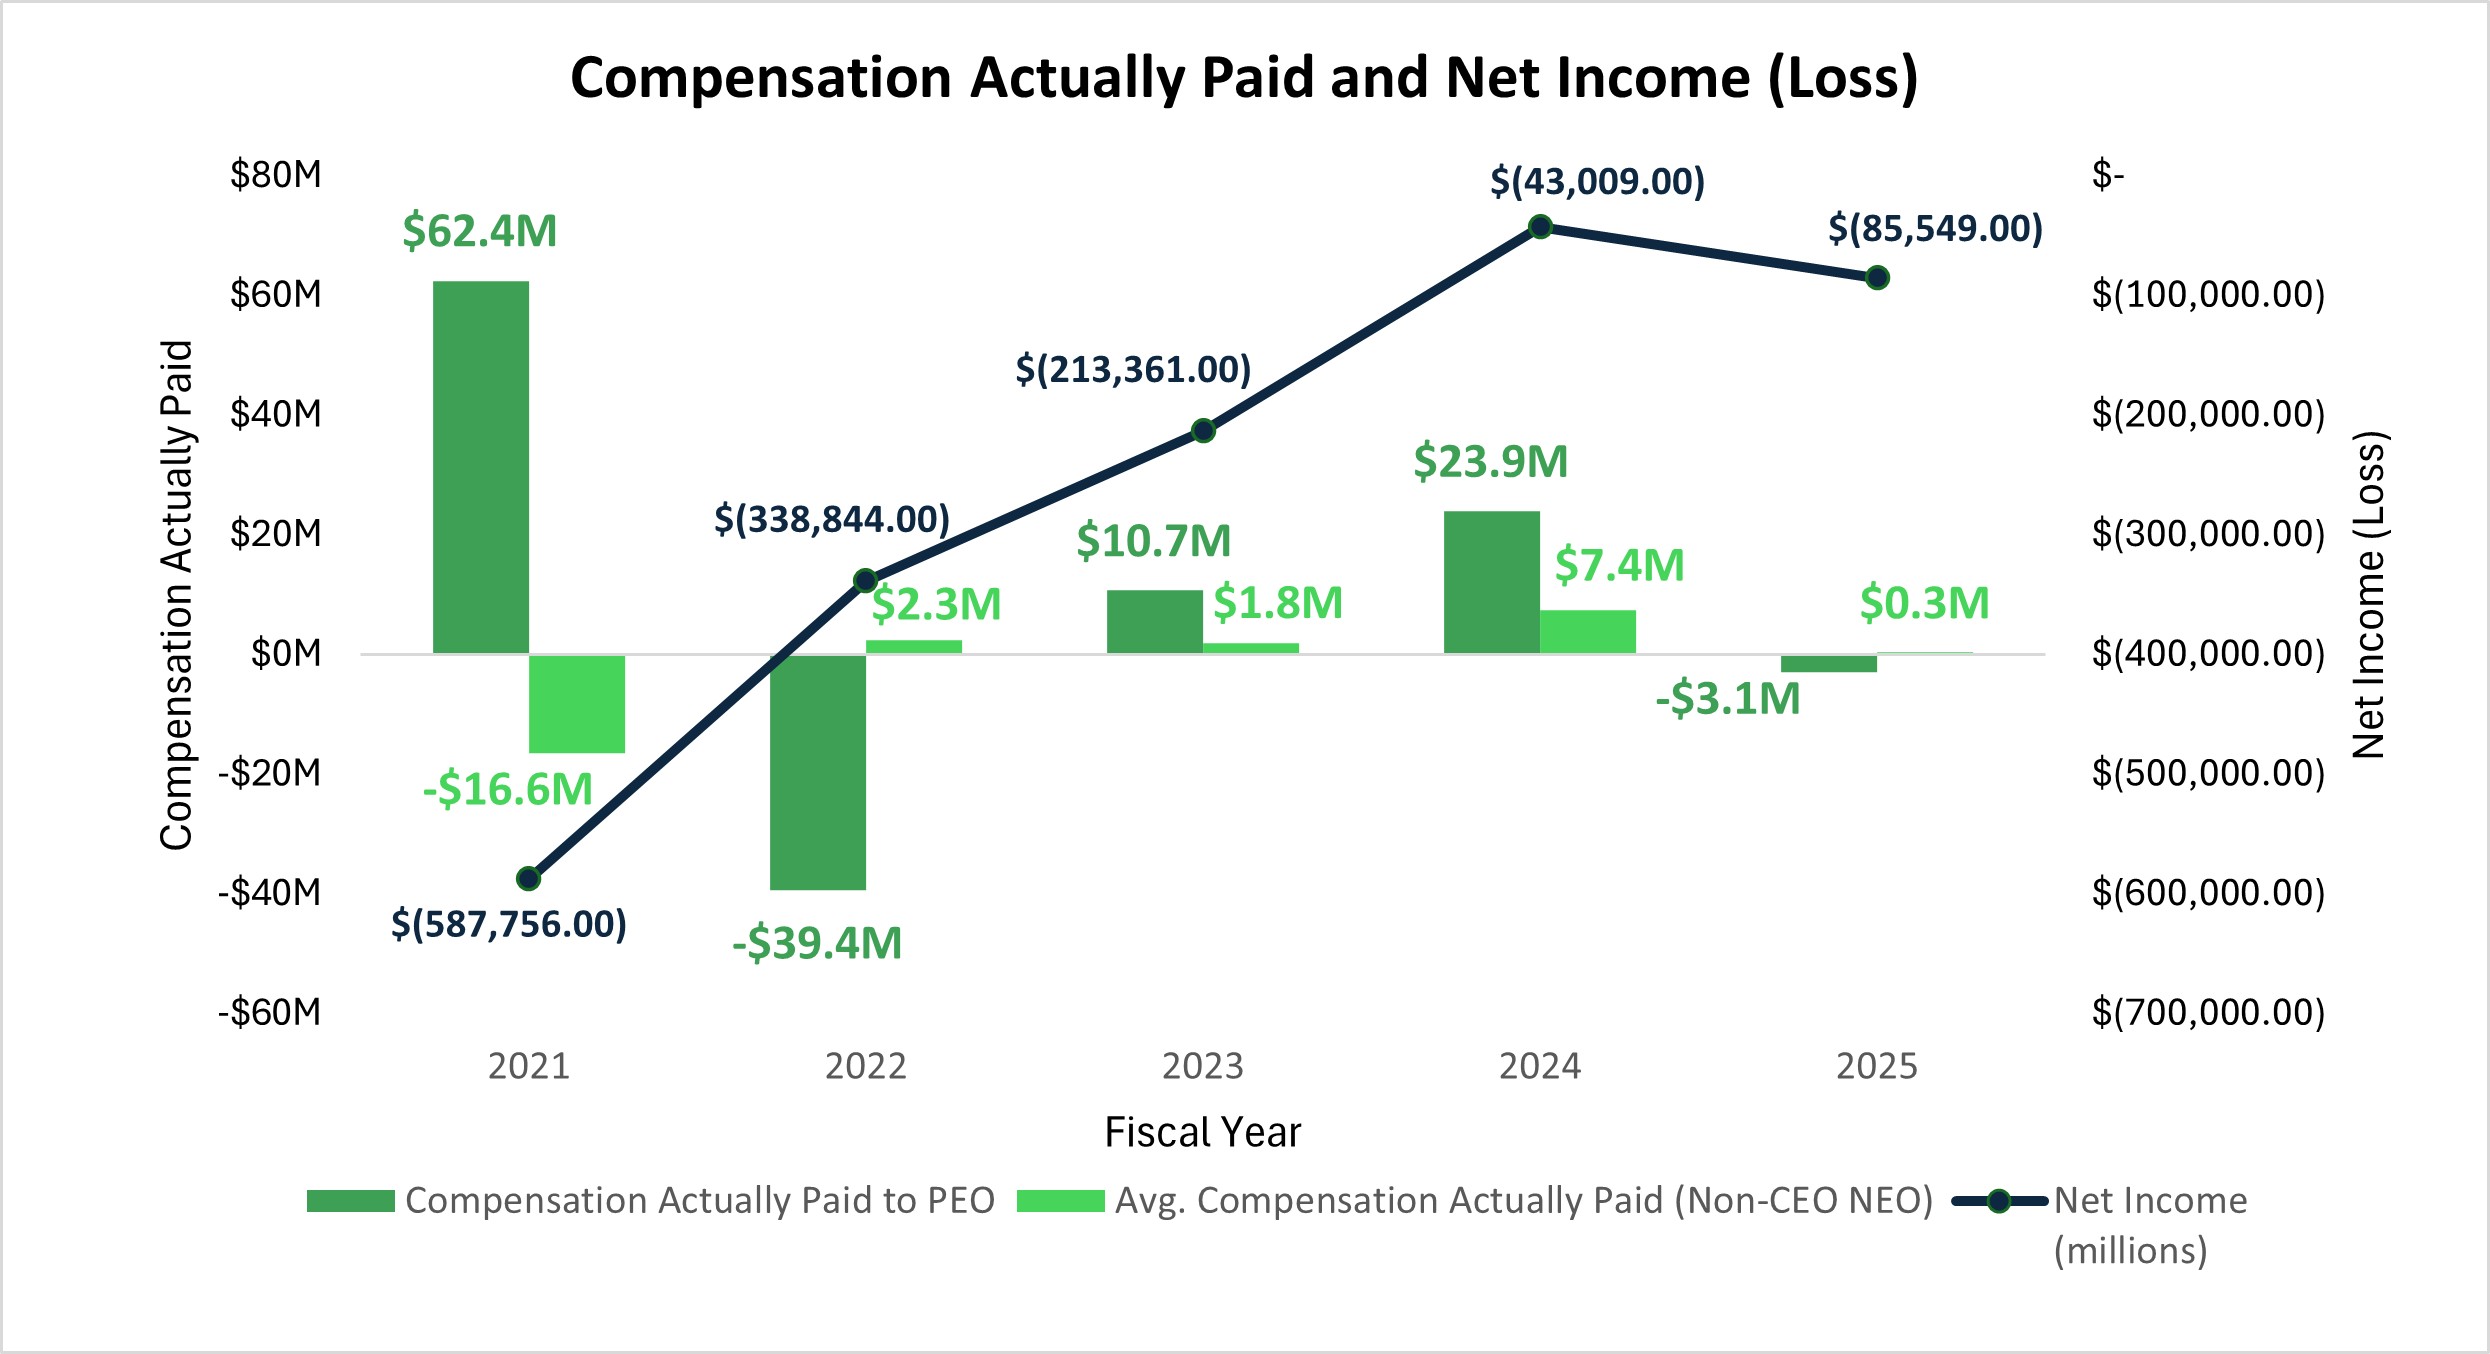
(7) The dollar amounts reported represent our net income (loss), as reflected in our audited financial statements for the applicable year. | ||||||||
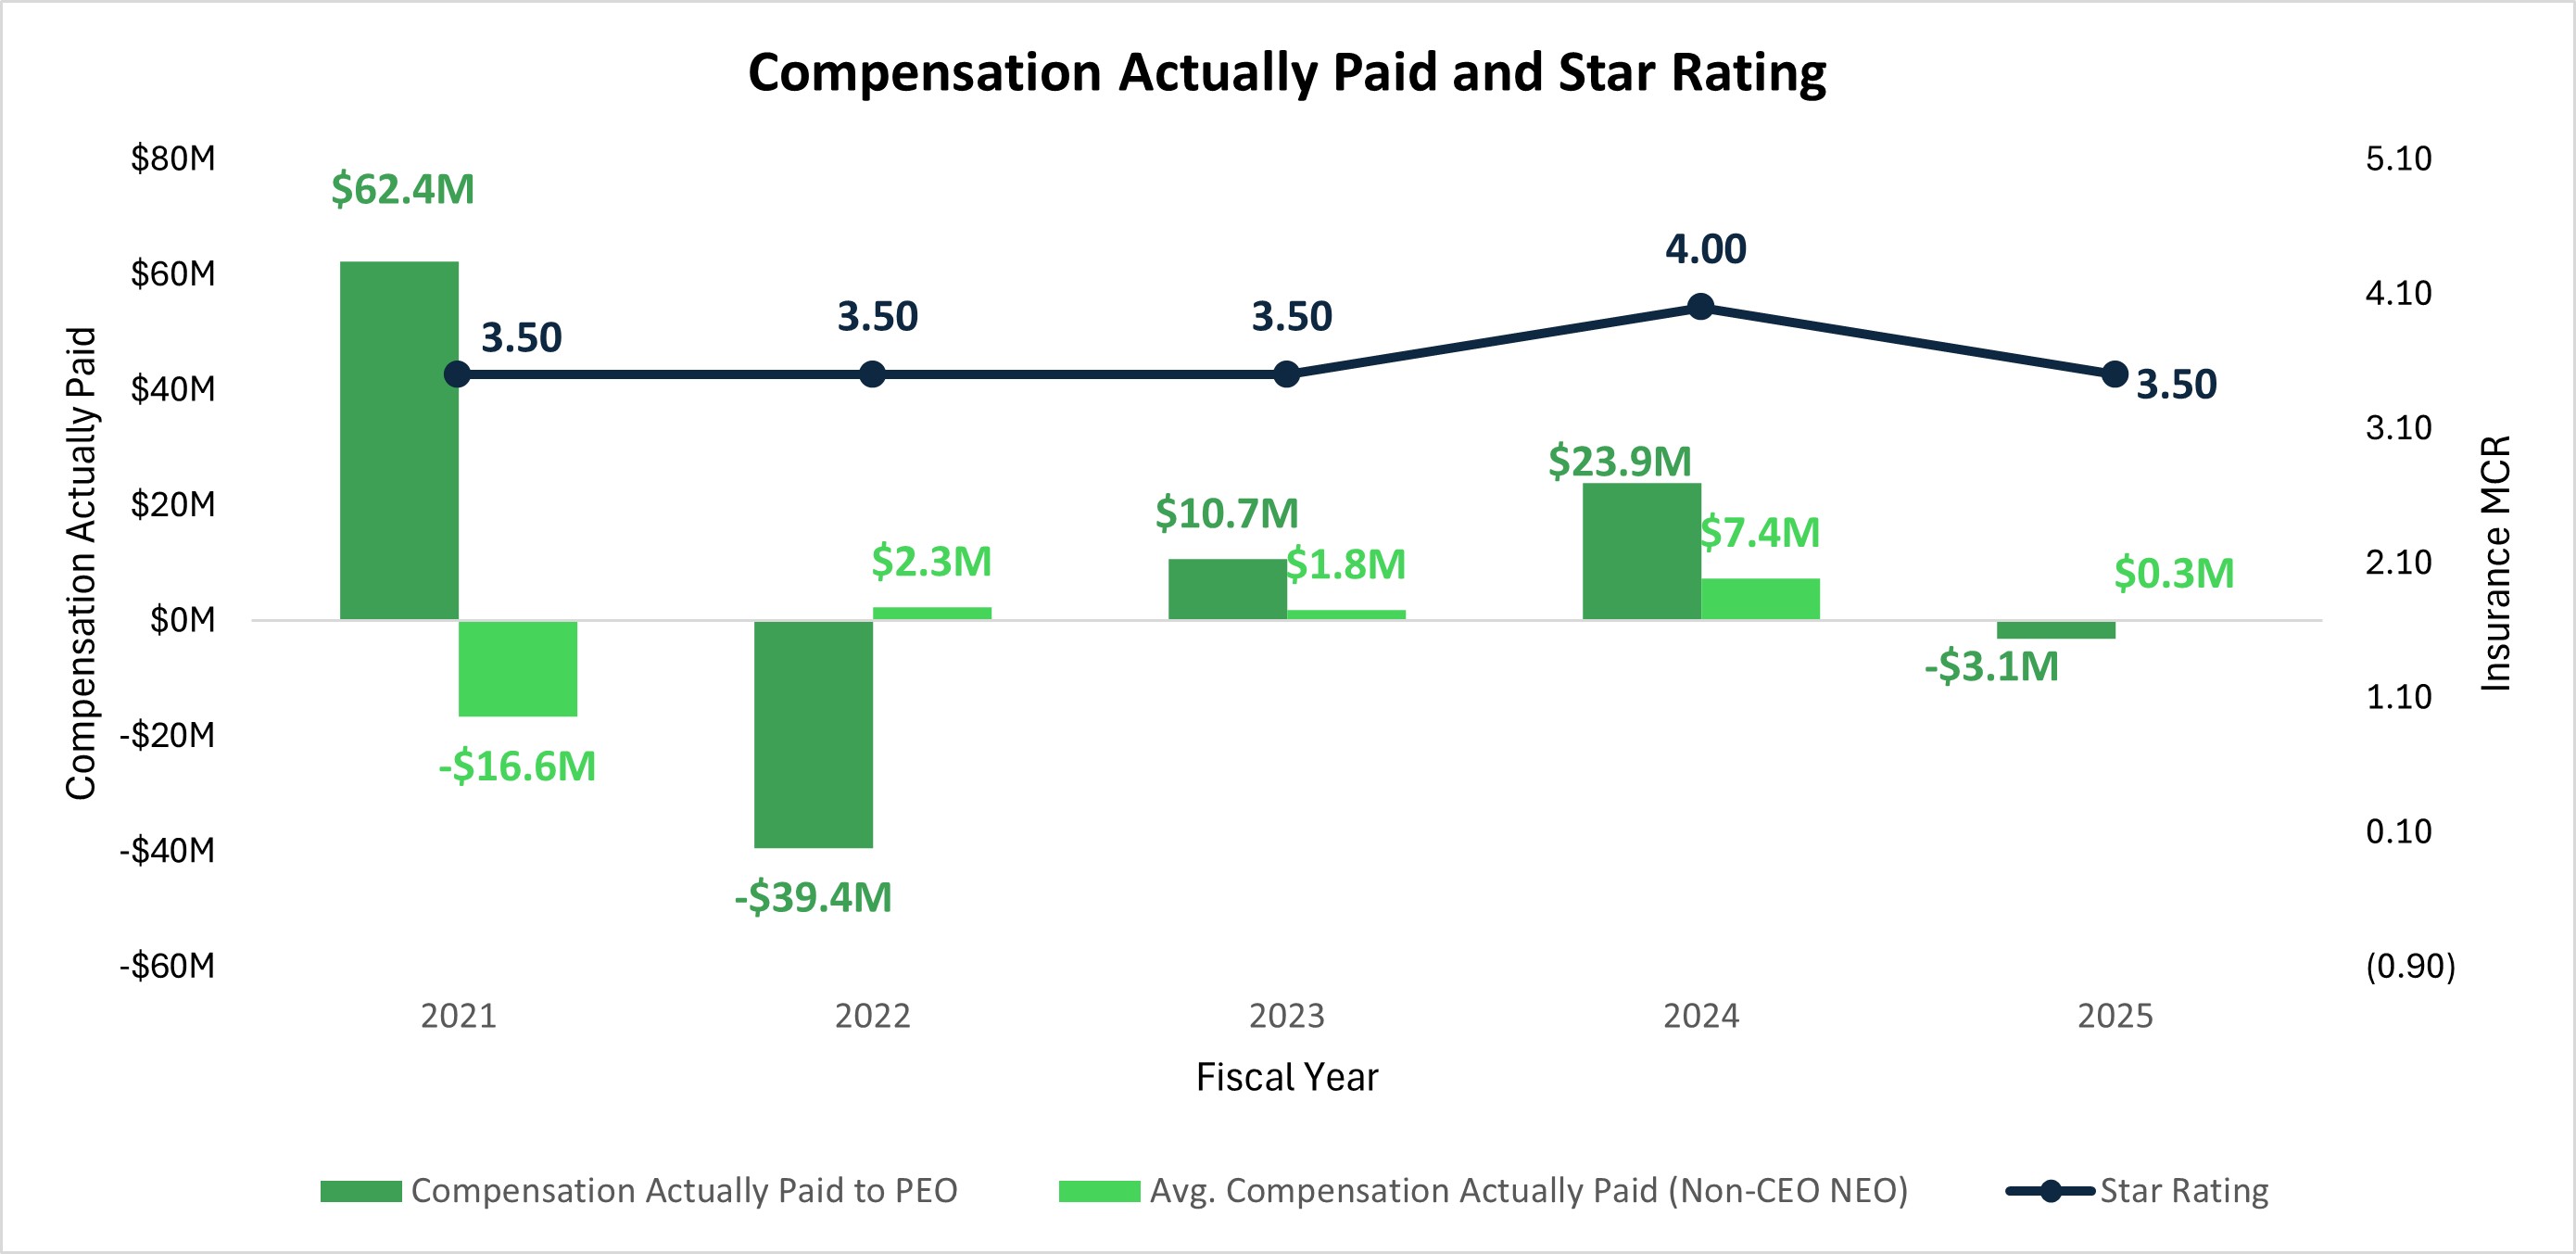
(8) In the Company's assessment, Star ratings are one of the most important business performance measures. In 2025, the Company used this metric to link compensation actually paid to performance. The Company measures its Star rating based on its H5141 contract, which currently serves over 95% of the Company's membership base. For compensation purposes, the Star rating for this contract is measured based on the year in which the rating is announced by CMS. | ||||||||
Adjustments Table | ||||||||
2025 | ||||||||
* | PEO | Average of Non-PEO NEOs | ||||||
Total Compensation from Summary Compensation Table | 1,319,385 | 1,481,158 | ||||||
Subtract: the amounts reported in the Summary Compensation Table in respect to all equity awards | — | (293,982) | ||||||
Add: the fair value of all equity awards granted during the year that were outstanding and unvested as of the end of the year, with the value calculated as of the end of year end | — | 191,905 | ||||||
Add: the positive or negative year-over-year change in fair value of all equity awards granted in prior years and remain outstanding and unvested as of the end of the year, with the value calculated as of year end | (3,984,386) | (1,326,996) | ||||||
Add: the positive or negative year-over-year change in fair value of all equity awards granted and vested during the year, with the final value calculated as of the vesting date | — | — | ||||||
Add: the positive or negative year-over-year change in fair value of all equity awards granted in prior years and that vested during the year, with the final value calculated as of the vesting date | (411,415) | 237,479 | ||||||
Subtract: the prior year’s year end value ascribed to any equity awards for which the vesting conditions were not met (and awards were therefore forfeited) as of the end of or during the year | — | — | ||||||
Compensation Actually Paid (CAP) | (3,076,416) | 289,564 | ||||||
*The Company does not sponsor or maintain a defined benefit pension plan, and no such benefits are provided to our NEOs; therefore, no adjustments have been made to the Summary Compensation Table totals for changes in pension values. | ||||||||
The valuation assumptions used to calculate the fair values were updated as of each measurement date and may differ from those disclosed as of the grant date: | ||||||||
a. For outstanding options, a Black Scholes model was used to calculate the fair value, with (i) expected term being calculated using the simplified method as of the grant date less elapsed time from the grant date to the valuation date, for options in-the-money on the valuation date, and at the midpoint of the vesting and contractual term, for options out-of-the-money on the valuation date; (ii) volatility being calculated using the same method as discussed in our Annual Report; (iii) risk-free rates based on the US Treasury Rate Yield Curve Rates, adjusted to approximate zero coupon yields using the “bootstrap” technique, as of the expected term calculated for each valuation date, and interpolated linearly; and (iv) dividend yield of 0% because the Company does not issue dividends, which is also consistent with the calculations discussed in the Annual Report. | ||||||||
b. For RSUs, the closing price of our Class A Common Stock on the valuation date was utilized. | ||||||||
c. For PRSUs for which the relevant performance period remains outstanding, a Monte Carlo model was used to simulate the Company stock prices in order to determine if the vesting condition is met. The model discounts the value of the PRSU at the assumed vesting date based on the risk-free rate. A similar methodology was used to determine the volatility, risk-free rate and dividend yield assumptions as those described for options above. | ||||||||
(5) Total shareholder return (“TSR”) is the value of $100 at the end of the measurement period assuming invested in our stock as of the beginning of the measurement period. The beginning of the measurement period for this purpose is assumed to be the date of the closing of the Business Combination (January 7, 2021). | ||||||||
(6) Peer group TSR is the value of $100 at the end of the measurement period assuming invested in the peer group index as of the beginning of the measurement period. The beginning of the measurement period for this purpose is assumed to be the date of the closing of the Business Combination (January 7, 2021). The peer group used for this purpose is the following published industry index: Nasdaq Health Care Index. | ||||||||
(7) The dollar amounts reported represent our net income (loss), as reflected in our audited financial statements for the applicable year. | ||||||||
(8) In the Company's assessment, Star ratings are one of the most important business performance measures. In 2025, the Company used this metric to link compensation actually paid to performance. The Company measures its Star rating based on its H5141 contract, which currently serves over 95% of the Company's membership base. For compensation purposes, the Star rating for this contract is measured based on the year in which the rating is announced by CMS. | ||||||||
Most Important Financial Performance Measures | ||
Total Revenue | ||
Adjusted EBITDA | ||
Stars Ratings | ||
(2) The dollar amounts reported in column (c) represent the CAP for the corresponding fiscal year. In accordance with the requirements of Item 402(v) of Regulation S-K, the adjustments described in the “Adjustments Table” below in Footnote 4 were made to Mr. Toy’s total compensation to determine the compensation actually paid.
(3) The dollar amounts reported in column (d) represent the average of the amounts reported for the Non-PEO NEOs in the “Total” column of the Summary Compensation Table in each applicable year. The names of each of the Non-PEO NEOs included for purposes of calculating the average amounts in each applicable year are as follows:
(a) 2025: Peter Kuipers, Jamie Reynoso, Conrad Wai, and Brady Priest
(b) 2024: Peter Kuipers, Jamie Reynoso, Conrad Wai, Brady Priest, Scott Leffler, and Terry Ronan
(c) 2023: Jamie Reynoso, Scott Leffler, Brady Priest, and Karen Soares
(d) 2022: Mark Herbers, Andrew Toy, Scott Leffler, Joseph Martin, and Brady Priest
(e) 2021: Mark Herbers, Andrew Toy, Jamie Reynoso, Prabhdeep Singh, and Joseph Wagner
(4) The dollar amounts reported in column (e) represent the average CAP amount for the Non-PEO NEOs specified in Footnote 3, as computed in accordance with Item 402(v) of Regulation S-K. The adjustments made to the average total compensation for the Non-PEO NEOs for each year to determine the CAP amounts are described in the "Adjustments Table" below:
*The Company does not sponsor or maintain a defined benefit pension plan, and no such benefits are provided to our NEOs; therefore, no adjustments have been made to the Summary Compensation Table totals for changes in pension values.
The valuation assumptions used to calculate the fair values were updated as of each measurement date and may differ from those disclosed as of the grant date:
a. For outstanding options, a Black Scholes model was used to calculate the fair value, with (i) expected term being calculated using the simplified method as of the grant date less elapsed time from the grant date to the valuation date, for options in-the-money on the valuation date, and at the midpoint of the vesting and contractual term, for options out-of-the-money on the valuation date; (ii) volatility being calculated using the same method as discussed in our Annual Report; (iii) risk-free rates based on the US Treasury Rate Yield Curve Rates, adjusted to approximate zero coupon yields using the “bootstrap” technique, as of the expected term calculated for each valuation date, and interpolated linearly; and (iv) dividend yield of 0% because the Company does not issue dividends, which is also consistent with the calculations discussed in the Annual Report.
b. For RSUs, the closing price of our Class A Common Stock on the valuation date was utilized.
c. For PRSUs for which the relevant performance period remains outstanding, a Monte Carlo model was used to simulate the Company stock prices in order to determine if the vesting condition is met. The model discounts the value of the PRSU at the assumed vesting date based on the risk-free rate. A similar methodology was used to determine the volatility, risk-free rate and dividend yield assumptions as those described for options above.
(5) Total shareholder return (“TSR”) is the value of $100 at the end of the measurement period assuming invested in our stock as of the beginning of the measurement period. The beginning of the measurement period for this purpose is assumed to be the date of the closing of the Business Combination (January 7, 2021).
(7) The dollar amounts reported represent our net income (loss), as reflected in our audited financial statements for the applicable year.
(8) In the Company's assessment, Star ratings are one of the most important business performance measures. In 2025, the Company used this metric to link compensation actually paid to performance. The Company measures its Star rating based on its H5141 contract, which currently serves over 95% of the Company's membership base. For compensation purposes, the Star rating for this contract is measured based on the year in which the rating is announced by CMS.
Financial Performance Measures
As described in greater detail in the section of this Proxy Statement titled "Compensation Discussion and Analysis," the Company’s executive compensation philosophy reflects a pay-for-performance culture. The metrics that the Company uses for its short-term and for certain long-term incentive awards were selected based on, among other things, an objective of providing meaningful incentives for our NEOs to create long-term value for Company stockholders. The Company's financial and business performance metrics used in our incentive compensation programs and described in the CD&A are underlying drivers of the Company financial metrics used in our Pay Versus Performance disclosure, as described below. The most important financial performance measures used by the Company to link executive compensation for the NEOs, for the most recently completed fiscal year, to the Company’s performance are set forth in the following table