Pay Versus Performance
The following table and accompanying discussion describe the relationship between Compensation Actually Paid (“CAP”) to our Principal Executive Officers (“PEOs”) and the average CAP to our Non-PEO Named Executive Officers (“Non-PEO NEOs”), and certain measures of Company performance for the fiscal years presented:
| Year | Summary Compensation Table Total for PEO(1) | Compensation Actually Paid to PEO(2) | Average Summary Compensation Table Total for Non-PEO NEO(1) | Average Compensation Actually Paid to Non-PEO NEO(3) | Value of Initial Fixed $100 Investment Based On Total Shareholder Return(4) | Net Loss(5) (in thousands) | ||||||||||||||||||
| 2025(1) | $ | 2,892,173 | $ | 2,892,067 | $ | 410,009 | $ | 410,003 | $ | 0.04 | $ | (397,082 | ) | |||||||||||
| 2024 | $ | 552,407 | $ | 554,466 | $ | 388,710 | $ | 391,493 | $ | 0.11 | $ | (355,847 | ) | |||||||||||
| 2023 | $ | 353,250 | $ | 353,250 | $ | 468,287 | $ | 468,295 | $ | 1.0 | $ | (431,695 | ) | |||||||||||
| 1. | The amounts reported in the “PEO SCT” column represent total compensation as reported in the Summary Compensation Table. For 2025, the Company had two Co-Principal Executive Officers, Global Co-Chief Executive Officer, Matthias Aydt, and Global Co-Chief Executive Officer, Yueting Jia (“Mr. Jia”), and the reported amount reflects the aggregate total compensation of both individuals. |
| 2. | Compensation Actually Paid (“CAP”) was calculated in accordance with Item 402(v) of Regulation S-K. Due to limited availability of detailed valuation inputs, the Company estimated the fair value of equity awards using year-end stock prices. This approach is intended to reasonably approximate the economic value of compensation actually received. |
| 3. | The amounts reported in the “Non-PEO SCT Avg” column presents: (i) for the fiscal year ended December 31, 2023, total compensation of Mr. Jia, who served as Chief Product and User Ecosystem Officer of the Company, Chui Tin Mok, who served as Global Executive Vice President and Global Head of User Ecosystem (“Mr. Mok”), Jonathan Maroko, who served as the Interim Chief Financial Officer of the Company starting from July 2023 until September 20, 2024 (“Mr. Maroko”); and Yun Han, who served as the Interim Chief Financial Officer of the Company until July 5, 2023; (ii) for the fiscal year ended December 31, 2024, total compensation of Mr. Mok, Mr. Maroko, Mr. Jia and Koti Meka (“Mr. Meka”), who has served as the Chief Financial Officer of the Company since September 23, 2024; and (iii) for the fiscal year ended December 31, 2025, total compensation of Mr. Mok, Mr. Meka, and Jiawei Wang, who has served as the Global President of the Company since March 24, 2025. |
| 4. | Total Shareholder Return (“TSR”) represents the value of a hypothetical $100 investment in the Company’s common stock over the measurement period. |
| 5. | Net Loss represents the Company’s net loss as reported in its consolidated financial statements, in thousands. |
| 2025 | 2024 | 2023 | ||||||||||||||||||||||||||
| Current PEO ($) | Non-PEO NEO ($) | PEO ($) | Non-PEO NEO ($) | PEO ($) | Non-PEO NEO ($) | |||||||||||||||||||||||
| Reported Summary Compensation Table | 2,892,173 | — | 410,009 | 552,407 | 388,710 | 353,250 | 468,287 | |||||||||||||||||||||
| Reported Grant Date Value of Equity Awards | 0 | — | (35,740 | ) | (112,212 | ) | 0 | (3,348 | ) | |||||||||||||||||||
| Year-End Fair Value of Equity Awards Granted During the Year | 0 | — | 354,075 | 55,324 | 0 | 3,356 | ||||||||||||||||||||||
| Change in Fair Value as of the Year-End for Unvested Equity Awards Granted in Prior Years | (106 | ) | — | (5.62 | ) | (442 | ) | (3,417 | ) | 0 | 0 | |||||||||||||||||
| Fair Value as of Vesting Date of Equity Awards Granted and Vested in the Year | 0 | — | 0 | 0 | 0 | 0 | 0 | |||||||||||||||||||||
| Change in Fair Value as of Vest Date for Equity Awards Granted in Prior Years that Vested in the Year | 0 | — | 0 | 38,242 | 118,412 | 0 | 0 | |||||||||||||||||||||
| Compensation Actually Paid | 2,892,067 | — | 410,003 | 554,466 | 391,493 | 353,250 | 468,295 | |||||||||||||||||||||
CAP for our PEO and Non-PEO NEOs reflects the impact of changes in the fair value of equity awards over time. In 2024, CAP declined significantly compared to reported compensation due to a substantial decrease in the Company’s stock price, which reduced the value of unvested equity awards. In 2025, CAP remained largely consistent with reported compensation, as most equity awards had vested in prior periods and there was minimal remaining unvested equity subject to revaluation.
The Company’s TSR declined significantly from 2023 to 2024 and continued to decrease in 2025. While CAP in 2024 reflects this decline in shareholder value through reductions in equity award valuations, CAP in 2025 does not directly track TSR due to the reduced role of equity-based compensation in that period.
The Company reported net losses in each of the years presented. CAP does not directly correlate with net loss, as compensation decisions are based on a broader set of factors, including operational execution and strategic development. The increase in net loss in 2025 did not result in a corresponding decrease in CAP, as compensation during that period was primarily cash-based.
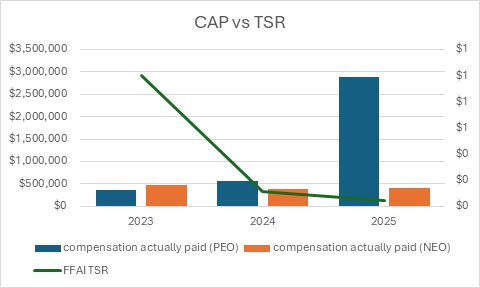
Compensation Actually Paid and Company TSR
From 2023 to 2024, TSR declined significantly, which corresponded with a reduction in CAP due to the decrease in the fair value of unvested equity awards. This demonstrates that CAP was sensitive to changes in stock price during periods when equity compensation remained outstanding.
From 2024 to 2025, TSR continued to decline; however, CAP remained relatively stable. This is because the majority of equity awards had vested by the end of 2024, resulting in minimal remaining unvested equity subject to revaluation. As a result, CAP in 2025 primarily reflects cash-based compensation rather than changes in stock price.
Accordingly, while CAP reflected shareholder value changes in 2024, the relationship between CAP and TSR was less direct in 2025.
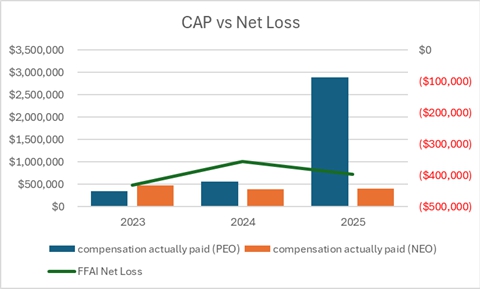
Compensation Actually Paid and Net Loss
The Company reported net losses in each of the years presented, with net loss improving from $(431.7) million in 2023 to $(355.8) million in 2024, followed by a deterioration to $(397.1) million in 2025.
From 2023 to 2024, net loss decreased; however, Compensation Actually Paid (“CAP”) to the PEO increased, while CAP to Non-PEO NEOs decreased. This mixed movement indicates that changes in CAP were not directly aligned with improvements in operating performance and were influenced by factors such as compensation structure and equity-related adjustments.
From 2024 to 2025, net loss increased again, while CAP to the PEO increased significantly and CAP to Non-PEO NEOs remained relatively stable. The substantial increase in PEO CAP during 2025, despite worsening financial performance, suggests that compensation outcomes were driven primarily by elements such as cash compensation, bonus decisions, or vesting of prior equity awards, rather than short-term financial results.
Accordingly, there is no consistent or direct relationship between CAP and net loss across the periods presented, as executive compensation reflects a combination of retention, contractual arrangements, and long-term incentive considerations rather than year-over-year changes in net loss.
| [1] | The amounts reported in the “PEO SCT” column represent total compensation as reported in the Summary Compensation Table. For 2025, the Company had two Co-Principal Executive Officers, Global Co-Chief Executive Officer, Matthias Aydt, and Global Co-Chief Executive Officer, Yueting Jia (“Mr. Jia”), and the reported amount reflects the aggregate total compensation of both individuals. | |||||||||||||||||||||||||||||||||||||||||||||||||||||||||||||||||||||||||||||||||||||||||||||||||||||||||||||||||||||||||||||||||||||||||||||||||||||||||||||||||||||||||||||||||||||||||||||||||||||||||||||||||||||||||||||||||||||||||||||||||||||||||||||||||||||
| [2] | Compensation Actually Paid (“CAP”) was calculated in accordance with Item 402(v) of Regulation S-K. Due to limited availability of detailed valuation inputs, the Company estimated the fair value of equity awards using year-end stock prices. This approach is intended to reasonably approximate the economic value of compensation actually received. | |||||||||||||||||||||||||||||||||||||||||||||||||||||||||||||||||||||||||||||||||||||||||||||||||||||||||||||||||||||||||||||||||||||||||||||||||||||||||||||||||||||||||||||||||||||||||||||||||||||||||||||||||||||||||||||||||||||||||||||||||||||||||||||||||||||
| [3] | The amounts reported in the “Non-PEO SCT Avg” column presents: (i) for the fiscal year ended December 31, 2023, total compensation of Mr. Jia, who served as Chief Product and User Ecosystem Officer of the Company, Chui Tin Mok, who served as Global Executive Vice President and Global Head of User Ecosystem (“Mr. Mok”), Jonathan Maroko, who served as the Interim Chief Financial Officer of the Company starting from July 2023 until September 20, 2024 (“Mr. Maroko”); and Yun Han, who served as the Interim Chief Financial Officer of the Company until July 5, 2023; (ii) for the fiscal year ended December 31, 2024, total compensation of Mr. Mok, Mr. Maroko, Mr. Jia and Koti Meka (“Mr. Meka”), who has served as the Chief Financial Officer of the Company since September 23, 2024; and (iii) for the fiscal year ended December 31, 2025, total compensation of Mr. Mok, Mr. Meka, and Jiawei Wang, who has served as the Global President of the Company since March 24, 2025. | |||||||||||||||||||||||||||||||||||||||||||||||||||||||||||||||||||||||||||||||||||||||||||||||||||||||||||||||||||||||||||||||||||||||||||||||||||||||||||||||||||||||||||||||||||||||||||||||||||||||||||||||||||||||||||||||||||||||||||||||||||||||||||||||||||||
| [4] | Total Shareholder Return (“TSR”) represents the value of a hypothetical $100 investment in the Company’s common stock over the measurement period. | |||||||||||||||||||||||||||||||||||||||||||||||||||||||||||||||||||||||||||||||||||||||||||||||||||||||||||||||||||||||||||||||||||||||||||||||||||||||||||||||||||||||||||||||||||||||||||||||||||||||||||||||||||||||||||||||||||||||||||||||||||||||||||||||||||||
| [5] | Net Loss represents the Company’s net loss as reported in its consolidated financial statements,
in thousands.
CAP for our PEO and Non-PEO NEOs reflects the impact of changes in the fair value of equity awards over time. In 2024, CAP declined significantly compared to reported compensation due to a substantial decrease in the Company’s stock price, which reduced the value of unvested equity awards. In 2025, CAP remained largely consistent with reported compensation, as most equity awards had vested in prior periods and there was minimal remaining unvested equity subject to revaluation. The Company’s TSR declined significantly from 2023 to 2024 and continued to decrease in 2025. While CAP in 2024 reflects this decline in shareholder value through reductions in equity award valuations, CAP in 2025 does not directly track TSR due to the reduced role of equity-based compensation in that period. The Company reported net losses in each of the years presented. CAP does not directly correlate with net loss, as compensation decisions are based on a broader set of factors, including operational execution and strategic development. The increase in net loss in 2025 did not result in a corresponding decrease in CAP, as compensation during that period was primarily cash-based. |
|||||||||||||||||||||||||||||||||||||||||||||||||||||||||||||||||||||||||||||||||||||||||||||||||||||||||||||||||||||||||||||||||||||||||||||||||||||||||||||||||||||||||||||||||||||||||||||||||||||||||||||||||||||||||||||||||||||||||||||||||||||||||||||||||||||