Pay vs Performance Disclosure - USD ($)
Dec. 31, 2025
Dec. 31, 2024
Dec. 31, 2023
PAY VERSUS PERFORMANCE
As required by Item 402(v) of Regulation S-K, we are providing the following information about the relationship between “compensation actually paid” to our named executive officers (“NEOs”), including our principal executive officer (“PEO”) and certain financial performance of the Company. As we are a “smaller reporting company,” as defined under Item 10(f)(1) of Regulation S-K, we are providing information relating only to fiscal years 2025, 2024 and 2023.
Year (a) | Summary Compensation Table Total for PEO(1) ($) (b) | Compensation Actually Paid to PEO(2) ($) (c) | Average Summary Compensation Table Total for Non-PEO NEOs(3) ($) (d) | Average Compensation Actually Paid to Non-PEO NEOs(4) ($) (e) | Value of Initial Fixed $100 Investment Based On: | Net Income (thousands)(6) ($) (h) | ||||||||||||
Total Shareholder Return(5) ($) (f) | ||||||||||||||||||
2025 | 4,222,265 | 9,637,099 | 2,009,530 | 3,596,263 | 44.35 | (274,448) | ||||||||||||
2024 | 1,495,376 | (3,237,463) | 1,606,237 | 72,810 | 18.44 | (342,994) | ||||||||||||
2023 | 2,647,476 | (7,936,183) | 3,210,333 | 1,129,554 | 55.91 | (234,632) | ||||||||||||
(1) | The dollar amounts reported in column (b) are the amounts of total compensation reported for Lynn Seely, M.D., our President and Chief Executive Officer, for all three years reported in the “Total” column of the Summary Compensation Table. Refer to “Executive Compensation—Summary Compensation Table.” |
(2) | The dollar amounts reported in column (c) represent the amounts of “compensation actually paid” to Dr. Seely, as computed in accordance with Item 402(v) of Regulation S-K. The dollar amounts do not reflect the actual amount of compensation earned by or paid to Dr. Seely during the applicable year. In accordance with the requirements of Item 402(v) of Regulation S-K, the following adjustments were made to Dr. Seely’s total compensation for each year to determine the compensation actually paid: |
Year | Reported Summary Compensation Table Total for PEO ($) | Reported Value of Equity Awards for PEO (a) ($) | Equity Award Adjustments for PEO (b) ($) | Compensation Actually Paid to PEO ($) | ||||||||
2025 | 4,222,265 | 3,094,357 | 8,509,191 | 9,637,099 | ||||||||
2024 | 1,495,376 | 474,000 | (4,258,839) | (3,237,463) | ||||||||
2023 | 2,647,476 | 1,685,250 | (8,898,409) | (7,936,183) | ||||||||
(a) | The grant date fair value of equity awards represents the total of the amounts reported in the “Stock Awards” and “Option Awards” columns in the Summary Compensation Table for the applicable year. |
(b) | The equity award adjustments for each applicable year include the addition (or subtraction, as applicable) of the following: (i) the year-end fair value of any equity awards granted in the applicable year that are outstanding and unvested as of the end of the year; (ii) the amount of change as of the end of the applicable year (from the end of the prior fiscal year) in fair value of any awards granted in prior years that are outstanding and unvested as of the end of the applicable year; (iii) for awards that are granted and vest in the same applicable year, the fair value as of the vesting date; (iv) for awards granted in prior years that vest in the applicable year, the amount equal to the change as of the vesting date (from the end of the prior fiscal year) in fair value; (v) for awards granted in prior years that are determined to fail to meet the applicable vesting conditions during the applicable year, the amount equal to the fair value at the end of the prior fiscal year; and (vi) the dollar value of any dividends or other earnings paid on stock or option awards in the applicable year prior to the vesting date that are not otherwise reflected in the fair value of such award or included in any other component of total compensation for the applicable year. The valuation assumptions used to calculate fair values did not materially differ from those disclosed at the time of grant. The amounts deducted or added in calculating the equity award adjustments are as follows: |
Year | Year End Fair Value of Equity Awards for PEO ($) | Change in Fair Value of Outstanding and Unvested Equity Awards for PEO ($) | Fair Value as of Vesting Date of Equity Awards Granted and Vested in the Year for PEO ($) | Change in Fair Value of Equity Awards Granted in Prior Years that Vested in the Year for PEO ($) | Fair Value at the End of the Prior Year of Equity Awards that Failed to Meet Vesting Conditions in the Year for PEO ($) | Total Equity Award Adjustments for PEO ($) | ||||||||||||
2025 | 5,950,339 | 2,447,420 | 179,712 | (42,400) | (25,880) | 8,509,191 | ||||||||||||
2024 | 585,540 | (4,464,450) | — | (379,929) | — | (4,258,839) | ||||||||||||
2023 | — | (7,001,445) | — | (1,896,964) | — | (8,898,409) | ||||||||||||
(3) | The dollar amounts reported in column (d) represent the average of the amounts reported for the NEOs as a group (excluding our PEO) in the “Total” column of the Summary Compensation Table in each applicable year. The NEOs (excluding our PEO) included for purposes of calculating the average amounts in each applicable year are as follows: (i) for 2025, Stephen Hill and Gary Lee, Ph.D.; (i) for 2024, Stephen Hill and Matthew Lang (our former Chief Business Officer); and (ii) for 2023, Charles Newton (our former Chief Financial Officer), Stephen Hill, Matthew Lang, Gary Lee, Ph.D. and Tina Albertson, M.D., Ph.D. |
(4) | The dollar amounts reported in column (e) represent the average amount of “compensation actually paid” to the NEOs as a group (excluding our PEO), as computed in accordance with Item 402(v) of Regulation S-K. The dollar amounts do not reflect the actual average amount of compensation earned by or paid to the NEOs as a group (excluding our PEO) during the applicable year. In accordance with the requirements of Item 402(v) of Regulation S-K, the following adjustments were made to average total compensation for the NEOs as a group (excluding our PEO) for each year to determine the compensation actually paid, using the same methodology described above in Note (2)(b): |
Year | Average Reported Summary Compensation Table Total for Non-PEO NEOs ($) | Average Reported Value of Equity Awards ($) | Average Equity Award Adjustments(a) ($) | Average Compensation Actually Paid to Non- PEO NEOs ($) | ||||||||
2025 | 2,009,530 | 1,200,846 | 2,787,579 | 3,596,263 | ||||||||
2024 | 1,606,237 | 666,450 | (866,977) | 72,810 | ||||||||
2023 | 3,210,333 | 2,410,690 | 329,911 | 1,129,554 | ||||||||
(a) | The amounts deducted or added in calculating the total average equity award adjustments are as follows: |
Year | Average Year End Fair Value of Equity Awards ($) | Average Change in Fair Value of Outstanding and Unvested Equity Awards ($) | Average Fair Value as of Vesting Date of Equity Awards Granted and Vested in the Year ($) | Average Change in Fair Value of Equity Awards Granted in Prior Years that Vested in the Year ($) | Average Fair Value at the End of the Prior Year of Equity Awards that Failed to Meet Vesting Conditions in the Year ($) | Total Average Equity Award Adjustments ($) | ||||||||||||
2025 | 2,255,953 | 478,251 | 59,925 | (1,374) | (5,176) | 2,787,579 | ||||||||||||
2024 | 281,657 | (1,076,339) | 87,042 | (159,337) | — | (866,977) | ||||||||||||
2023 | 1,043,424 | (536,147) | 172,101 | (106,207) | (243,260) | 329,911 | ||||||||||||
(5) | For the relevant fiscal year, represents the cumulative total stockholder return of our common stock at the end of such fiscal year. In each case, assume an initial investment of $100 on December 31, 2021. |
(6) | The dollar amounts reported represent the amount of net loss reflected in our audited financial statements for the applicable year. Due to the fact that we are not a commercial-stage company, we did not have any revenue during the periods presented. Consequently, we did not use net income (loss) as a performance measure in our executive compensation program. |
(1) | The dollar amounts reported in column (b) are the amounts of total compensation reported for Lynn Seely, M.D., our President and Chief Executive Officer, for all three years reported in the “Total” column of the Summary Compensation Table. Refer to “Executive Compensation—Summary Compensation Table.” |
(3) | The dollar amounts reported in column (d) represent the average of the amounts reported for the NEOs as a group (excluding our PEO) in the “Total” column of the Summary Compensation Table in each applicable year. The NEOs (excluding our PEO) included for purposes of calculating the average amounts in each applicable year are as follows: (i) for 2025, Stephen Hill and Gary Lee, Ph.D.; (i) for 2024, Stephen Hill and Matthew Lang (our former Chief Business Officer); and (ii) for 2023, Charles Newton (our former Chief Financial Officer), Stephen Hill, Matthew Lang, Gary Lee, Ph.D. and Tina Albertson, M.D., Ph.D. |
(2) | The dollar amounts reported in column (c) represent the amounts of “compensation actually paid” to Dr. Seely, as computed in accordance with Item 402(v) of Regulation S-K. The dollar amounts do not reflect the actual amount of compensation earned by or paid to Dr. Seely during the applicable year. In accordance with the requirements of Item 402(v) of Regulation S-K, the following adjustments were made to Dr. Seely’s total compensation for each year to determine the compensation actually paid: |
Year | Reported Summary Compensation Table Total for PEO ($) | Reported Value of Equity Awards for PEO (a) ($) | Equity Award Adjustments for PEO (b) ($) | Compensation Actually Paid to PEO ($) | ||||||||
2025 | 4,222,265 | 3,094,357 | 8,509,191 | 9,637,099 | ||||||||
2024 | 1,495,376 | 474,000 | (4,258,839) | (3,237,463) | ||||||||
2023 | 2,647,476 | 1,685,250 | (8,898,409) | (7,936,183) | ||||||||
(a) | The grant date fair value of equity awards represents the total of the amounts reported in the “Stock Awards” and “Option Awards” columns in the Summary Compensation Table for the applicable year. |
(b) | The equity award adjustments for each applicable year include the addition (or subtraction, as applicable) of the following: (i) the year-end fair value of any equity awards granted in the applicable year that are outstanding and unvested as of the end of the year; (ii) the amount of change as of the end of the applicable year (from the end of the prior fiscal year) in fair value of any awards granted in prior years that are outstanding and unvested as of the end of the applicable year; (iii) for awards that are granted and vest in the same applicable year, the fair value as of the vesting date; (iv) for awards granted in prior years that vest in the applicable year, the amount equal to the change as of the vesting date (from the end of the prior fiscal year) in fair value; (v) for awards granted in prior years that are determined to fail to meet the applicable vesting conditions during the applicable year, the amount equal to the fair value at the end of the prior fiscal year; and (vi) the dollar value of any dividends or other earnings paid on stock or option awards in the applicable year prior to the vesting date that are not otherwise reflected in the fair value of such award or included in any other component of total compensation for the applicable year. The valuation assumptions used to calculate fair values did not materially differ from those disclosed at the time of grant. The amounts deducted or added in calculating the equity award adjustments are as follows: |
Year | Year End Fair Value of Equity Awards for PEO ($) | Change in Fair Value of Outstanding and Unvested Equity Awards for PEO ($) | Fair Value as of Vesting Date of Equity Awards Granted and Vested in the Year for PEO ($) | Change in Fair Value of Equity Awards Granted in Prior Years that Vested in the Year for PEO ($) | Fair Value at the End of the Prior Year of Equity Awards that Failed to Meet Vesting Conditions in the Year for PEO ($) | Total Equity Award Adjustments for PEO ($) | ||||||||||||
2025 | 5,950,339 | 2,447,420 | 179,712 | (42,400) | (25,880) | 8,509,191 | ||||||||||||
2024 | 585,540 | (4,464,450) | — | (379,929) | — | (4,258,839) | ||||||||||||
2023 | — | (7,001,445) | — | (1,896,964) | — | (8,898,409) | ||||||||||||
(4) | The dollar amounts reported in column (e) represent the average amount of “compensation actually paid” to the NEOs as a group (excluding our PEO), as computed in accordance with Item 402(v) of Regulation S-K. The dollar amounts do not reflect the actual average amount of compensation earned by or paid to the NEOs as a group (excluding our PEO) during the applicable year. In accordance with the requirements of Item 402(v) of Regulation S-K, the following adjustments were made to average total compensation for the NEOs as a group (excluding our PEO) for each year to determine the compensation actually paid, using the same methodology described above in Note (2)(b): |
Year | Average Reported Summary Compensation Table Total for Non-PEO NEOs ($) | Average Reported Value of Equity Awards ($) | Average Equity Award Adjustments(a) ($) | Average Compensation Actually Paid to Non- PEO NEOs ($) | ||||||||
2025 | 2,009,530 | 1,200,846 | 2,787,579 | 3,596,263 | ||||||||
2024 | 1,606,237 | 666,450 | (866,977) | 72,810 | ||||||||
2023 | 3,210,333 | 2,410,690 | 329,911 | 1,129,554 | ||||||||
(a) | The amounts deducted or added in calculating the total average equity award adjustments are as follows: |
Year | Average Year End Fair Value of Equity Awards ($) | Average Change in Fair Value of Outstanding and Unvested Equity Awards ($) | Average Fair Value as of Vesting Date of Equity Awards Granted and Vested in the Year ($) | Average Change in Fair Value of Equity Awards Granted in Prior Years that Vested in the Year ($) | Average Fair Value at the End of the Prior Year of Equity Awards that Failed to Meet Vesting Conditions in the Year ($) | Total Average Equity Award Adjustments ($) | ||||||||||||
2025 | 2,255,953 | 478,251 | 59,925 | (1,374) | (5,176) | 2,787,579 | ||||||||||||
2024 | 281,657 | (1,076,339) | 87,042 | (159,337) | — | (866,977) | ||||||||||||
2023 | 1,043,424 | (536,147) | 172,101 | (106,207) | (243,260) | 329,911 | ||||||||||||
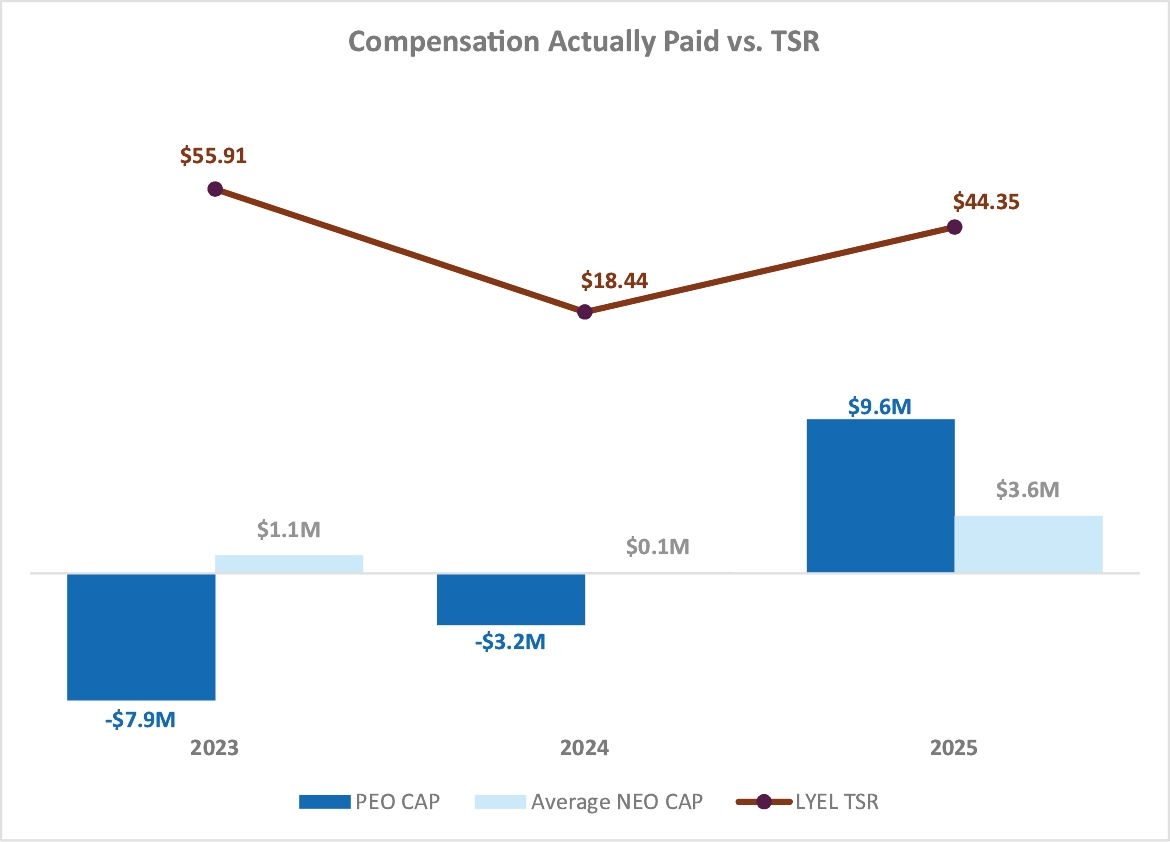
Compensation Actually Paid and Cumulative Company TSR
The chart below shows the relationship between the compensation actually paid to our PEO and the average compensation actually paid to our non-PEO NEOs, on the one hand, to the Company’s cumulative TSR over the years presented in the table, on the other.
Compensation Actually Paid and Net Loss
Because we are a pre-commercial stage company, we had no revenue during the periods presented. Consequently, we do not use net income (loss) as a performance measure in our executive compensation program. Moreover, as a pre-commercial stage company with only limited, nonrecurring revenue associated with license and collaboration agreements, we do not believe there is any meaningful relationship between our net income (loss) and compensation actually paid to our NEOs during the periods presented.
(b) | The equity award adjustments for each applicable year include the addition (or subtraction, as applicable) of the following: (i) the year-end fair value of any equity awards granted in the applicable year that are outstanding and unvested as of the end of the year; (ii) the amount of change as of the end of the applicable year (from the end of the prior fiscal year) in fair value of any awards granted in prior years that are outstanding and unvested as of the end of the applicable year; (iii) for awards that are granted and vest in the same applicable year, the fair value as of the vesting date; (iv) for awards granted in prior years that vest in the applicable year, the amount equal to the change as of the vesting date (from the end of the prior fiscal year) in fair value; (v) for awards granted in prior years that are determined to fail to meet the applicable vesting conditions during the applicable year, the amount equal to the fair value at the end of the prior fiscal year; and (vi) the dollar value of any dividends or other earnings paid on stock or option awards in the applicable year prior to the vesting date that are not otherwise reflected in the fair value of such award or included in any other component of total compensation for the applicable year. The valuation assumptions used to calculate fair values did not materially differ from those disclosed at the time of grant. The amounts deducted or added in calculating the equity award adjustments are as follows: |
Year | Year End Fair Value of Equity Awards for PEO ($) | Change in Fair Value of Outstanding and Unvested Equity Awards for PEO ($) | Fair Value as of Vesting Date of Equity Awards Granted and Vested in the Year for PEO ($) | Change in Fair Value of Equity Awards Granted in Prior Years that Vested in the Year for PEO ($) | Fair Value at the End of the Prior Year of Equity Awards that Failed to Meet Vesting Conditions in the Year for PEO ($) | Total Equity Award Adjustments for PEO ($) | ||||||||||||
2025 | 5,950,339 | 2,447,420 | 179,712 | (42,400) | (25,880) | 8,509,191 | ||||||||||||
2024 | 585,540 | (4,464,450) | — | (379,929) | — | (4,258,839) | ||||||||||||
2023 | — | (7,001,445) | — | (1,896,964) | — | (8,898,409) | ||||||||||||
(a) | The amounts deducted or added in calculating the total average equity award adjustments are as follows: |
Year | Average Year End Fair Value of Equity Awards ($) | Average Change in Fair Value of Outstanding and Unvested Equity Awards ($) | Average Fair Value as of Vesting Date of Equity Awards Granted and Vested in the Year ($) | Average Change in Fair Value of Equity Awards Granted in Prior Years that Vested in the Year ($) | Average Fair Value at the End of the Prior Year of Equity Awards that Failed to Meet Vesting Conditions in the Year ($) | Total Average Equity Award Adjustments ($) | ||||||||||||
2025 | 2,255,953 | 478,251 | 59,925 | (1,374) | (5,176) | 2,787,579 | ||||||||||||
2024 | 281,657 | (1,076,339) | 87,042 | (159,337) | — | (866,977) | ||||||||||||
2023 | 1,043,424 | (536,147) | 172,101 | (106,207) | (243,260) | 329,911 | ||||||||||||