Pay Versus Performance Table
Our chief executive officer is the Principal Executive Officer, or PEO. The following table sets forth information concerning the compensation of our PEO and our non-PEO named executive officers, or non-PEO NEOs, for each of the fiscal years ending December 31, 2021, 2022, 2023, 2024 and 2025 and our financial performance as measured by metrics set forth by the rules of the SEC for each such fiscal year.
|
|
|
|
|
|
|
|
|
|
|
|
|
|
Value of Initial Fixed $100 Investment Based On: |
|
|
|
|
|
|
|
|||||||||||
Year |
|
Summary Compensation Table |
|
|
Compensation Actually Paid |
|
|
Average Summary Compensation Table |
|
|
Average Compensation Actually Paid |
|
|
Total Shareholder Return (4) |
|
|
Peer Group Total Shareholder Return (4) |
|
|
Net Income (Loss) |
|
|
Company Stock Price ($)(6) |
|
||||||||
2025 |
|
$ |
4,646,454 |
|
|
$ |
9,117,009 |
|
|
$ |
1,595,194 |
|
|
$ |
2,957,456 |
|
|
$ |
20.36 |
|
|
$ |
119.92 |
|
|
$ |
(276,479 |
) |
|
$ |
8.12 |
|
2024 |
|
$ |
13,079,301 |
|
|
$ |
(1,280,423 |
) |
|
$ |
5,085,823 |
|
|
$ |
436,394 |
|
|
$ |
9.91 |
|
|
$ |
90.58 |
|
|
$ |
(337,708 |
) |
|
$ |
4.46 |
|
2023 |
|
$ |
19,770,838 |
|
|
$ |
5,289,038 |
|
|
$ |
6,271,358 |
|
|
$ |
2,659,332 |
|
|
$ |
26.49 |
|
|
$ |
91.84 |
|
|
$ |
(341,973 |
) |
|
$ |
10.13 |
|
2022 |
|
$ |
8,121,840 |
|
|
$ |
(5,230,907 |
) |
|
$ |
2,781,134 |
|
|
$ |
777,890 |
|
|
$ |
35.95 |
|
|
$ |
88.53 |
|
|
$ |
(290,509 |
) |
|
$ |
16.32 |
|
2021 |
|
$ |
8,532,948 |
|
|
$ |
(3,353,876 |
) |
|
$ |
2,255,079 |
|
|
$ |
353,356 |
|
|
$ |
73.89 |
|
|
$ |
99.37 |
|
|
$ |
(363,872 |
) |
|
$ |
29.87 |
|
Year |
|
Summary Compensation Table Total for PEO ($) |
|
|
Exclusion of Stock Awards and Option Awards for PEO ($)(a) |
|
|
Inclusion of Equity Values for PEO (b) |
|
|
Compensation Actually Paid to PEO ($) |
|
||||
2025 |
|
$ |
4,646,454 |
|
|
$ |
(3,513,900 |
) |
|
$ |
7,984,455 |
|
|
$ |
9,117,009 |
|
2024 |
|
$ |
13,079,301 |
|
|
$ |
(11,963,485 |
) |
|
$ |
(2,396,239 |
) |
|
$ |
(1,280,423 |
) |
2023 |
|
$ |
19,770,838 |
|
|
$ |
(18,692,755 |
) |
|
$ |
4,210,955 |
|
|
$ |
5,289,038 |
|
2022 |
|
$ |
8,121,840 |
|
|
$ |
(7,095,094 |
) |
|
$ |
(6,257,653 |
) |
|
$ |
(5,230,907 |
) |
2021 |
|
$ |
8,532,948 |
|
|
$ |
(7,516,145 |
) |
|
$ |
(4,370,679 |
) |
|
$ |
(3,353,876 |
) |
Year |
|
Average Summary Compensation Table Total for Non-PEO NEOs ($) |
|
|
Average Exclusion of Stock Awards and Option Awards for Non-PEO NEOs ($)(a) |
|
|
Average Inclusion of Equity Values for Non-PEO NEOs (b) |
|
|
Average Compensation Actually Paid to Non-PEO NEOs ($) |
|
||||
2025 |
|
$ |
1,595,194 |
|
|
$ |
(973,875 |
) |
|
$ |
2,336,137 |
|
|
$ |
2,957,456 |
|
2024 |
|
$ |
5,085,823 |
|
|
$ |
(4,088,627 |
) |
|
$ |
(560,802 |
) |
|
$ |
436,394 |
|
2023 |
|
$ |
6,271,358 |
|
|
$ |
(5,449,691 |
) |
|
$ |
1,837,665 |
|
|
$ |
2,659,332 |
|
2022 |
|
$ |
2,781,134 |
|
|
$ |
(2,161,101 |
) |
|
$ |
157,857 |
|
|
$ |
777,890 |
|
2021 |
|
$ |
2,255,079 |
|
|
$ |
(1,624,937 |
) |
|
$ |
(276,786 |
) |
|
$ |
353,356 |
|
Year |
|
Year-End Fair Value of Equity Awards Granted During Year That Remained Unvested as of Last Day of Year for PEO ($) |
|
|
Change in Fair Value from Last Day of Prior Year to Last Day of Year of Unvested Equity Awards for PEO ($) |
|
|
Vesting Date Fair Value of Equity Awards Granted During Year that Vested During Year for PEO ($) |
|
|
Change in Fair Value from Last Day of Prior Year to Vesting Date of Unvested Equity Awards that Vested During Year for PEO ($) |
|
|
Fair Value at Last Day of Prior Year of Equity Awards Forfeited During Year for PEO ($) |
|
|
Total Inclusion of Equity Values for PEO ($) |
|
||||||
2025 |
|
$ |
5,946,392 |
|
|
$ |
1,294,703 |
|
|
$ |
621,689 |
|
|
$ |
149,625 |
|
|
|
(27,954 |
) |
|
$ |
7,984,455 |
|
2024 |
|
$ |
4,538,633 |
|
|
$ |
(5,357,048 |
) |
|
$ |
- |
|
|
$ |
(1,577,824 |
) |
|
|
— |
|
|
$ |
(2,396,239 |
) |
2023 |
|
$ |
6,626,642 |
|
|
$ |
(2,239,885 |
) |
|
$ |
908,670 |
|
|
$ |
(1,084,472 |
) |
|
|
— |
|
|
$ |
4,210,955 |
|
2022 |
|
$ |
4,842,198 |
|
|
$ |
(8,801,732 |
) |
|
$ |
1,478,276 |
|
|
$ |
(3,776,395 |
) |
|
|
— |
|
|
$ |
(6,257,653 |
) |
2021 |
|
$ |
5,541,152 |
|
|
$ |
(9,031,828 |
) |
|
$ |
1,398,375 |
|
|
$ |
(2,278,378 |
) |
|
|
— |
|
|
$ |
(4,370,679 |
) |
Year |
|
Average Year-End Fair Value of Equity Awards Granted During Year That Remained Unvested as of Last Day of Year for Non-PEO NEOs ($) |
|
|
Average Change in Fair Value from Last Day of Prior Year to Last Day of Year of Unvested Equity Awards for Non-PEO NEOs ($) |
|
|
Average Vesting Date Fair Value of Equity Awards Granted During Year that Vested During Year for Non-PEO NEOs ($) |
|
|
Average Change in Fair Value from Last Day of Prior Year to Vesting Date of Unvested Equity Awards that Vested During Year for Non-PEO NEOs ($) |
|
|
Average Fair Value at Last Day of Prior Year of Equity Awards Forfeited During Year for Non-PEO NEOs ($) |
|
|
Total Average Inclusion of Equity Values for Non-PEO NEOs ($) |
|
||||||
2025 |
|
$ |
1,648,040 |
|
|
$ |
362,745 |
|
|
$ |
172,300 |
|
|
$ |
165,533 |
|
|
|
(12,481 |
) |
|
$ |
2,336,137 |
|
2024 |
|
$ |
1,551,118 |
|
|
$ |
(1,556,918 |
) |
|
$ |
- |
|
|
$ |
(555,002 |
) |
|
|
— |
|
|
$ |
(560,802 |
) |
2023 |
|
$ |
2,252,206 |
|
|
$ |
(456,035 |
) |
|
$ |
253,485 |
|
|
$ |
(211,991 |
) |
|
|
— |
|
|
$ |
1,837,665 |
|
2022 |
|
$ |
1,394,020 |
|
|
$ |
(1,211,776 |
) |
|
$ |
452,862 |
|
|
$ |
(477,249 |
) |
|
|
— |
|
|
$ |
157,857 |
|
2021 |
|
$ |
1,191,952 |
|
|
$ |
(1,331,151 |
) |
|
$ |
316,362 |
|
|
$ |
(453,949 |
) |
|
|
— |
|
|
$ |
(276,786 |
) |
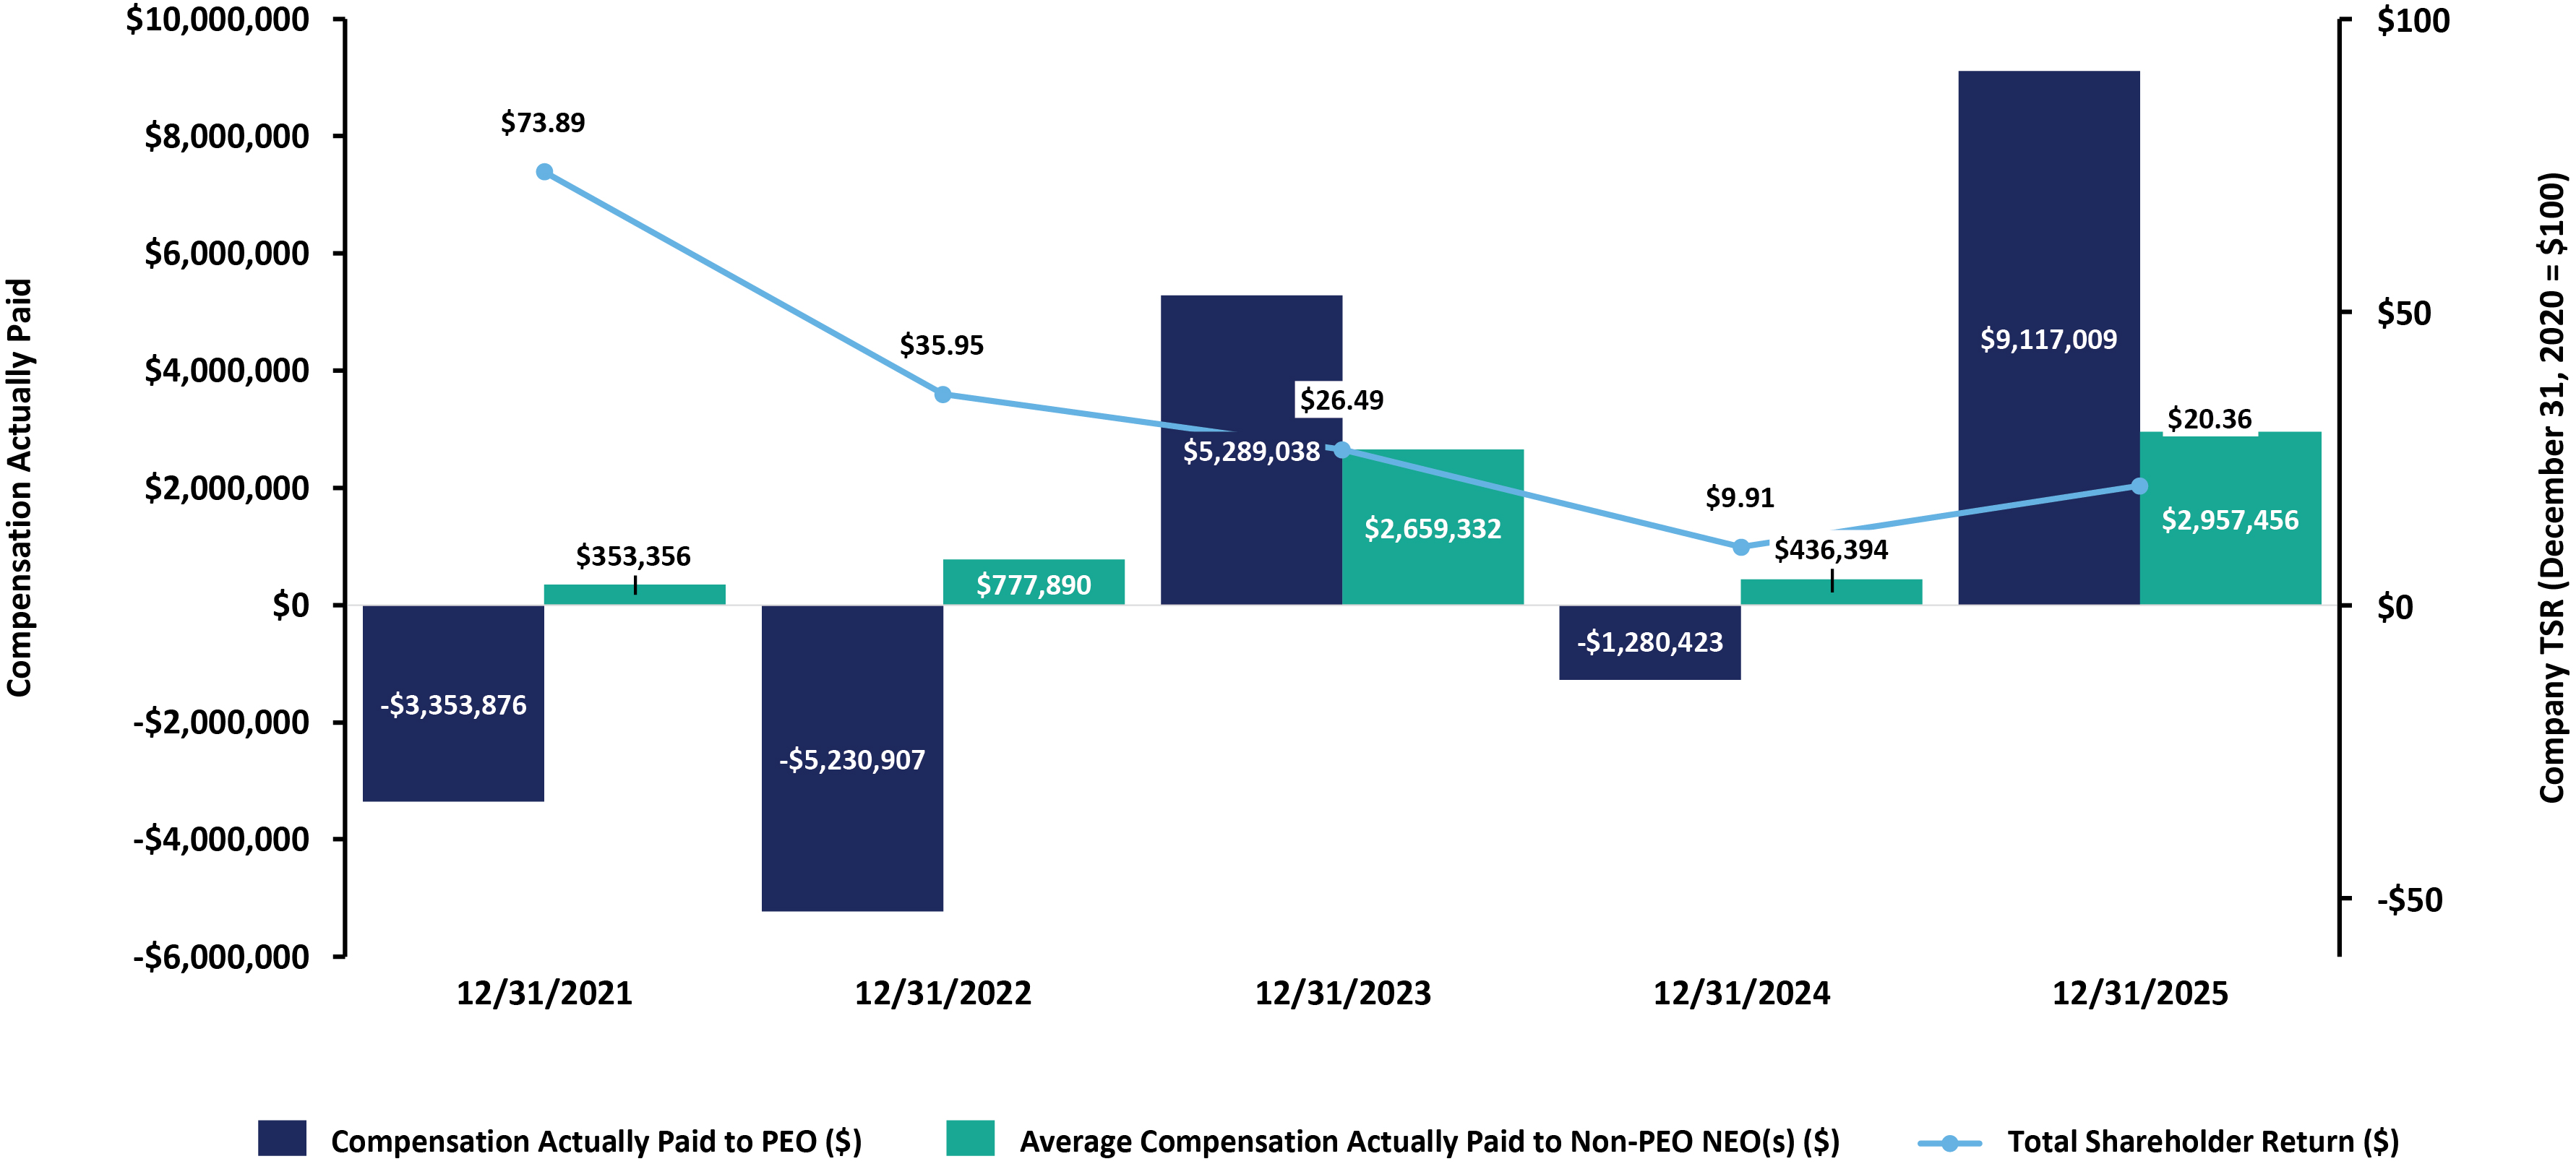
The following chart sets forth the relationship between Compensation Actually Paid to our PEO and the average of the Compensation Actually Paid to our non-PEO NEOs versus our cumulative TSR over the reporting period covering the years ended December 31, 2021 through December, 31 2025.
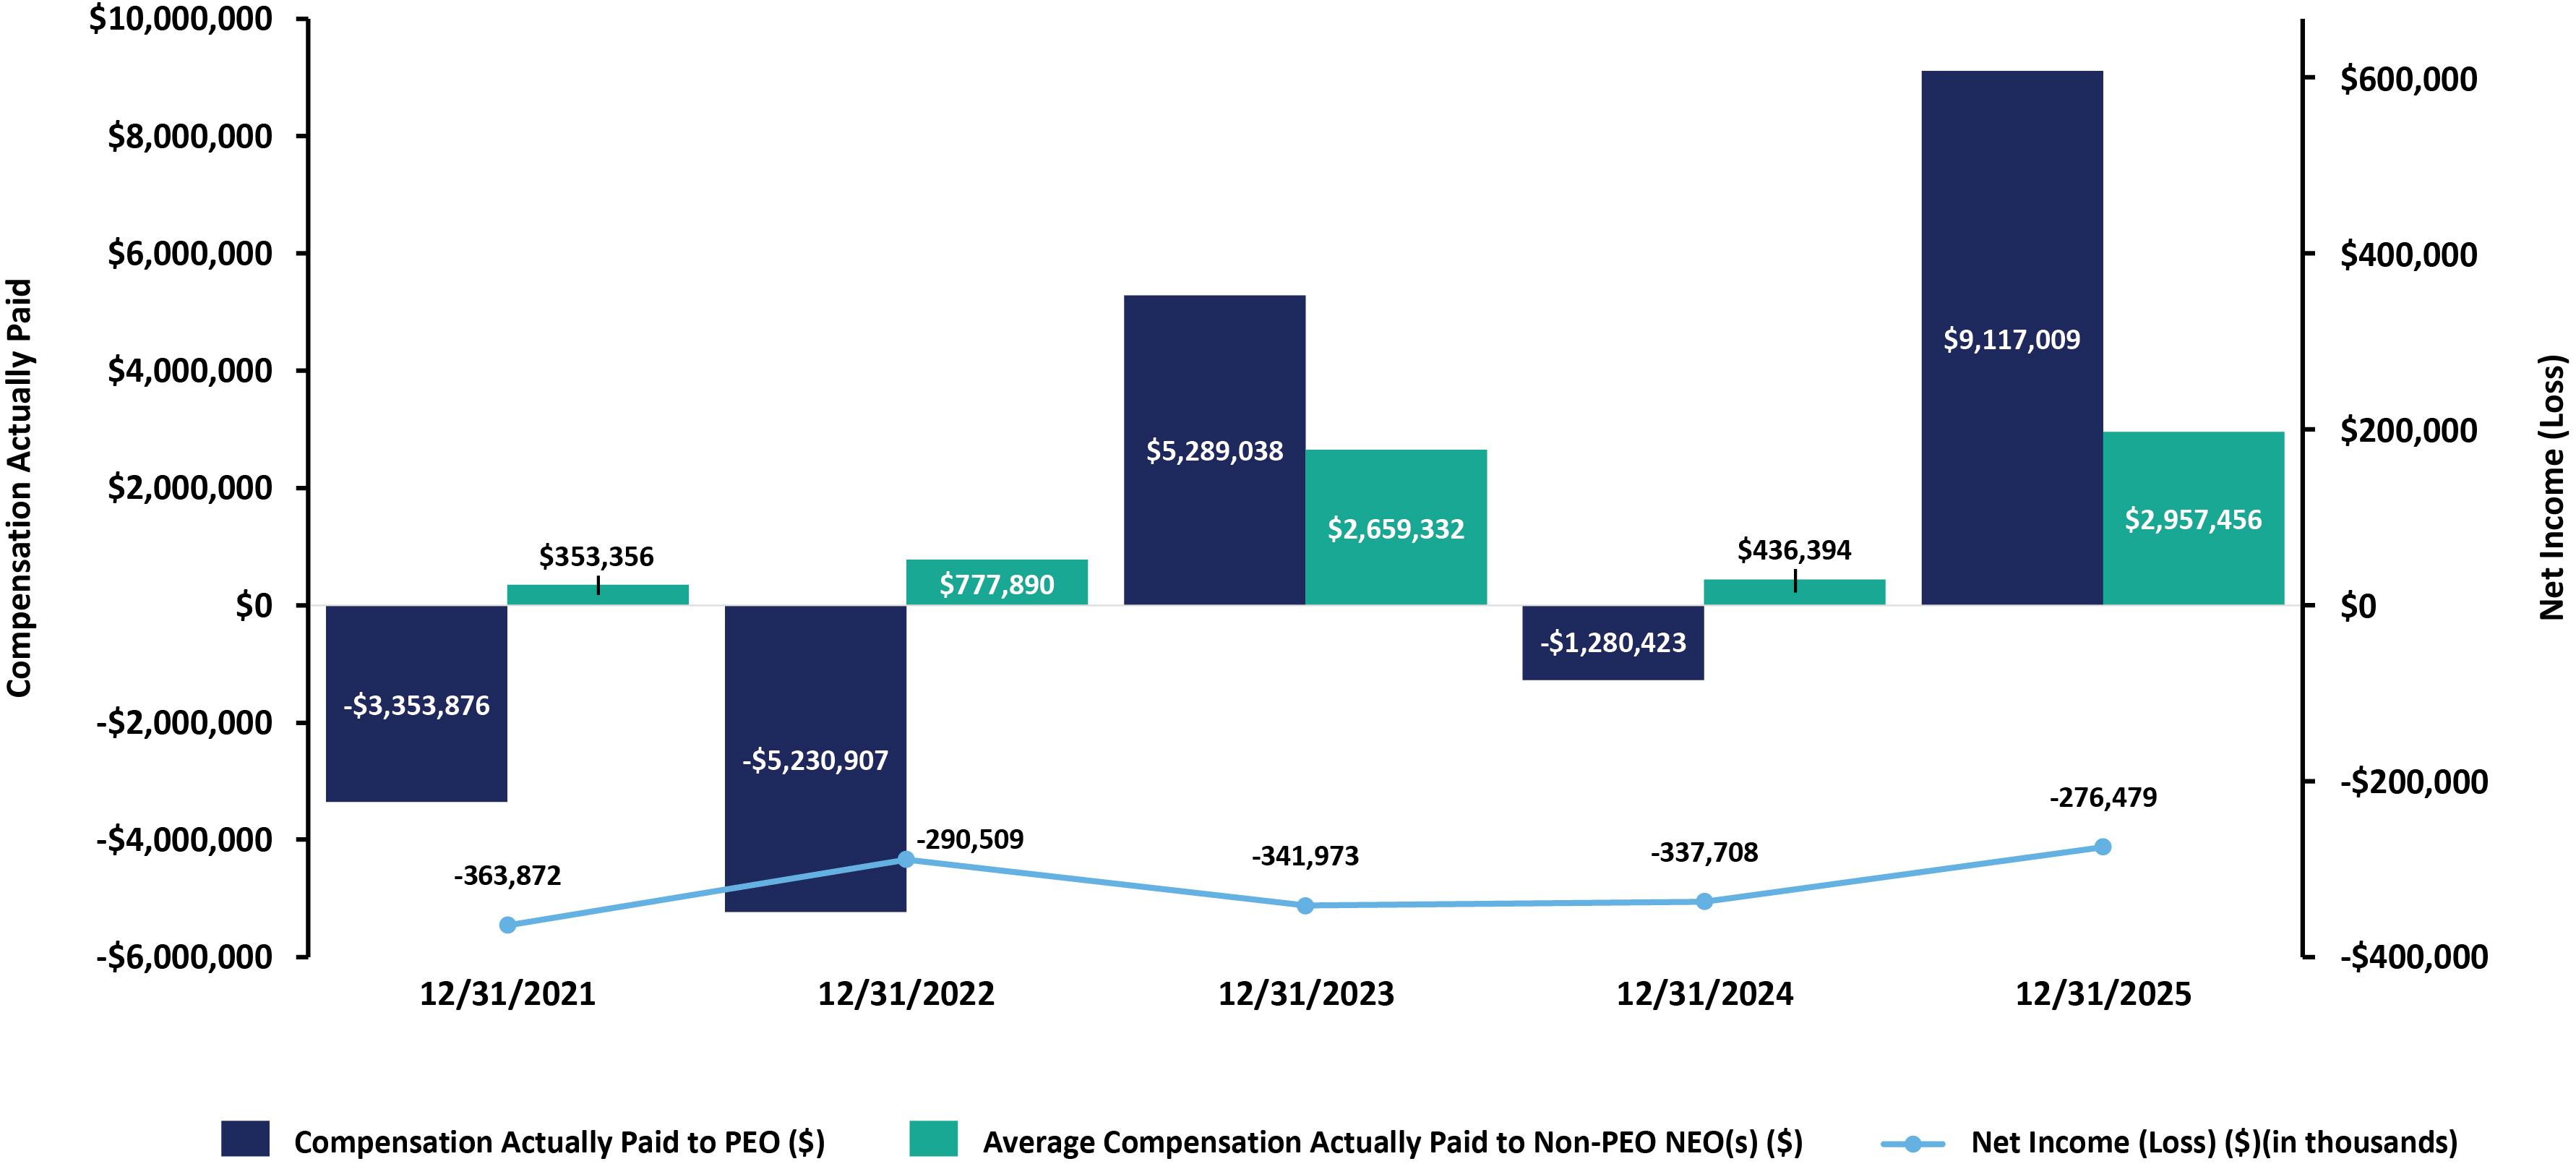
The following chart provides a graphical representation of the Compensation Actually Paid to our PEO and the average of the Compensation Actually Paid to our non-PEO named executive officers versus net income (loss).
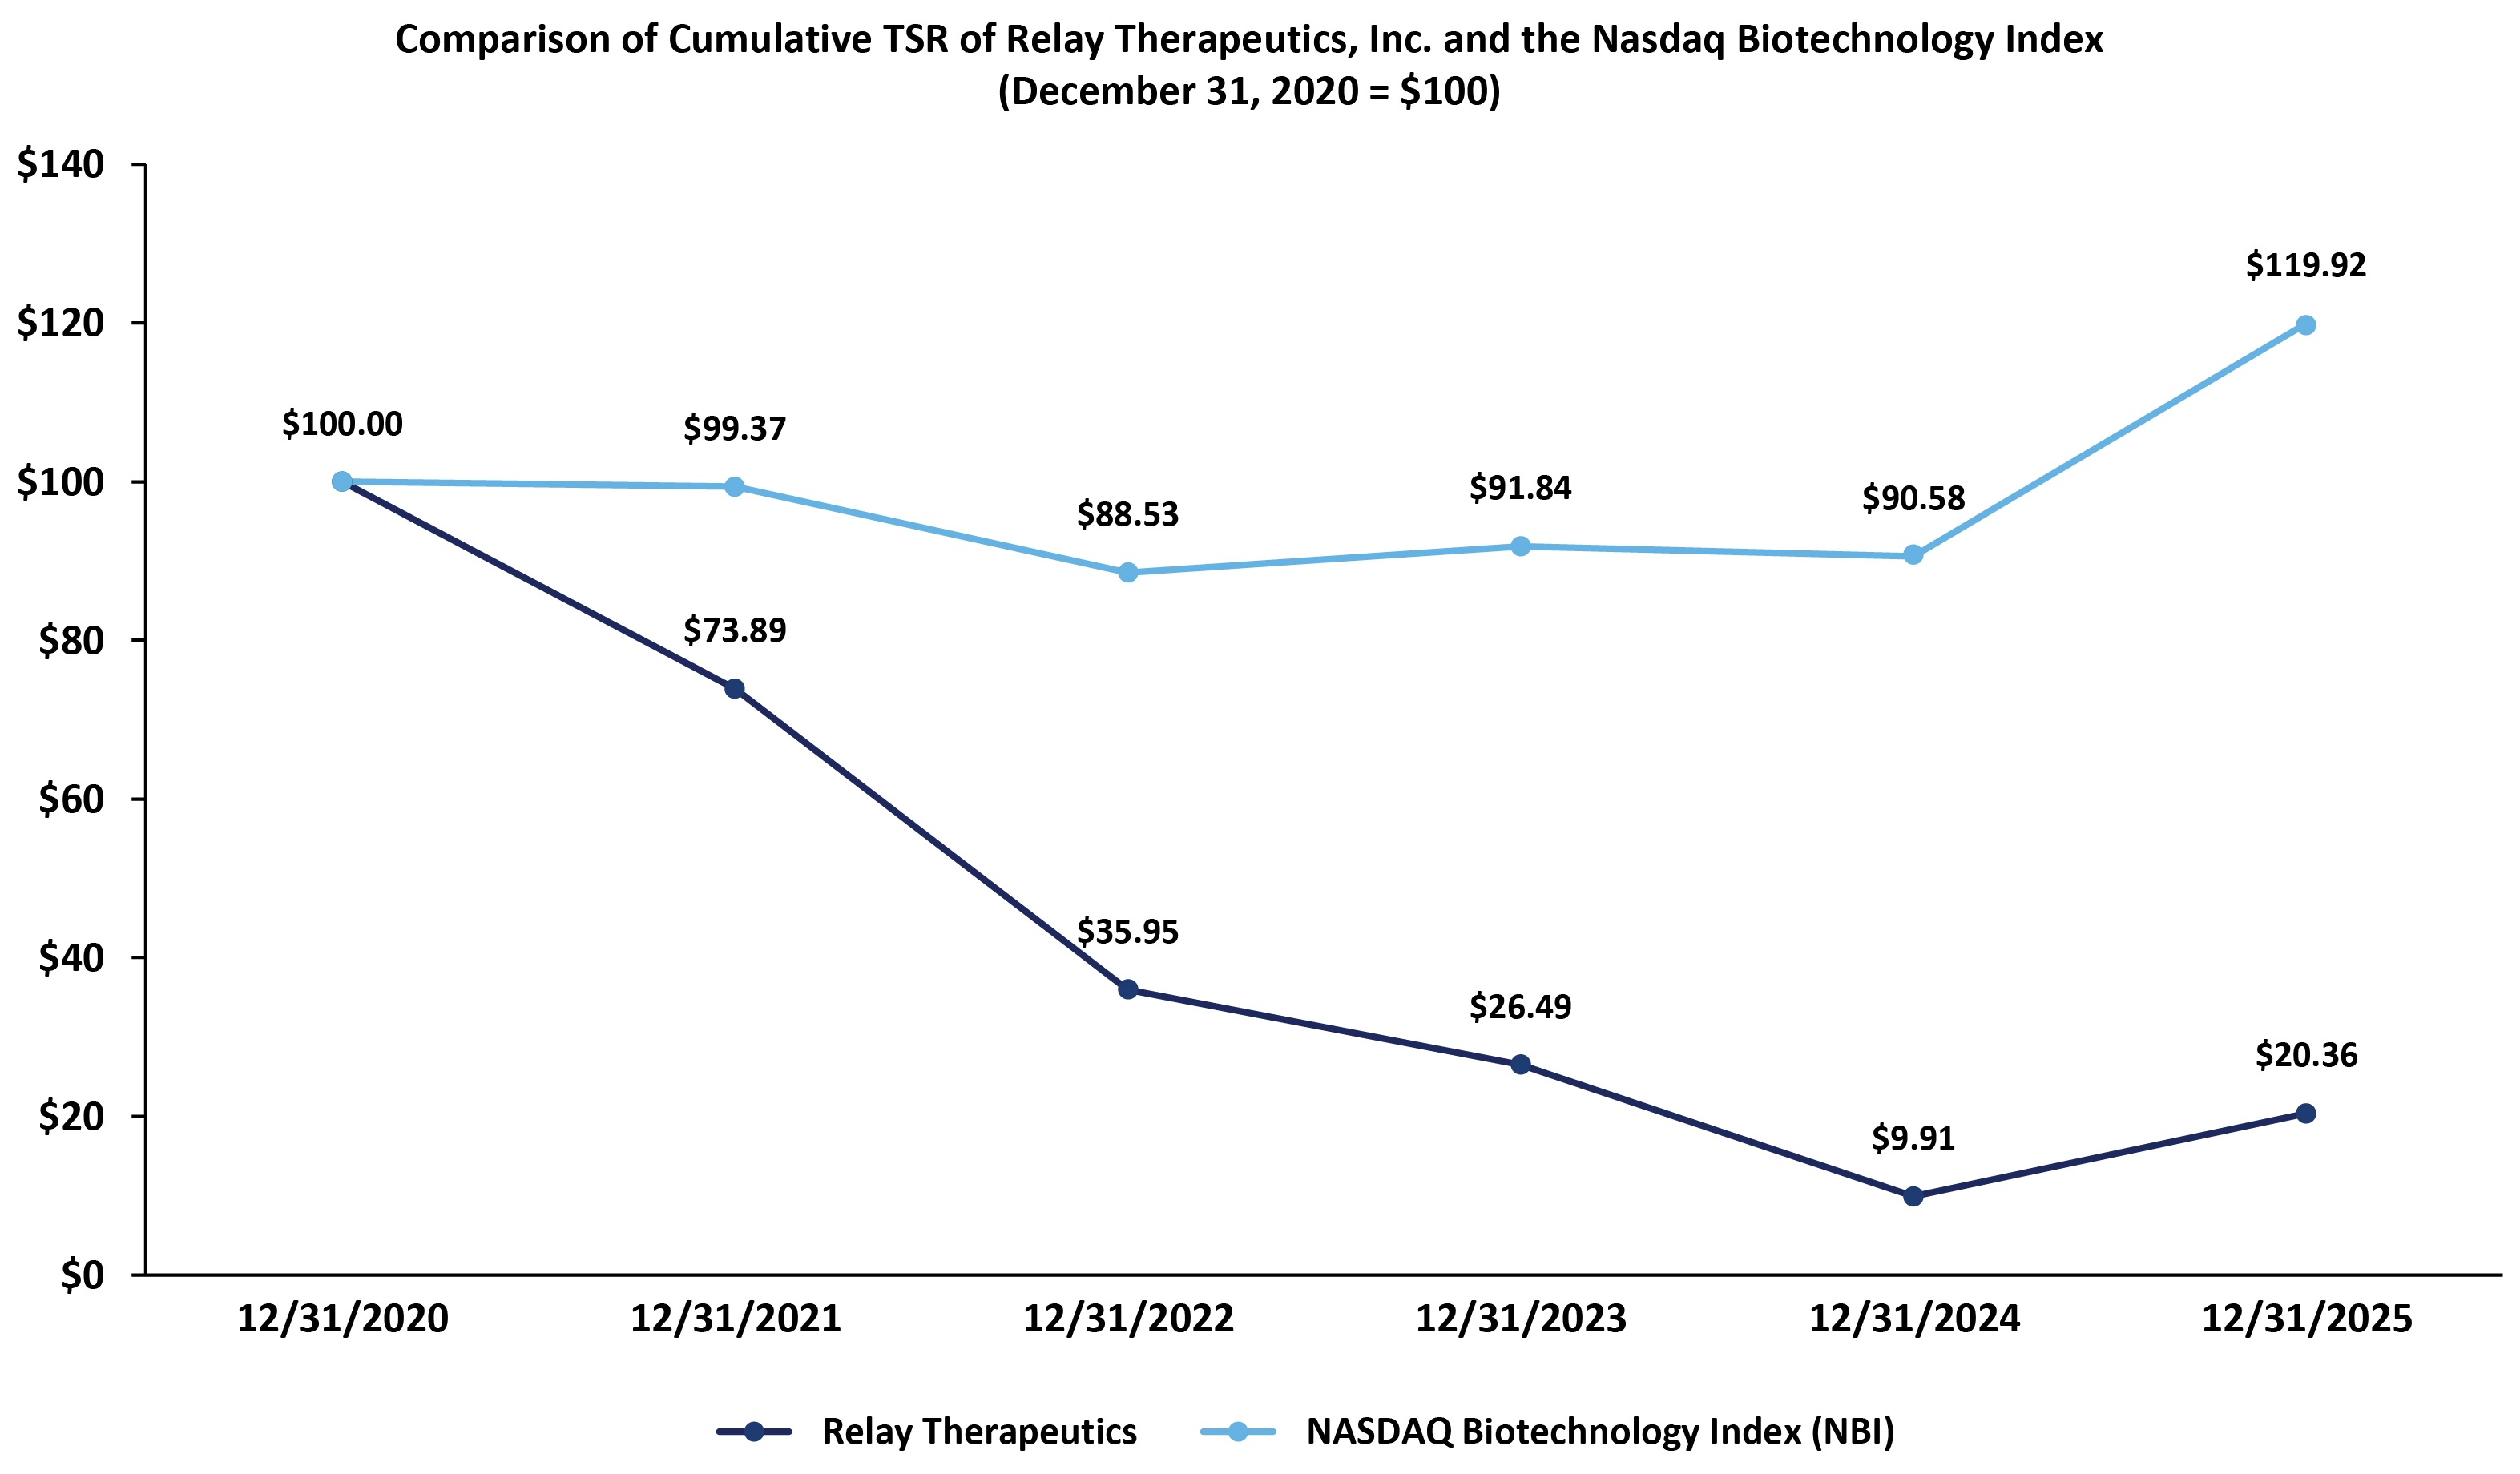
The following chart provides a graphical representation of our cumulative TSR versus the TSR of our industry peer group, the Nasdaq Biotechnology Index. Our cumulative TSR assumes an initial fixed investment of $100 in our common stock on December 31, 2020, using the closing market price on December 31, 2020, through December 31, 2025.
Item 402(v) of Regulation S-K requires us to identify the most important financial measure that we used to link compensation actually paid to our named executive officers to company performance for the most recently completed fiscal year, or the Company-Selected Measure. As discussed above under "— Primary Elements of Executive Compensation — Long Term Equity Incentive Awards," in 2023, we granted performance-based equity awards to our named executive officers that included a market based vesting condition. As a result, stock price is our Company-Selected Measure solely by virtue of being our only financial measure. While there were no other financial measures considered in determining the compensation paid to our named executive officers in 2021, 2022, 2023, 2024 and 2025, the compensation committee considered other non-financial factors described in "— Compensation Discussion and Analysis — Compensation Objectives and Philosophy."
Year |
|
Summary Compensation Table Total for PEO ($) |
|
|
Exclusion of Stock Awards and Option Awards for PEO ($)(a) |
|
|
Inclusion of Equity Values for PEO (b) |
|
|
Compensation Actually Paid to PEO ($) |
|
||||
2025 |
|
$ |
4,646,454 |
|
|
$ |
(3,513,900 |
) |
|
$ |
7,984,455 |
|
|
$ |
9,117,009 |
|
2024 |
|
$ |
13,079,301 |
|
|
$ |
(11,963,485 |
) |
|
$ |
(2,396,239 |
) |
|
$ |
(1,280,423 |
) |
2023 |
|
$ |
19,770,838 |
|
|
$ |
(18,692,755 |
) |
|
$ |
4,210,955 |
|
|
$ |
5,289,038 |
|
2022 |
|
$ |
8,121,840 |
|
|
$ |
(7,095,094 |
) |
|
$ |
(6,257,653 |
) |
|
$ |
(5,230,907 |
) |
2021 |
|
$ |
8,532,948 |
|
|
$ |
(7,516,145 |
) |
|
$ |
(4,370,679 |
) |
|
$ |
(3,353,876 |
) |
Year |
|
Average Summary Compensation Table Total for Non-PEO NEOs ($) |
|
|
Average Exclusion of Stock Awards and Option Awards for Non-PEO NEOs ($)(a) |
|
|
Average Inclusion of Equity Values for Non-PEO NEOs (b) |
|
|
Average Compensation Actually Paid to Non-PEO NEOs ($) |
|
||||
2025 |
|
$ |
1,595,194 |
|
|
$ |
(973,875 |
) |
|
$ |
2,336,137 |
|
|
$ |
2,957,456 |
|
2024 |
|
$ |
5,085,823 |
|
|
$ |
(4,088,627 |
) |
|
$ |
(560,802 |
) |
|
$ |
436,394 |
|
2023 |
|
$ |
6,271,358 |
|
|
$ |
(5,449,691 |
) |
|
$ |
1,837,665 |
|
|
$ |
2,659,332 |
|
2022 |
|
$ |
2,781,134 |
|
|
$ |
(2,161,101 |
) |
|
$ |
157,857 |
|
|
$ |
777,890 |
|
2021 |
|
$ |
2,255,079 |
|
|
$ |
(1,624,937 |
) |
|
$ |
(276,786 |
) |
|
$ |
353,356 |
|
Year |
|
Year-End Fair Value of Equity Awards Granted During Year That Remained Unvested as of Last Day of Year for PEO ($) |
|
|
Change in Fair Value from Last Day of Prior Year to Last Day of Year of Unvested Equity Awards for PEO ($) |
|
|
Vesting Date Fair Value of Equity Awards Granted During Year that Vested During Year for PEO ($) |
|
|
Change in Fair Value from Last Day of Prior Year to Vesting Date of Unvested Equity Awards that Vested During Year for PEO ($) |
|
|
Fair Value at Last Day of Prior Year of Equity Awards Forfeited During Year for PEO ($) |
|
|
Total Inclusion of Equity Values for PEO ($) |
|
||||||
2025 |
|
$ |
5,946,392 |
|
|
$ |
1,294,703 |
|
|
$ |
621,689 |
|
|
$ |
149,625 |
|
|
|
(27,954 |
) |
|
$ |
7,984,455 |
|
2024 |
|
$ |
4,538,633 |
|
|
$ |
(5,357,048 |
) |
|
$ |
- |
|
|
$ |
(1,577,824 |
) |
|
|
— |
|
|
$ |
(2,396,239 |
) |
2023 |
|
$ |
6,626,642 |
|
|
$ |
(2,239,885 |
) |
|
$ |
908,670 |
|
|
$ |
(1,084,472 |
) |
|
|
— |
|
|
$ |
4,210,955 |
|
2022 |
|
$ |
4,842,198 |
|
|
$ |
(8,801,732 |
) |
|
$ |
1,478,276 |
|
|
$ |
(3,776,395 |
) |
|
|
— |
|
|
$ |
(6,257,653 |
) |
2021 |
|
$ |
5,541,152 |
|
|
$ |
(9,031,828 |
) |
|
$ |
1,398,375 |
|
|
$ |
(2,278,378 |
) |
|
|
— |
|
|
$ |
(4,370,679 |
) |
Year |
|
Average Year-End Fair Value of Equity Awards Granted During Year That Remained Unvested as of Last Day of Year for Non-PEO NEOs ($) |
|
|
Average Change in Fair Value from Last Day of Prior Year to Last Day of Year of Unvested Equity Awards for Non-PEO NEOs ($) |
|
|
Average Vesting Date Fair Value of Equity Awards Granted During Year that Vested During Year for Non-PEO NEOs ($) |
|
|
Average Change in Fair Value from Last Day of Prior Year to Vesting Date of Unvested Equity Awards that Vested During Year for Non-PEO NEOs ($) |
|
|
Average Fair Value at Last Day of Prior Year of Equity Awards Forfeited During Year for Non-PEO NEOs ($) |
|
|
Total Average Inclusion of Equity Values for Non-PEO NEOs ($) |
|
||||||
2025 |
|
$ |
1,648,040 |
|
|
$ |
362,745 |
|
|
$ |
172,300 |
|
|
$ |
165,533 |
|
|
|
(12,481 |
) |
|
$ |
2,336,137 |
|
2024 |
|
$ |
1,551,118 |
|
|
$ |
(1,556,918 |
) |
|
$ |
- |
|
|
$ |
(555,002 |
) |
|
|
— |
|
|
$ |
(560,802 |
) |
2023 |
|
$ |
2,252,206 |
|
|
$ |
(456,035 |
) |
|
$ |
253,485 |
|
|
$ |
(211,991 |
) |
|
|
— |
|
|
$ |
1,837,665 |
|
2022 |
|
$ |
1,394,020 |
|
|
$ |
(1,211,776 |
) |
|
$ |
452,862 |
|
|
$ |
(477,249 |
) |
|
|
— |
|
|
$ |
157,857 |
|
2021 |
|
$ |
1,191,952 |
|
|
$ |
(1,331,151 |
) |
|
$ |
316,362 |
|
|
$ |
(453,949 |
) |
|
|
— |
|
|
$ |
(276,786 |
) |
| [1] | In each of 2025, 2024, 2023, 2022, and 2021, Dr. Patel was our PEO. |
| [2] | Compensation Actually Paid has been calculated in accordance with Item 402(v) of Regulation S-K, reflecting adjustments in the value of equity awards granted and outstanding to each of our PEO and non-PEO NEOs in the applicable year. The following adjustments were made to the amounts reported for our PEO and non-PEO NEOs in the "Total" from the Summary Compensation Table for each year to calculate Compensation Actually Paid. The amounts presented for Compensation Actually Paid do not reflect compensation actually earned, realized, or received by our named executive officers in the applicable year. |
| [3] | During each of 2025, 2024, 2023, and 2022, our non-PEO NEOs consisted of Mr. Catinazzo, Dr. Bergstrom, Mr. Adams, and Mr. Rahmer. During 2021, our non-PEO NEOs consisted of Mr. Catinazzo, Dr. Bergstrom, Mr. Adams, and Mr. Porter. |
| [4] | The Cumulative Total Shareholder Return, or TSR, represents the cumulative total shareholder return of the Company over the measurement period. The Peer Group TSR utilizes the Nasdaq Biotechnology Index, which we also utilize in the stock performance graph included in the 2025 Annual Report as required by Item 201(e) of Regulation S-K. The comparison assumes $100 was invested in our common stock and in the Nasdaq Biotechnology Index for the period starting December 31, 2020, using the closing market price on December 31, 2020, through the end of the listed year, and it assumes reinvestment of dividends, if any. Historical stock performance is not necessarily indicative of, nor is it intended to forecast, future stock price performance. |
| [5] | The dollar amounts reported represent the amount of net income (loss) reflected in our audited financial statements for the applicable year. |
| [6] | As indicated above, performance-based equity awards with a specified market condition were granted to our named executive officers in January 2023. The "stock price" included as our "Company Selected Measure" for 2025 reflects the average price of our common stock for the thirty-day period ending December 31, 2025, 2024, 2023, 2022, and 2021. We did not use any financial performance measures to link executive compensation to our financial performance prior to 2023 or throughout 2024 and 2025. |