| Pay vs Performance Disclosure | ||||||||||||||||||||||||||||||||||||||||
| Year | Summary Compensation Table Total for First PEO (1)(6) | Compensation Actually Paid to First PEO (1)(7) | Summary Compensation Table Total for Second PEO (2)(6) | Compensation Actually Paid to Second PEO (2)(7) | Summary Compensation Table Total for Third PEO (3)(6) | Compensation Actually Paid to Third PEO (3)(7) | Summary Compensation Table Total for Fourth PEO (4)(6) | Compensation Actually Paid to Fourth PEO (4)(7) | Summary Compensation Table Total for Fifth PEO (5)(6) | Compensation Actually Paid to Fifth PEO (5)(7) | ||||||||||||||||||||||||||||||
| (a) | (b) | (c) | (d) | (e) | (f) | (g) | (h) | (i) | (j) | (k) | ||||||||||||||||||||||||||||||
| 2025 | $ | 0 | $ | 0 | $ | 0 | $ | 0 | $ | 0 | $ | 0 | $ | 7,662,185 | $ | 2,826,148 | $ | 6,311,321 | $ | 5,536,145 | ||||||||||||||||||||
| 2024 | $ | 0 | $ | 0 | $ | 0 | $ | 0 | $ | 0 | $ | 0 | $ | 7,692,267 | $ | 4,331,297 | $ | 0 | $ | 0 | ||||||||||||||||||||
| 2023 | $ | 0 | $ | 0 | $ | 0 | $ | 0 | $ | 9,130,202 | $ | (1,220,844 | ) | $ | 876,033 | $ | 944,628 | $ | 0 | $ | 0 | |||||||||||||||||||
| 2022 | $ | 0 | $ | 0 | $ | 3,464,119 | $ | (19,754,948 | ) | $ | 10,361,434 | $ | 6,734,905 | $ | 0 | $ | 0 | $ | 0 | $ | 0 | |||||||||||||||||||
| 2021 | $ | 26,526,940 | $ | 2,973,403 | $ | 0 | $ | 0 | $ | 0 | $ | 0 | $ | 0 | $ | 0 | $ | 0 | $ | 0 | ||||||||||||||||||||
| Value
of Initial Fixed $100 Investment Based On: | ||||||||||||||||||||||||
| Year | Average Summary Compensation Table Total for Non-PEO NEOs (8) | Average Compensation Actually Paid to Non-PEO NEOs (9) | Total Shareholder Return (10) | Peer Group Total Shareholder Return (10) | Net
Income (millions) (11) | Revenue (millions) (12) | ||||||||||||||||||
| (a) | (l) | (m) | (n) | (o) | (p) | (q) | ||||||||||||||||||
| 2025 | $ | 2,314,617 | $ | 2,200,363 | $ | 10.82 | $ | 142.22 | $ | (9.5 | ) | $ | 301 | |||||||||||
| 2024 | $ | 1,901,980 | $ | 201,973 | $ | 12.37 | $ | 134.11 | $ | (29.1 | ) | $ | 334 | |||||||||||
| 2023 | $ | 3,777,180 | $ | 712,844 | $ | 24.20 | $ | 103.05 | $ | (100.1 | ) | $ | 398 | |||||||||||
| 2022 | $ | 2,494,664 | $ | (5,247,651 | ) | $ | 70.82 | $ | 72.36 | $ | 44.2 | $ | 366 | |||||||||||
| 2021 | $ | 6,616,186 | $ | 9,523,295 | $ | 188.02 | $ | 114.92 | $ | (378.7 | ) | $ | 260 | |||||||||||
| (1) | The first PEO is Clinton Carnell, who served as PEO in 2021. The grant date fair value of Option Awards and Stock Awards granted in 2021 to Clinton Carnell was $23,553,537. However, any Stock Awards or Option Awards granted in the year were forfeited in the year and therefore had a zero value as of the end of the year. “Compensation Actually Paid” of $2,973,403 reflects the sum of Salary and All Other Compensation for the year. |
| (2) | The second PEO is Brenton L. Saunders, who served as our interim CEO from January 1, 2022 to February 6, 2022. |
| (3) | The third PEO is Andrew Stanleick, who served as our PEO for the remainder of 2022 after Mr. Saunders resumed his role as our Executive Chairman for the fiscal year of 2022. |
| (4) | The fourth PEO is Marla Beck, who became PEO effective November 20, 2023. |
| (5) | The fifth PEO is Pedro Malha, who became PEO effective October 1, 2025. |
| (10) | Total shareholder return is calculated by assuming that a $100 investment was made on the day prior to the first fiscal year reported below and reinvesting all dividends until the last day of each reported fiscal year. Peer Group Total Shareholder Return is based on the S&P Consumer Discretionary Select Sector Index, which is what we have used for Item 201(e) purposes in our Annual Report. |
| (11) | The dollar amounts reported are the Company's net income reflected in the Company’s audited financial statements. |
| (12) | In the Company’s assessment, revenue is the financial performance measure that is the most important financial performance measure (other than total shareholder return and net income) used by the Company in 2025 to link compensation actually paid to performance. |
| (6) | Represents the total compensation paid to our PEO in each listed year, as shown in our Summary Compensation Table for such listed year. |
| (7) | Compensation actually paid does not mean that our PEO was actually paid those amounts in the listed year, but this is a dollar amount derived from the starting point of Summary Compensation Table total compensation under the methodology prescribed under the relevant rules as shown in the adjustment table below. |
| 2025 | ||||||||||||
PEO 4 ($) | PEO 5 ($) | Non-PEO ($) | ||||||||||
| Summary Compensation Table Total(a) | $ | 7,662,185 | $ | 6,311,321 | $ | 2,314,617 | ||||||
| Subtract Grant Date Fair Value of Option Awards and Stock Awards Granted in Fiscal Year(b) | $ | (3,713,635 | ) | $ | (5,344,534 | ) | $ | (1,295,453 | ) | |||
| Add Fair Value at Fiscal Year-End of Outstanding and Unvested Option Awards and Stock Awards Granted in Fiscal Year(c) | $ | 0 | $ | 4,569,358 | $ | 1,333,443 | ||||||
| Adjust for Change in Fair Value of Outstanding and Unvested Option Awards and Stock Awards Granted in Prior Fiscal Years(c) | $ | 0 | $ | 0 | $ | (122,680 | ) | |||||
| Adjust for Fair Value at Vesting of Option Awards and Stock Awards Granted in Fiscal Year That Vested During Fiscal Year(c) | $ | 0 | $ | 0 | $ | 0 | ||||||
| Adjust for Change in Fair Value as of Vesting Date of Option Awards and Stock Awards Granted in Prior Fiscal Years For Which Applicable Vesting Conditions Were Satisfied During Fiscal Year(c) | $ | 343,841 | $ | 0 | $ | (29,564 | ) | |||||
| Subtract Fair Value as of Prior Fiscal Year-End of Option Awards and Stock Awards Granted in Prior Fiscal Years That Failed to Meet Applicable Vesting Conditions During Fiscal Year | $ | (1,466,243 | ) | $ | 0 | $ | 0 | |||||
| Add Value of Dividends or other Earnings Paid on Stock or Option Awards not Otherwise Reflected in Fair Value or Total Compensation | $ | 0 | $ | 0 | $ | 0 | ||||||
| Compensation Actually Paid | $ | 2,826,148 | $ | 5,536,145 | $ | 2,200,363 | ||||||
_________________
| (a) | We have not reported any amounts in our Summary Compensation Table with respect to “Change in Pension and Nonqualified Deferred Compensation” and, accordingly, the adjustments with respect to such items prescribed by the PvP Rules are not relevant to our analysis and no adjustments have been made. |
| (b) | The amounts reflect the aggregate grant-date fair value reported in the “Stock Awards” and “Option Awards” columns in the Summary Compensation Table for the applicable year. |
| (c) | In accordance with PvP Rules, the fair values of unvested and outstanding equity awards to our NEOs were remeasured as of the end of each fiscal year, and as of each vesting date, during the years displayed in the table above. The assumptions used for determining the fair values shown in this table do not differ materially from those used to determine the fair values disclosed as of the grant date of such awards. |
PSUs with Market Conditions: The range of estimates for performance-based awards with market conditions are as follows:
| Assumption | 2025 | |
| Volatility | 95.59% - 102.37% | |
| Dividend Yield | 0% | |
| Risk-Free Rate | 3.41% - 3.42% |
| (8) | This figure is the average of the total compensation paid to our NEOs other than our PEO in each listed year, as shown in our Summary Compensation Table for such listed year. The names of the non-PEO NEOs in each year are listed in the table below. |
| 2021-2022 Non-PEO NEOs | 2023 Non-PEO NEOs | 2024 Non-PEO NEO | 2025 Non-PEO NEOs | |||
| Liyuan Woo | Liyuan Woo | Michael Monahan | Michael Monahan | |||
| Indra Parmamull | Michael Monahan | Daniel Watson | Ron Menezes | |||
| Daniel Watson | Daniel Watson | Brad Hauser | Sheri Lewis | |||
| Stephan Becker | Brad Hauser |
_________________
| (9) | This figure is the average of compensation actually paid for our NEOs other than our PEO in each listed year. Compensation actually paid does not mean that these NEOs were actually paid those amounts in the listed year, but this is a dollar amount derived from the starting point of Summary Compensation Table total compensation under the methodology prescribed under the SEC’s rules as shown in the table above in Footnote (7), with the indicated figures showing an average of such figure for all NEOs other than our PEO in each listed year. |
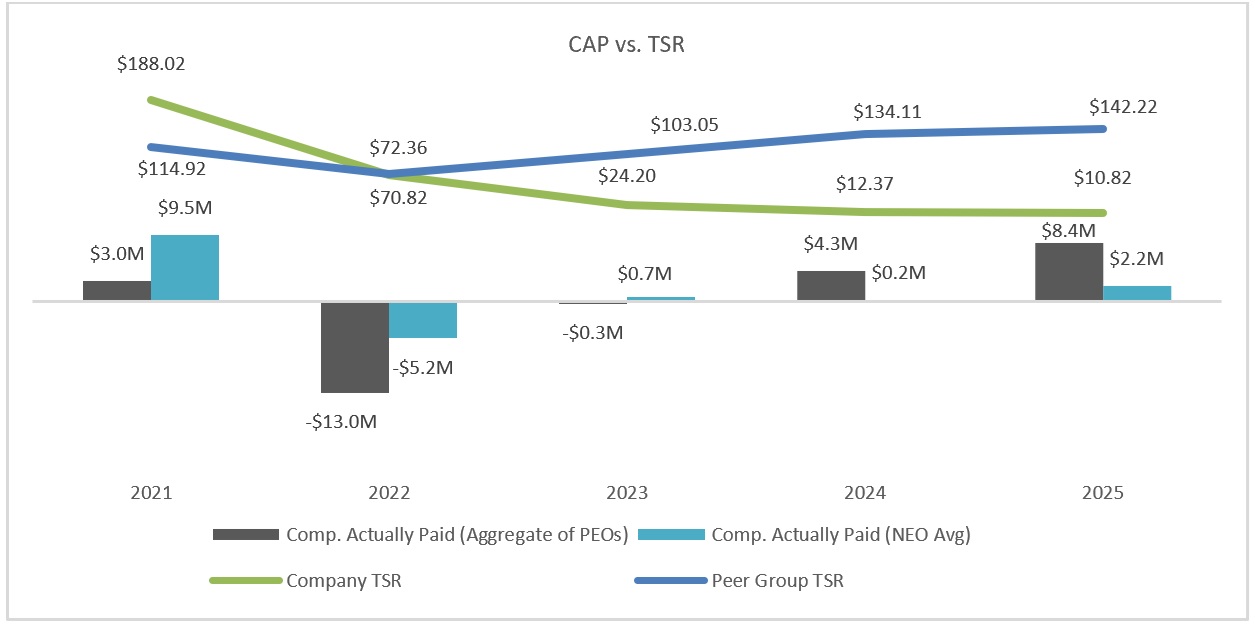
The following chart shows the relationship between Compensation Actually Paid to our PEO and Average Compensation Actually Paid to our Other NEOs and our TSR, as well as the relationship between our TSR and the TSR of our peer group.
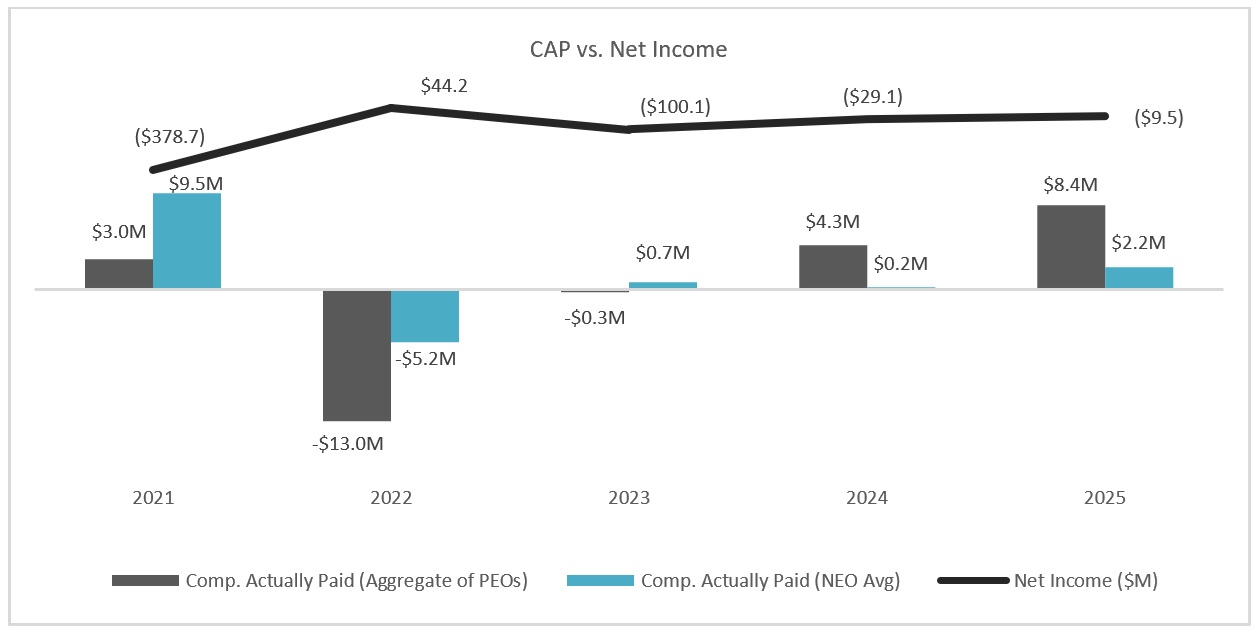
Relationship between Compensation Actually Paid (CAP) for PEO and NEOs (Average) vs. Net Income
The following chart shows the relationship between Compensation Actually Paid to our PEO and Average Compensation Actually Paid to our Other NEOs and Net Income.
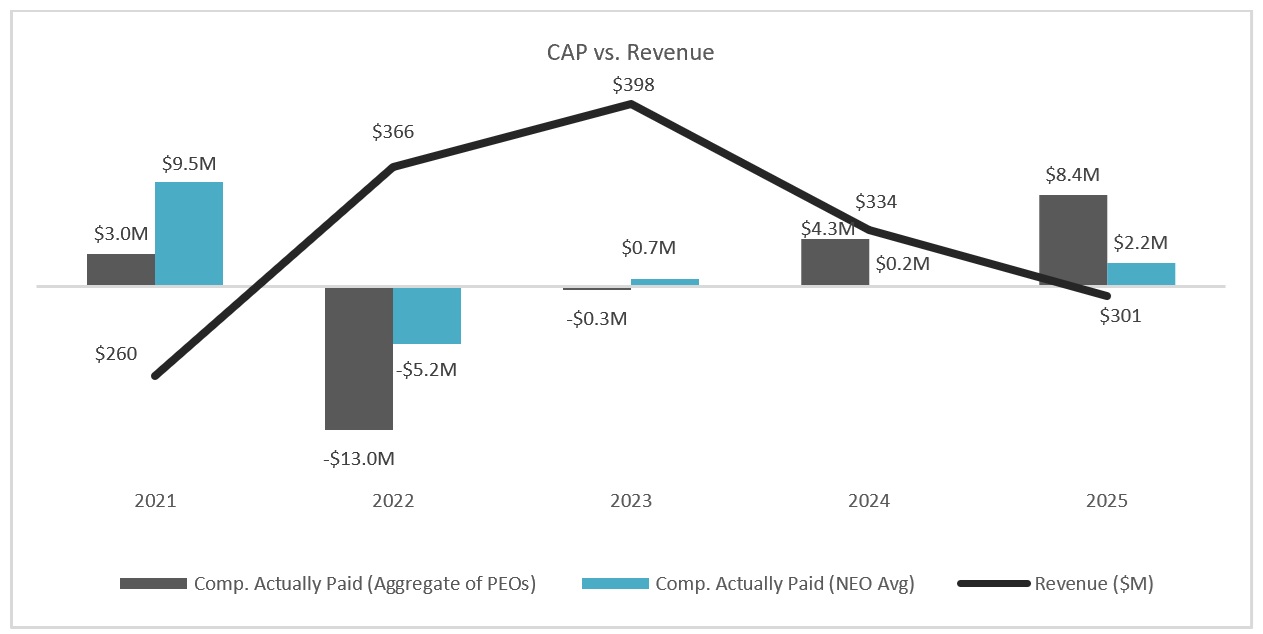
Relationship between Compensation Actually Paid (CAP) for PEO and NEOs (Average) vs. Revenue
The following chart shows the relationship between Compensation Actually Paid to our PEO and Average Compensation Actually Paid to our Other NEOs and Revenue.
Most Important Company Performance Measures for Determining Executive Compensation
Item 402(v) of Regulation S-K also requires that we provide the following tabular list of at least three and not more than seven financial performance measures that we have determined are our most important financial performance measures used to link compensation actually paid to our NEOs for the most recently completed fiscal year to the Company’s performance. These financial performance measures are:
| · | Revenue; | |
| · | Adjusted EBITDA; and | |
| · | TSR |