Pay vs Performance Disclosure - USD ($)
|
12 Months Ended |
Dec. 28, 2025 |
Dec. 29, 2024 |
Dec. 31, 2023 |
Jan. 01, 2023 |
Jan. 02, 2022 |
| Pay vs Performance Disclosure |
|
|
|
|
|
| Pay vs Performance Disclosure, Table |
| | | | | | | | | | | | | | | | | | | | | | | | | | | | | | | | | | | | | | | | | | | Value of Initial Fixed $100 Investment Based on: | | | | | | | | | | | | | | | | | Fiscal Year | SCT Total for Dr. Talluri - PEO ($)(1) | Compensation Actually Paid to Dr. Talluri ($)(2) | SCT Total for Mr. Rust -Former PEO ($)(1) | Compensation Actually Paid to Mr. Rust ($)(2)(9) | Average SCT Total for Non-PEO NEOs ($)(3) | Average Compensation Actually Paid to Non-PEO NEOs ($)(4)(9) | Total Shareholder Return ($)(5) | Peer Group Total Shareholder Return ($)(6) | Net Loss ($ in Thousands)(7) | Revenue ($ in Thousands)(8) | | | | | | | | | | | | | | 2025 | 7,996,489 | | 1,395,681 | | — | | — | | 3,868,407 | | 2,857,183 | | 37 | | 126 | | (156,607) | | 31,821 | | | 2024 | 11,452,248 | | 7,430,266 | | — | | — | | 3,906,121 | | 3,092,758 | | 55 | | 88 | | (222,534) | | 23,074 | | | 2023 | 17,002,557 | | 25,902,557 | | 12,065,920 | | 6,141,312 | | 3,590,308 | | 1,541,128 | | 61 | | 74 | | (214,132) | | 7,644 | | | 2022 | — | | — | | 2,447,077 | | (18,985,675) | | 5,880,518 | | 743,504 | | 61 | | 73 | | (51,622) | | 6,202 | | | 2021 | — | | — | | 6,093,656 | | 42,373,070 | | 2,081,139 | | 16,282,851 | | 134 | | 113 | | (125,874) | | — | | |
|
|
|
|
|
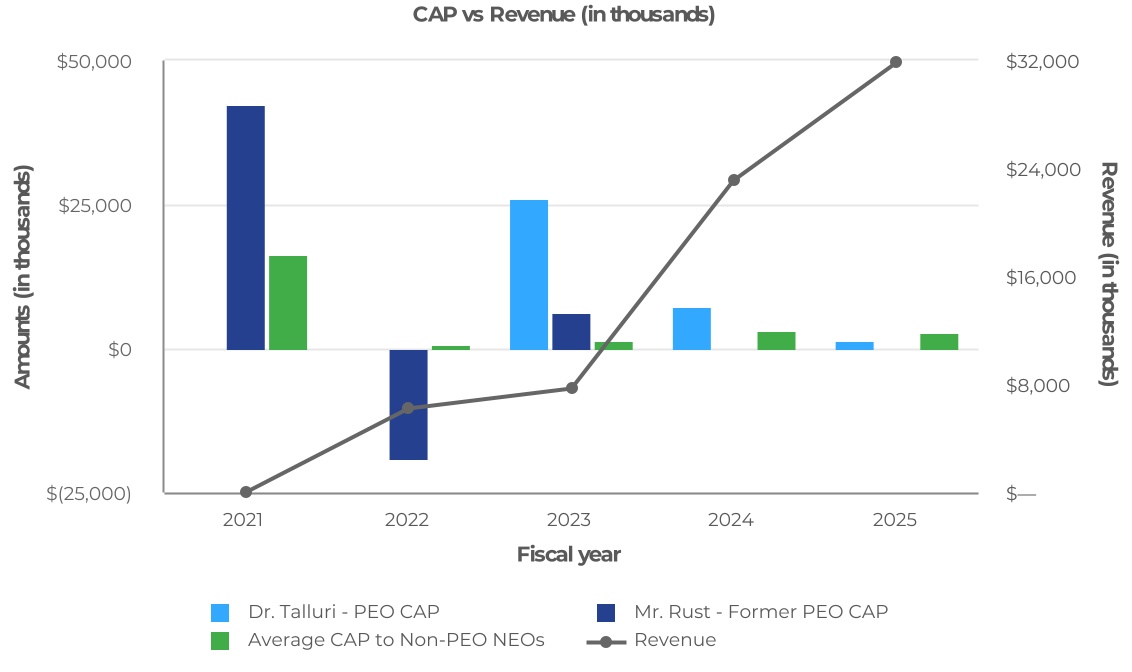
| Company Selected Measure Name |
Revenue
|
|
|
|
|
| Named Executive Officers, Footnote |
The amounts reported in this column are the total compensation amounts reported for each individual who served as our CEO (our principal executive officer or “PEO”), for each fiscal year in the “Total” column of the Summary Compensation Table (“SCT”). Dr. Talluri has served as our PEO during fiscal years 2025, 2024, and a part of fiscal year 2023. Mr. Rust served as our PEO during a part of fiscal year 2023 and all of fiscal years 2022 and 2021. Please refer to “Executive Compensation Tables - Summary Compensation Table” for additional information.The amounts reported in this column are the average amounts reported for our NEOs as a group (excluding our PEO) in the “Total” column of the SCT for each fiscal year. For each of the following fiscal years, our non-PEO NEOs consisted of: (a) 2025: Messrs. Benton, Marathe and Ms. Chakravarthy; (b) 2024: Messrs. Ahmad, Marathe and Ms. Chakravarthy; (c) 2023: Messrs. Ahmad, Marathe, Pietzke, Lahiri, Schmitt and Ms. Chakravarthy; (d) 2022: Messrs. Pietzke, Marathe, Hejlek and Lahiri; and (e) 2021: Messrs. Pietzke and Lahiri.
|
|
|
|
|
| Peer Group Issuers, Footnote |
The amounts reported in this column represent the weighted cumulative value of the peer group’s TSR for each period reported. The peer group used for this purpose is the same peer group used in the review of our executive compensation. Please refer to “Compensation Discussion and Analysis—Other Aspects of Executive Compensation—Peer Group” for the names of the peer companies and other information. In our proxy statement last year, the peer group used was the peer group disclosed in our “Compensation Discussion and Analysis” section of the proxy statement.
|
|
|
|
|
| Adjustment To PEO Compensation, Footnote |
The amounts reported in this column represent the “compensation actually paid” (“CAP”) to Dr. Talluri and Mr. Rust for each fiscal year when they served as our PEO, as computed in accordance with Item 402(v) of Regulation S-K. The amounts do not reflect the actual amount of compensation earned by or paid to each PEO during such fiscal years and are based on valuation assumptions required by the SEC, which are unlikely to reflect actual amounts realized at vesting or exercise (as applicable). In accordance with the requirements of Item 402(v) of Regulation S-K, the following table shows the adjustments to the reported “Total” in the SCT to derive the CAP amount for the years presented below. Amounts for fiscal year 2024 have been revised to correct an administrative error identified in the current year and are presented as restated. | | | | | | | | | | | | | | | | | | | | | | | | | 2025 | 2024 | | | | | | | | | | SCT Total for Dr. Talluri - PEO | $7,996,489 | $11,452,248 | | | Less: | | Reported value in SCT “Stock Awards” column | (6,999,998) | | (10,420,816) | | | | | | | | | | | Plus: | | Fair value at fiscal year-end of outstanding and unvested of equity awards granted in the fiscal year | 5,532,586 | | 8,341,139 | | | | Plus: | | Change in fair value of outstanding and unvested equity awards granted in prior fiscal years | (6,144,843) | | (1,529,334) | | | | Plus: | | Fair value at vesting of equity awards granted and vested in the fiscal year | 1,202,024 | | 1,660,358 | | | | Plus: | | Change in fair value as of the vesting date of equity awards granted in prior fiscal years that vested in the fiscal year | (190,576) | | (2,073,328) | | | | | | | | | | | | | | | | | | | | | | | | | CAP to Dr. Talluri - PEO | $1,395,681 | $7,430,266 | |
|
|
|
|
|
| Non-PEO NEO Average Total Compensation Amount |
$ 3,868,407
|
$ 3,906,121
|
$ 3,590,308
|
$ 5,880,518
|
$ 2,081,139
|
| Non-PEO NEO Average Compensation Actually Paid Amount |
$ 2,857,183
|
3,092,758
|
1,541,128
|
743,504
|
16,282,851
|
| Adjustment to Non-PEO NEO Compensation Footnote |
The amounts reported in this column represent the average amount of the CAP to our non-PEO NEOs for fiscal years 2021 through 2025, as computed in accordance with Item 402(v) of Regulation S-K. The amounts do not reflect the actual average amount of compensation earned by or paid to our non-PEO NEOs during such fiscal years and are based on valuation assumptions required by the SEC, which are unlikely to reflect actual amounts realized at vesting or exercise (as applicable). In accordance with the requirements of Item 402(v) of Regulation S-K, the following table shows the adjustments to the reported “Total” in the SCT to derive the CAP amount for the years presented below. Amounts for fiscal year 2024 have been revised to correct an administrative error identified in the current year and are presented as restated. | | | | | | | | | | | | | | | | | | | | | | | | | | | | | 2025 | 2024 | | | | | | | | | | | | | | | | | | SCT Average Total for Non-PEO NEOs | $3,868,407 | $3,906,121 | | | | | | | Less: | | Reported value in SCT “Stock Awards” column | (3,333,325) | | (3,313,316) | | | | | | | | | | | | | | | | | | | Plus: | | Fair value at fiscal year-end of outstanding and unvested of equity awards granted in the fiscal year | 3,137,670 | | 2,439,209 | | | | | | | | Plus: | | Change in fair value of outstanding and unvested equity awards granted in prior fiscal years | (1,117,712) | | (330,019) | | | | | | | | Plus: | | Fair value at vesting of equity awards granted and vested in the fiscal year | 327,868 | | 566,046 | | | | | | | | Plus: | | Change in fair value as of the vesting date of equity awards granted in prior fiscal years that vested in the fiscal year | (25,724) | | (175,284) | | | | | | | | | | | | | | | | | | | | | | | | | | | | | | | | | | | | | | | | | Average CAP to Non-PEO NEOs | $2,857,183 | $3,092,758 | | | | | |
|
|
|
|
|
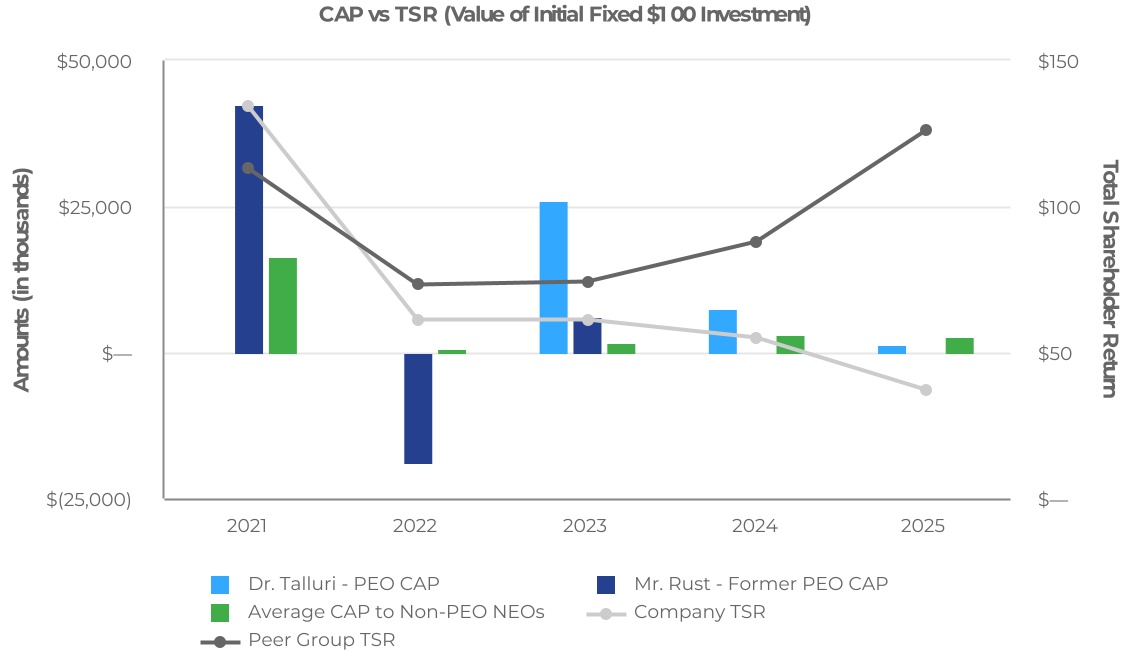
| Compensation Actually Paid vs. Total Shareholder Return |
CAP versus Cumulative Total Shareholder Return
|
|
|
|
|
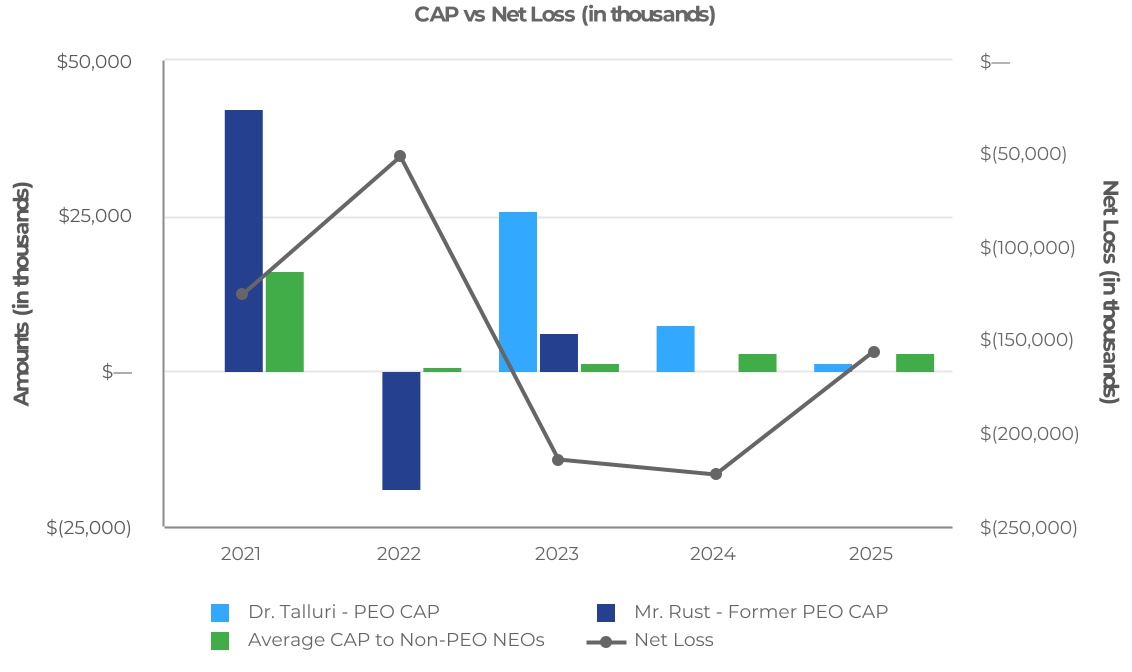
| Compensation Actually Paid vs. Net Income |
CAP versus Net Loss
|
|
|
|
|
| Compensation Actually Paid vs. Company Selected Measure |
CAP versus Revenue
|
|
|
|
|
| Total Shareholder Return Vs Peer Group |
CAP versus Cumulative Total Shareholder Return
|
|
|
|
|
| Tabular List, Table |
| | | | Performance Matrix | | Revenue | Operating expenses | Capital expenditures |
|
|
|
|
|
| Total Shareholder Return Amount |
$ 37
|
55
|
61
|
61
|
134
|
| Peer Group Total Shareholder Return Amount |
126
|
88
|
74
|
73
|
113
|
| Net Income (Loss), Including Portion Attributable to Noncontrolling Interest |
$ (156,607,000)
|
$ (222,534,000)
|
$ (214,132,000)
|
$ (51,622,000)
|
$ (125,874,000)
|
| Company Selected Measure Amount |
31,821,000
|
23,074,000
|
7,644,000
|
6,202,000
|
0
|
| PEO Name |
Dr. Talluri
|
|
|
|
|
| Additional 402(v) Disclosure |
As required by Section 953(a) of the Dodd-Frank Wall Street Reform and Consumer Protection Act and Item 402(v) of Regulation S-K, the table below includes information to demonstrate the relationship between NEO compensation and certain financial performance measures for fiscal years 2021 through 2025. For additional information about our performance-based pay philosophy and how we align executive compensation with our performance, refer to the “Compensation Discussion and Analysis” in this Proxy Statement. Our total shareholder return (“TSR”) represents the cumulative value of $100 as of end of each fiscal year presented if such amount were invested in our common stock at the market close on July 14, 2021 (the date of our common stock began trading on the Nasdaq Global Select Market under the symbol “ENVX”).The amounts reported in this column represent the net loss reported in our Annual Report on the Form 10-K for the applicable fiscal year.While we use a number of financial and non-financial performance measures for the purpose of evaluating performance for our compensation programs, we determined that revenue is the key financial performance measure used by us to link compensation actually paid to our NEOs to our performance. The amounts reported in this column represent the revenue reported in our Annual Report on the Form 10-K for the applicable fiscal year.The fair values of RSUs, PRSUs, and stock options included in the CAP to our PEOs and the average CAP to our Non-PEO NEOs are calculated at the required measurement dates, consistent with the approach used to value the awards at the grant date as described in our Annual Report on Form 10-K for the fiscal year ended December 28, 2025. Any changes to the RSU and PRSU fair values from the grant date (for current year grants) and from prior year-end (for prior year grants) are based on our updated stock price at the respective measurement dates and updated performance metric projections (for PRSUs). Changes to the stock option fair values are based on the updated stock price at the respective measurement dates, in addition to updated expected option term, implied volatility of our stock over the updated expected option term, and risk-free rate assumptions. For all years presented, the meaningful increases or decreases in the year-end stock option fair value from the fair value on the grant date were primarily driven by changes in the stock price.
|
|
|
|
|
| Measure:: 1 |
|
|
|
|
|
| Pay vs Performance Disclosure |
|
|
|
|
|
| Name |
Revenue
|
|
|
|
|
| Measure:: 2 |
|
|
|
|
|
| Pay vs Performance Disclosure |
|
|
|
|
|
| Name |
Operating expenses
|
|
|
|
|
| Measure:: 3 |
|
|
|
|
|
| Pay vs Performance Disclosure |
|
|
|
|
|
| Name |
Capital expenditures
|
|
|
|
|
| Dr. Talluri [Member] |
|
|
|
|
|
| Pay vs Performance Disclosure |
|
|
|
|
|
| PEO Total Compensation Amount |
$ 7,996,489
|
$ 11,452,248
|
$ 17,002,557
|
|
|
| PEO Actually Paid Compensation Amount |
1,395,681
|
7,430,266
|
25,902,557
|
|
|
| Mr. Rust [Member] |
|
|
|
|
|
| Pay vs Performance Disclosure |
|
|
|
|
|
| PEO Total Compensation Amount |
|
|
12,065,920
|
$ 2,447,077
|
$ 6,093,656
|
| PEO Actually Paid Compensation Amount |
|
|
$ 6,141,312
|
$ (18,985,675)
|
$ 42,373,070
|
| PEO | Dr. Talluri [Member] | Aggregate Grant Date Fair Value of Equity Award Amounts Reported in Summary Compensation Table |
|
|
|
|
|
| Pay vs Performance Disclosure |
|
|
|
|
|
| Adjustment to Compensation, Amount |
(6,999,998)
|
(10,420,816)
|
|
|
|
| PEO | Dr. Talluri [Member] | Year-end Fair Value of Equity Awards Granted in Covered Year that are Outstanding and Unvested |
|
|
|
|
|
| Pay vs Performance Disclosure |
|
|
|
|
|
| Adjustment to Compensation, Amount |
5,532,586
|
8,341,139
|
|
|
|
| PEO | Dr. Talluri [Member] | Year-over-Year Change in Fair Value of Equity Awards Granted in Prior Years That are Outstanding and Unvested |
|
|
|
|
|
| Pay vs Performance Disclosure |
|
|
|
|
|
| Adjustment to Compensation, Amount |
(6,144,843)
|
(1,529,334)
|
|
|
|
| PEO | Dr. Talluri [Member] | Vesting Date Fair Value of Equity Awards Granted and Vested in Covered Year |
|
|
|
|
|
| Pay vs Performance Disclosure |
|
|
|
|
|
| Adjustment to Compensation, Amount |
1,202,024
|
1,660,358
|
|
|
|
| PEO | Dr. Talluri [Member] | Change in Fair Value as of Vesting Date of Prior Year Equity Awards Vested in Covered Year |
|
|
|
|
|
| Pay vs Performance Disclosure |
|
|
|
|
|
| Adjustment to Compensation, Amount |
(190,576)
|
(2,073,328)
|
|
|
|
| Non-PEO NEO | Aggregate Grant Date Fair Value of Equity Award Amounts Reported in Summary Compensation Table |
|
|
|
|
|
| Pay vs Performance Disclosure |
|
|
|
|
|
| Adjustment to Compensation, Amount |
(3,333,325)
|
(3,313,316)
|
|
|
|
| Non-PEO NEO | Year-end Fair Value of Equity Awards Granted in Covered Year that are Outstanding and Unvested |
|
|
|
|
|
| Pay vs Performance Disclosure |
|
|
|
|
|
| Adjustment to Compensation, Amount |
3,137,670
|
2,439,209
|
|
|
|
| Non-PEO NEO | Year-over-Year Change in Fair Value of Equity Awards Granted in Prior Years That are Outstanding and Unvested |
|
|
|
|
|
| Pay vs Performance Disclosure |
|
|
|
|
|
| Adjustment to Compensation, Amount |
(1,117,712)
|
(330,019)
|
|
|
|
| Non-PEO NEO | Vesting Date Fair Value of Equity Awards Granted and Vested in Covered Year |
|
|
|
|
|
| Pay vs Performance Disclosure |
|
|
|
|
|
| Adjustment to Compensation, Amount |
327,868
|
566,046
|
|
|
|
| Non-PEO NEO | Change in Fair Value as of Vesting Date of Prior Year Equity Awards Vested in Covered Year |
|
|
|
|
|
| Pay vs Performance Disclosure |
|
|
|
|
|
| Adjustment to Compensation, Amount |
$ (25,724)
|
$ (175,284)
|
|
|
|