Pay vs Performance Disclosure - USD ($)
Dec. 31, 2025
Dec. 31, 2024
Dec. 31, 2023
Dec. 31, 2022
Dec. 31, 2021
PAY-VERSUS-PERFORMANCE DISCLOSURE
As required by Item 402(v) of Regulation S-K, we are providing the following information about the relationship between the executive compensation actually paid to our named executive officers (“NEOs”) and certain aspects of our financial performance. For further information concerning our pay for performance philosophy and how we align executive compensation with our performance, please refer to the section titled “Executive Compensation.”
Pay-Versus-Performance Table
Year | Summary Compensation Table Total for PEO(1) | Compensation Actually Paid to PEO(2) | Average Summary Compensation Table Total for Non-PEO NEOs(3) | Average Compensation Actually Paid to Non-PEO NEOs(4) | Value of Initial Fixed $100 Investment Based On: | Net Income (in thousands) | Company- Selected Measure - Revenue(7) (in thousands) | |||||||||||||||||
Total Shareholder Return(5) | Peer Group Total Shareholder Return(6) | |||||||||||||||||||||||
(a) | (b) | (c) | (d) | (e) | (f) | (g) | (h) | (i) | ||||||||||||||||
2025 | $5,120,061 | $3,643,672 | $1,778,768 | $1,402,736 | $26.92 | $113.99 | ($66,539) | $201,493 | ||||||||||||||||
2024 | $ 6,084,671 | $4,403,140 | $1,676,280 | $1,003,204 | $34.59 | $85.43 | ($6,020) | $200,453 | ||||||||||||||||
2023 | $4,939,242 | $3,723,202 | $2,036,220 | $1,551,529 | $48.61 | $85.92 | ($12,148) | $193,015 | ||||||||||||||||
2022 | $3,914,142 | $1,934,488 | $1,449,105 | $552,405 | $54.42 | $82.14 | $2,484 | $164,036 | ||||||||||||||||
2021 | $4,818,502 | ($130,465) | $2,588,657 | $126,586 | $86.99 | $91.40 | $3,027 | $127,950 | ||||||||||||||||
(1) | The dollar amounts reported in column (b) represent the amount of total compensation reported for Wenbin Jiang, Ph.D., our Chief Executive Officer, for each covered year in the “Total” column of the Summary Compensation Table. Please refer to “Executive Compensation—Summary Compensation Table.” |
(2) | The dollar amounts reported in column (c) represent the amount of “executive compensation actually paid” to Dr. Jiang, as computed in accordance with Item 402(v) of Regulation S-K for each covered year. The dollar amounts do not reflect the actual amount of compensation earned by or paid to Dr. Jiang during the applicable year. In accordance with the requirements of Item 402(v) of Regulation S-K, the following adjustments were made to Dr. Jiang’s total compensation for each year to determine the executive compensation actually paid: |
Year | Reported Summary Compensation Table Total for PEO | Reported Value of Equity Awards(a) | Equity Award Adjustments(b) | Compensation Actually Paid to PEO | ||||||||
2025 | $5,120,061 | $4,000,000 | $2,523,611 | $3,643,672 | ||||||||
2024 | $6,084,671 | $4,999,990 | $3,318,459 | $4,403,140 | ||||||||
2023 | $4,939,242 | $4,000,000 | $2,783,961 | $3,723,202 | ||||||||
2022 | $3,914,142 | $2,949,937 | $970,283 | $1,934,488 | ||||||||
2021 | $4,818,502 | $4,250,000 | ($698,967) | ($130,465) | ||||||||
(a) | The grant date fair value of equity awards represents the total of the amounts reported in the “Stock Awards” and “Option Awards” columns in the Summary Compensation Table for each covered fiscal year. Please refer to “Executive Compensation—Summary Compensation Table.” |
(b) | The equity award adjustments for each covered year include the addition (or subtraction, as applicable) of the following: (i) the year-end fair value of any equity awards granted in the covered year that are outstanding and unvested as of the end of the covered year; (ii) the amount equal to the change as of the end of the covered year (from the end of the prior year) in fair value of any equity awards granted in prior years that are outstanding and unvested as of the end of the covered year; (iii) for equity awards that are granted and vest in same covered year, the fair value as of the vesting date; (iv) for equity awards granted in prior years that vest in the covered year, the amount equal to the change as of the vesting date (from the end of the prior year) in fair value; and (v) for equity awards granted in prior years that are determined to fail to meet the applicable vesting conditions during the covered year, a deduction for the amount equal to the fair value at the end of the prior year. The amounts deducted or added in calculating the equity award adjustments are as follows: |
Year | Year End Fair Value of Outstanding and Unvested Equity Awards Granted in Year | Year over Year Change in Fair Value of Outstanding and Unvested Equity Awards | Fair Value as of Vesting Date of Equity Awards Granted and Vested in Year | Year over Year Change in Fair Value of Equity Awards Granted in Prior Years that Vested in Year | Fair Value at End of Prior Year of Equity Awards that Failed to Meet Vesting Conditions in Year | Value of Dividends or other Earnings Paid on Stock or Option Awards not Otherwise Reflected in Fair Value or Total Compensation | Total Equity Award Adjustments | ||||||||||||||
2025 | $3,740,952 | ($1,004,173) | $667,911 | ($881,080) | — | — | $2,523,611 | ||||||||||||||
2024 | $3,770,087 | ($718,741) | $748,652 | ($481,539) | — | — | $3,318,459 | ||||||||||||||
2023 | $2,725,385 | ($243,959) | $495,494 | ($192,959) | — | — | $2,783,961 | ||||||||||||||
2022 | $1,664,113 | ($920,384) | $575,505 | ($348,952) | — | — | $970,283 | ||||||||||||||
2021 | — | ($730,330) | — | $31,363 | — | — | ($698,967) | ||||||||||||||
(3) | The dollar amounts reported in column (d) represent the average of the amounts of total compensation reported for our NEOs as a group (excluding Dr. Jiang, who has served as our PEO since 2014) for each covered year in the “Total” column of the Summary Compensation Table for each such year. Please refer to “Executive Compensation—Summary Compensation Table.” The names of each named executive officer (excluding Dr. Jiang) included for purposes of calculating the average amounts of total compensation in each covered year are as follows: (i) for 2025, William McCombe, our Chief Financial Officer, Ming Yan, Ph.D., our Chief Technology Officer, Valerie Barnett, our Chief Legal Officer and Corporate Secretary; Philippe Busque, Ph.D., our Senior Vice President, Global Sales and Services; (ii) for 2024, William McCombe, our Chief Financial Officer, Ming Yan, Ph.D., our Chief Technology Officer, Valerie Barnett, our Chief Legal Officer and Corporate Secretary; Philippe Busque, Ph.D., our Senior Vice President, Global Sales and Services; Patrik Jeanmonod, our former Chief Financial Officer, and Chris Williams, our former Chief Operating Officer; (iii) for 2023, Ming Yan, Ph.D., our Chief Technology Officer, Valerie Barnett, our Chief Legal Officer and Corporate Secretary; Patrik Jeanmonod, our former Chief Financial Officer, and Allen Poirson, Ph.D., our Senior Vice President, Business and Corporate Development; (iv) for 2022, Ming Yan, Ph.D., our Chief Technology Officer, and Valerie Barnett, our Chief Legal Officer and Corporate Secretary; and (v) for 2021, Ming Yan, Ph.D., our Chief Technology Officer, and Patrik Jeanmonod, our former Chief Financial Officer. |
(4) | The dollar amounts reported in column (e) represent the average amount of “executive compensation actually paid” to our NEOs as a group (excluding Dr. Jiang), as computed in accordance with Item 402(v) of Regulation S-K for each covered fiscal year. The dollar amounts do not reflect the actual average amount of compensation earned by or paid to our NEOs as a group (excluding Dr. Jiang) during the applicable year. In accordance with the requirements of Item 402(v) of Regulation S-K, the following adjustments were made to the average total compensation for each year to determine the executive compensation actually paid, using the same methodology described above in Note 2(b): |
Year | Average Reported Summary Compensation Table Total for Non-PEO NEOs | Average Reported Value of Equity Awards for Non-PEO NEOs | Average Equity Award Adjustments for Non-PEO NEOs(a) | Average Compensation Actually Paid to Non-PEO NEOs | ||||||||
2025 | $1,778,768 | $1,162,500 | $786,468 | $1,402,736 | ||||||||
2024 | $1,676,280 | $1,191,659 | $518,583 | $1,003,204 | ||||||||
2023 | $2,036,220 | $1,462,500 | $977,809 | $1,551,529 | ||||||||
2022 | $1,449,105 | $872,483 | ($24,217) | $552,405 | ||||||||
2021 | $2,588,657 | $2,125,000 | ($337,071) | $126,586 | ||||||||
(a) | The amounts deducted or added in calculating the total average equity award adjustments are as follows: |
Year | Year End Fair Value of Outstanding and Unvested Equity Awards Granted in Year | Year over Year Average Change in Fair Value of Outstanding and Unvested Equity Awards | Average Fair Value as of Vesting Date of Equity Awards Granted and Vested in Year | Year over Year Average Change in Fair Value of Equity Awards Granted in Prior Years that Vested in the Year | Average Fair Value at the End of the Prior Year of Equity Awards that Failed to Meet Vesting Conditions in the Year | Average Value of Dividends or other Earnings Paid on Stock or Option Awards not Otherwise Reflected in Fair Value | Total Average Equity Award Adjustments | ||||||||||||||
2025 | $1,087,217 | ($255,311) | $194,105 | ($239,544) | — | — | $786,468 | ||||||||||||||
2024 | $704,521 | ($154,267) | $140,569 | ($117,472) | ($54,767) | — | $518,583 | ||||||||||||||
2023 | $996,475 | ($110,740) | $181,155 | ($89,081) | — | — | $977,809 | ||||||||||||||
2022 | $492,194 | ($485,224) | $170,198 | ($201,386) | — | — | ($24,217) | ||||||||||||||
2021 | — | ($418,573) | — | $81,502 | — | — | ($337,071) | ||||||||||||||
(5) | Cumulative total shareholder return is calculated by dividing the sum of the cumulative amount of dividends for the measurement period, assuming dividend reinvestment, and the difference between our share price at the end and the beginning of the measurement period by our share price at the beginning of the measurement period. |
(6) | Represents the weighted peer group total shareholder return, weighted according to the respective companies’ stock market capitalization at the beginning of each period for which a return is indicated. The peer group used for this purpose is the Nasdaq Biotechnology Total Return Index. The dollar amounts reported represent the amount of net income reflected in our audited financial statements for each covered year. |
(7) | While we use numerous financial and non-financial performance measures for the purpose of evaluating performance for our executive compensation program, we have determined that revenue is the financial performance measure that, in our assessment, represents the most important performance measure (that is not otherwise required to be disclosed in the table) used by us to link compensation actually paid to Dr. Jiang and our other NEOs to our performance for the most recently completed year. |
(1) | The dollar amounts reported in column (b) represent the amount of total compensation reported for Wenbin Jiang, Ph.D., our Chief Executive Officer, for each covered year in the “Total” column of the Summary Compensation Table. Please refer to “Executive Compensation—Summary Compensation Table.” |
(3) | The dollar amounts reported in column (d) represent the average of the amounts of total compensation reported for our NEOs as a group (excluding Dr. Jiang, who has served as our PEO since 2014) for each covered year in the “Total” column of the Summary Compensation Table for each such year. Please refer to “Executive Compensation—Summary Compensation Table.” The names of each named executive officer (excluding Dr. Jiang) included for purposes of calculating the average amounts of total compensation in each covered year are as follows: (i) for 2025, William McCombe, our Chief Financial Officer, Ming Yan, Ph.D., our Chief Technology Officer, Valerie Barnett, our Chief Legal Officer and Corporate Secretary; Philippe Busque, Ph.D., our Senior Vice President, Global Sales and Services; (ii) for 2024, William McCombe, our Chief Financial Officer, Ming Yan, Ph.D., our Chief Technology Officer, Valerie Barnett, our Chief Legal Officer and Corporate Secretary; Philippe Busque, Ph.D., our Senior Vice President, Global Sales and Services; Patrik Jeanmonod, our former Chief Financial Officer, and Chris Williams, our former Chief Operating Officer; (iii) for 2023, Ming Yan, Ph.D., our Chief Technology Officer, Valerie Barnett, our Chief Legal Officer and Corporate Secretary; Patrik Jeanmonod, our former Chief Financial Officer, and Allen Poirson, Ph.D., our Senior Vice President, Business and Corporate Development; (iv) for 2022, Ming Yan, Ph.D., our Chief Technology Officer, and Valerie Barnett, our Chief Legal Officer and Corporate Secretary; and (v) for 2021, Ming Yan, Ph.D., our Chief Technology Officer, and Patrik Jeanmonod, our former Chief Financial Officer. |
(6) | Represents the weighted peer group total shareholder return, weighted according to the respective companies’ stock market capitalization at the beginning of each period for which a return is indicated. The peer group used for this purpose is the Nasdaq Biotechnology Total Return Index. The dollar amounts reported represent the amount of net income reflected in our audited financial statements for each covered year. |
(2) | The dollar amounts reported in column (c) represent the amount of “executive compensation actually paid” to Dr. Jiang, as computed in accordance with Item 402(v) of Regulation S-K for each covered year. The dollar amounts do not reflect the actual amount of compensation earned by or paid to Dr. Jiang during the applicable year. In accordance with the requirements of Item 402(v) of Regulation S-K, the following adjustments were made to Dr. Jiang’s total compensation for each year to determine the executive compensation actually paid: |
Year | Reported Summary Compensation Table Total for PEO | Reported Value of Equity Awards(a) | Equity Award Adjustments(b) | Compensation Actually Paid to PEO | ||||||||
2025 | $5,120,061 | $4,000,000 | $2,523,611 | $3,643,672 | ||||||||
2024 | $6,084,671 | $4,999,990 | $3,318,459 | $4,403,140 | ||||||||
2023 | $4,939,242 | $4,000,000 | $2,783,961 | $3,723,202 | ||||||||
2022 | $3,914,142 | $2,949,937 | $970,283 | $1,934,488 | ||||||||
2021 | $4,818,502 | $4,250,000 | ($698,967) | ($130,465) | ||||||||
(a) | The grant date fair value of equity awards represents the total of the amounts reported in the “Stock Awards” and “Option Awards” columns in the Summary Compensation Table for each covered fiscal year. Please refer to “Executive Compensation—Summary Compensation Table.” |
(b) | The equity award adjustments for each covered year include the addition (or subtraction, as applicable) of the following: (i) the year-end fair value of any equity awards granted in the covered year that are outstanding and unvested as of the end of the covered year; (ii) the amount equal to the change as of the end of the covered year (from the end of the prior year) in fair value of any equity awards granted in prior years that are outstanding and unvested as of the end of the covered year; (iii) for equity awards that are granted and vest in same covered year, the fair value as of the vesting date; (iv) for equity awards granted in prior years that vest in the covered year, the amount equal to the change as of the vesting date (from the end of the prior year) in fair value; and (v) for equity awards granted in prior years that are determined to fail to meet the applicable vesting conditions during the covered year, a deduction for the amount equal to the fair value at the end of the prior year. The amounts deducted or added in calculating the equity award adjustments are as follows: |
Year | Year End Fair Value of Outstanding and Unvested Equity Awards Granted in Year | Year over Year Change in Fair Value of Outstanding and Unvested Equity Awards | Fair Value as of Vesting Date of Equity Awards Granted and Vested in Year | Year over Year Change in Fair Value of Equity Awards Granted in Prior Years that Vested in Year | Fair Value at End of Prior Year of Equity Awards that Failed to Meet Vesting Conditions in Year | Value of Dividends or other Earnings Paid on Stock or Option Awards not Otherwise Reflected in Fair Value or Total Compensation | Total Equity Award Adjustments | ||||||||||||||
2025 | $3,740,952 | ($1,004,173) | $667,911 | ($881,080) | — | — | $2,523,611 | ||||||||||||||
2024 | $3,770,087 | ($718,741) | $748,652 | ($481,539) | — | — | $3,318,459 | ||||||||||||||
2023 | $2,725,385 | ($243,959) | $495,494 | ($192,959) | — | — | $2,783,961 | ||||||||||||||
2022 | $1,664,113 | ($920,384) | $575,505 | ($348,952) | — | — | $970,283 | ||||||||||||||
2021 | — | ($730,330) | — | $31,363 | — | — | ($698,967) | ||||||||||||||
(4) | The dollar amounts reported in column (e) represent the average amount of “executive compensation actually paid” to our NEOs as a group (excluding Dr. Jiang), as computed in accordance with Item 402(v) of Regulation S-K for each covered fiscal year. The dollar amounts do not reflect the actual average amount of compensation earned by or paid to our NEOs as a group (excluding Dr. Jiang) during the applicable year. In accordance with the requirements of Item 402(v) of Regulation S-K, the following adjustments were made to the average total compensation for each year to determine the executive compensation actually paid, using the same methodology described above in Note 2(b): |
Year | Average Reported Summary Compensation Table Total for Non-PEO NEOs | Average Reported Value of Equity Awards for Non-PEO NEOs | Average Equity Award Adjustments for Non-PEO NEOs(a) | Average Compensation Actually Paid to Non-PEO NEOs | ||||||||
2025 | $1,778,768 | $1,162,500 | $786,468 | $1,402,736 | ||||||||
2024 | $1,676,280 | $1,191,659 | $518,583 | $1,003,204 | ||||||||
2023 | $2,036,220 | $1,462,500 | $977,809 | $1,551,529 | ||||||||
2022 | $1,449,105 | $872,483 | ($24,217) | $552,405 | ||||||||
2021 | $2,588,657 | $2,125,000 | ($337,071) | $126,586 | ||||||||
(a) | The amounts deducted or added in calculating the total average equity award adjustments are as follows: |
Year | Year End Fair Value of Outstanding and Unvested Equity Awards Granted in Year | Year over Year Average Change in Fair Value of Outstanding and Unvested Equity Awards | Average Fair Value as of Vesting Date of Equity Awards Granted and Vested in Year | Year over Year Average Change in Fair Value of Equity Awards Granted in Prior Years that Vested in the Year | Average Fair Value at the End of the Prior Year of Equity Awards that Failed to Meet Vesting Conditions in the Year | Average Value of Dividends or other Earnings Paid on Stock or Option Awards not Otherwise Reflected in Fair Value | Total Average Equity Award Adjustments | ||||||||||||||
2025 | $1,087,217 | ($255,311) | $194,105 | ($239,544) | — | — | $786,468 | ||||||||||||||
2024 | $704,521 | ($154,267) | $140,569 | ($117,472) | ($54,767) | — | $518,583 | ||||||||||||||
2023 | $996,475 | ($110,740) | $181,155 | ($89,081) | — | — | $977,809 | ||||||||||||||
2022 | $492,194 | ($485,224) | $170,198 | ($201,386) | — | — | ($24,217) | ||||||||||||||
2021 | — | ($418,573) | — | $81,502 | — | — | ($337,071) | ||||||||||||||
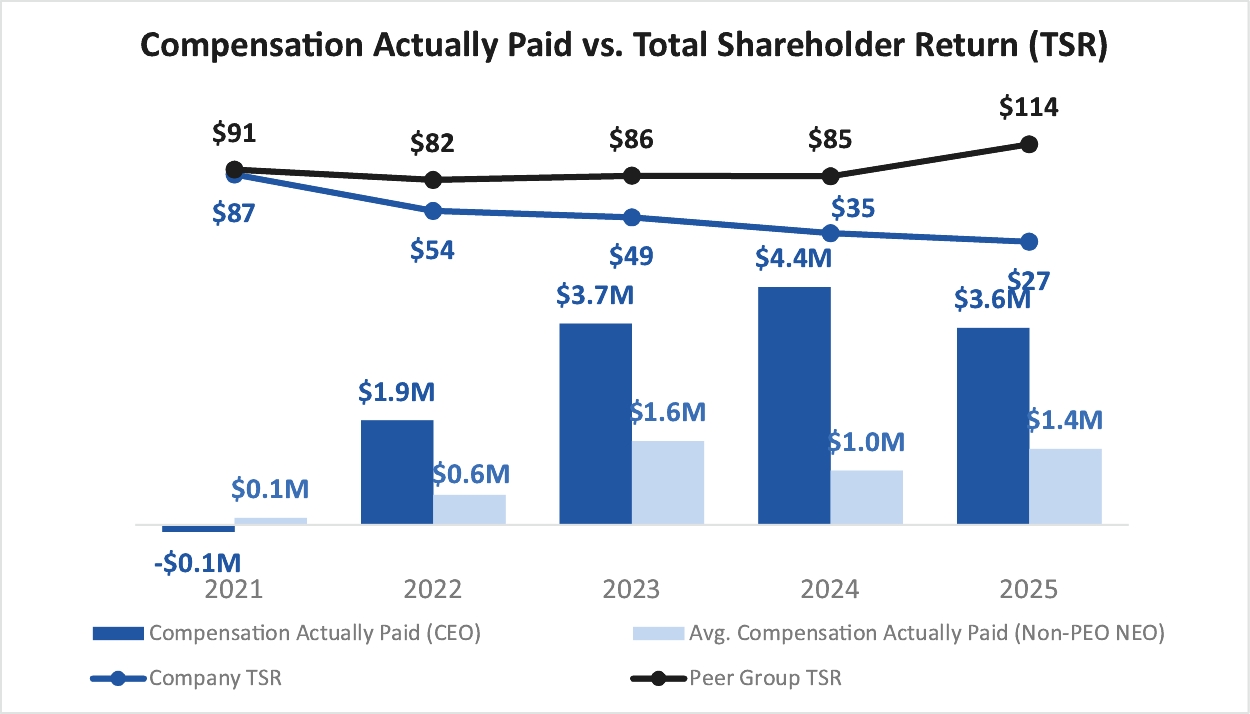
Compensation Actually Paid and Company/Peer Group Total Shareholder Return
As demonstrated by the following graph, the amount of compensation actually paid to Dr. Jiang, the average amount of compensation actually paid to our other NEOs as a group (except Dr. Jiang) and total shareholder return significantly decreased in 2025. The decrease in Dr. Jiang’s and our other NEOs as a group (except Dr. Jiang) was largely due to (a) a decrease in our stock price from the end of 2024 to the end of 2025, resulting in a decrease in the fair value of equity awards granted to our named executive officers in prior years, and (b) downward adjustments in the long-term equity awards paid to some of our named executive officers to better align with market data. Please see the section titled “Executive Compensation” for additional information regarding our executive compensation program for our NEOs.
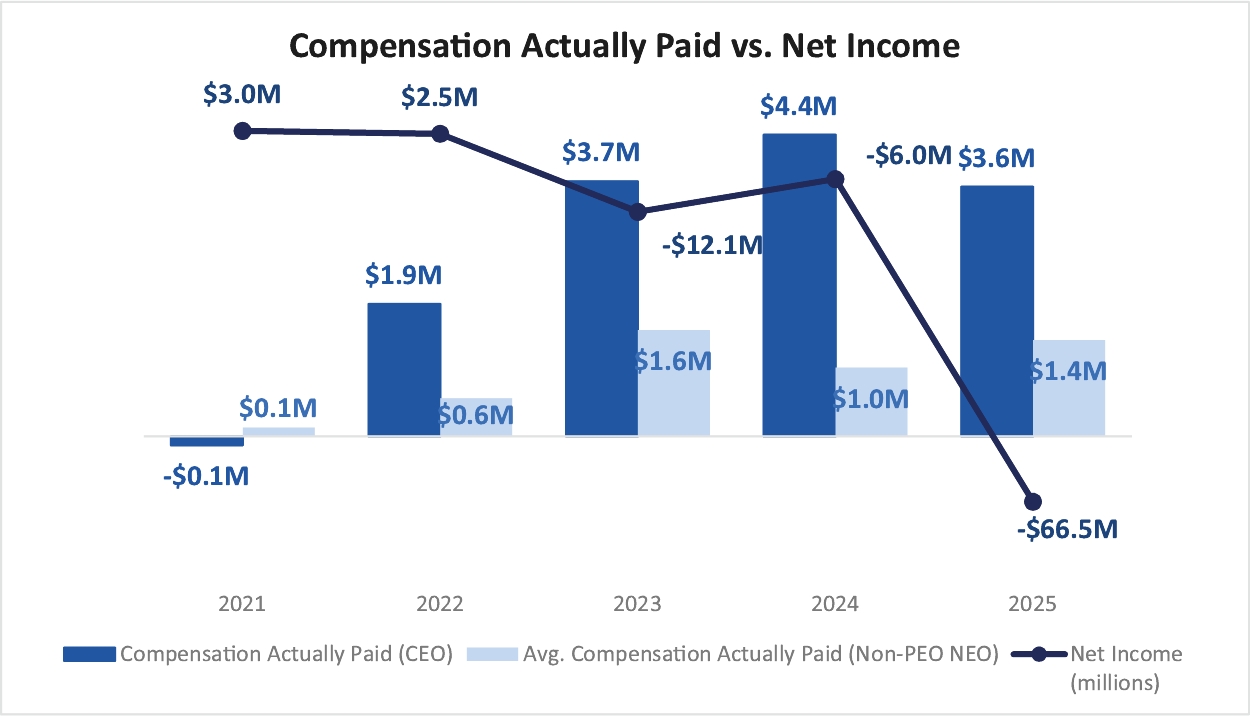
Compensation Actually Paid and Net Income
As reflected in the following graph, the amount of compensation actually paid to Dr. Jiang decreased in 2025 and the average amount of compensation actually paid to our other NEOs as a group (except Dr. Jiang) increased in 2025, while our net income decreased for that period resulting in a net loss. The decrease in Dr. Jiang’s compensation actually paid was largely due to a downward adjustment to his equity compensation in 2025 to better align with our peer group companies. The increase in compensation actually paid to our other NEOs as a group (except Dr. Jiang) was primarily due to an equity refresh grant to Mr. McCombe, our Chief Financial Officer, who was not eligible for such grant in 2024 due to the date of his commencement of employment with us in March 2024. The value of Mr. McCombe’s refresh grant was targeted to align with our peer group companies. Please see the section titled “Executive Compensation” for additional information regarding our executive compensation program, including long-term equity incentive awards for our NEOs.
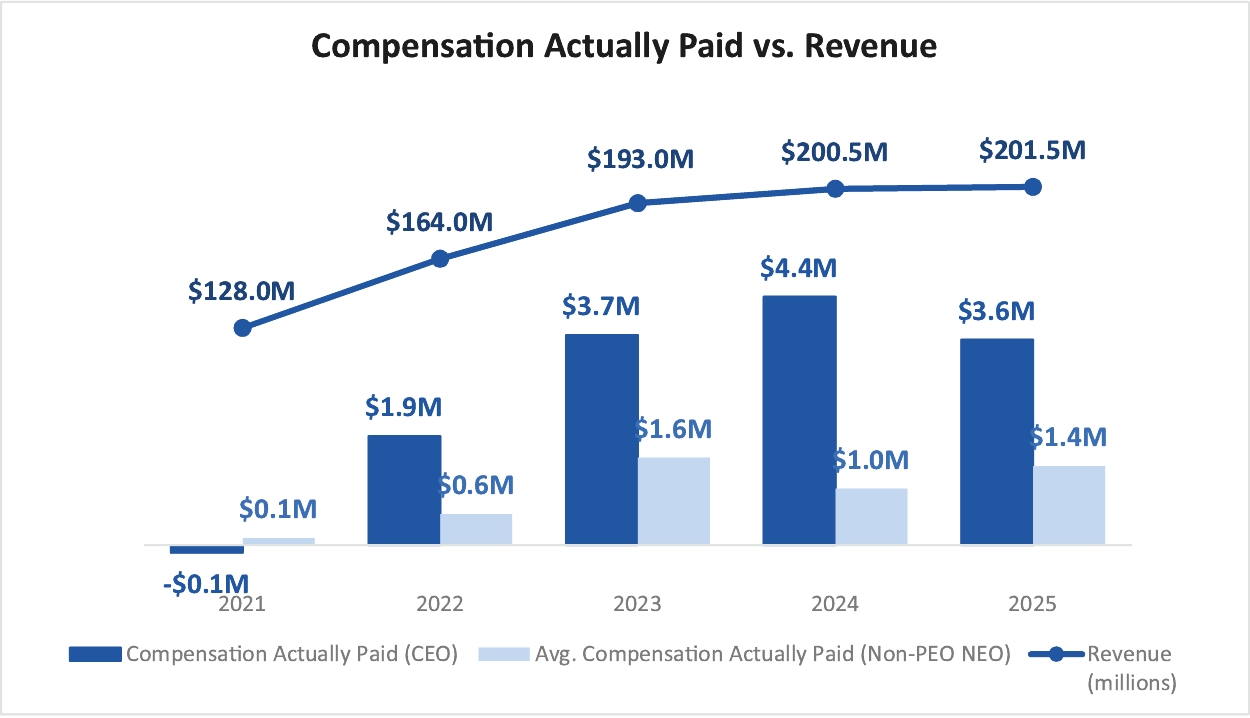
Compensation Actually Paid and Revenue
As demonstrated by the following graph, the amount of compensation actually paid to Dr. Jiang decreased in 2025 and our revenue modestly increased relative to 2024. This decrease in Dr. Jiang’s compensation actually paid in 2025 was largely due to (a) a decrease in our stock price from the end of 2024 to the end of 2025, resulting in a decrease in the fair value of equity awards granted to Dr. Jiang in prior years, and (b) downward adjustments in the long-term equity awards paid to Dr. Jiang to better align with market data. The average amount of compensation actually paid to our other NEOs as a group (except Dr. Jiang) increased in 2025 primarily due to an equity refresh grant to Mr. McCombe, our Chief Financial Officer, who was not eligible for such grant in 2024 due to the date of his commencement of employment with us in March 2024. The value of Mr. McCombe’s refresh grant was targeted to align with our peer group companies. While we use various financial and non-financial performance measures for the purpose of evaluating the effectiveness of our executive compensation program, we have determined that revenue is the financial performance measure that, in our assessment, represents the most important performance measure (that is not otherwise required to be disclosed in the Pay-Versus-Performance table) used by us to link compensation actually paid to Dr. Jiang and our other NEOs for the most recently completed year, to our financial performance. We use revenue when setting goals in our cash incentive bonus plan. Please see the section titled “Executive Compensation—Compensation Discussion and Analysis” for additional information regarding our executive compensation program, including our cash incentive bonus plan.
Compensation Actually Paid and Company/Peer Group Total Shareholder Return
As demonstrated by the following graph, the amount of compensation actually paid to Dr. Jiang, the average amount of compensation actually paid to our other NEOs as a group (except Dr. Jiang) and total shareholder return significantly decreased in 2025. The decrease in Dr. Jiang’s and our other NEOs as a group (except Dr. Jiang) was largely due to (a) a decrease in our stock price from the end of 2024 to the end of 2025, resulting in a decrease in the fair value of equity awards granted to our named executive officers in prior years, and (b) downward adjustments in the long-term equity awards paid to some of our named executive officers to better align with market data. Please see the section titled “Executive Compensation” for additional information regarding our executive compensation program for our NEOs.
Financial Performance Measures
For the most recently completed fiscal year, the financial performance measures used by us to link our performance to executive compensation actually paid to our Chief Executive Officer and other NEOs include:
Revenue
Adjusted EBITDA(1)
(1) | We define adjusted EBITDA as net income adjusted for depreciation and amortization, provision (benefit) for tax, interest income and expense, foreign currency exchange loss, stock-based compensation and certain non-recurring expenses. |
(b) | The equity award adjustments for each covered year include the addition (or subtraction, as applicable) of the following: (i) the year-end fair value of any equity awards granted in the covered year that are outstanding and unvested as of the end of the covered year; (ii) the amount equal to the change as of the end of the covered year (from the end of the prior year) in fair value of any equity awards granted in prior years that are outstanding and unvested as of the end of the covered year; (iii) for equity awards that are granted and vest in same covered year, the fair value as of the vesting date; (iv) for equity awards granted in prior years that vest in the covered year, the amount equal to the change as of the vesting date (from the end of the prior year) in fair value; and (v) for equity awards granted in prior years that are determined to fail to meet the applicable vesting conditions during the covered year, a deduction for the amount equal to the fair value at the end of the prior year. The amounts deducted or added in calculating the equity award adjustments are as follows: |
Year | Year End Fair Value of Outstanding and Unvested Equity Awards Granted in Year | Year over Year Change in Fair Value of Outstanding and Unvested Equity Awards | Fair Value as of Vesting Date of Equity Awards Granted and Vested in Year | Year over Year Change in Fair Value of Equity Awards Granted in Prior Years that Vested in Year | Fair Value at End of Prior Year of Equity Awards that Failed to Meet Vesting Conditions in Year | Value of Dividends or other Earnings Paid on Stock or Option Awards not Otherwise Reflected in Fair Value or Total Compensation | Total Equity Award Adjustments | ||||||||||||||
2025 | $3,740,952 | ($1,004,173) | $667,911 | ($881,080) | — | — | $2,523,611 | ||||||||||||||
2024 | $3,770,087 | ($718,741) | $748,652 | ($481,539) | — | — | $3,318,459 | ||||||||||||||
2023 | $2,725,385 | ($243,959) | $495,494 | ($192,959) | — | — | $2,783,961 | ||||||||||||||
2022 | $1,664,113 | ($920,384) | $575,505 | ($348,952) | — | — | $970,283 | ||||||||||||||
2021 | — | ($730,330) | — | $31,363 | — | — | ($698,967) | ||||||||||||||
(a) | The amounts deducted or added in calculating the total average equity award adjustments are as follows: |
Year | Year End Fair Value of Outstanding and Unvested Equity Awards Granted in Year | Year over Year Average Change in Fair Value of Outstanding and Unvested Equity Awards | Average Fair Value as of Vesting Date of Equity Awards Granted and Vested in Year | Year over Year Average Change in Fair Value of Equity Awards Granted in Prior Years that Vested in the Year | Average Fair Value at the End of the Prior Year of Equity Awards that Failed to Meet Vesting Conditions in the Year | Average Value of Dividends or other Earnings Paid on Stock or Option Awards not Otherwise Reflected in Fair Value | Total Average Equity Award Adjustments | ||||||||||||||
2025 | $1,087,217 | ($255,311) | $194,105 | ($239,544) | — | — | $786,468 | ||||||||||||||
2024 | $704,521 | ($154,267) | $140,569 | ($117,472) | ($54,767) | — | $518,583 | ||||||||||||||
2023 | $996,475 | ($110,740) | $181,155 | ($89,081) | — | — | $977,809 | ||||||||||||||
2022 | $492,194 | ($485,224) | $170,198 | ($201,386) | — | — | ($24,217) | ||||||||||||||
2021 | — | ($418,573) | — | $81,502 | — | — | ($337,071) | ||||||||||||||