Pay vs Performance Disclosure - USD ($)
|
12 Months Ended |
Dec. 31, 2025 |
Dec. 31, 2024 |
Dec. 31, 2023 |
| Pay vs Performance Disclosure |
|
|
|
| Pay vs Performance Disclosure, Table |
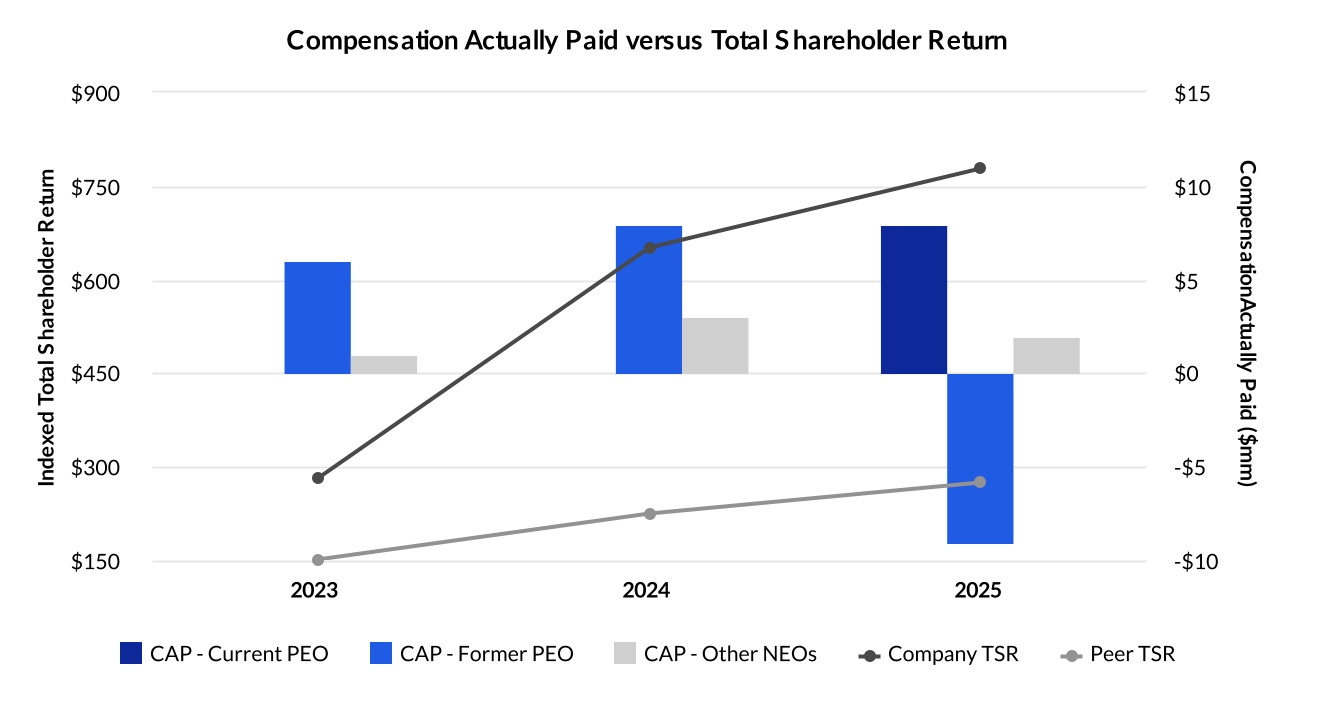
| | | | | | | | | | | | | | | | | | | | | | | | | | | | | | | | | | | | | Summary Compensation Table (SCT) Total for PEO | Compensation Actually Paid to PEO | | | Value of Initial Fixed $100 Investment Based On: | | | | | Fiscal Year | Current PEO(1) ($) | Former PEO(2) ($) | Current PEO(3) ($) | Former PEO ($) | Average Summary Compensation Table Total for Non-PEO NEOs(4) ($) | Average Compensation Actually Paid to Non-PEO NEOs(5) ($) | Total Shareholder Return(6) ($) | Peer Group Total Shareholder Return(7) ($) | Net Income (millions)(8) ($) | Revenue (millions)(9) ($) | | | (a) | (b) | | (c) | | (d) | (e) | (f) | (g) | (h) | (i) | | | | | | | | | | | | | | 2025 | 6,597,191 | 1,558,820 | 9,150,628 | (8,997,327) | 1,908,394 | 1,295,575 | 802 | 287 | (294) | 128 | | 2024 | — | 2,133,192 | — | 9,277,263 | 1,660,502 | 2,150,815 | 661 | 216 | (296) | 158 | | 2023 | — | 1,938,141 | — | 5,946,669 | 2,979,072 | 1,090,052 | 318 | 158 | (71) | 155 | | | | | | | | | | | | | | | | | | | | | | | | | |
|
|
|
| Named Executive Officers, Footnote |
Reflects compensation for our Chief Executive Officer, Kevin McAleenan, who served as our Principal Executive Officer (PEO) beginning January 15, 2025. Reflects compensation for our former Chief Executive Officer, Amanda Long, who served as our Principal Executive Officer (PEO) in 2023, 2024, through January 15, 2025.The dollar amounts reported in column (d) represent the average of the amounts reported for the Company’s NEOs as a group (excluding Mr. McAleenan, who has served as our Chief Executive Officer since 2025) in the “Total” column of the Summary Compensation Table in each applicable year. The names of each of the NEOs (excluding Mr. McAleenan) included for purposes of calculating the average amounts in each applicable year are as follows: (i) for 2025, Julie Peffer, Sean Ricker and Carolyn Blankenship; (ii) for 2024, Kevin McAleenan and Ted Tanner; (iii) for 2023, Norm Laudermilch and Ted Tanner.
|
|
|
| Adjustment To PEO Compensation, Footnote |
The dollar amounts reported in column (c) represent the amount of “compensation actually paid” to the PEO and other NEOs, as computed in accordance with Item 402(v) of Regulation S-K. The dollar amounts do not reflect the actual amount of compensation earned by or paid to the PEO or other NEOs during the applicable year. In accordance with the requirements of Item 402(v) of Regulation S-K, the following adjustments were made to the PEOs total compensation for 2025 to determine the compensation actually paid (adjustments for pension benefits are not covered, as the Company does not have any defined benefit or actuarial pension plans): | | | | | | | | | | | | | | | | | | | Fiscal Year | Reported Summary Compensation Table Total for PEO
($) | Reported Value
of Equity Awards(a)
($) | Equity Award Adjustments(b)
($) | Compensation Actually Paid to PEO
($) | | | | | | | | 2025 | 6,597,191 | (6,080,514) | 8,633,951 | 9,150,628 | |
a.The grant date fair value of equity awards represents the total of the amounts reported in the “Stock Awards” and “Option Awards” columns in the Summary Compensation Table for the applicable year. b.The equity award adjustments for each applicable year include the addition (or subtraction, as applicable) of the following: (i) the year-end fair value of any equity awards granted in the applicable year that are outstanding and unvested as of the end of the year; (ii) the amount of change as of the end of the applicable year (from the end of the prior fiscal year) in fair value of any awards granted in prior years that are outstanding and unvested as of the end of the applicable year; (iii) for awards that are granted and vest in the same applicable year, the fair value as of the vesting date; (iv) for awards granted in prior years that vest in the applicable year, the amount equal to the change as of the vesting date (from the end of the prior fiscal year) in fair value; and (v) for awards granted in prior years that are determined to fail to meet the applicable vesting conditions during the applicable year, the amount equal to the fair value at the end of the prior fiscal year. Adjustments for dividend payments are not covered, as the Company does not pay dividends on equity awards. The valuation assumptions used to calculate fair values did not materially differ from those disclosed at the time of grant. The amounts deducted or added in calculating the equity award adjustments are as follows: | | | | | | | | | | | | | | | | | | | | | | | | Fiscal Year | Year End Fair Value of Equity Awards Granted in the Year and Outstanding and Unvested at Year End
($) | Change in Fair Value from the End of the Prior Year to the End of the Year of Outstanding and Unvested Equity Awards Granted in Prior Years
($) | Fair Value
as of Vesting
Date of Equity
Awards Granted
and Vested
in the Year
($) | Change in Fair Value from the End of the Prior Year to the Vesting Date of Equity Awards Granted in Prior Years that Vested
in the Year
($) | Fair Value at the End of the Prior Year of Equity Awards that Failed to Meet Vesting Conditions
in the Year
($) | Total
Equity Award Adjustments
($) | | | | | | | | | | 2025 | 8,662,145 | 64,120 | 91,209 | (183,613) | — | 8,633,951 | |
|
|
|
| Non-PEO NEO Average Total Compensation Amount |
$ 1,908,394
|
$ 1,660,502
|
$ 2,979,072
|
| Non-PEO NEO Average Compensation Actually Paid Amount |
$ 1,295,575
|
2,150,815
|
1,090,052
|
| Adjustment to Non-PEO NEO Compensation Footnote |
The dollar amounts reported in column (e) represent the average amount of “compensation actually paid” to the NEOs as a group (excluding Mr. McAleenan), as computed in accordance with Item 402(v) of Regulation S-K. The dollar amounts do not reflect the actual average amount of compensation earned by or paid to the NEOs as a group (excluding Mr. McAleenan) during the applicable year. In accordance with the requirements of Item 402(v) of Regulation S-K, the following adjustments were made to average total compensation for the NEOs as a group (excluding Mr. McAleenan) for each year to determine the compensation actually paid, using the same methodology described above in Note 2 (adjustments for pension benefits are not covered, as the Company does not have any defined benefit or actuarial pension plans): | | | | | | | | | | | | | | | | | | | Fiscal Year | Average Reported Summary Compensation Table Total for Non-PEO NEOs
($) | Average Reported Value of Equity Awards
($) | Average Equity Award Adjustments(a) ($) | Average Compensation Actually Paid to Non-PEO NEOs
($) | | | | | | | | 2025 | 1,908,394 | (1,347,216) | 734,397 | 1,295,575 | |
a.The amounts deducted or added in calculating the total average equity award adjustments are as follows (adjustments for dividend payments are not covered, as the Company does not pay dividends on equity awards): | | | | | | | | | | | | | | | | | | | | | | | | Fiscal Year | Average Year End Fair Value of Equity Awards Granted in the Year and Outstanding and Unvested at Year End ($) | Average Change in Fair Value from the End of the Prior Year to the End of the Year of Outstanding and Unvested Equity Awards ($) | Average Fair Value as of Vesting Date of Equity Awards Granted and Vested in the Year ($) | Average Change in Fair Value from the End of the Prior Year to the Vesting Date of Equity Awards Granted in Prior Years that Vested in the Year ($) | Average Fair Value at the End of the Prior Year of Equity Awards that Failed to Meet Vesting Conditions in the Year ($) | Total Average Equity Award Adjustments ($) | | | | | | | | | | 2025 | 1,101,600 | 55,768 | (161,719) | 142,869 | (404,121) | 734,397 | |
|
|
|
| Compensation Actually Paid vs. Total Shareholder Return |
|
|
|
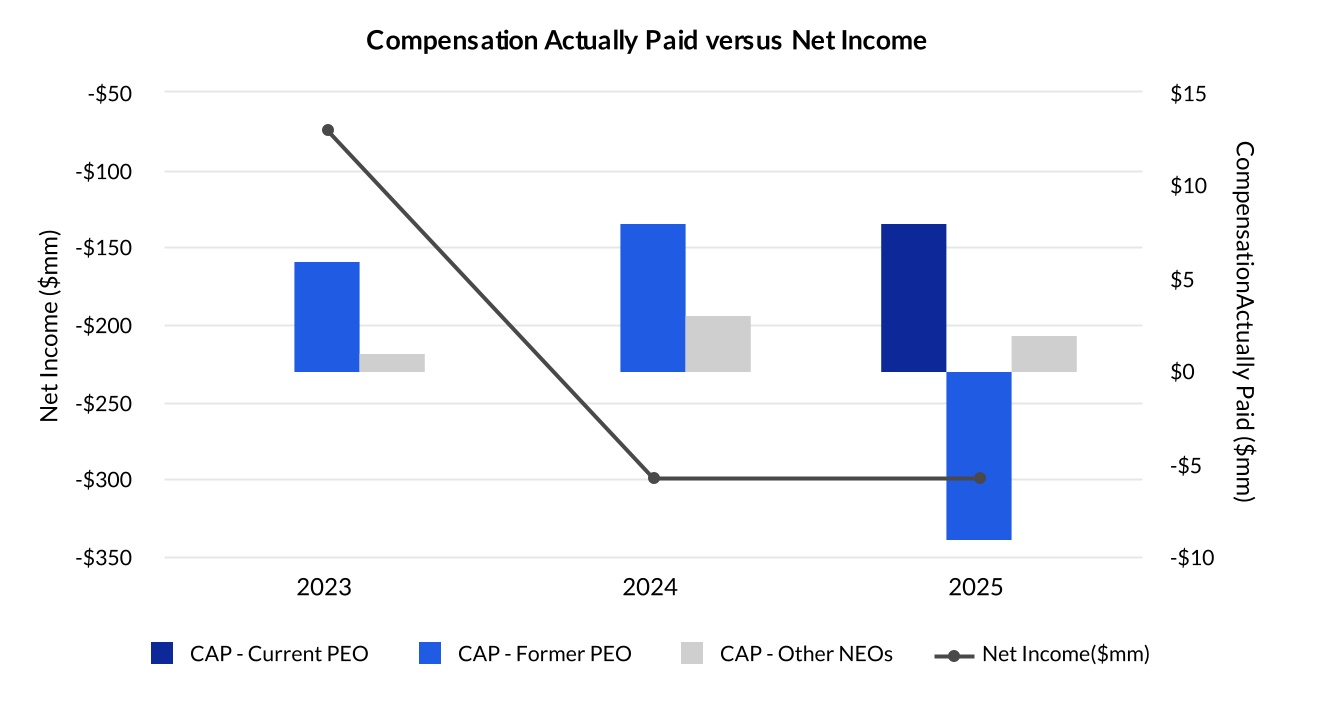
| Compensation Actually Paid vs. Net Income |
|
|
|
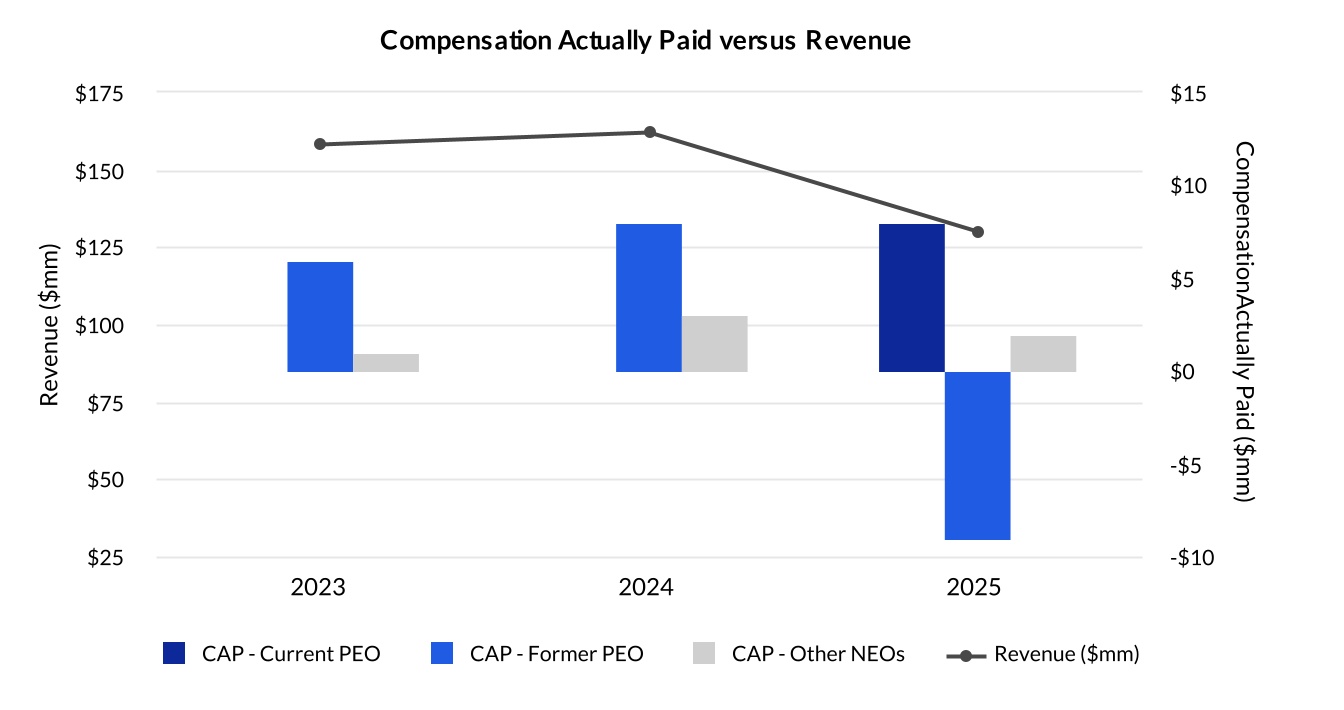
| Compensation Actually Paid vs. Company Selected Measure |
|
|
|
| Total Shareholder Return Vs Peer Group |
|
|
|
| Tabular List, Table |
As described in greater detail in “Executive Compensation - Compensation Discussion and Analysis,” the Company’s executive compensation program reflects a pay-for-performance philosophy. The metrics that the Company uses for both our long-term and short-term incentive awards are selected based on an objective of incentivizing our NEOs to increase the value of our enterprise for our shareholders. The most important financial performance measures used by the Company to link executive compensation actually paid to the Company’s NEOs, for the most recently completed fiscal year, to the Company’s performance are as follows: •Revenue •Net Income (Loss)
|
|
|
| Total Shareholder Return Amount |
$ 802
|
661
|
318
|
| Peer Group Total Shareholder Return Amount |
287
|
216
|
158
|
| Net Income (Loss) |
$ (294,000,000)
|
$ (296,000,000)
|
$ (71,000,000)
|
| Company Selected Measure Amount |
128,000,000
|
158,000,000
|
155,000,000
|
| Additional 402(v) Disclosure |
Represents the total stockholder return (“TSR”) of a $100 investment in our stock as of December 31, 2022, valued again on each of December 31, 2025, 2024 and 2023. The 2025 Cumulative TSR is calculated by dividing the sum of the cumulative amount of dividends for the measurement period, assuming dividend reinvestment, and the difference between the Company’s share price at the end and the beginning of the measurement period by the Company’s share price at the beginning of the measurement period. The initial public offering price of our common stock was $10 per share (the disclosure of the Company’s initial public offering price in this footnote is supplemental disclosure that is not required by Item 402(v) of Regulation S-K).Represents the TSR of the S&P 500 Information Technology Index based on a $100 investment as of December 31, 2022, valued again on each of December 31, 2023, 2024 and 2025. The dollar amounts reported represent the amount of net income (loss) reflected in our Consolidated Statements of Operations included in our Annual Report on Form 10-K for each of the fiscal years.Reflects “revenue” for each fiscal year as set forth in our Consolidated Statements of Operations included in our Annual Report on Form 10-K for each of the fiscal years.
|
|
|
| Measure:: 1 |
|
|
|
| Pay vs Performance Disclosure |
|
|
|
| Name |
Revenue
|
|
|
| Measure:: 2 |
|
|
|
| Pay vs Performance Disclosure |
|
|
|
| Name |
Net Income (Loss)
|
|
|
| Kevin McAleenan [Member] |
|
|
|
| Pay vs Performance Disclosure |
|
|
|
| PEO Total Compensation Amount |
$ 6,597,191
|
|
|
| PEO Actually Paid Compensation Amount |
$ 9,150,628
|
|
|
| PEO Name |
Kevin McAleenan
|
|
|
| Amanda Long [Member] |
|
|
|
| Pay vs Performance Disclosure |
|
|
|
| PEO Total Compensation Amount |
$ 1,558,820
|
$ 2,133,192
|
$ 1,938,141
|
| PEO Actually Paid Compensation Amount |
$ (8,997,327)
|
$ 9,277,263
|
$ 5,946,669
|
| PEO Name |
Amanda Long
|
Amanda Long
|
Amanda Long
|
| PEO | Equity Awards Adjustments, Excluding Value Reported in Compensation Table |
|
|
|
| Pay vs Performance Disclosure |
|
|
|
| Adjustment to Compensation, Amount |
$ 8,633,951
|
|
|
| PEO | Kevin McAleenan [Member] | Aggregate Grant Date Fair Value of Equity Award Amounts Reported in Summary Compensation Table |
|
|
|
| Pay vs Performance Disclosure |
|
|
|
| Adjustment to Compensation, Amount |
(6,080,514)
|
|
|
| PEO | Kevin McAleenan [Member] | Equity Awards Adjustments, Excluding Value Reported in Compensation Table |
|
|
|
| Pay vs Performance Disclosure |
|
|
|
| Adjustment to Compensation, Amount |
8,633,951
|
|
|
| PEO | Kevin McAleenan [Member] | Year-end Fair Value of Equity Awards Granted in Covered Year that are Outstanding and Unvested |
|
|
|
| Pay vs Performance Disclosure |
|
|
|
| Adjustment to Compensation, Amount |
8,662,145
|
|
|
| PEO | Kevin McAleenan [Member] | Year-over-Year Change in Fair Value of Equity Awards Granted in Prior Years That are Outstanding and Unvested |
|
|
|
| Pay vs Performance Disclosure |
|
|
|
| Adjustment to Compensation, Amount |
64,120
|
|
|
| PEO | Kevin McAleenan [Member] | Vesting Date Fair Value of Equity Awards Granted and Vested in Covered Year |
|
|
|
| Pay vs Performance Disclosure |
|
|
|
| Adjustment to Compensation, Amount |
91,209
|
|
|
| PEO | Kevin McAleenan [Member] | Change in Fair Value as of Vesting Date of Prior Year Equity Awards Vested in Covered Year |
|
|
|
| Pay vs Performance Disclosure |
|
|
|
| Adjustment to Compensation, Amount |
(183,613)
|
|
|
| PEO | Kevin McAleenan [Member] | Prior Year End Fair Value of Equity Awards Granted in Any Prior Year that Fail to Meet Applicable Vesting Conditions During Covered Year |
|
|
|
| Pay vs Performance Disclosure |
|
|
|
| Adjustment to Compensation, Amount |
0
|
|
|
| Non-PEO NEO | Aggregate Grant Date Fair Value of Equity Award Amounts Reported in Summary Compensation Table |
|
|
|
| Pay vs Performance Disclosure |
|
|
|
| Adjustment to Compensation, Amount |
(1,347,216)
|
|
|
| Non-PEO NEO | Equity Awards Adjustments, Excluding Value Reported in Compensation Table |
|
|
|
| Pay vs Performance Disclosure |
|
|
|
| Adjustment to Compensation, Amount |
734,397
|
|
|
| Non-PEO NEO | Year-end Fair Value of Equity Awards Granted in Covered Year that are Outstanding and Unvested |
|
|
|
| Pay vs Performance Disclosure |
|
|
|
| Adjustment to Compensation, Amount |
1,101,600
|
|
|
| Non-PEO NEO | Year-over-Year Change in Fair Value of Equity Awards Granted in Prior Years That are Outstanding and Unvested |
|
|
|
| Pay vs Performance Disclosure |
|
|
|
| Adjustment to Compensation, Amount |
55,768
|
|
|
| Non-PEO NEO | Vesting Date Fair Value of Equity Awards Granted and Vested in Covered Year |
|
|
|
| Pay vs Performance Disclosure |
|
|
|
| Adjustment to Compensation, Amount |
(161,719)
|
|
|
| Non-PEO NEO | Change in Fair Value as of Vesting Date of Prior Year Equity Awards Vested in Covered Year |
|
|
|
| Pay vs Performance Disclosure |
|
|
|
| Adjustment to Compensation, Amount |
142,869
|
|
|
| Non-PEO NEO | Prior Year End Fair Value of Equity Awards Granted in Any Prior Year that Fail to Meet Applicable Vesting Conditions During Covered Year |
|
|
|
| Pay vs Performance Disclosure |
|
|
|
| Adjustment to Compensation, Amount |
$ (404,121)
|
|
|