The Fund was reorganized on August 20, 2021, from a series of Collaborative Investment Series Trust, a Delaware statutory trust, to a series of Tactical Investment Series Trust, a Delaware statutory trust (the “Reorganization”).
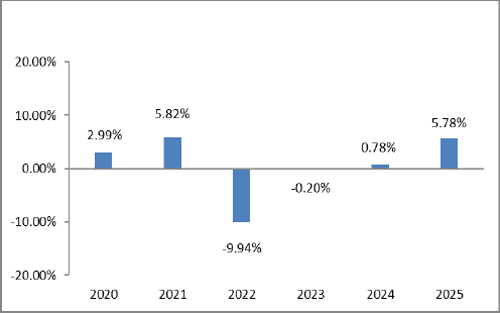
The bar chart and table that follow provide some indication of the risks of investing in the Fund by showing changes in the Fund’s performance yearly and by showing how the Fund’s average annual total returns for one year and since inception compare with those of a broad-based securities market index. How the Fund has performed in the past (before and after taxes) is not necessarily an indication of how the Fund will perform in the future. Updated performance information, current through the most recent month end, is available by calling (833) 974-3787 or by visiting the Fund’s website at www.tfafunds.com.
| Quarterly Returns During This Time Period | |
| Highest: | 6.26% (quarter ended December 31, 2020) |
| Lowest: | (12.42)% (quarter ended March 31, 2020) |
|
Average Annual Total Returns (for periods ended December 31, 2025) |
One Year | Five Years |
Since Inception (June 10, 2019) |
| TFA Tactical Income Fund – Class I Shares | |||
| Return Before Taxes | 5.78% | 0.28% | 1.35% |
| Return After Taxes on Distributions | 4.95% | (1.25)% | 0.08% |
| Return After Taxes on Distributions and Sale of Fund Shares | 3.64% | (0.37)% | 0.58% |
| Bloomberg Barclays U.S. Aggregate Bond Index(1) | 7.30% | (0.36)% | 1.37% |
| (1) | The Bloomberg Barclays U.S. Aggregate Bond Index is a widely-used indicator of the bond market. The index is market capitalization-weighted and is made up of U.S. bonds that are primarily investment grade and has a greater number of securities than is found in the Fund’s portfolio. Individuals cannot invest directly in the index; however, an individual can invest in exchange-traded funds or other investment vehicles that attempt to track the performance of a benchmark index. The annual total returns included for the above Fund are net of the total annual operating expenses for the Fund, while no annual operating expenses are deducted for the Bloomberg Barclays U.S. Aggregate Bond Index. |
After-tax returns are calculated using the historical highest individual federal marginal income tax rates and do not reflect the impact of state and local taxes. Actual after-tax returns depend on an investor’s tax situation and may differ from those shown above. After-tax returns shown are not relevant to investors who hold their shares through tax-deferred arrangements, such as a 401(k) plan or an individual retirement account (“IRA”). Return After Taxes on Distributions and Sale of Fund Shares may be higher than other returns for the same period due to a tax benefit of realizing a capital loss on the sale of Fund shares.
The Fund was reorganized on August 20, 2021, from a series of Collaborative Investment Series Trust, a Delaware statutory trust, to a series of Tactical Investment Series Trust, a Delaware statutory trust (the “Reorganization”). While the Fund’s investment objective, principal investment strategies, and risks are identical to the Fund and theoretically would have invested in the same portfolio of securities, the Fund’s performance may be different than the performance of the Fund, due to, among other things, differences in fees and expenses.
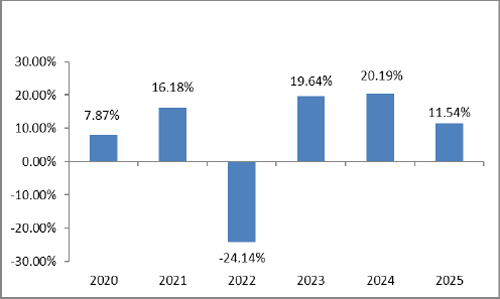
The bar chart and table that follow provide some indication of the risks of investing in the Fund by showing changes in the Fund’s performance from year to year and by showing how the Fund’s average annual total returns for one year and since inception compare with those of a broad-based securities market index. How the Fund has performed in the past (before and after taxes) is not necessarily an indication of how the Fund will perform in the future. Updated performance information, current through the most recent month end, is available by calling (833) 974-3787 or by visiting the Fund’s website at www.tfafunds.com.
| Quarterly Returns During This Time Period | |
| Highest: | 11.55% (quarter ended June 30, 2020) |
| Lowest: | (14.85)% (quarter ended March 31, 2020) |
|
Average Annual Total Returns (for periods ended December 31, 2025) |
One Year | Five Years |
Since Inception (June 10, 2019) |
| Tactical Allocation Fund – Class I Shares | |||
| Return Before Taxes | 11.54% | 7.17% | 7.26% |
| Return After Taxes on Distributions | 11.54% | 6.11% | 6.18% |
| Return After Taxes on Distributions and Sale of Fund Shares | 7.27% | 5.35% | 5.44% |
| Morningstar Moderately Aggressive Target Risk TR USD Index (1) | 18.45% | 7.93% | 9.58% |
| (1) | The Morningstar Moderately Aggressive Target Risk Total Return USD Index seeks approximately 80% exposure to global equity markets. This Index does not incorporate Environmental, Social, or Governance (ESG) criteria. Investors cannot invest directly in an index. |
After-tax returns are calculated using the historical highest individual federal marginal income tax rates and do not reflect the impact of state and local taxes. Actual after-tax returns depend on an investor’s tax situation and may differ from those shown above. After-tax returns shown are not relevant to investors who hold their shares through tax-deferred arrangements, such as a 401(k) plan or an individual retirement account (“IRA”). Return After Taxes on Distributions and Sale of Fund Shares may be higher than other returns for the same period due to a tax benefit of realizing a capital loss on the sale of Fund shares.
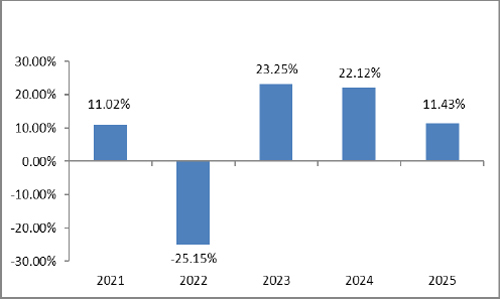
The bar chart and table that follow provide some indication of the risks of investing in the Fund by showing changes in the Fund’s performance yearly and by showing how the Fund’s average annual total returns for one year and since inception compare with those of a broad-based securities market index. How the Fund has performed in the past (before and after taxes) is not necessarily an indication of how it will perform in the future. Updated performance information, current through the most recent month end, is available by calling (833) 974-3787 or by visiting the Fund’s website at www.tfafunds.com.
| Quarterly Returns During This Time Period | |
| Highest: | 11.38% (quarter ended June 30, 2023) |
| Lowest: | (17.21)% (quarter ended June 30, 2022) |
|
Average Annual Total Returns (for periods ended December 31, 2025) |
One Year | Five Year |
Since Inception (May 18, 2020) |
| TFA Quantitative Fund – Class I Shares | |||
| Return Before Taxes | 11.43% | 6.87% | 9.28% |
| Return After Taxes on Distributions | 8.82% | 4.70% | 6.99% |
| Return After Taxes on Distributions and Sale of Fund Shares | 8.39% | 4.63% | 6.58% |
| Morningstar Aggressive Target Risk Total Return Index(1) | 20.43% | 9.58% | 14.04% |
| S&P 500 Total Return Index (2) | 17.88% | 14.42% | 17.87% |
| (1) | The Morningstar Aggressive Target Risk Total Return USD Index seeks approximately 95% exposure to global equity markets. This Index does not incorporate Environmental, Social, or Governance (ESG) criteria. Investors cannot invest directly in an index. |
| (2) | The S&P 500 Total Return Index, a registered trademark of McGraw-Hill Co., Inc., is a market capitalization-weighted index of 500 widely held common stocks. Investors cannot invest directly in an index. |
After-tax returns are calculated using the historical highest individual federal marginal income tax rates and do not reflect the impact of state and local taxes. Actual after-tax returns depend on an investor’s tax situation and may differ from those shown above. After-tax returns shown are not relevant to investors who hold their shares through tax-deferred arrangements, such as a 401(k) plan or an individual retirement account (“IRA”). Return After Taxes on Distributions and Sale of Fund Shares may be higher than other returns for the same period due to a tax benefit of realizing a capital loss on the sale of Fund shares.
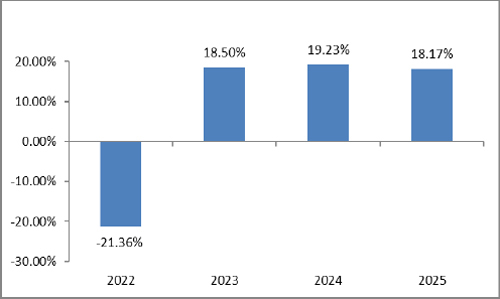
The bar chart and table that follow provide some indication of the risks of investing in the Fund by showing changes in the Fund’s performance yearly and by showing how the Fund’s average annual total returns for one year and since inception compare with those of a broad-based securities market index. How the Fund has performed in the past (before and after taxes) is not necessarily an indication of how it will perform in the future. Updated performance information, current through the most recent month end, is available by calling (833) 974-3787 or by visiting the Fund’s website at www.tfafunds.com.
| Quarterly Returns During This Time Period | |
| Highest: | 12.84% (quarter ended September 30, 2025) |
| Lowest: | (14.59)% (quarter ended June 30, 2022) |
|
Average Annual Total Returns (for periods ended December 31, 2025) |
One Year |
Since Inception (August 23, 2021) |
| TFA AlphaGen Fund – Class I Shares | ||
| Return Before Taxes | 18.17% | 6.89% |
| Return After Taxes on Distributions | 15.44% | 6.05% |
| Return After Taxes on Distributions and Sale of Fund Shares | 11.89% | 5.25% |
| Morningstar Aggressive Target Risk Total Return Index(1) | 20.43% | 7.86% |
| S&P 500 Total Return Index (2) | 17.88% | 11.85% |
| (1) | The Morningstar Aggressive Target Risk Total Return USD Index seeks approximately 95% exposure to global equity markets. This Index does not incorporate Environmental, Social, or Governance (ESG) criteria. Investors cannot invest directly in an index. |
| (2) | The S&P 500 Total Return Index, a registered trademark of McGraw-Hill Co., Inc., is a market capitalization-weighted index of 500 widely held common stocks. Investors cannot invest directly in an index. |
After-tax returns are calculated using the historical highest individual federal marginal income tax rates and do not reflect the impact of state and local taxes. Actual after-tax returns depend on an investor’s tax situation and may differ from those shown above. After-tax returns shown are not relevant to investors who hold their shares through tax-deferred arrangements, such as a 401(k) plan or an individual retirement account (“IRA”). Return After Taxes on Distributions and Sale of Fund Shares may be higher than other returns for the same period due to a tax benefit of realizing a capital loss on the sale of Fund shares.