Pay Versus Performance
As required by Section 953(a) of the Dodd-Frank Wall Street Reform and Consumer Protection Act and Item 402(v) of Regulation S-K, we are providing the following information about the relationship between executive compensation actually paid (as defined by SEC rules) (“CAP”) and certain financial performance measures of the Company. The amounts in the table below are calculated in accordance with SEC rules and do not represent amounts actually earned or realized by our NEOs.
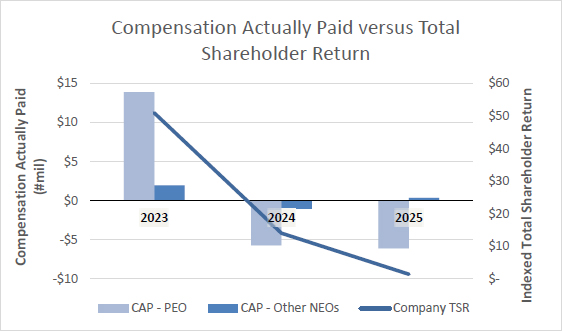
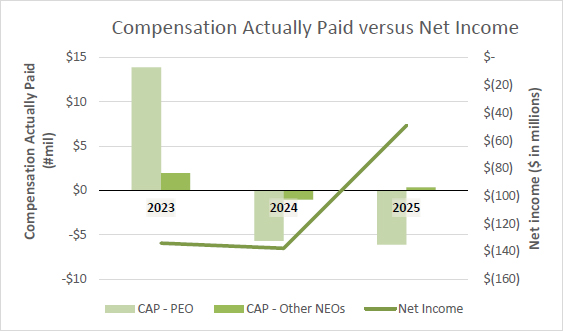
The following table sets forth the compensation for our principal executive officer (“PEO”), Dr. Jennifer Holmgren, and the average compensation for our other NEOs, each as reported in the Summary Compensation Table and with certain adjustments to reflect CAP. The table also provides information with respect to cumulative total shareholder returns (“TSR”) and net income.
| Year | Summary Compensation Table Total for PEO(a) |
Compensation Actually Paid to PEO(b) |
Average Compensation Summary Table Total for Non-PEO Named Executive Officers(a) |
Average Compensation Actually Paid to Non-PEO Named Executive Officers(b) |
Value
of Initial Fixed $100 Investment Based on Total Stockholder Return ($)(c) |
Net Loss ($ in millions)(d) | ||||||||||||
| 2025 | $ | 642,559 | $ | (6,124,054) | $ | 453,012 | $ | 340,694 | $ | 1.39 | $ | (49.0) | ||||||
| 2024 | $ | 5,071,031 | $ | (5,706,167) | $ | 1,284,685 | $ | (1,034,313) | $ | 14 | $ | (137.7) | ||||||
| 2023 | $ | 8,849,858 | $ | 13,892,972 | $ | 1,632,090 | $ | 1,961,653 | $ | 51 | $ | (134.1) | ||||||
(a) Compensation for our PEO, Dr. Holmgren, reflects the amounts reported in the Summary Compensation Table for each respective year. Average compensation for our other NEOs in 2025 includes the following individuals: Ms. Koyanagi, Ms. Summers, Ms. Cuellar, and Mr. Trukenbrod. Average compensation for our other NEOs in 2024 includes the following individuals: Joseph Blasko, our former General Counsel and Corporate Secretary, and Ms. Cuellar, our former President. Average compensation for our other NEOs in 2023 includes the following individuals: Mr. Trukenbrod, our former Chief Financial Officer, Steven Stanley, our
former Chief Commercial Officer, and Dr. Sean Simpson, our former Chief Scientific Officer. For 2023 the amounts include compensation (consistent with the Summary Compensation Table) from our predecessor company, LanzaTech NZ, Inc. prior to the February 2023 business combination that resulted in our becoming a publicly traded business.
(b) Reflects CAP for the PEO and average CAP for our other NEOs, respectively, calculated as set forth in the table below in accordance with SEC rules. These amounts do not reflect the actual amount of compensation earned by or paid to the PEO and other NEOs during the applicable year.
(c) TSR is cumulative for the measurement periods beginning on December 31, 2021 and ending on December 31 of each of 2025, 2024 and 2023, respectively, calculated in accordance with Item 201(e) of Regulation S-K.
(d) Amounts reflect “Net Loss” in our Consolidated Statements of Operations and Comprehensive Loss included in our Annual Report on Form 10-K for each of the fiscal years ended December 31, 2025, 2024 and 2023. For fiscal year 2023 the amount accounts for applicable pre-Business Combination financial information of our predecessor company, LanzaTech NZ, Inc.
| PEO 2025 | Other
NEOs 2025 |
PEO 2024 | Other
NEOs 2024 |
PEO 2023 | Other
NEOs 2023 | |||||||||||||
| Total Compensation Report | $ | 642,559 | $ | 453,012 | $ | 5,071,031 | $ | 1,284,685 | $ | 8,849,858 | $ | 1,632,090 | ||||||
| Less Stock Award Value Reported in Summary Compensation Table for the Covered Year | $ | – | $ | – | $ | (4,289,774) | $ | (714,961) | $ | (7,969,847) | $ | (1,155,971) | ||||||
| Plus Fiscal Year-End Fair Value for Awards Granted in the Covered Year and Outstanding at Fiscal Year-End | $ | – | $ | – | $ | 1,875,743 | $ | 649,370 | $ | 13,998,834 | $ | 1,437,102 | ||||||
| Plus Fair Value as of the Vesting Date for Awards Granted and Vested in the Covered Year | $ | – | $ | – | $ | – | $ | – | $ | – | $ | 32,620 | ||||||
| Change in Fair Value of Outstanding Unvested Awards from Prior Years that were Outstanding as of the End of the Covered Fiscal Year | $ | (6,059,711) | $ | (85,066) | $ | (8,617,476) | $ | (2,294,756) | $ | (555,802) | $ | (3,163) | ||||||
| Change as of the Vesting Date in Fair Value of Awards from Prior Years that Vested in the Covered Fiscal Year | $ | (703,902) | $ | (27,252) | $ | 254,309 | $ | 41,349 | $ | (430,071) | $ | 18,975 | ||||||
| Less Fair Value of Awards Forfeited during the Covered Year | $ | – | $ | – | $ | – | $ | – | $ | – | $ | - | ||||||
| Plus Fair Value of Incremental Dividends or Earnings Paid on Stock Awards | $ | – | $ | – | $ | – | $ | – | $ | – | $ | - | ||||||
| Less Aggregate Change in Actuarial Present Value of Accumulated Benefit Under Pension Plans | $ | – | $ | – | $ | – | $ | – | $ | – | $ | - | ||||||
| Plus Aggregate Service Cost and Prior Service Cost for Pension Plans | $ | – | $ | – | $ | – | $ | – | $ | – | $ | - | ||||||
| Compensation Actually Paid | $ | $ | 340,694 | $ | (5,706,167) | $ | (1,034,313) | $ | 13,892,972 | $ | 1,961,653 | |||||||
former Chief Commercial Officer, and Dr. Sean Simpson, our former Chief Scientific Officer. For 2023 the amounts include compensation (consistent with the Summary Compensation Table) from our predecessor company, LanzaTech NZ, Inc. prior to the February 2023 business combination that resulted in our becoming a publicly traded business.
| PEO 2025 | Other
NEOs 2025 |
PEO 2024 | Other
NEOs 2024 |
PEO 2023 | Other
NEOs 2023 | |||||||||||||
| Total Compensation Report | $ | 642,559 | $ | 453,012 | $ | 5,071,031 | $ | 1,284,685 | $ | 8,849,858 | $ | 1,632,090 | ||||||
| Less Stock Award Value Reported in Summary Compensation Table for the Covered Year | $ | – | $ | – | $ | (4,289,774) | $ | (714,961) | $ | (7,969,847) | $ | (1,155,971) | ||||||
| Plus Fiscal Year-End Fair Value for Awards Granted in the Covered Year and Outstanding at Fiscal Year-End | $ | – | $ | – | $ | 1,875,743 | $ | 649,370 | $ | 13,998,834 | $ | 1,437,102 | ||||||
| Plus Fair Value as of the Vesting Date for Awards Granted and Vested in the Covered Year | $ | – | $ | – | $ | – | $ | – | $ | – | $ | 32,620 | ||||||
| Change in Fair Value of Outstanding Unvested Awards from Prior Years that were Outstanding as of the End of the Covered Fiscal Year | $ | (6,059,711) | $ | (85,066) | $ | (8,617,476) | $ | (2,294,756) | $ | (555,802) | $ | (3,163) | ||||||
| Change as of the Vesting Date in Fair Value of Awards from Prior Years that Vested in the Covered Fiscal Year | $ | (703,902) | $ | (27,252) | $ | 254,309 | $ | 41,349 | $ | (430,071) | $ | 18,975 | ||||||
| Less Fair Value of Awards Forfeited during the Covered Year | $ | – | $ | – | $ | – | $ | – | $ | – | $ | - | ||||||
| Plus Fair Value of Incremental Dividends or Earnings Paid on Stock Awards | $ | – | $ | – | $ | – | $ | – | $ | – | $ | - | ||||||
| Less Aggregate Change in Actuarial Present Value of Accumulated Benefit Under Pension Plans | $ | – | $ | – | $ | – | $ | – | $ | – | $ | - | ||||||
| Plus Aggregate Service Cost and Prior Service Cost for Pension Plans | $ | – | $ | – | $ | – | $ | – | $ | – | $ | - | ||||||
| Compensation Actually Paid | $ | $ | 340,694 | $ | (5,706,167) | $ | (1,034,313) | $ | 13,892,972 | $ | 1,961,653 | |||||||
| [1] | Compensation for our PEO, Dr. Holmgren, reflects the amounts reported in the Summary Compensation Table for each respective year. Average compensation for our other NEOs in 2025 includes the following individuals: Ms. Koyanagi, Ms. Summers, Ms. Cuellar, and Mr. Trukenbrod. Average compensation for our other NEOs in 2024 includes the following individuals: Joseph Blasko, our former General Counsel and Corporate Secretary, and Ms. Cuellar, our former President. Average compensation for our other NEOs in 2023 includes the following individuals: Mr. Trukenbrod, our former Chief Financial Officer, Steven Stanley, our former Chief Commercial Officer, and Dr. Sean Simpson, our former Chief Scientific Officer. For 2023 the amounts include compensation (consistent with the Summary Compensation Table) from our predecessor company, LanzaTech NZ, Inc. prior to the February 2023 business combination that resulted in our becoming a publicly traded business. |
| [2] | Reflects CAP for the PEO and average CAP for our other NEOs, respectively, calculated as set forth in the table below in accordance with SEC rules. These amounts do not reflect the actual amount of compensation earned by or paid to the PEO and other NEOs during the applicable year. |
| [3] | TSR is cumulative for the measurement periods beginning on December 31, 2021 and ending on December 31 of each of 2025, 2024 and 2023, respectively, calculated in accordance with Item 201(e) of Regulation S-K. |
| [4] | Amounts reflect “Net Loss” in our Consolidated Statements of Operations and Comprehensive Loss included in our Annual Report on Form 10-K for each of the fiscal years ended December 31, 2025, 2024 and 2023. For fiscal year 2023 the amount accounts for applicable pre-Business Combination financial information of our predecessor company, LanzaTech NZ, Inc. |