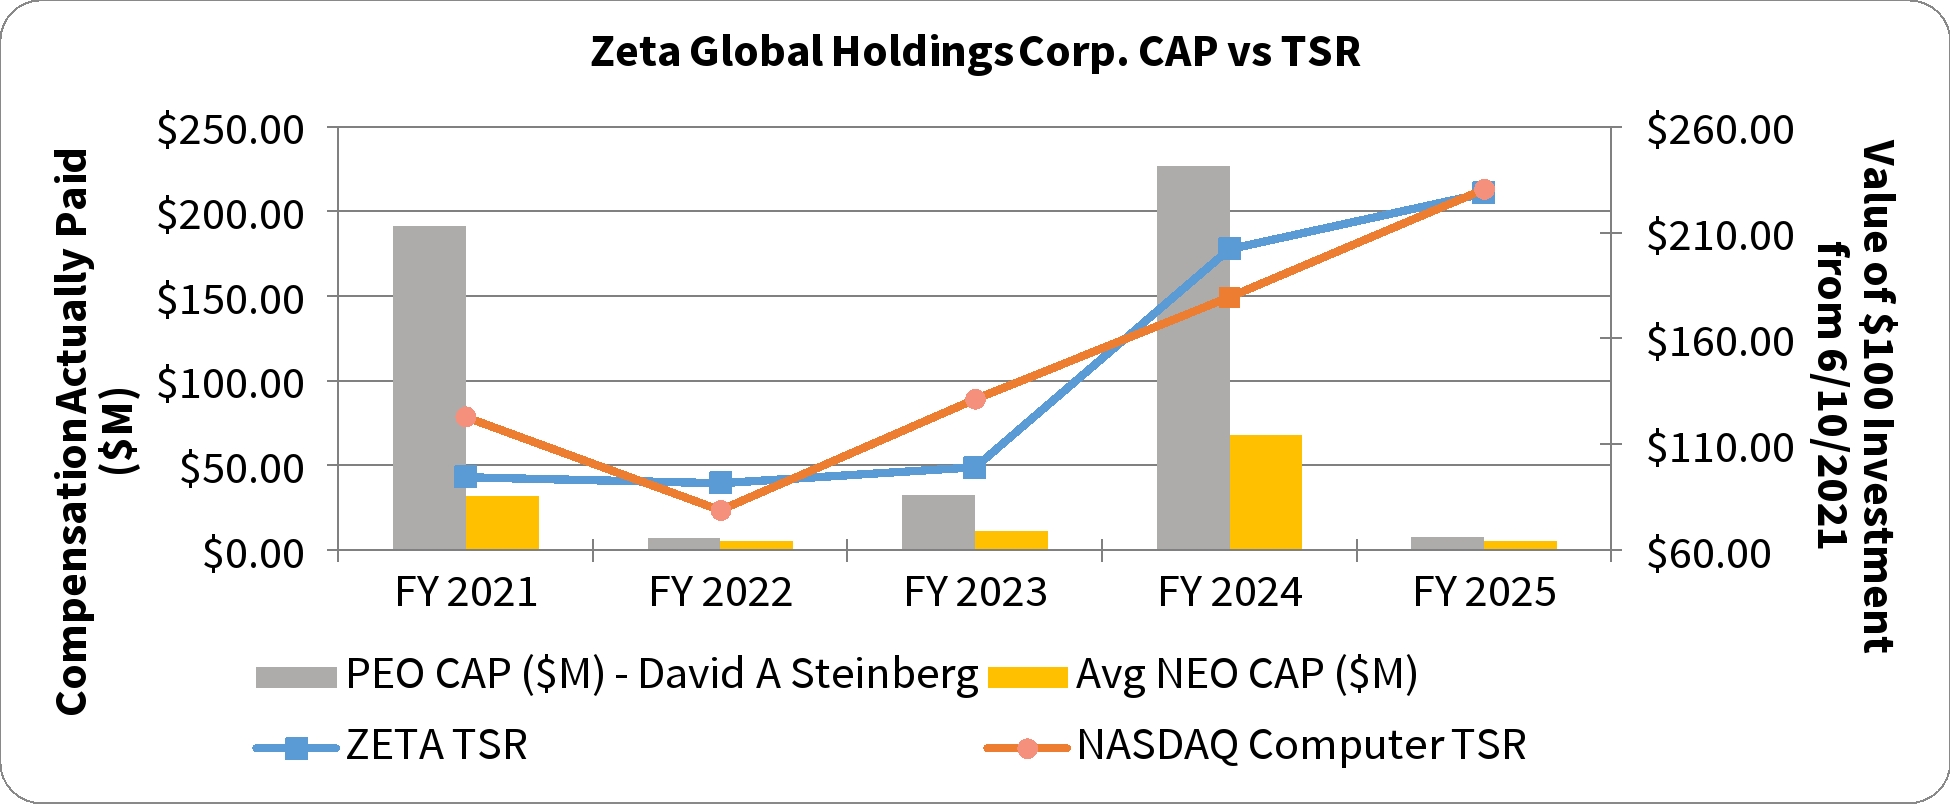
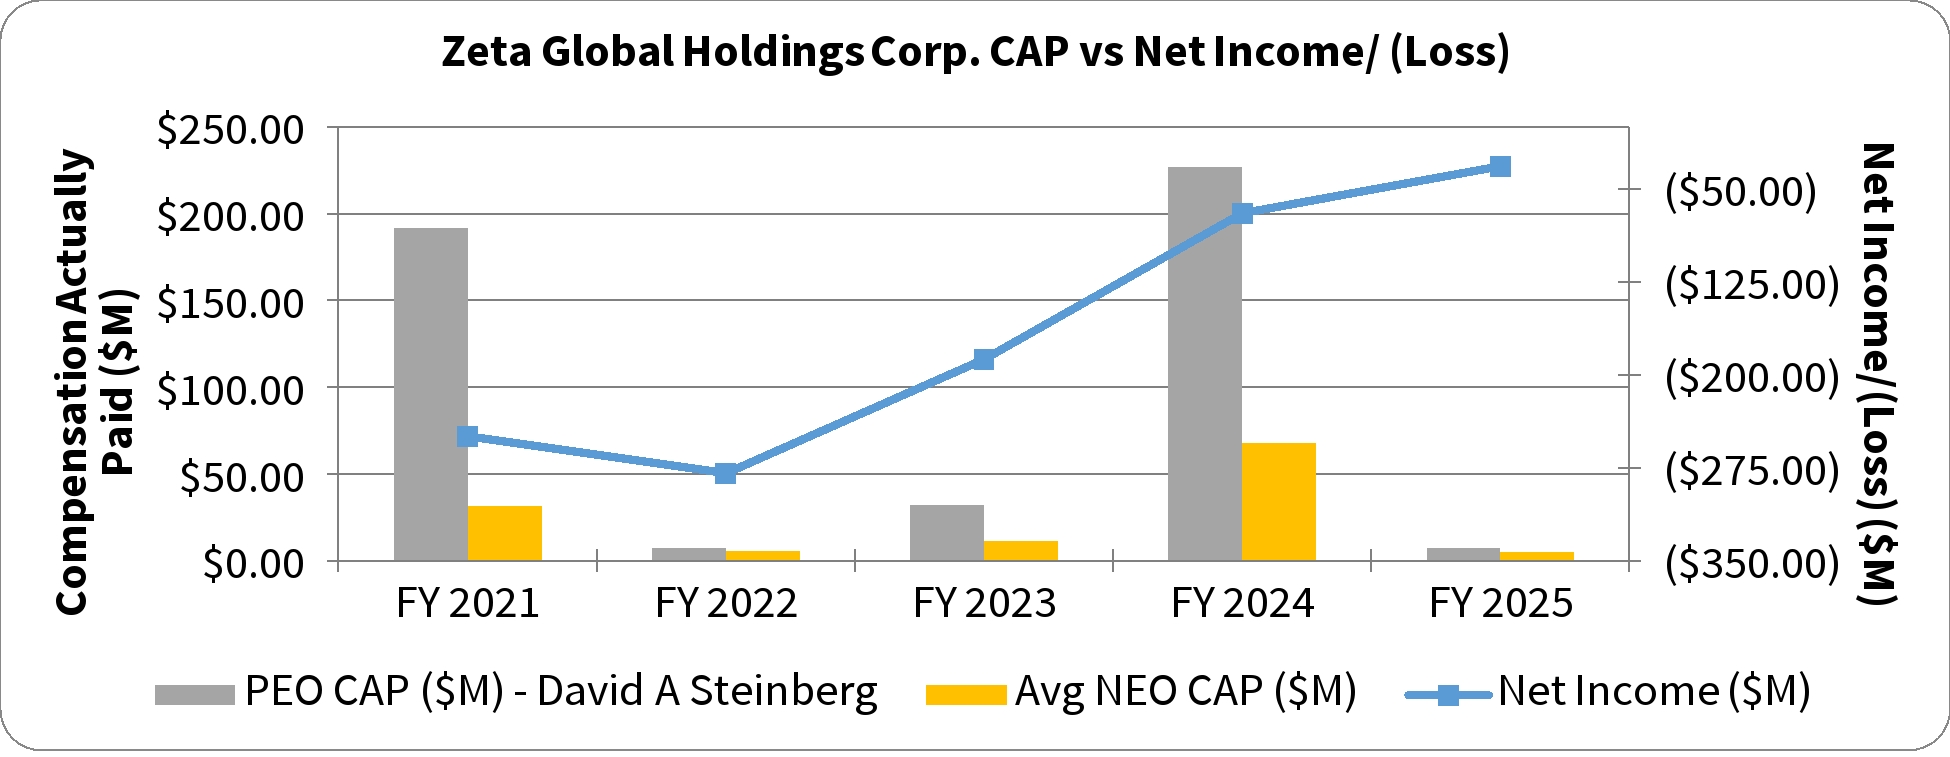
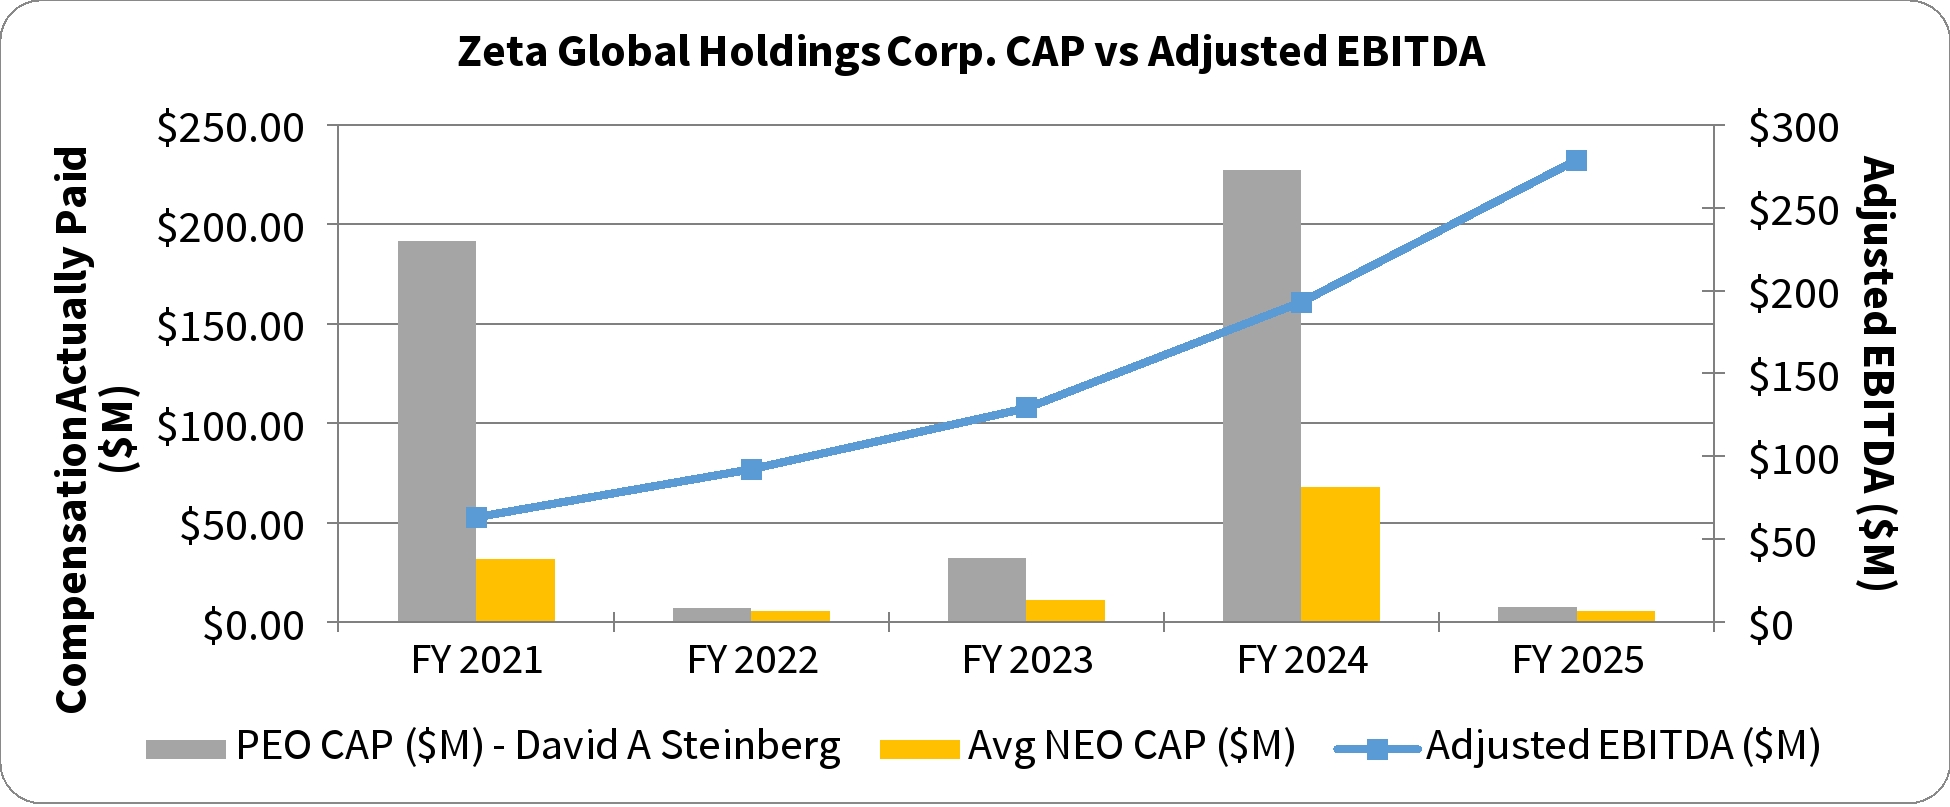
The following table shows the total compensation for our NEOs as set forth in the Summary Compensation Table for the applicable year, the “compensation actually paid” to our CEO, and on an average basis, our other NEOs (in each case, as determined under SEC rules), our TSR, our peer group TSR consisting of the Nasdaq Computer Index, our net income / (loss), and our Company-Selected Measure, Adjusted EBITDA.
|
|
|
|
|
Value of Initial Fixed $100 |
|
|
|
|
|
|
|
|
Investment Based On: |
|
|
|
|
|
|
Average |
Average |
|
Peer |
Net |
Adjusted |
Fiscal |
SCT |
CAP |
SCT |
CAP |
|
Group |
Income / (Loss) |
EBITDA5 |
Year |
for CEO |
to CEO |
for Other NEOs |
to Other NEOs |
TSR |
TSR |
($ in 000s) |
($ in 000s) |
(a) |
(b)1 |
(c)2 |
(d)3 |
(e)2 |
(f)4 |
(g)4 |
(h) |
(i)6 |
2025 |
$6,083,236 |
$7,795,133 |
$2,785,250 |
$5,576,205 |
$228.91 |
$230.83 |
($31,509) |
$278,665 |
2024 |
$26,156,274 |
$227,215,248 |
$11,697,213 |
$68,187,154 |
$202.36 |
$179.51 |
($69,771) |
$193,022 |
2023 |
$18,868,639 |
$32,576,149 |
$8,019,657 |
$11,369,482 |
$99.21 |
$131.64 |
($187,481) |
$129,393 |
2022 |
$20,727,503 |
$7,337,947 |
$9,317,813 |
$5,706,542 |
$91.90 |
$79.08 |
($279,239) |
$92,180 |
2021 |
$216,454,457 |
$191,673,896 |
$30,229,669 |
$32,002,898 |
$94.71 |
$123.13 |
($249,563) |
$63,255 |
____________________
1 The dollar amounts reported in column (b) are the amounts of total compensation reported for our CEO, Mr. Steinberg, for each corresponding year in the “Total” column of the Summary Compensation Table. Refer to the fiscal year 2025 Summary Compensation Table in this proxy statement and the Summary Compensation Tables in our fiscal year 2021, 2022, 2023, and 2024 proxy statements.
2 The dollar amounts reported in columns (c) and (e) represent the amount of “compensation actually paid” (otherwise known as CAP), reconciled in the table below, as determined in accordance with SEC rules. “Compensation actually paid” does not necessarily represent cash and/or equity value transferred to the applicable NEO without restriction, but rather is a value calculated under applicable SEC rules. We do not have a defined benefit plan, so no adjustment for pension benefits is included. Fair values set forth in the table are computed in accordance with ASC Topic 718 as of the end of the respective fiscal year, other than fair values of the awards that vest in the covered year, which are valued as of the applicable vesting date. No adjustment is made for dividends because the amount associated with such dividends, if any were paid, are reflected in the fair value of the award for the covered fiscal year. The reconciliation from the Summary Compensation Table to CAP is summarized in the table below.
Fiscal Year |
Executives (CEO & NEO Average) |
SCT |
Grant Date Value of New Awards |
Year End Value of New Awards |
Change in Value of Prior Awards |
Change in Value of Vested Awards Granted in Prior Fiscal Years |
Fair Value of Vested Awards Granted and Vested in Current Fiscal Year |
Fair Value at Start of Fiscal Year of Awards That Failed to Meet Vesting Conditions |
Value of Dividends Paid on Equity Awards not reflected in Fair Value |
Total Equity CAP |
CAP |
|
|
(a) |
(b) |
(i) |
(ii) |
(iii) |
(iv) |
(v) |
(vi) |
(c)=(i)+(ii)+(iii)+(iv)+(v)+(vi) |
(d) =(a)-(b)+(c) |
2025 |
CEO |
$6,083,236 |
($1,869,577) |
$0 |
$10,690,089 |
($7,108,615) |
$0 |
$0 |
$0 |
$3,581,474 |
$7,795,133 |
Other NEOs |
$2,785,250 |
$0 |
$0 |
$2,960,193 |
($169,237) |
$0 |
$0 |
$0 |
$2,790,955 |
$5,576,205 |
____________________
(a) The dollar amounts reported in the Summary Compensation Table for 2025.
(b) The grant date fair value of equity awards represents the total of the amounts reported in the “Stock Awards” column in the Summary Compensation Table for 2025.
(c) The recalculated value of equity awards for 2025.
(d) “Compensation actually paid” does not necessarily represent cash and/or equity value transferred to the applicable NEO without restriction, but rather is a value calculated under applicable SEC rules.
3 The dollar amounts reported in column (d) are the average amounts of total compensation reported for the other Named Executive Officers for each corresponding year in the “Total” column of the Summary Compensation Table. Refer to the Summary Compensation Table in this proxy statement. For each of 2021, 2022, 2023, 2024, and 2025, the other NEOs were: Christopher Greiner and Steven Gerber.
4 TSR is determined based on the value of an initial fixed investment of $100. Per SEC rules, 2021 TSR was calculated using $8.89, the closing price of our stock on the date of our initial public offering, June 10, 2021. The TSR peer group consists of the Nasdaq
Computer Index, which is used for our Stock Performance presentation set forth in the Company’s Annual Report on Form 10-K for the year ended December 31, 2025.
5 Adjusted EBITDA is a non-GAAP financial measure. See Appendix A for a reconciliation of Adjusted EBITDA to Net Loss and for a discussion of management’s use of non-GAAP measures.
6 We determined Adjusted EBITDA to be the most important financial performance measure used to link Company performance to the CAP to our CEO and Other NEOs in 2025, consistent with the targets used for our incentive programs. See “Compensation Discussion and Analysis” for additional information.
Computer Index, which is used for our Stock Performance presentation set forth in the Company’s Annual Report on Form 10-K for the year ended December 31, 2025.
Fiscal Year |
Executives (CEO & NEO Average) |
SCT |
Grant Date Value of New Awards |
Year End Value of New Awards |
Change in Value of Prior Awards |
Change in Value of Vested Awards Granted in Prior Fiscal Years |
Fair Value of Vested Awards Granted and Vested in Current Fiscal Year |
Fair Value at Start of Fiscal Year of Awards That Failed to Meet Vesting Conditions |
Value of Dividends Paid on Equity Awards not reflected in Fair Value |
Total Equity CAP |
CAP |
|
|
(a) |
(b) |
(i) |
(ii) |
(iii) |
(iv) |
(v) |
(vi) |
(c)=(i)+(ii)+(iii)+(iv)+(v)+(vi) |
(d) =(a)-(b)+(c) |
2025 |
CEO |
$6,083,236 |
($1,869,577) |
$0 |
$10,690,089 |
($7,108,615) |
$0 |
$0 |
$0 |
$3,581,474 |
$7,795,133 |
Other NEOs |
$2,785,250 |
$0 |
$0 |
$2,960,193 |
($169,237) |
$0 |
$0 |
$0 |
$2,790,955 |
$5,576,205 |
____________________
(a) The dollar amounts reported in the Summary Compensation Table for 2025.
(b) The grant date fair value of equity awards represents the total of the amounts reported in the “Stock Awards” column in the Summary Compensation Table for 2025.
(c) The recalculated value of equity awards for 2025.
(d) “Compensation actually paid” does not necessarily represent cash and/or equity value transferred to the applicable NEO without restriction, but rather is a value calculated under applicable SEC rules.
2025 Performance Measures The Compensation Committee uses a mix of performance measures to align executive pay with Company performance. As required by SEC rules, the performance measures identified as the most important for NEOs’ 2025 compensation decisions are listed in the table to the right, each of which is described in more detail in the CD&A. |
|
|
Most Important Performance Measures |
||
|
Adjusted EBITDA1 |
|
|
Revenue |
|
|
Stock Price |
|
|
____________________
1 Adjusted EBITDA is a non-GAAP financial measure. See Appendix A for a reconciliation of Adjusted EBITDA to Net Loss and for a discussion of management’s use of non-GAAP measures.