Pay vs Performance Disclosure - USD ($)
Dec. 31, 2025
Dec. 31, 2024
Dec. 31, 2023
Dec. 31, 2022
Dec. 31, 2021
Pay Versus Performance
As required by Section 953(a) of the Dodd-Frank Wall Street Reform and Consumer Protection Act and Item 402(v) of Regulation
S-K,
we are providing the following information about the relationship between executive “compensation actually paid” (as determined in accordance with the rules prescribed under Item 402(v)) to (i) each individual who has served as our principal executive officer (“PEO”) during any or all of 2021, 2022, 2023, 2024 and 2025 and (ii) our other non-PEO
named executive officers (determined as an average, as set forth below) during each of 2021, 2022, 2023, 2024 and 2025, and our financial performance. For more information about our executive compensation program, please refer to the “Compensation Discussion and Analysis” section above. Summary Compensation Table Total for ($) |
Compensation Actually Paid to ($) |
Average Summary Compensation Table Total for Non-PEO Named Executive Officers ($) (1) (2) |
Average Compensation Actually Paid to Non-PEO Named Executive Officers ($) (1) (2) |
Value of Initial Fixed $100 Investment Based on: |
Net Income (in millions) ($) |
Fee Related Earnings (FRE) (in millions) ($) (4) | ||||||||||||||||||||||||||||||||||||||||||||
Year |
Marc Rowan |
Leon Black |
Marc Rowan |
Leon Black |
Total Shareholder Return ($) |
Peer Group Total Shareholder Return ($) (3) | ||||||||||||||||||||||||||||||||||||||||||||
2025 |
913,367 | — | 913,367 | — | 37,351,212 | 37,173,875 | 331 | 196 | 3,395 | 2,528 | ||||||||||||||||||||||||||||||||||||||||
2024 |
763,381 | — | 763,381 | — | 23,485,050 | 84,829,420 | 372 | 187 | 4,480 | 2,063 | ||||||||||||||||||||||||||||||||||||||||
2023 |
320,760 | — | 320,760 | — | 19,897,799 | 49,502,529 | 207 | 135 | 5,001 | 1,768 | ||||||||||||||||||||||||||||||||||||||||
2022 |
310,011 | — | 310,011 | — | 17,204,252 | 10,539,452 | 139 | 110 | (1,961 | ) | 1,410 | |||||||||||||||||||||||||||||||||||||||
2021 |
302,310 | 356,713 | 302,310 | 356,713 | 223,067,825 | 246,673,294 | 153 | 141 | 1,802 | 1,267 | ||||||||||||||||||||||||||||||||||||||||
| (1) | The non-PEO named executive officers in 2025 consist of Messrs. Belardi, Kelly and Zito and Ms. Chatterjee, in 2024 consist of Messrs. Belardi, Kelly and Kleinman and Ms. Chatterjee, in 2023 and 2022 consist of Messrs. Belardi, Kelly, Kleinman and John Suydam, and in 2021 consist of Messrs. Anthony Civale, Kelly, Kleinman and Zelter (as applicable, the “Non-PEO NEOs”). |
| (2) | “Compensation actually paid” has been calculated in accordance with the requirements of Item 402(v)(2)(iii) of Regulation S-K and does not reflect compensation actually earned, realized or received. To calculate the “compensation actually paid,” the following amounts were deducted from and added to the applicable “Summary Compensation Table Total” set forth above: |
Summary Compensation Table Total ($) |
Deductions of Reported Equity Values from Summary Compensation Table Total (a) ($) |
Equity Award Adjustments to Summary Compensation Table Total (b) ($) |
“Compensation Actually Paid” ($) | |||||||||||||||||
Marc Rowan |
||||||||||||||||||||
2025 |
913,367 | — | — | 913,367 | ||||||||||||||||
2024 |
763,381 | — | — | 763,381 | ||||||||||||||||
2023 |
320,760 | — | — | 320,760 | ||||||||||||||||
2022 |
310,011 | — | — | 310,011 | ||||||||||||||||
2021 |
302,310 | — | — | 302,310 | ||||||||||||||||
Leon Black |
||||||||||||||||||||
2021 |
356,713 | — | — | 356,713 | ||||||||||||||||
Average of Non-PEO Named Executive Officers |
||||||||||||||||||||
2025 |
37,351,212 | (12,930,166 | ) | 12,752,828 | 37,173,875 | |||||||||||||||
2024 |
23,485,050 | (5,992,848 | ) | 67,337,219 | 84,829,420 | |||||||||||||||
Summary Compensation Table Total ($) |
Deductions of Reported Equity Values from Summary Compensation Table Total (a) ($) |
Equity Award Adjustments to Summary Compensation Table Total (b) ($) |
“Compensation Actually Paid” ($) | |||||||||||||||||
2023 |
19,897,799 | (4,119,833 | ) | 33,724,563 | 49,502,529 | |||||||||||||||
2022 |
17,204,252 | (3,862,211 | ) | (2,802,589 | ) | 10,539,452 | ||||||||||||||
2021 |
223,067,825 | (206,199,646 | ) | 229,805,115 | 246,673,294 | |||||||||||||||
| (a) | Represents the grant date fair value of equity-based awards granted in each year, as reflected in the “Stock Awards” column of the Summary Compensation Table above. |
| (b) | Reflects adjustments to the value of Stock Awards, as calculated in accordance with the rules prescribed under Item 402(v) and in accordance with ASC Topic 718, which included the categories of adjustments for each year as set forth below. For additional information regarding the determination of fair value, see Note 7 to our consolidated financial statements in our Annual Report on Form 10-K for the fiscal year ended December 31, 2025. |
| (3) | The Peer Group for these purposes is the Dow Jones U.S. Asset Manager Index. |
| (4) | Our company-selected measure is Fee Related Earnings (“FRE”). FRE is further described in our Annual Report on Form 10-K, including a reconciliation of non-GAAP measures to the corresponding GAAP measure within “Management’s Discussion and Analysis of Financial Condition and Results of Operations-Managing Business Performance-Key Segment and Non-U.S. GAAP Performance Measures-Fee Related Earnings, Spread Related Earnings and Principal Investing Income.” |
Year End Fair Value of Awards Granted During Year that Remained Outstanding and Unvested at Year End ($) |
Year Over Year Change in Fair Value of Outstanding and Unvested Equity Awards Granted in a Prior Year that Remained Outstanding and Unvested at Year End ($) |
Fair Value as of Vesting Date of Equity Awards Granted and Vested in Same Year ($) |
Year Over Year Change in Fair Value of Equity Awards Granted in a Prior Year that Vested in the Year ($) |
Fair Value at the End of the Prior Year of Equity Awards that Failed to Meet Vesting Conditions During Year ($) |
Value of Dividends or Other Earnings Paid on Equity Awards not Otherwise Reflected in Fair Value or Total Compensation ($) |
Total Equity Award Adjustments ($) | |||||||||||||||||||||||||||||
Marc Rowan |
|||||||||||||||||||||||||||||||||||
2025 |
— | — | — | — | — | — | — | ||||||||||||||||||||||||||||
2024 |
— | — | — | — | — | — | — | ||||||||||||||||||||||||||||
2023 |
— | — | — | — | — | — | — | ||||||||||||||||||||||||||||
2022 |
— | — | — | — | — | — | — | ||||||||||||||||||||||||||||
2021 |
— | — | — | — | — | — | — | ||||||||||||||||||||||||||||
Leon Black |
|||||||||||||||||||||||||||||||||||
2021 |
— | — | — | — | — | — | — | ||||||||||||||||||||||||||||
Average of Non-PEO Named Executive Officers |
|||||||||||||||||||||||||||||||||||
2025 |
9,121,344 | 347,891 | 1,973,508 | (335,645 | ) | — | 1,645,730 | 12,752,828 | |||||||||||||||||||||||||||
2024 |
6,436,156 | 54,099,951 | 1,264,578 | 3,146,111 | — | 2,390,423 | 67,337,219 | ||||||||||||||||||||||||||||
2023 |
3,221,302 | 25,586,288 | 1,838,687 | 792,835 | — | 2,285,451 | 33,724,563 | ||||||||||||||||||||||||||||
2022 |
2,418,692 | (8,434,175 | ) | 1,512,065 | (480,597 | ) | — | 2,181,426 | (2,802,589 | ) | |||||||||||||||||||||||||
2021 |
118,424,882 | 13,410,784 | 95,087,132 | 1,483,123 | — | 1,399,194 | 229,805,115 | ||||||||||||||||||||||||||||
non-PEO
named executive officers in 2025 consist of Messrs. Belardi, Kelly and Zito and Ms. Chatterjee, in 2024 consist of Messrs. Belardi, Kelly and Kleinman and Ms. Chatterjee, in 2023 and 2022 consist of Messrs. Belardi, Kelly, Kleinman and John Suydam, and in 2021 consist of Messrs. Anthony Civale, Kelly, Kleinman and Zelter (as applicable, the “Non-PEO
NEOs”).
Summary Compensation Table Total ($) |
Deductions of Reported Equity Values from Summary Compensation Table Total (a) ($) |
Equity Award Adjustments to Summary Compensation Table Total (b) ($) |
“Compensation Actually Paid” ($) | |||||||||||||||||
Marc Rowan |
||||||||||||||||||||
2025 |
913,367 | — | — | 913,367 | ||||||||||||||||
2024 |
763,381 | — | — | 763,381 | ||||||||||||||||
2023 |
320,760 | — | — | 320,760 | ||||||||||||||||
2022 |
310,011 | — | — | 310,011 | ||||||||||||||||
2021 |
302,310 | — | — | 302,310 | ||||||||||||||||
Leon Black |
||||||||||||||||||||
2021 |
356,713 | — | — | 356,713 | ||||||||||||||||
Average of Non-PEO Named Executive Officers |
||||||||||||||||||||
2025 |
37,351,212 | (12,930,166 | ) | 12,752,828 | 37,173,875 | |||||||||||||||
2024 |
23,485,050 | (5,992,848 | ) | 67,337,219 | 84,829,420 | |||||||||||||||
Summary Compensation Table Total ($) |
Deductions of Reported Equity Values from Summary Compensation Table Total (a) ($) |
Equity Award Adjustments to Summary Compensation Table Total (b) ($) |
“Compensation Actually Paid” ($) | |||||||||||||||||
2023 |
19,897,799 | (4,119,833 | ) | 33,724,563 | 49,502,529 | |||||||||||||||
2022 |
17,204,252 | (3,862,211 | ) | (2,802,589 | ) | 10,539,452 | ||||||||||||||
2021 |
223,067,825 | (206,199,646 | ) | 229,805,115 | 246,673,294 | |||||||||||||||
Year End Fair Value of Awards Granted During Year that Remained Outstanding and Unvested at Year End ($) |
Year Over Year Change in Fair Value of Outstanding and Unvested Equity Awards Granted in a Prior Year that Remained Outstanding and Unvested at Year End ($) |
Fair Value as of Vesting Date of Equity Awards Granted and Vested in Same Year ($) |
Year Over Year Change in Fair Value of Equity Awards Granted in a Prior Year that Vested in the Year ($) |
Fair Value at the End of the Prior Year of Equity Awards that Failed to Meet Vesting Conditions During Year ($) |
Value of Dividends or Other Earnings Paid on Equity Awards not Otherwise Reflected in Fair Value or Total Compensation ($) |
Total Equity Award Adjustments ($) | |||||||||||||||||||||||||||||
Marc Rowan |
|||||||||||||||||||||||||||||||||||
2025 |
— | — | — | — | — | — | — | ||||||||||||||||||||||||||||
2024 |
— | — | — | — | — | — | — | ||||||||||||||||||||||||||||
2023 |
— | — | — | — | — | — | — | ||||||||||||||||||||||||||||
2022 |
— | — | — | — | — | — | — | ||||||||||||||||||||||||||||
2021 |
— | — | — | — | — | — | — | ||||||||||||||||||||||||||||
Leon Black |
|||||||||||||||||||||||||||||||||||
2021 |
— | — | — | — | — | — | — | ||||||||||||||||||||||||||||
Average of Non-PEO Named Executive Officers |
|||||||||||||||||||||||||||||||||||
2025 |
9,121,344 | 347,891 | 1,973,508 | (335,645 | ) | — | 1,645,730 | 12,752,828 | |||||||||||||||||||||||||||
2024 |
6,436,156 | 54,099,951 | 1,264,578 | 3,146,111 | — | 2,390,423 | 67,337,219 | ||||||||||||||||||||||||||||
2023 |
3,221,302 | 25,586,288 | 1,838,687 | 792,835 | — | 2,285,451 | 33,724,563 | ||||||||||||||||||||||||||||
2022 |
2,418,692 | (8,434,175 | ) | 1,512,065 | (480,597 | ) | — | 2,181,426 | (2,802,589 | ) | |||||||||||||||||||||||||
2021 |
118,424,882 | 13,410,784 | 95,087,132 | 1,483,123 | — | 1,399,194 | 229,805,115 | ||||||||||||||||||||||||||||
Summary Compensation Table Total ($) |
Deductions of Reported Equity Values from Summary Compensation Table Total (a) ($) |
Equity Award Adjustments to Summary Compensation Table Total (b) ($) |
“Compensation Actually Paid” ($) | |||||||||||||||||
Marc Rowan |
||||||||||||||||||||
2025 |
913,367 | — | — | 913,367 | ||||||||||||||||
2024 |
763,381 | — | — | 763,381 | ||||||||||||||||
2023 |
320,760 | — | — | 320,760 | ||||||||||||||||
2022 |
310,011 | — | — | 310,011 | ||||||||||||||||
2021 |
302,310 | — | — | 302,310 | ||||||||||||||||
Leon Black |
||||||||||||||||||||
2021 |
356,713 | — | — | 356,713 | ||||||||||||||||
Average of Non-PEO Named Executive Officers |
||||||||||||||||||||
2025 |
37,351,212 | (12,930,166 | ) | 12,752,828 | 37,173,875 | |||||||||||||||
2024 |
23,485,050 | (5,992,848 | ) | 67,337,219 | 84,829,420 | |||||||||||||||
Summary Compensation Table Total ($) |
Deductions of Reported Equity Values from Summary Compensation Table Total (a) ($) |
Equity Award Adjustments to Summary Compensation Table Total (b) ($) |
“Compensation Actually Paid” ($) | |||||||||||||||||
2023 |
19,897,799 | (4,119,833 | ) | 33,724,563 | 49,502,529 | |||||||||||||||
2022 |
17,204,252 | (3,862,211 | ) | (2,802,589 | ) | 10,539,452 | ||||||||||||||
2021 |
223,067,825 | (206,199,646 | ) | 229,805,115 | 246,673,294 | |||||||||||||||
Year End Fair Value of Awards Granted During Year that Remained Outstanding and Unvested at Year End ($) |
Year Over Year Change in Fair Value of Outstanding and Unvested Equity Awards Granted in a Prior Year that Remained Outstanding and Unvested at Year End ($) |
Fair Value as of Vesting Date of Equity Awards Granted and Vested in Same Year ($) |
Year Over Year Change in Fair Value of Equity Awards Granted in a Prior Year that Vested in the Year ($) |
Fair Value at the End of the Prior Year of Equity Awards that Failed to Meet Vesting Conditions During Year ($) |
Value of Dividends or Other Earnings Paid on Equity Awards not Otherwise Reflected in Fair Value or Total Compensation ($) |
Total Equity Award Adjustments ($) | |||||||||||||||||||||||||||||
Marc Rowan |
|||||||||||||||||||||||||||||||||||
2025 |
— | — | — | — | — | — | — | ||||||||||||||||||||||||||||
2024 |
— | — | — | — | — | — | — | ||||||||||||||||||||||||||||
2023 |
— | — | — | — | — | — | — | ||||||||||||||||||||||||||||
2022 |
— | — | — | — | — | — | — | ||||||||||||||||||||||||||||
2021 |
— | — | — | — | — | — | — | ||||||||||||||||||||||||||||
Leon Black |
|||||||||||||||||||||||||||||||||||
2021 |
— | — | — | — | — | — | — | ||||||||||||||||||||||||||||
Average of Non-PEO Named Executive Officers |
|||||||||||||||||||||||||||||||||||
2025 |
9,121,344 | 347,891 | 1,973,508 | (335,645 | ) | — | 1,645,730 | 12,752,828 | |||||||||||||||||||||||||||
2024 |
6,436,156 | 54,099,951 | 1,264,578 | 3,146,111 | — | 2,390,423 | 67,337,219 | ||||||||||||||||||||||||||||
2023 |
3,221,302 | 25,586,288 | 1,838,687 | 792,835 | — | 2,285,451 | 33,724,563 | ||||||||||||||||||||||||||||
2022 |
2,418,692 | (8,434,175 | ) | 1,512,065 | (480,597 | ) | — | 2,181,426 | (2,802,589 | ) | |||||||||||||||||||||||||
2021 |
118,424,882 | 13,410,784 | 95,087,132 | 1,483,123 | — | 1,399,194 | 229,805,115 | ||||||||||||||||||||||||||||
The following graph shows the relationship between the “compensation actually paid” to each of Messrs. Rowan and Black and the average of the “compensation actually paid” to our
Non-PEO
NEOs (in each case, with “compensation actually paid” calculated as set forth above in accordance with the rules prescribed under Item 402(v) of Regulation S-K)
in 2021, 2022, 2023, 2024 and 2025 and our cumulative total shareholder return (“TSR”) measured starting from December 31, 2020 for each covered fiscal year. This graph also shows the relationship between our TSR performance and the TSR performance of the Peer Group in the Pay Versus Performance Table (which is the Dow Jones U.S. Asset Manager Index) over the same period. 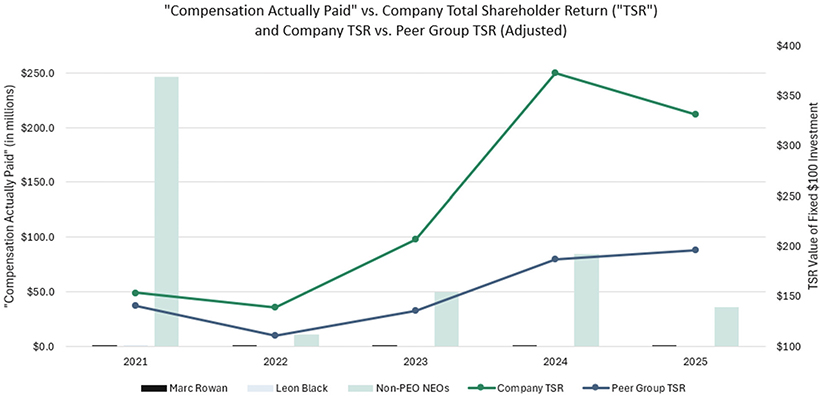
The following graph shows the relationship between the “compensation actually paid” to each of Messrs. Rowan and Black and the average of the “compensation actually paid” to
our non-PEO NEOs
(in each case, with “compensation actually paid” calculated as set forth above in accordance with the rules prescribed under Item 402(v)) in 2021, 2022, 2023, 2024 and 2025 and our net income available for our common stockholders in 2021, 2022, 2023, 2024 and 2025. 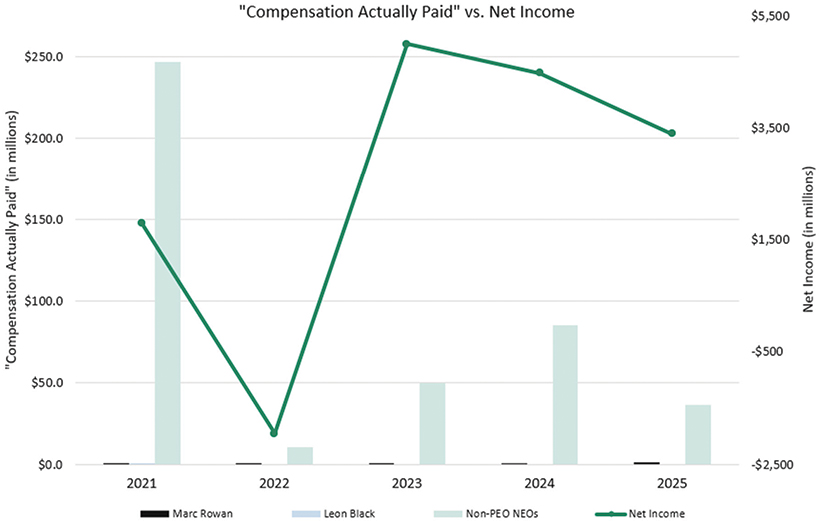
The following graph shows the relationship between the “compensation actually paid” to each of Messrs. Rowan and Black and the average of the “compensation actually paid” to our
non-PEO
NEOs (in each case, with “compensation actually paid” calculated as set forth above in accordance with the rules prescribed under Item 402(v)) in 2021, 2022, 2023, 2024 and 2025 and the performance of our company-selected measure, Fee Related Earnings, in 2021, 2022, 2023, 2024 and 2025. 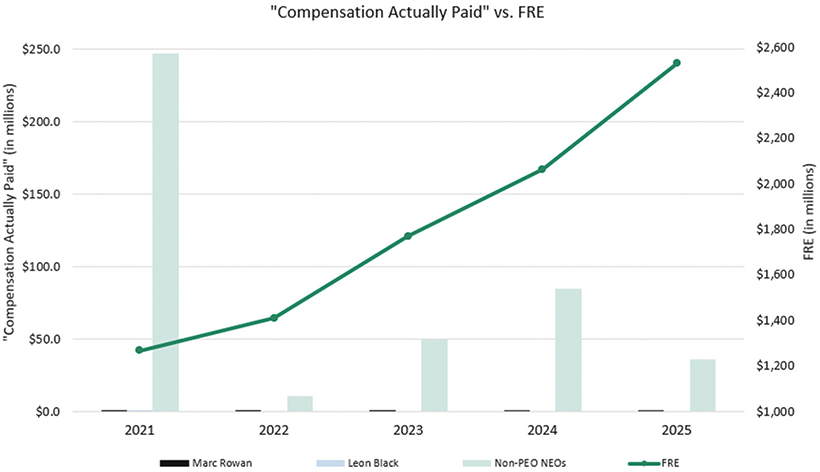
The following graph shows the relationship between the “compensation actually paid” to each of Messrs. Rowan and Black and the average of the “compensation actually paid” to our
Non-PEO
NEOs (in each case, with “compensation actually paid” calculated as set forth above in accordance with the rules prescribed under Item 402(v) of Regulation S-K)
in 2021, 2022, 2023, 2024 and 2025 and our cumulative total shareholder return (“TSR”) measured starting from December 31, 2020 for each covered fiscal year. This graph also shows the relationship between our TSR performance and the TSR performance of the Peer Group in the Pay Versus Performance Table (which is the Dow Jones U.S. Asset Manager Index) over the same period.
Tabular List of Most Important Performance Measures
The following provides a list of the performance measures that we believe are the most important performance measures used to link compensation actually paid to company performance for 2025. We are providing this list in accordance with Item 402(v) of
Regulation S-K to
provide information on performance measures used by the Compensation Committee to determine NEO compensation. For more information, see the Compensation Discussion and Analysis above. Fee Related Earnings | ||
Adjusted Net Income | ||
Realized Performance Fees | ||
Spread Related Earnings |
10-K,
including a reconciliation of non-GAAP
measures to the corresponding GAAP measure within “Management’s Discussion and Analysis of Financial Condition and Results of Operations-Managing Business Performance-Key
Segment and Non-U.S.
GAAP Performance Measures-Fee
Related Earnings, Spread Related Earnings and Principal Investing Income.”