
Touchstone ETF Trust
| |
Ticker Symbol |
|
Principal U.S. Listing Exchange |
| Touchstone Dividend Select ETF |
DVND |
|
NYSE Arca, Inc. |
| Touchstone Dynamic International ETF |
TDI |
|
The Nasdaq Stock Market LLC |
| Touchstone International Equity ETF |
TLCI |
|
NYSE Arca, Inc. |
| Touchstone Large Company Growth ETF |
TLG |
|
The Nasdaq Stock Market LLC |
| Touchstone Sands Capital Emerging Markets ex-China Growth ETF |
TEMX |
|
Cboe BZX Exchange, Inc. |
| Touchstone Sands Capital US Select Growth ETF |
TSEL |
|
The Nasdaq Stock Market LLC |
| Touchstone Securitized Income ETF |
TSEC |
|
NYSE Arca, Inc. |
| Touchstone Strategic Income ETF |
SIO |
|
NYSE Arca, Inc. |
| Touchstone Ultra Short Income ETF |
TUSI |
|
Cboe BZX Exchange, Inc. |
| Touchstone US Large Cap Focused ETF |
LCF |
|
Cboe BZX Exchange, Inc. |
The Securities and Exchange Commission has not approved or disapproved these securities or determined if this prospectus is accurate or complete. Any representation to the contrary is a criminal offense.
| |
Touchstone Dividend Select ETF |
| |
|
| Management Fees |
|
| Distribution and/or Shareholder Service (12b-1) Fees(1) |
|
| Other Expenses |
|
| Acquired Fund Fees and Expenses (AFFE) |
|
| Total Annual Fund Operating Expenses(2) |
|
| Fee Waiver and/or Expense Reimbursement(3) |
( |
| Total Annual Fund Operating Expenses After Fee Waiver and/or Expense Reimbursement(2)(3) |
|
(1)
(2)
(3)
| | |
| 1 Year |
$ |
| 3 Years |
$ |
| 5 Years |
$ |
| 10 Years |
$ |
3
The Fund’s Principal Risks
The Fund’s share price will fluctuate. You could lose money on your investment in the Fund and the Fund could also return less than other investments. Investments in the Fund are not bank guaranteed, are not deposits, and are not insured by the Federal Deposit Insurance Corporation or any other federal government agency. As with any ETF, there is no guarantee that the Fund will achieve its investment goal. You can find more information about the Fund’s investments and risks under the “Principal Investment Strategies and Risks” section of the Fund’s prospectus. The Fund is subject to the principal risks summarized below.
4
5
| | ||
| |
|
% |
| |
|
% |
| |
|
% |
| |
|
Since Inception |
| |
1 Year |
|
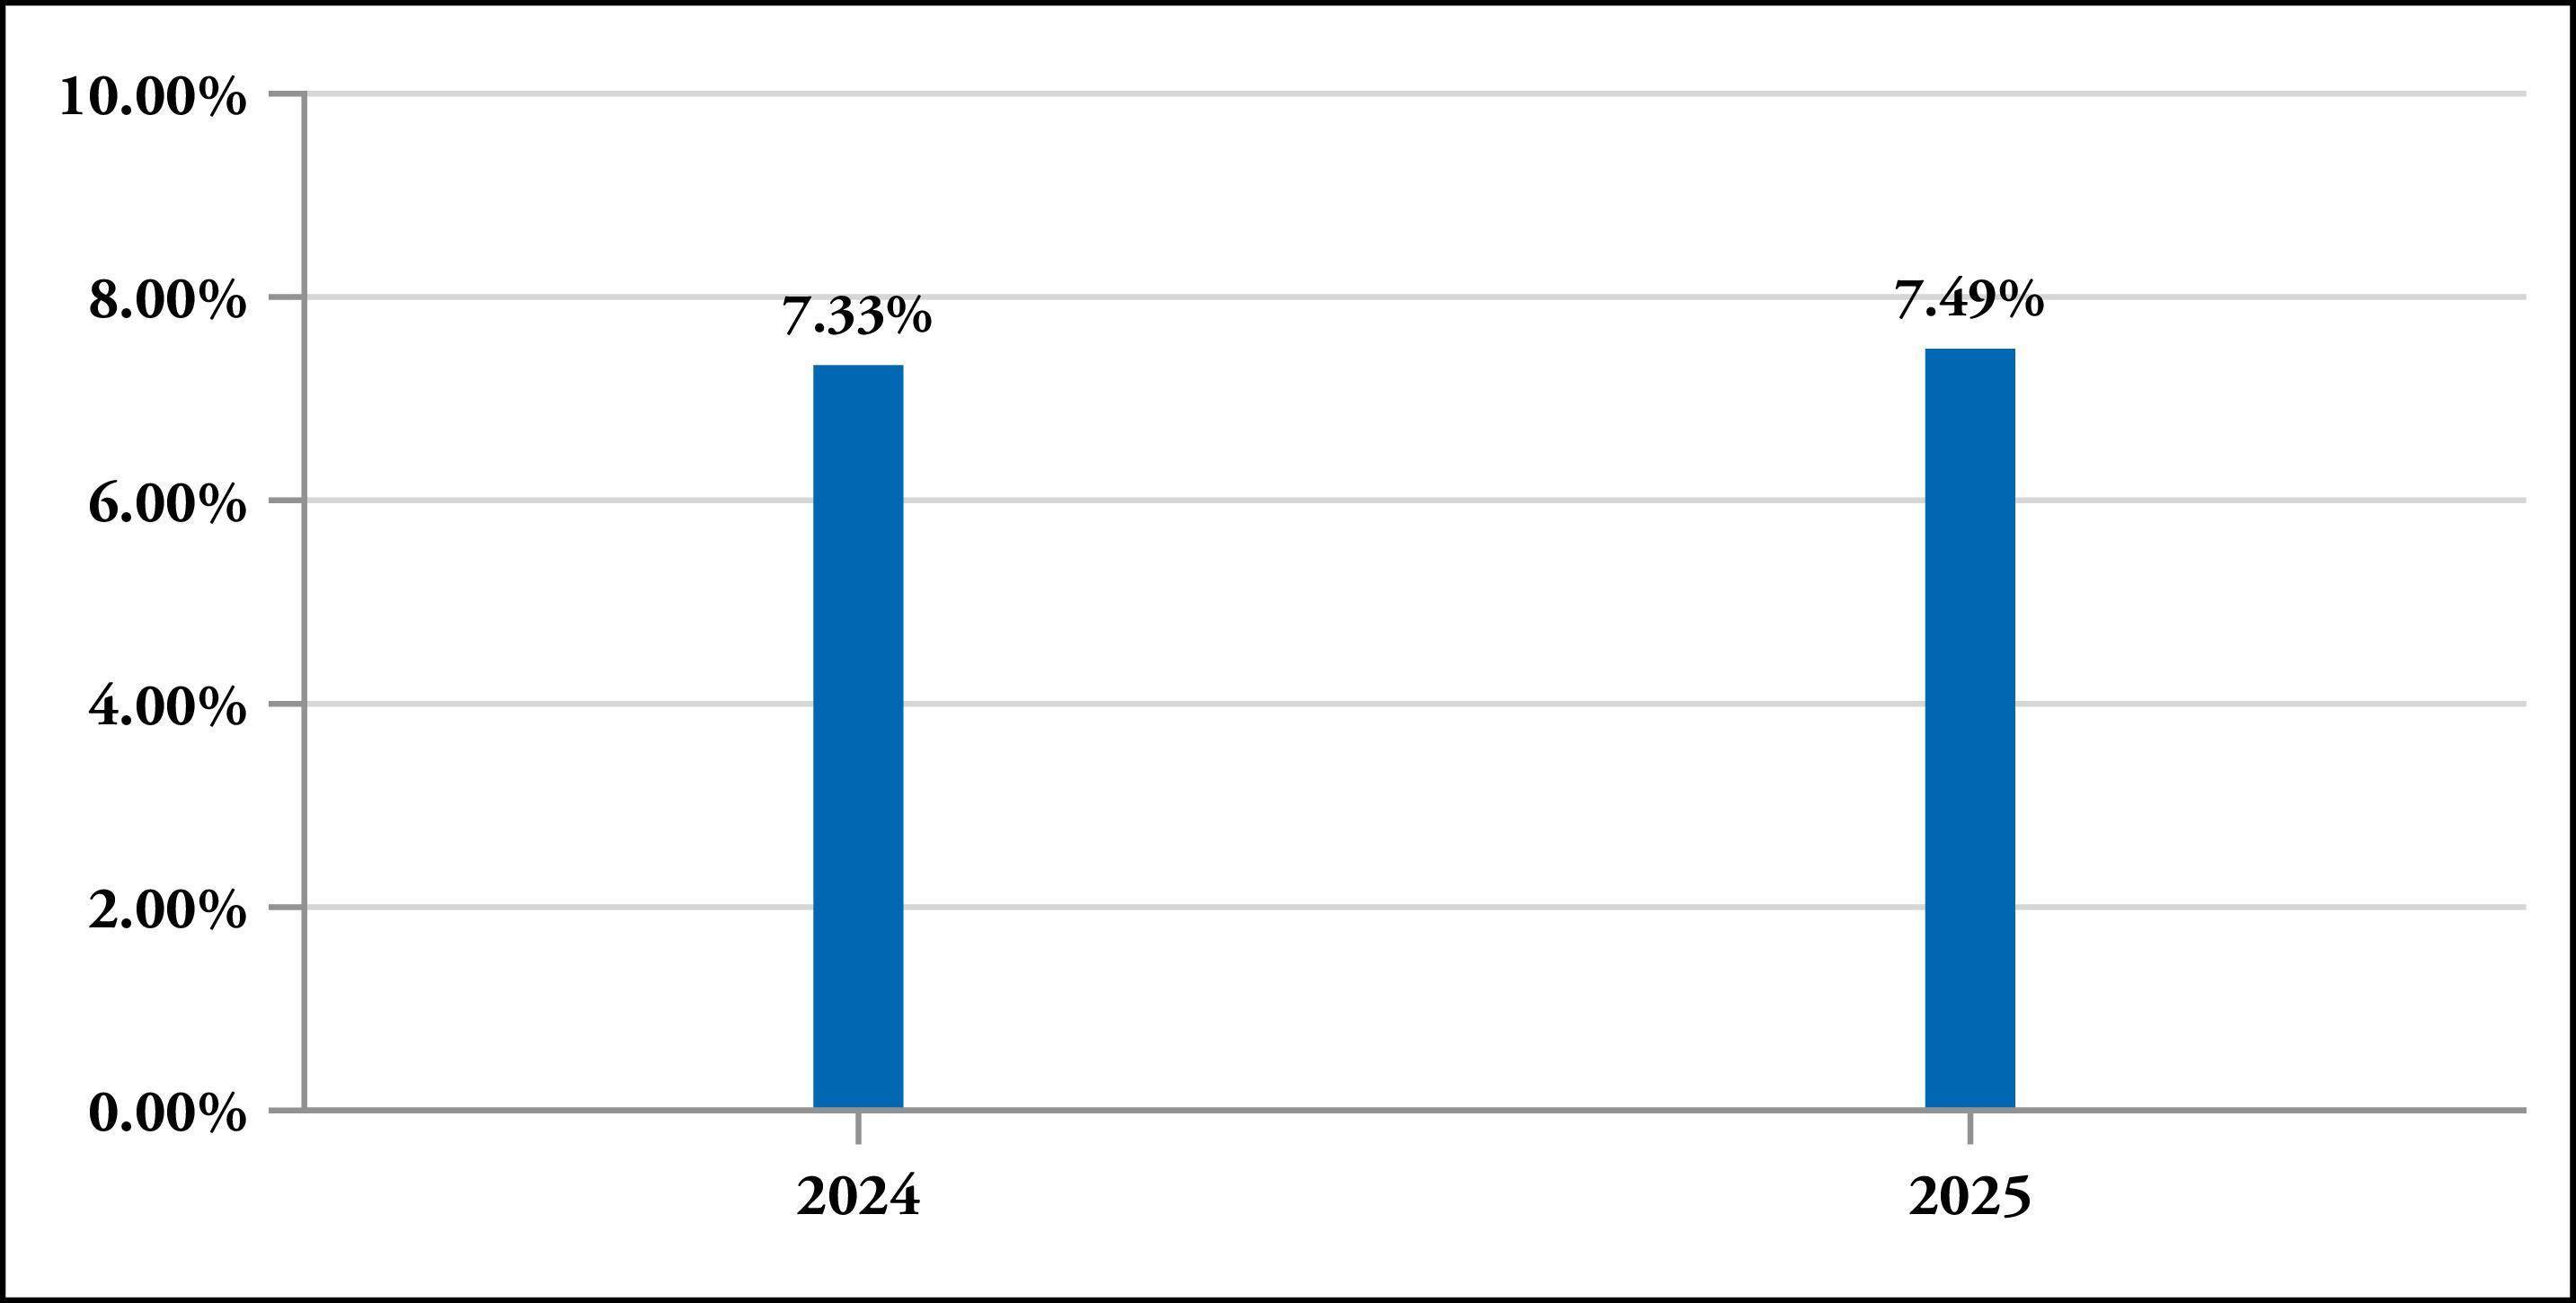
| Touchstone Dividend Select ETF |
|
|
| Return Before Taxes |
% |
% |
| Return After Taxes on Distributions |
% |
% |
| Return After Taxes on Distributions and Sale of Fund Shares |
% |
% |
| Bloomberg US 3000 Index(1) (reflects no deduction for fees, expenses or taxes) |
% |
% |
| Bloomberg US 1000 Value Index(2) (reflects no deduction for fees, expenses or taxes) |
% |
% |
| Russell 3000® Index (reflects no deduction for fees, expenses or taxes) |
% |
% |
| Russell 1000® Value Index (reflects no deduction for fees, expenses or taxes) |
% |
% |
(1)
(2)
The Fund’s Management
Investment Adviser
Touchstone Advisors, Inc. serves as the Fund’s investment adviser.
| Sub-Adviser |
Portfolio Managers |
Investment Experience with the Fund |
Primary Title with Sub-Adviser |
| Fort Washington Investment Advisors, Inc. |
Austin R. Kummer, CFA |
Since inception in August 2022 |
Managing Director, Senior Portfolio Manager |
| |
James E. Wilhelm, Jr. |
Since inception in August 2022 |
Managing Director, Senior Portfolio Manager |
6
Buying and Selling Fund Shares
The Fund is an ETF. Individual Fund shares may only be purchased and sold on a national securities exchange through a broker-dealer and may not be purchased or redeemed directly with the Fund. The price of Fund shares is based on market price, and because ETF shares trade at market prices rather than NAV, shares may trade at a premium or a discount. An investor may incur costs attributable to the difference between the highest price a buyer is willing to pay to purchase shares of the Fund (“bid”) and the lowest price a seller is willing to accept for shares (“ask”) when buying or selling shares in the secondary market (the “bid-ask spread”). Recent information, including information about the Fund’s NAV, market price, premiums and discounts, and bid-ask spreads, is included on the Fund’s website at TouchstoneInvestments.com/ETFs.
Tax Information
The Fund intends to make distributions that may be taxed as ordinary income or capital gains except when shares are held through a tax-advantaged account, such as a 401(k) plan or an IRA. Withdrawals from a tax-advantaged account, however, may be taxable.
Financial Intermediary Compensation
If you purchase shares in the Fund through a broker-dealer or other financial intermediary (such as a bank), the Adviser and its related companies may pay the intermediary for the sale of Fund shares and related services. These payments may create a conflict of interest by influencing the broker-dealer or other financial intermediary and your salesperson to recommend the Fund over another investment. Ask your salesperson or visit your financial intermediary’s website for more information.
7
| |
Touchstone Dynamic International ETF |
| |
|
| Management Fees |
|
| Distribution and/or Shareholder Service (12b-1) Fees(1) |
|
| Other Expenses |
|
| Total Annual Fund Operating Expenses |
|
| Fee Waiver and/or Expense Reimbursement(2) |
( |
| Total Annual Fund Operating Expenses After Fee Waiver and/or Expense Reimbursement(2) |
|
(1)
(2)
| | |
| 1 Year |
$ |
| 3 Years |
$ |
| 5 Years |
$ |
| 10 Years |
$ |
8
The Fund’s Principal Risks
The Fund’s share price will fluctuate. You could lose money on your investment in the Fund and the Fund could also return less than other investments. Investments in the Fund are not bank guaranteed, are not deposits, and are not insured by the Federal Deposit Insurance Corporation or any other federal government agency. As with any ETF, there is no guarantee that the Fund will achieve its investment goal. You can find more information about the Fund’s investments and risks under the “Principal Investment Strategies and Risks” section of the Fund’s prospectus. The Fund is subject to the principal risks summarized below.
9
10
| | ||
| |
|
% |
| |
|
% |
| |
|
% |
11
| |
1 Year |
5 Years |
10 Years |
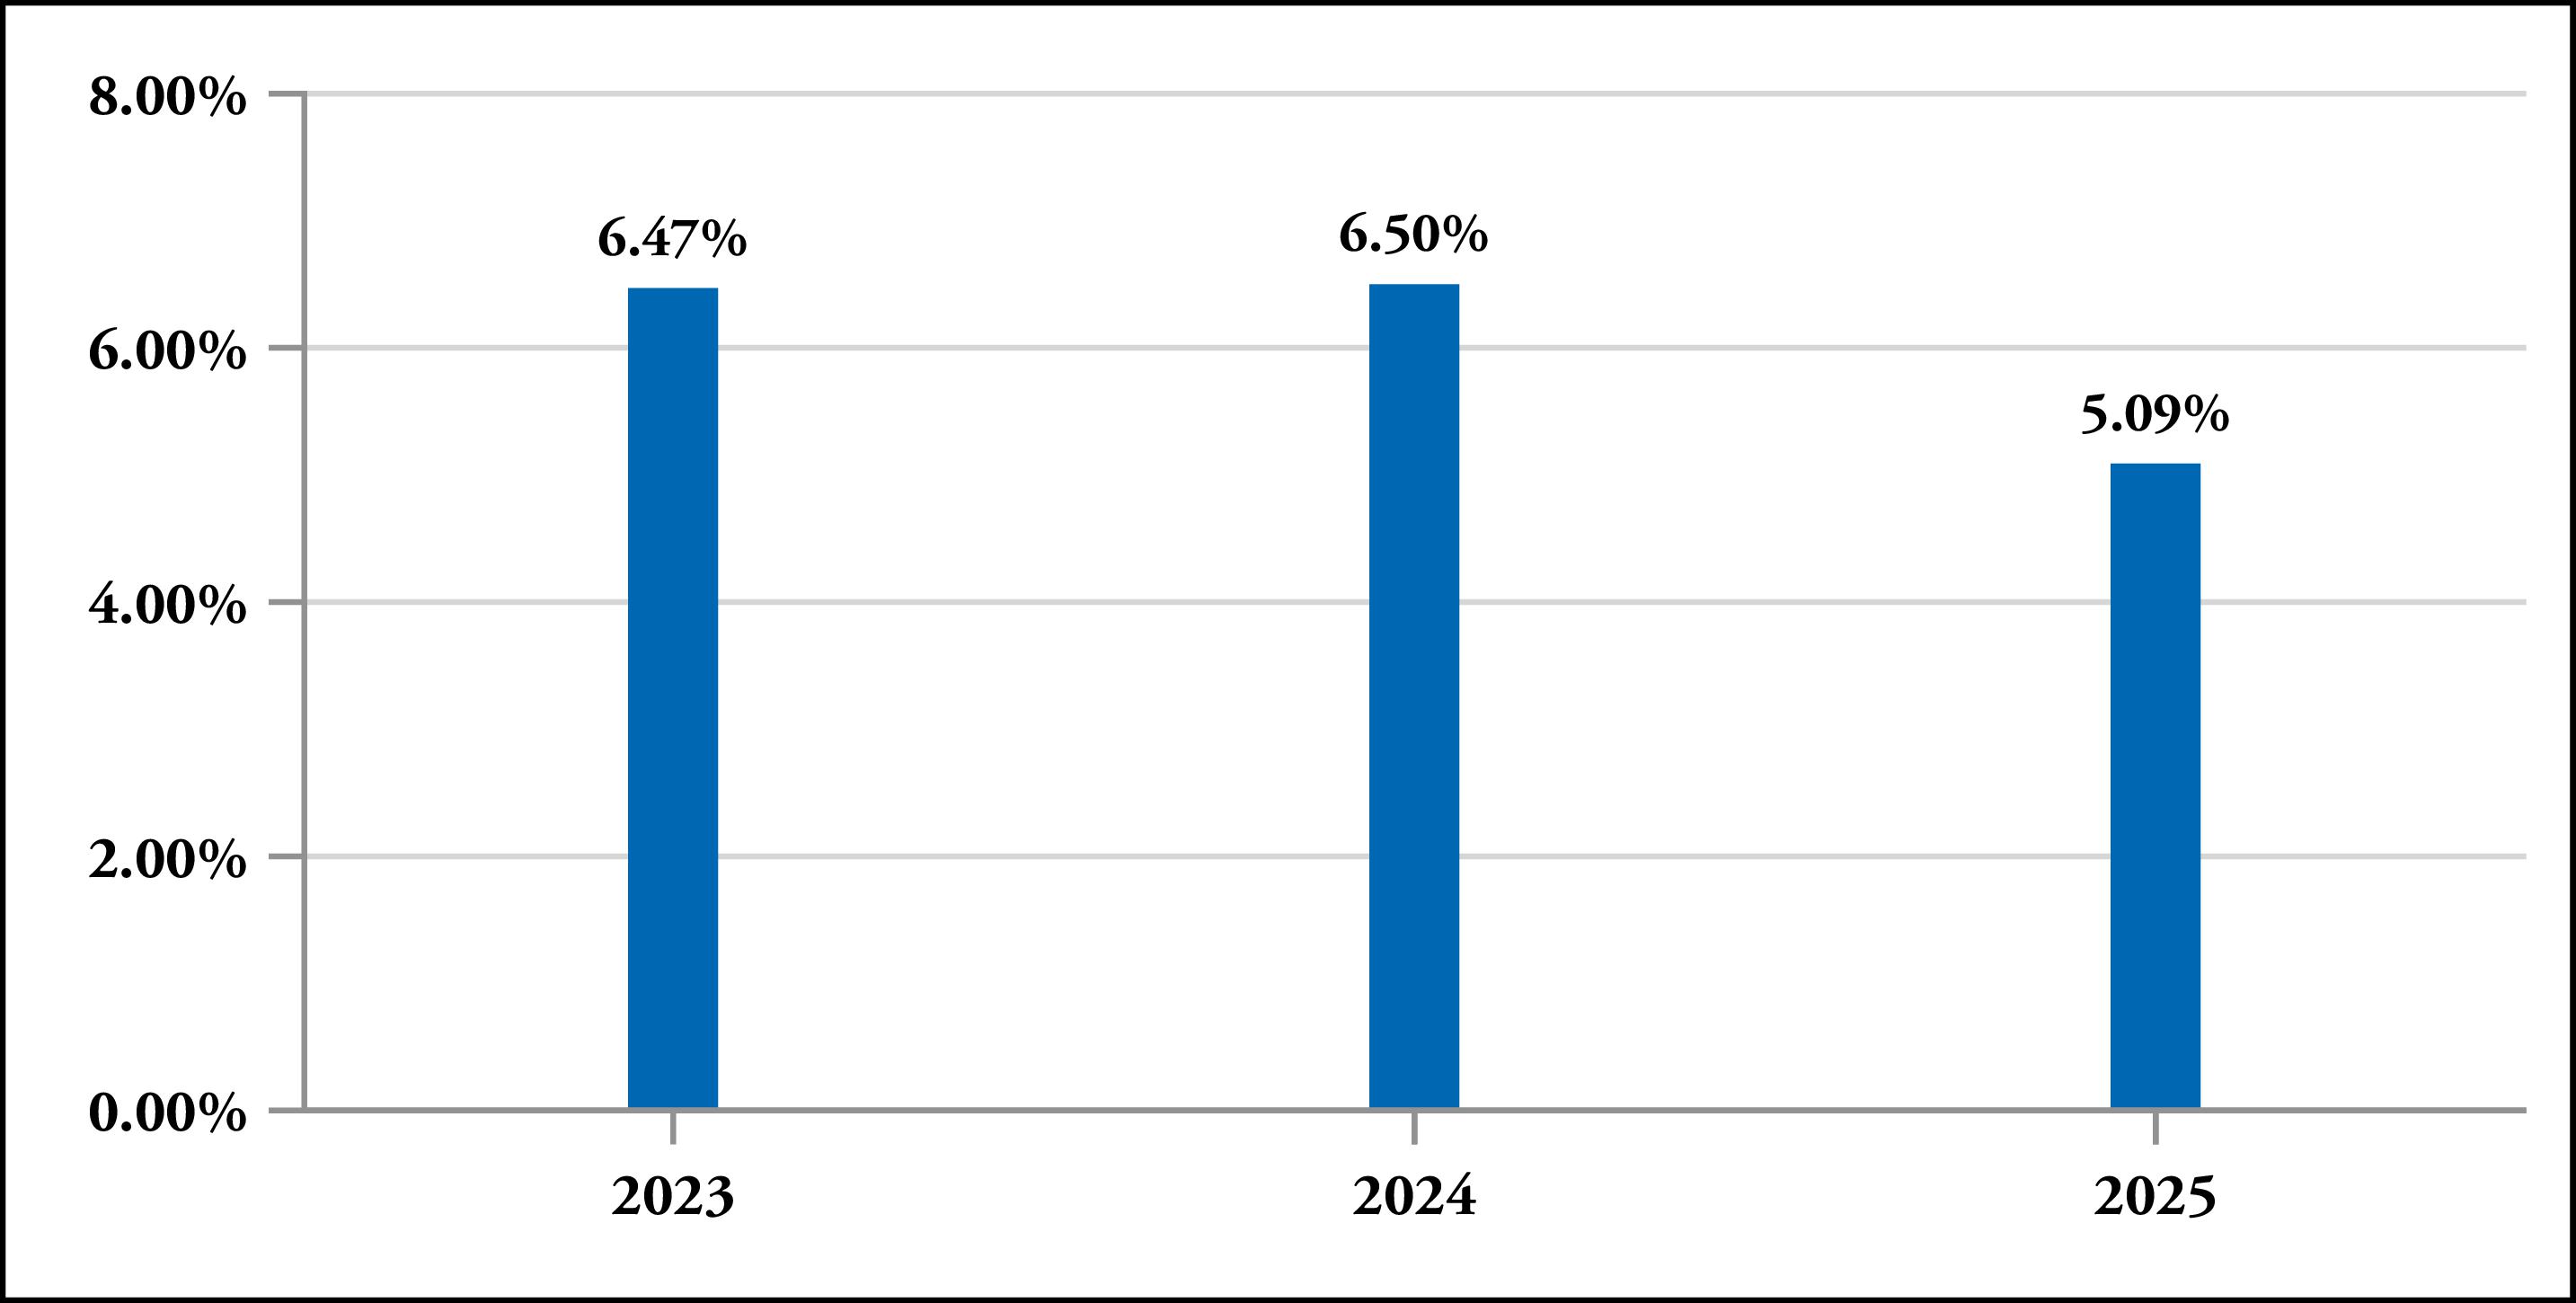
| Touchstone Dynamic International ETF |
|
|
|
| Return Before Taxes(1) |
% |
% |
% |
| Return After Taxes on Distributions |
% |
% |
% |
| Return After Taxes on Distributions and Sale of Fund Shares |
% |
% |
% |
| Bloomberg World ex US Large & Mid Cap Index(2) (reflects no deduction for fees, expenses or taxes, except foreign withholding taxes on dividends) |
% |
% |
% |
| MSCI All Country World Ex USA Index (reflects no deduction for fees, expenses or taxes, except foreign withholding taxes on dividends) |
% |
% |
% |
(1)
(2)
The Fund’s Management
Investment Adviser
Touchstone Advisors, Inc. serves as the Fund’s investment adviser.
| Sub-Adviser |
Portfolio Managers |
Investment Experience with the Fund |
Primary Title with Sub-Adviser |
| Los Angeles Capital Management LLC |
Hal W. Reynolds, CFA |
Since inception in December 2023 |
Vice Chairman |
| |
Ed Rackham, Ph.D. |
Since inception in December 2023 |
Chief Investment Officer |
| |
Daniel Arche, CFA |
Since inception in December 2023 |
Senior Portfolio Manager |
Buying and Selling Fund Shares
The Fund is an ETF. Individual Fund shares may only be purchased and sold on a national securities exchange through a broker-dealer and may not be purchased or redeemed directly with the Fund. The price of Fund shares is based on market price, and because ETF shares trade at market prices rather than NAV, shares may trade at a premium or a discount. An investor may incur costs attributable to the difference between the highest price a buyer is willing to pay to purchase shares of the Fund (“bid”) and the lowest price a seller is willing to accept for shares (“ask”) when buying or selling shares in the secondary market (the “bid-ask spread”). Recent information, including information about the Fund’s NAV, market price, premiums and discounts, and bid-ask spreads, is included on the Fund’s website at TouchstoneInvestments.com/ETFs.
Tax Information
The Fund intends to make distributions that may be taxed as ordinary income or capital gains except when shares are held through a tax-advantaged account, such as a 401(k) plan or an IRA. Withdrawals from a tax-advantaged account, however, may be taxable.
Financial Intermediary Compensation
If you purchase shares in the Fund through a broker-dealer or other financial intermediary (such as a bank), the Adviser and its related companies may pay the intermediary for the sale of Fund shares and related services. These payments may create a conflict of interest by influencing the broker-dealer or other financial intermediary and your salesperson to recommend the Fund over another investment. Ask your salesperson or visit your financial intermediary’s website for more information.
12
| |
Touchstone International Equity ETF |
| |
|
| Management Fees |
|
| Distribution and/or Shareholder Service (12b-1) Fees(1) |
|
| Other Expenses |
|
| Total Annual Fund Operating Expenses |
|
| Fee Waiver and/or Expense Reimbursement(2) |
( |
| Total Annual Fund Operating Expenses After Fee Waiver and/or Expense Reimbursement(2) |
|
(1)
(2)
| | |
| 1 Year |
$ |
| 3 Years |
$ |
| 5 Years |
$ |
| 10 Years |
$ |
13
The Fund’s Principal Risks
The Fund’s share price will fluctuate. You could lose money on your investment in the Fund and the Fund could also return less than other investments. Investments in the Fund are not bank guaranteed, are not deposits, and are not insured by the Federal Deposit Insurance Corporation (the “FDIC”) or any other federal government agency. As with any ETF, there is no guarantee that the Fund will achieve its investment goal. You can find more information about the Fund’s investments and risks under the “Principal Investment Strategies and Risks” section of the Fund’s prospectus. The Fund is subject to the principal risks summarized below.
14
The Fund’s Management
Investment Adviser
Touchstone Advisors, Inc. serves as the Fund’s investment adviser.
| Sub-Adviser |
Portfolio Manager |
Investment Experience with the Fund |
Primary Title with Sub-Adviser |
| London Company of Virginia d/b/a/ The London Company |
TJ Carter, CFA, CPA |
Since inception in March 2025 |
Portfolio Manager |
15
Buying and Selling Fund Shares
The Fund is an ETF. Individual Fund shares may only be purchased and sold on a national securities exchange through a broker-dealer and may not be purchased or redeemed directly with the Fund. The price of Fund shares is based on market price, and because ETF shares trade at market prices rather than NAV, shares may trade at a premium or a discount. An investor may incur costs attributable to the difference between the highest price a buyer is willing to pay to purchase shares of the Fund (“bid”) and the lowest price a seller is willing to accept for shares (“ask”) when buying or selling shares in the secondary market (the “bid-ask spread”). Recent information, including information about the Fund’s NAV, market price, premiums and discounts, and bid-ask spreads, is included on the Fund’s website at TouchstoneInvestments.com/ETFs.
Tax Information
The Fund intends to make distributions that may be taxed as ordinary income or capital gains except when shares are held through a tax-advantaged account, such as a 401(k) plan or an IRA. Withdrawals from a tax-advantaged account, however, may be taxable.
Financial Intermediary Compensation
If you purchase shares in the Fund through a broker-dealer or other financial intermediary (such as a bank), the Adviser and its related companies may pay the intermediary for the sale of Fund shares and related services. These payments may create a conflict of interest by influencing the broker-dealer or other financial intermediary and your salesperson to recommend the Fund over another investment. Ask your salesperson or visit your financial intermediary’s website for more information.
16
| |
Touchstone Large Company Growth ETF |
| |
|
| Management Fees |
|
| Distribution and/or Shareholder Service (12b-1) Fees(1) |
|
| Other Expenses(2) |
|
| Total Annual Fund Operating Expenses |
|
| Fee Waiver and/or Expense Reimbursement(3) |
( |
| Total Annual Fund Operating Expenses After Fee Waiver and/or Expense Reimbursement(3) |
|
(1)
(2)
(3)
| | |
| 1 Year |
$ |
| 3 Years |
$ |
| 5 Years |
$ |
| 10 Years |
$ |
17
The Fund’s Principal Risks
The Fund’s share price will fluctuate. You could lose money on your investment in the Fund and the Fund could also return less than other investments. Investments in the Fund are not bank guaranteed, are not deposits, and are not insured by the Federal Deposit Insurance Corporation or any other federal government agency. As with any ETF, there is no guarantee that the Fund will achieve its investment goal. You can find more information about the Fund’s investments and risks under the “Principal Investment Strategies and Risks” section of the Fund’s prospectus. The Fund is subject to the principal risks summarized below.
18
19
| | ||
| |
|
% |
| |
|
% |
| |
|
% |
| |
1 Year |
5 Years |
10 Years |
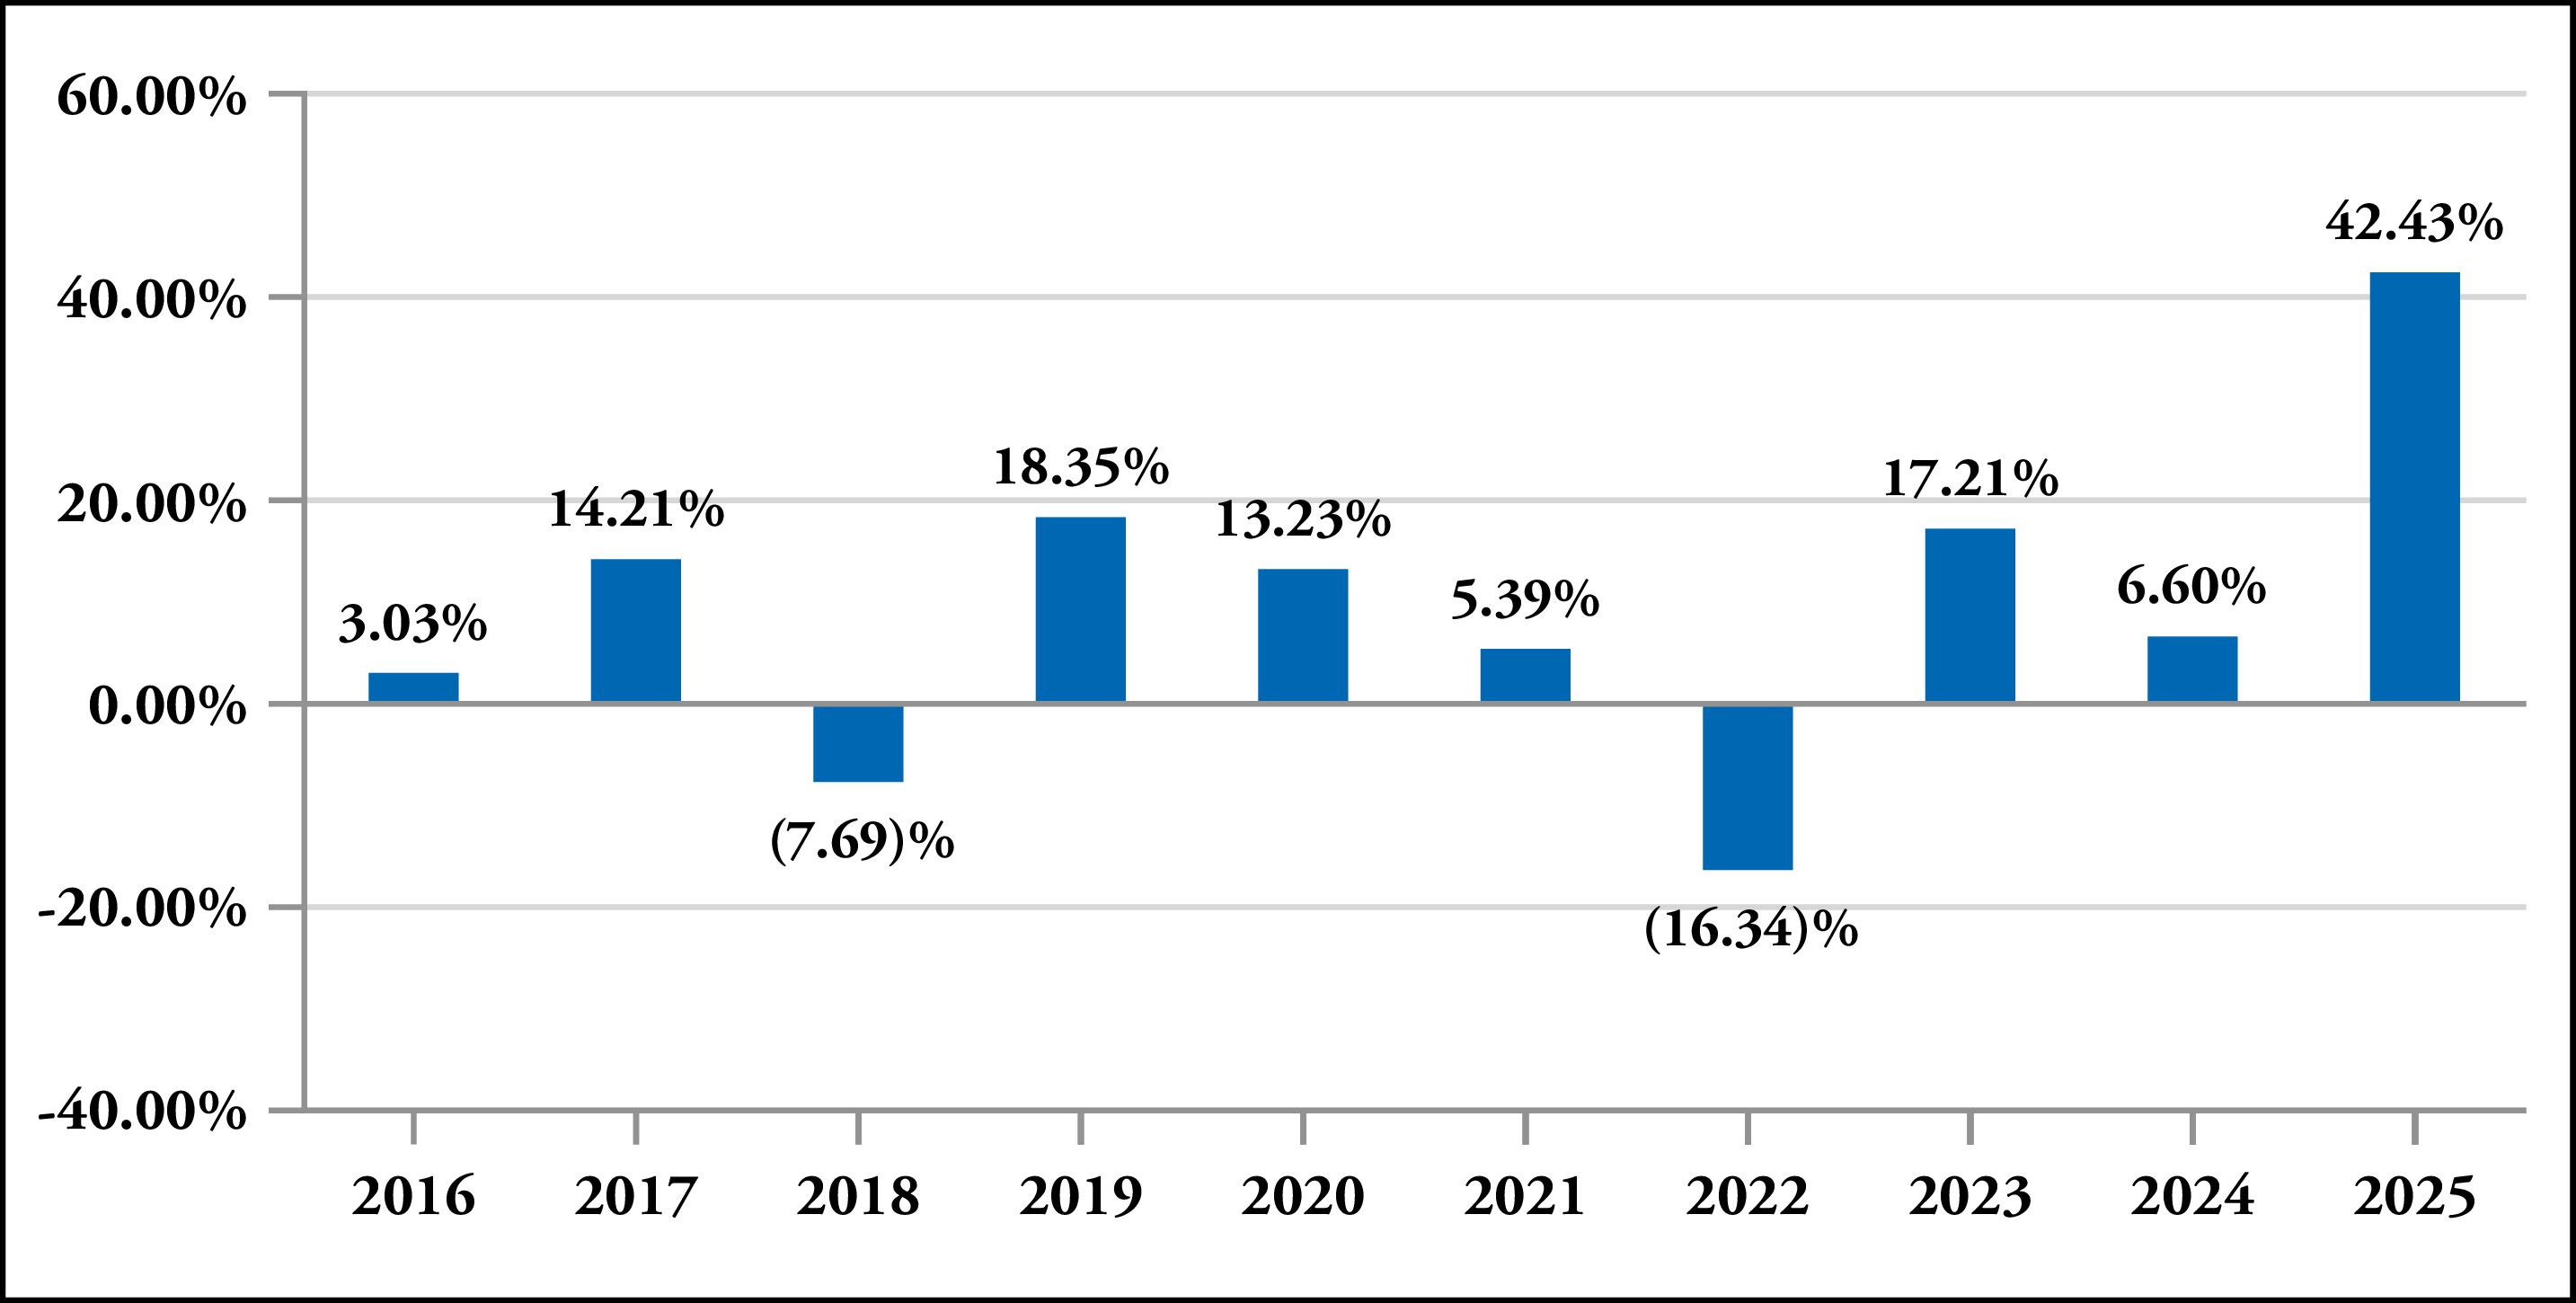
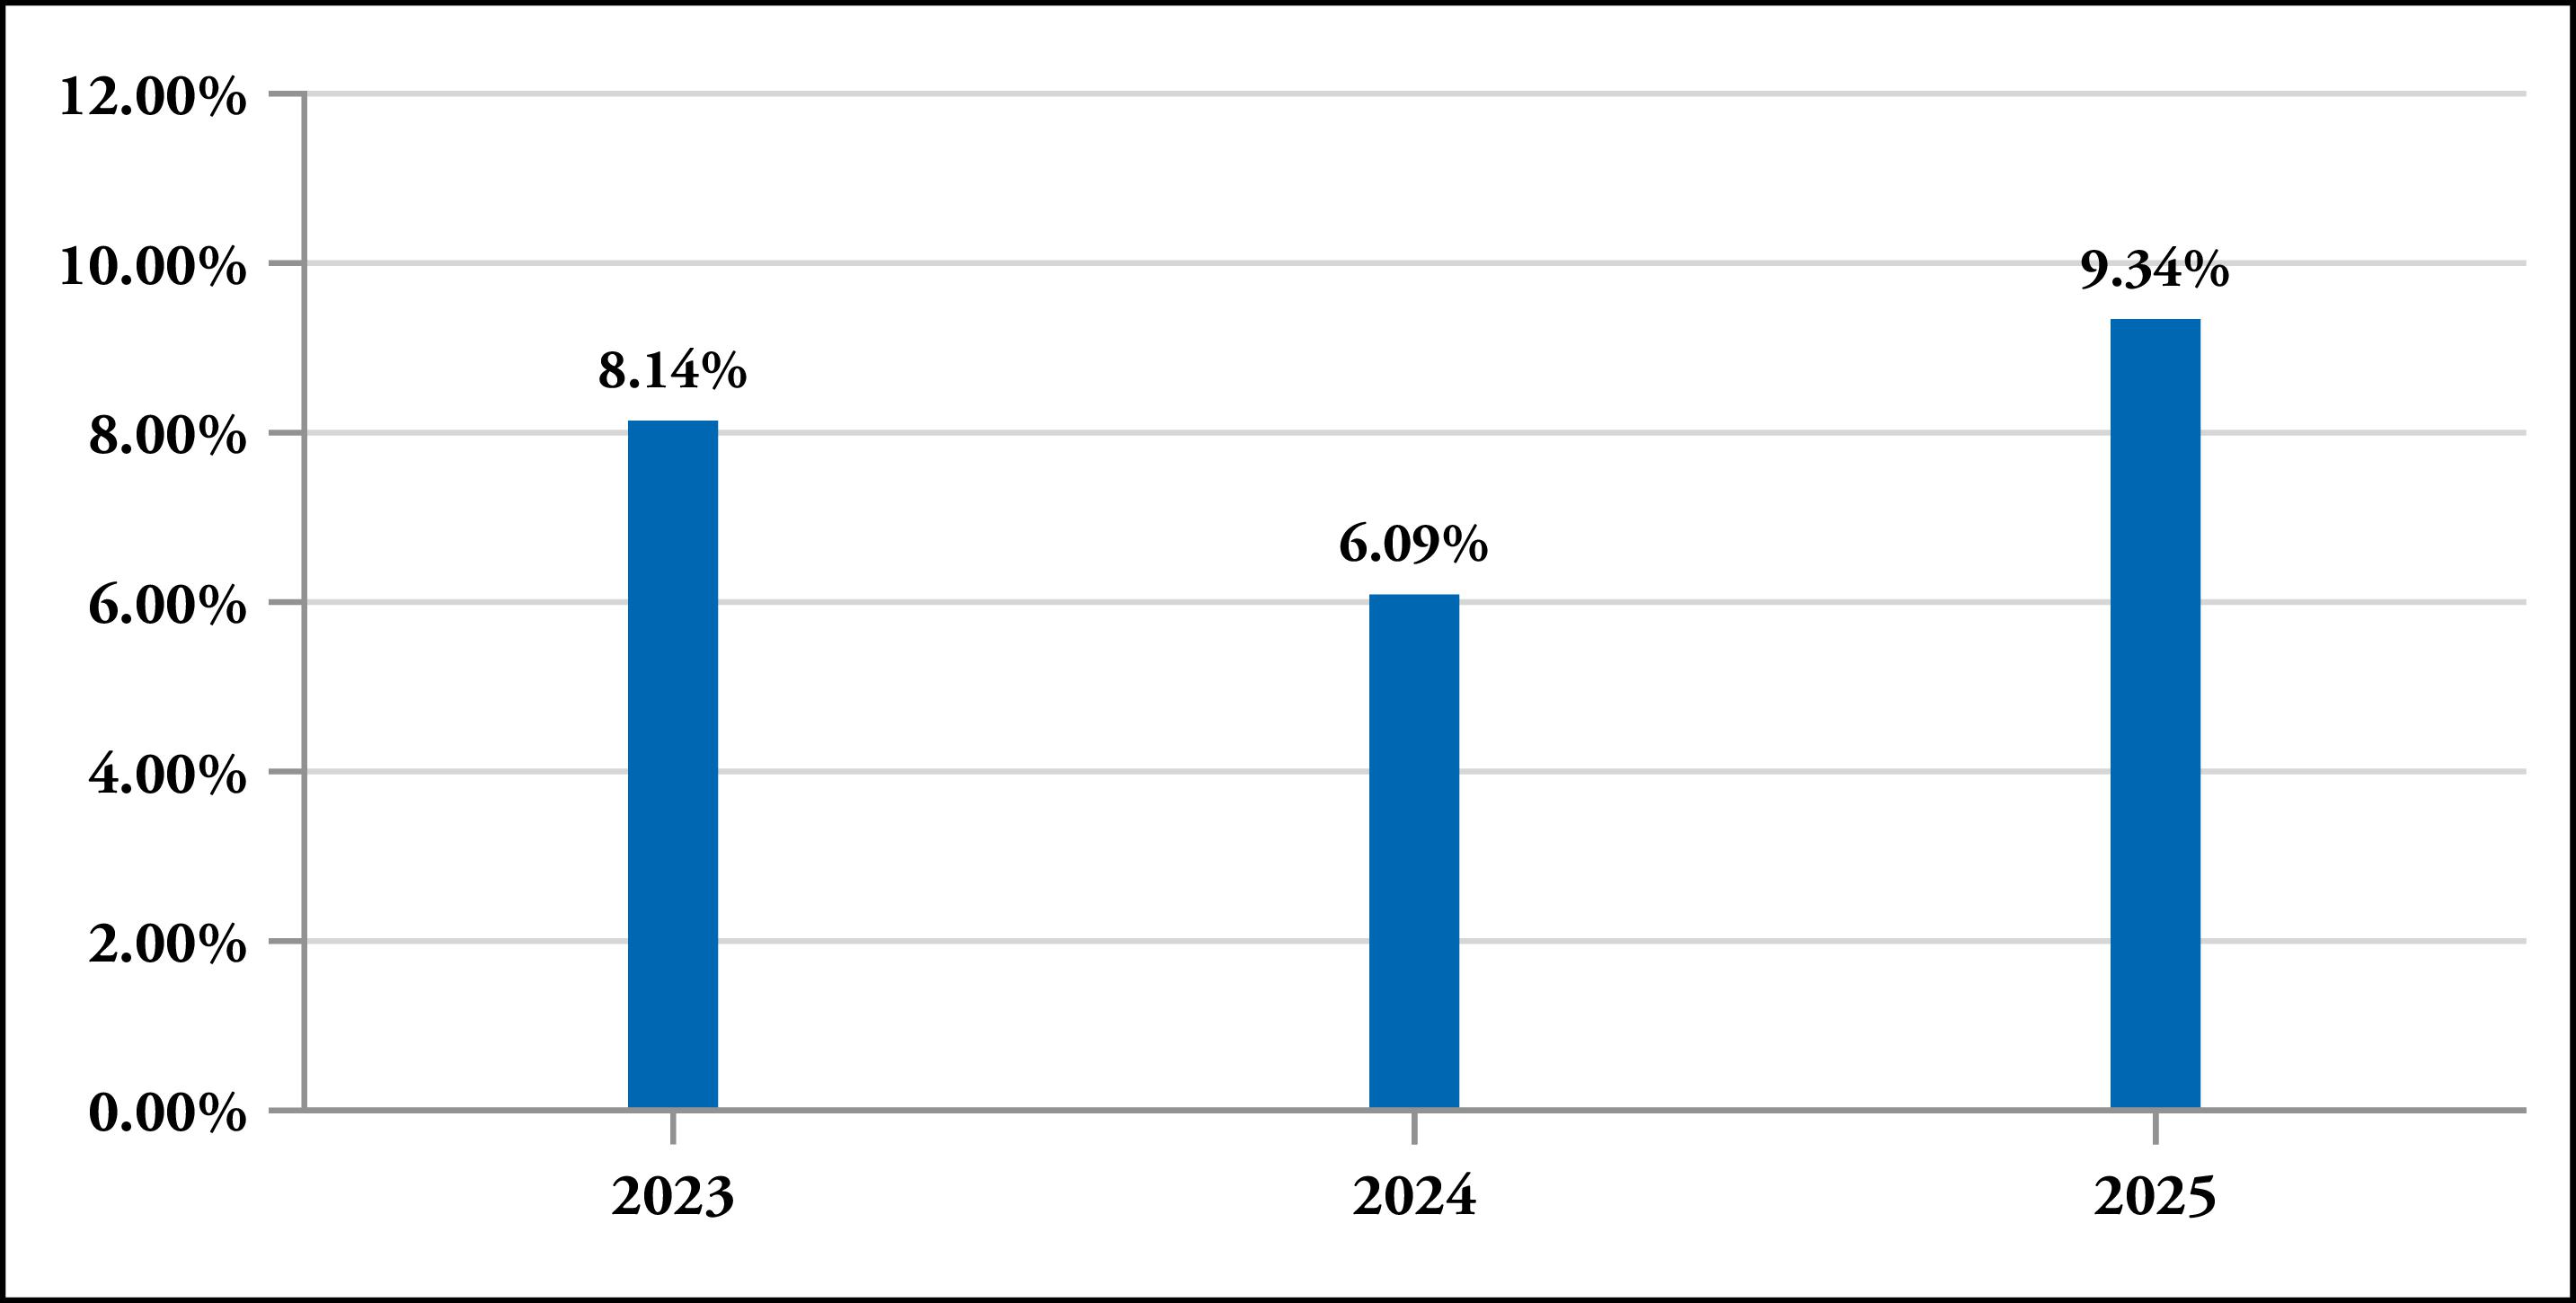
| Predecessor Fund - Touchstone Large Company Growth ETF |
|
|
|
| Return Before Taxes |
% |
% |
% |
| Return After Taxes on Distributions |
% |
% |
% |
| Return After Taxes on Distributions and Sale of Fund Shares |
% |
% |
% |
| Bloomberg US 3000 Index(1) (reflects no deduction for fees, expenses or taxes) |
% |
% |
% |
| Bloomberg US 1000 Growth Index(2) (reflects no deduction for fees, expenses or taxes) |
% |
% |
% |
| Russell 3000® Index (reflects no deduction for fees, expenses or taxes) |
% |
% |
% |
| Russell 1000® Growth Index (reflects no deduction for fees, expenses or taxes) |
% |
% |
% |
(1)
(2)
20
The Fund’s Management
Investment Adviser
Touchstone Advisors, Inc. serves as the Fund’s investment adviser.
| Sub- Adviser |
Portfolio Manager |
Investment Experience with the Fund and the Predecessor Fund |
Primary Title with Sub-Adviser |
| DSM Capital Partners LLC |
Daniel Strickberger |
Since inception in March, 2026; managed the Predecessor Fund from 2016 to 2026 |
Chief Investment Officer and Managing Partner |
| |
David McVey |
Since inception in March, 2026; managed the Predecessor Fund from 2020 to 2026 |
Deputy Chief Investment Officer and Portfolio Manager |
| |
Eric Woodworth, CFA |
Since inception in March, 2026; managed the Predecessor Fund from 2021 to 2026 |
Deputy Chief Investment Officer and Portfolio Manager |
Buying and Selling Fund Shares
The Fund is an ETF. Individual Fund shares may only be purchased and sold on a national securities exchange through a broker-dealer and may not be purchased or redeemed directly with the Fund. The price of Fund shares is based on market price, and because ETF shares trade at market prices rather than NAV, shares may trade at a premium or a discount. An investor may incur costs attributable to the difference between the highest price a buyer is willing to pay to purchase shares of the Fund (“bid”) and the lowest price a seller is willing to accept for shares (“ask”) when buying or selling shares in the secondary market (the “bid-ask spread”). Recent information, including information about the Fund’s NAV, market price, premiums and discounts, and bid-ask spreads, is included on the Fund’s website at TouchstoneInvestments.com/ETFs.
Tax Information
The Fund intends to make distributions that may be taxed as ordinary income or capital gains except when shares are held through a tax-advantaged account, such as a 401(k) plan or an IRA. Withdrawals from a tax-advantaged account, however, may be taxable.
Financial Intermediary Compensation
If you purchase shares in the Fund through a broker-dealer or other financial intermediary (such as a bank), the Adviser and its related companies may pay the intermediary for the sale of Fund shares and related services. These payments may create a conflict of interest by influencing the broker-dealer or other financial intermediary and your salesperson to recommend the Fund over another investment. Ask your salesperson or visit your financial intermediary’s website for more information.
21
| |
Touchstone Sands Capital Emerging Markets ex-China Growth ETF |
| |
|
| Management Fees |
|
| Distribution and/or Shareholder Service (12b-1) Fees(1) |
|
| Other Expenses |
|
| Acquired Fund Fees and Expenses (AFFE) |
|
| Total Annual Fund Operating Expenses(2) |
|
| Fee Waiver and/or Expense Reimbursement(3) |
( |
| Total Annual Fund Operating Expenses After Fee Waiver and/or Expense Reimbursement(2)(3) |
|
(1)
(2)
(3)
| | |
| 1 Year |
$ |
| 3 Years |
$ |
| 5 Years |
$ |
| 10 Years |
$ |
22
The Fund’s Principal Risks
The Fund’s share price will fluctuate. You could lose money on your investment in the Fund and the Fund could also return less than other investments. Investments in the Fund are not bank guaranteed, are not deposits, and are not insured by the Federal Deposit Insurance Corporation or any other federal government agency. As with any ETF, there is no guarantee that the Fund will achieve its investment goal. You can find more information about the Fund’s investments and risks under the “Principal Investment Strategies and Risks” section of the Fund’s prospectus. The Fund is subject to the principal risks summarized below.
23
24
25
The Fund’s Management
Investment Adviser
Touchstone Advisors, Inc. serves as the Fund’s investment adviser.
| Sub-Adviser |
Portfolio Managers |
Investment Experience with the Fund |
Primary Title with Sub-Adviser |
| Sands Capital Management, LLC |
Brian A. Christiansen, CFA |
Since inception in February 2025 |
Sr. Portfolio Manager, Research Analyst, Executive Managing Director |
| |
Teeja Boye, CFA |
Since inception in February 2025 |
Portfolio Manager and Sr. Research Analyst |
Buying and Selling Fund Shares
The Fund is an ETF. Individual Fund shares may only be purchased and sold on a national securities exchange through a broker-dealer and may not be purchased or redeemed directly with the Fund. The price of Fund shares is based on market price, and because ETF shares trade at market prices rather than NAV, shares may trade at a premium or a discount. An investor may incur costs attributable to the difference between the highest price a buyer is willing to pay to purchase shares of the Fund (“bid”) and the lowest price a seller is willing to accept for shares (“ask”) when buying or selling shares in the secondary market (the “bid-ask spread”). Recent information, including information about the Fund’s NAV, market price, premiums and discounts, and bid-ask spreads, is included on the Fund’s website at TouchstoneInvestments.com/ETFs.
Tax Information
The Fund intends to make distributions that may be taxed as ordinary income or capital gains except when shares are held through a tax-advantaged account, such as a 401(k) plan or an IRA. Withdrawals from a tax-advantaged account, however, may be taxable.
Financial Intermediary Compensation
If you purchase shares in the Fund through a broker-dealer or other financial intermediary (such as a bank), the Adviser and its related companies may pay the intermediary for the sale of Fund shares and related services. These payments may create a conflict of interest by influencing the broker-dealer or other financial intermediary and your salesperson to recommend the Fund over another investment. Ask your salesperson or visit your financial intermediary’s website for more information.
26
| |
Touchstone Sands Capital US Select Growth ETF |
| |
|
| Management Fees |
|
| Distribution and/or Shareholder Service (12b-1) Fees(1) |
|
| Other Expenses |
|
| Total Annual Fund Operating Expenses |
|
| Fee Waiver and/or Expense Reimbursement(2) |
( |
| Total Annual Fund Operating Expenses After Fee Waiver and/or Expense Reimbursement(2) |
|
(1)
(2)
| | |
| 1 Year |
$ |
| 3 Years |
$ |
| 5 Years |
$ |
| 10 Years |
$ |
27
The Fund’s Principal Risks
The Fund’s share price will fluctuate. You could lose money on your investment in the Fund and the Fund could also return less than other investments. Investments in the Fund are not bank guaranteed, are not deposits, and are not insured by the Federal Deposit Insurance Corporation or any other federal government agency. As with any ETF, there is no guarantee that the Fund will achieve its investment goal. You can find more information about the Fund’s investments and risks under the “Principal Investment Strategies and Risks” section of the Fund’s prospectus. The Fund is subject to the principal risks summarized below.
28
29
| | ||
| |
|
% |
| |
|
% |
| |
|
% |
| |
|
Since Inception |
| |
1 Year |
|
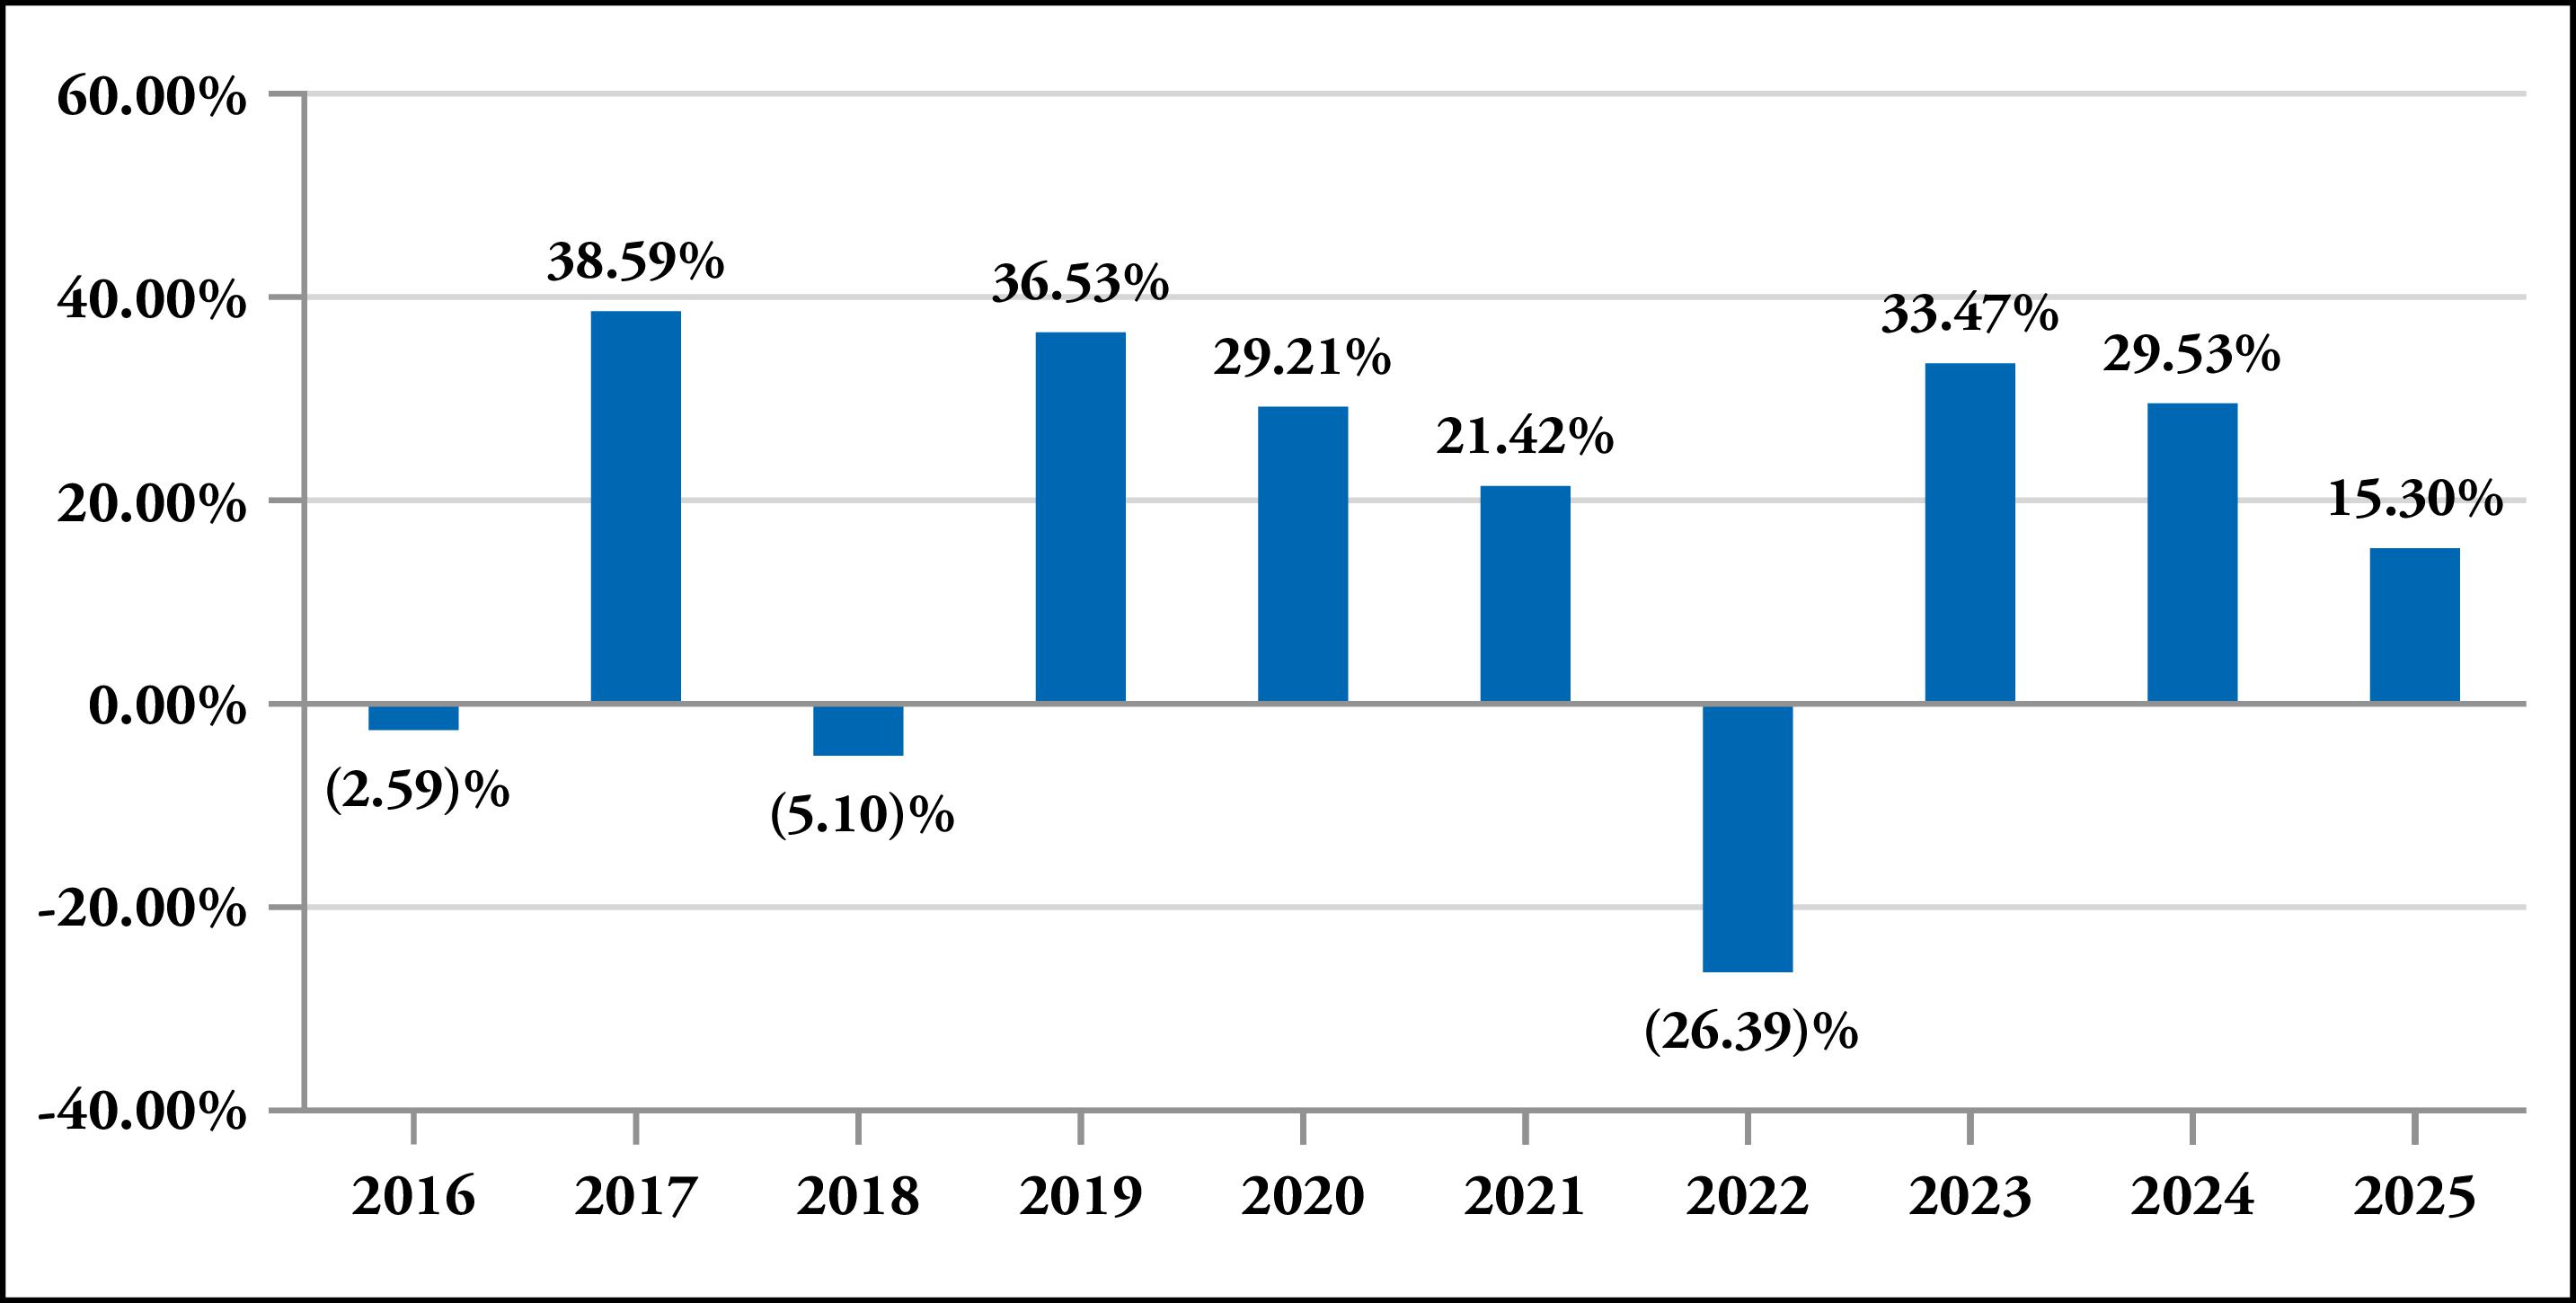
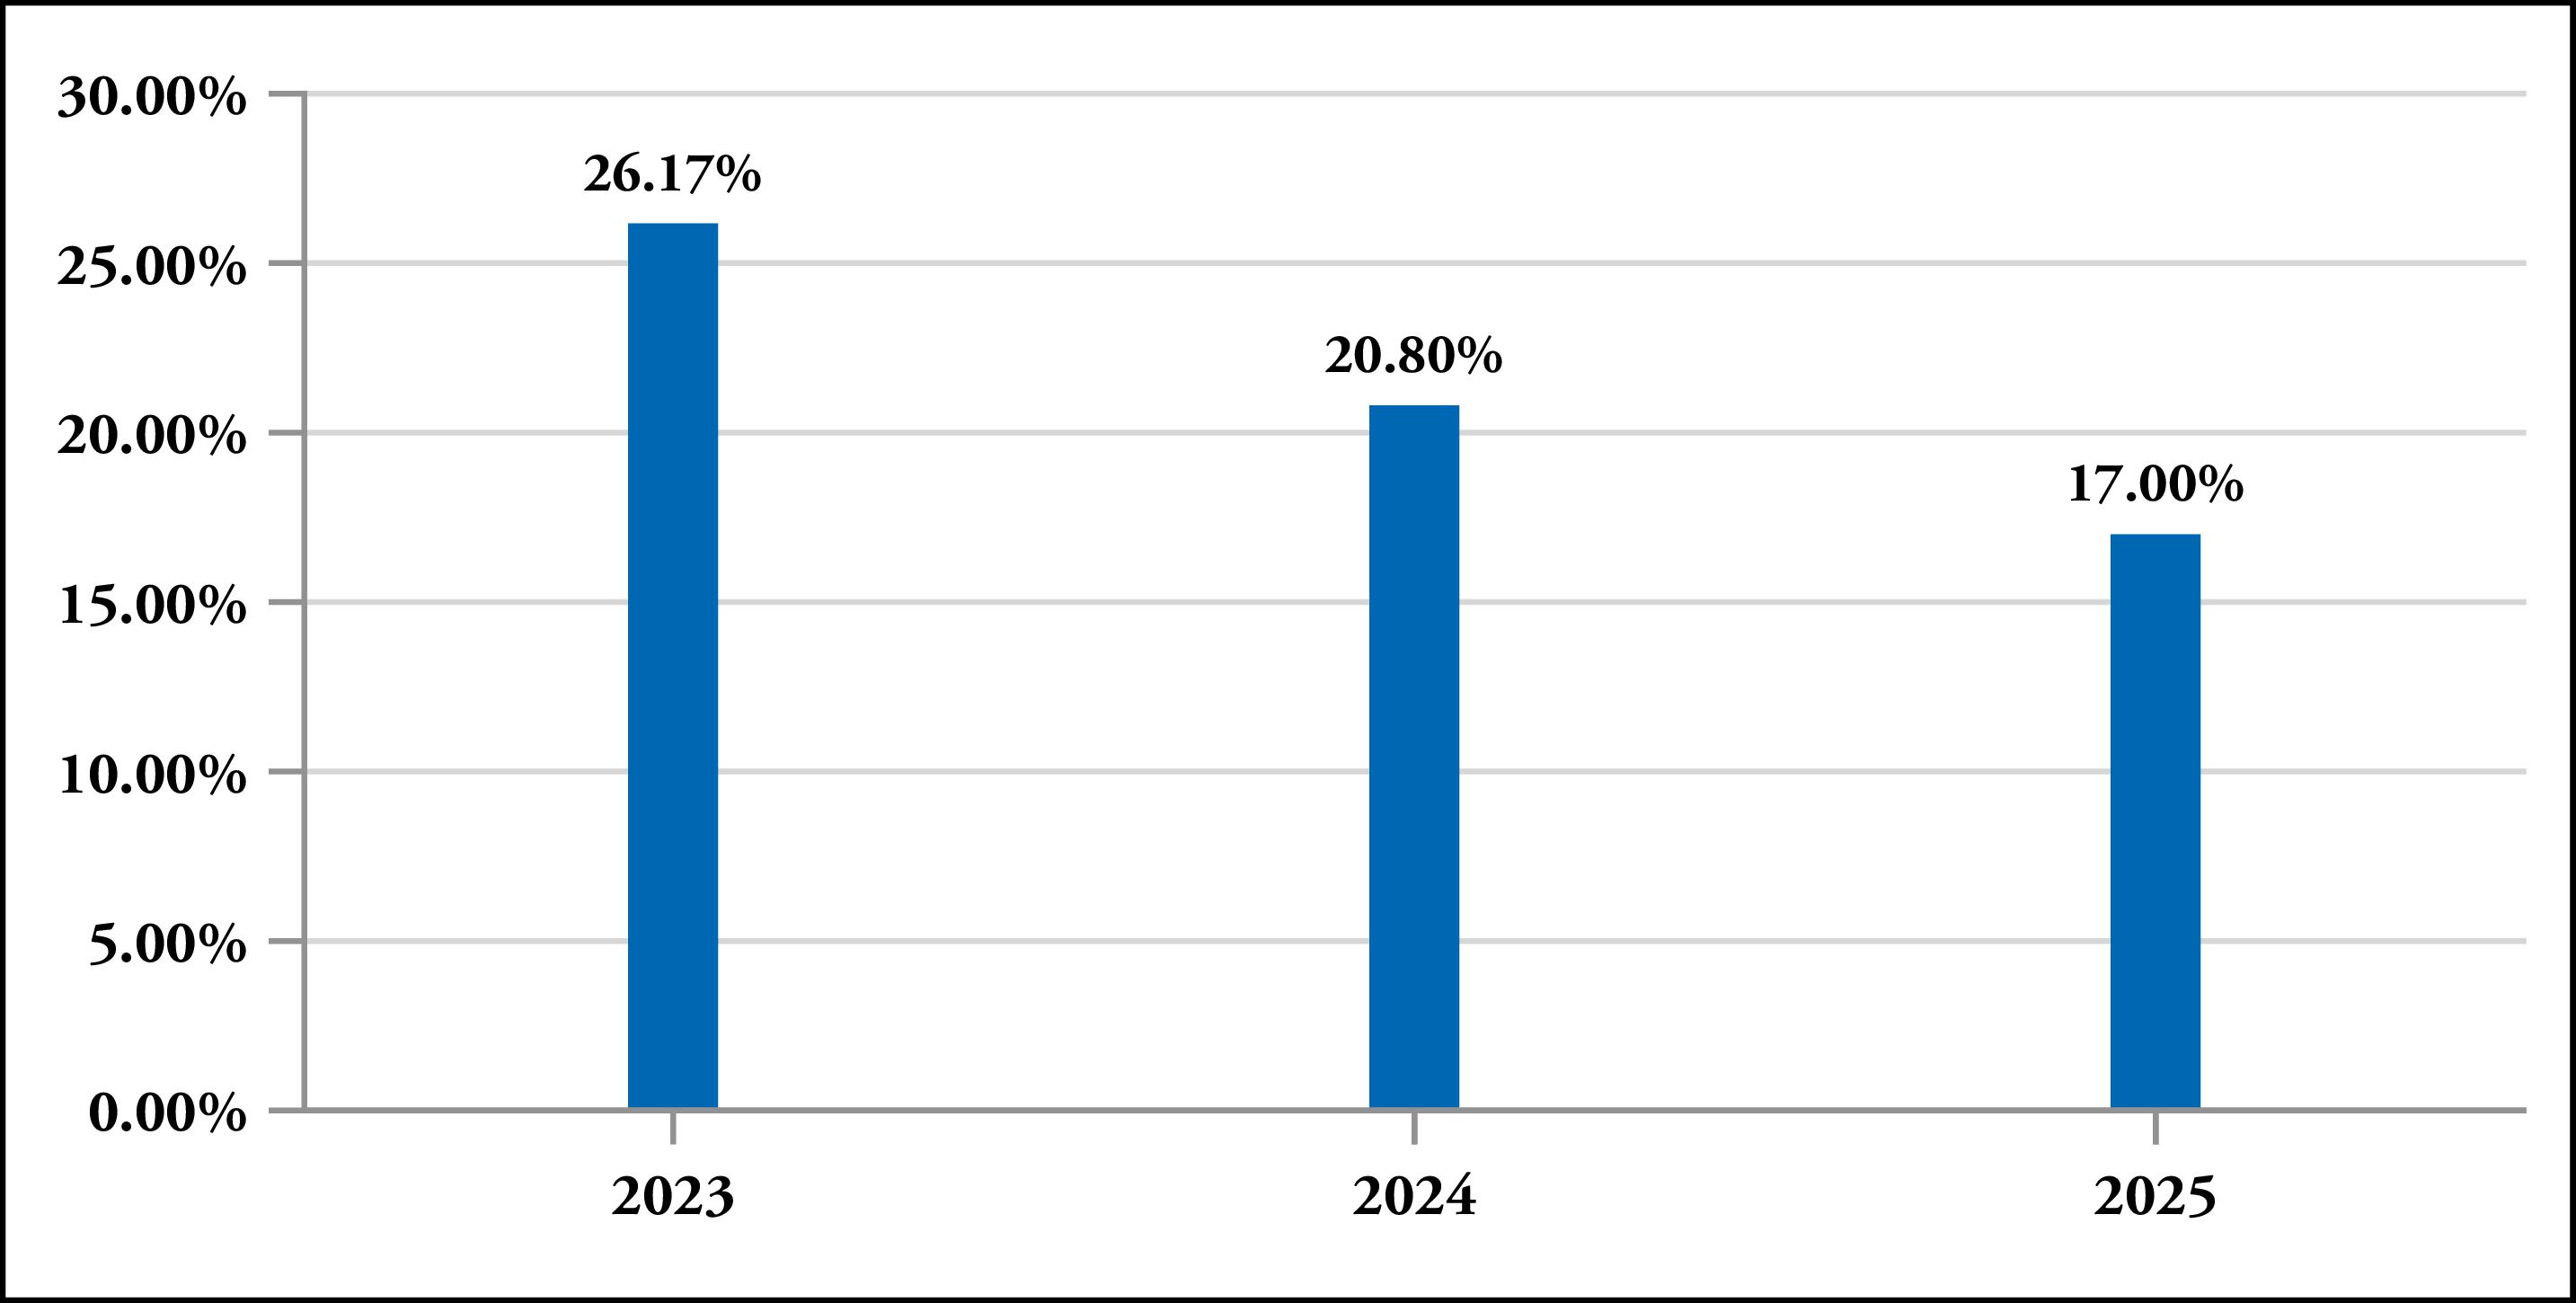
| Touchstone Sands Capital US Select Growth ETF |
|
|
| Return Before Taxes |
% |
% |
| Return After Taxes on Distributions |
% |
% |
| Return After Taxes on Distributions and Sale of Fund Shares |
% |
% |
| Bloomberg US 3000 Index(1) (reflects no deduction for fees, expenses or taxes) |
% |
% |
| Bloomberg US 1000 Growth Index(2) (reflects no deduction for fees, expenses or taxes) |
% |
% |
| Russell 3000® Index (reflects no deduction for fees, expenses or taxes) |
% |
% |
| Russell 1000® Growth Index (reflects no deduction for fees, expenses or taxes) |
% |
% |
(1)
(2)
30
The Fund’s Management
Investment Adviser
Touchstone Advisors, Inc. serves as the Fund’s investment adviser.
| Sub-Adviser |
Portfolio Managers |
Investment Experience with the Fund |
Primary Title with Sub-Adviser |
| Sands Capital Management, LLC |
Wesley A. Johnston, CFA |
Since inception in January 2025 |
Sr. Portfolio Manager, Research Analyst |
| |
Thomas H. Trentman, CFA |
Since inception in January 2025 |
Sr. Portfolio Manager, Research Analyst |
| |
Benjamin H. Betcher |
Since January 2026 |
Portfolio Manager and Senior Research Analyst |
Buying and Selling Fund Shares
The Fund is an ETF. Individual Fund shares may only be purchased and sold on a national securities exchange through a broker-dealer and may not be purchased or redeemed directly with the Fund. The price of Fund shares is based on market price, and because ETF shares trade at market prices rather than NAV, shares may trade at a premium or a discount. An investor may incur costs attributable to the difference between the highest price a buyer is willing to pay to purchase shares of the Fund (“bid”) and the lowest price a seller is willing to accept for shares (“ask”) when buying or selling shares in the secondary market (the “bid-ask spread”). Recent information, including information about the Fund’s NAV, market price, premiums and discounts, and bid-ask spreads, is included on the Fund’s website at TouchstoneInvestments.com/ETFs.
Tax Information
The Fund intends to make distributions that may be taxed as ordinary income or capital gains except when shares are held through a tax-advantaged account, such as a 401(k) plan or an IRA. Withdrawals from a tax-advantaged account, however, may be taxable.
Financial Intermediary Compensation
If you purchase shares in the Fund through a broker-dealer or other financial intermediary (such as a bank), the Adviser and its related companies may pay the intermediary for the sale of Fund shares and related services. These payments may create a conflict of interest by influencing the broker-dealer or other financial intermediary and your salesperson to recommend the Fund over another investment. Ask your salesperson or visit your financial intermediary’s website for more information.
31
| |
Touchstone Securitized Income ETF |
| |
|
| Management Fees |
|
| Distribution and/or Shareholder Service (12b-1) Fees(1) |
|
| Other Expenses |
|
| Acquired Fund Fees and Expenses (AFFE) |
|
| Total Annual Fund Operating Expenses(2) |
|
| Fee Waiver and/or Expense Reimbursement(3) |
( |
| Total Annual Fund Operating Expenses After Fee Waiver and/or Expense Reimbursement(2)(3) |
|
(1)
(2)
(3)
| | |
| 1 Year |
$ |
| 3 Years |
$ |
| 5 Years |
$ |
| 10 Years |
$ |
32
The Fund’s Principal Risks
The Fund’s share price will fluctuate. You could lose money on your investment in the Fund and the Fund could also return less than other investments. Investments in the Fund are not bank guaranteed, are not deposits, and are not insured by the Federal Deposit Insurance Corporation (the “FDIC”) or any other federal government agency. As with any ETF, there is no guarantee that the Fund will achieve its investment goal. You can find more information about the Fund’s investments and risks under the “Principal Investment Strategies and Risks” section of the Fund’s prospectus. The Fund is subject to the principal risks summarized below.
33
34
35
| | ||
| |
|
% |
| |
|
% |
| |
|
% |
| |
|
Since Inception |
| |
1 Year |
|
| Touchstone Securitized Income ETF |
|
|
| Return Before Taxes |
% |
% |
| Return After Taxes on Distributions |
% |
% |
| Return After Taxes on Distributions and Sale of Fund Shares |
% |
% |
| Bloomberg US Aggregate Bond Index (reflects no deduction for fees, expenses or taxes) |
% |
% |
The Fund’s Management
Investment Adviser
Touchstone Advisors, Inc. serves as the Fund’s investment adviser.
| Sub-Adviser |
Portfolio Managers |
Investment Experience with the Fund |
Primary Title with Sub-Adviser |
| Fort Washington Investment Advisors, Inc. |
Scott D. Weston |
Since inception in July 2023 |
Managing Director and Senior Portfolio Manager |
| |
Brent A. Miller, CFA |
Since inception in July 2023 |
Vice President and Senior Portfolio Manager |
| |
Laura L. Mayfield |
Since inception in July 2023 |
Assistant Vice President and Senior Portfolio Manager |
| |
Richard Schneider |
Since inception in July 2023 |
Vice President and Senior Portfolio Manager |
36
Buying and Selling Fund Shares
The Fund is an ETF. Individual Fund shares may only be purchased and sold on a national securities exchange through a broker-dealer and may not be purchased or redeemed directly with the Fund. The price of Fund shares is based on market price, and because ETF shares trade at market prices rather than NAV, shares may trade at a premium or a discount. An investor may incur costs attributable to the difference between the highest price a buyer is willing to pay to purchase shares of the Fund (“bid”) and the lowest price a seller is willing to accept for shares (“ask”) when buying or selling shares in the secondary market (the “bid-ask spread”). Recent information, including information about the Fund’s NAV, market price, premiums and discounts, and bid-ask spreads, is included on the Fund’s website at TouchstoneInvestments.com/ETFs.
Tax Information
The Fund intends to make distributions that may be taxed as ordinary income or capital gains except when shares are held through a tax-advantaged account, such as a 401(k) plan or an IRA. Withdrawals from a tax-advantaged account, however, may be taxable.
Financial Intermediary Compensation
If you purchase shares in the Fund through a broker-dealer or other financial intermediary (such as a bank), the Adviser and its related companies may pay the intermediary for the sale of Fund shares and related services. These payments may create a conflict of interest by influencing the broker-dealer or other financial intermediary and your salesperson to recommend the Fund over another investment. Ask your salesperson or visit your financial intermediary’s website for more information.
37
| |
Touchstone Strategic Income ETF |
| |
|
| Management Fees |
|
| Distribution and/or Shareholder Service (12b-1) Fees(1) |
|
| Other Expenses |
|
| Acquired Fund Fees and Expenses (AFFE) |
|
| Total Annual Fund Operating Expenses(2) |
|
| Fee Waiver and/or Expense Reimbursement(3) |
( |
| Total Annual Fund Operating Expenses After Fee Waiver and/or Expense Reimbursement(2)(3) |
|
(1)
(2)
(3)
| | |
| 1 Year |
$ |
| 3 Years |
$ |
| 5 Years |
$ |
| 10 Years |
$ |
38
The Fund’s Principal Risks
The Fund’s share price will fluctuate. You could lose money on your investment in the Fund and the Fund could also return less than other investments. Investments in the Fund are not bank guaranteed, are not deposits, and are not insured by the Federal Deposit Insurance Corporation or any other federal government agency. As with any ETF, there is no guarantee that the Fund will achieve its investment goal. You can find more information about the Fund’s investments and risks under the “Principal Investment Strategies and Risks” section of the Fund’s prospectus. The Fund is subject to the principal risks summarized below.
39
40
41
| | ||
| |
|
% |
| |
|
% |
| |
|
% |
42
| |
|
Since Inception |
| |
1 Year |
|
| Touchstone Strategic Income ETF |
|
|
| Return Before Taxes |
% |
% |
| Return After Taxes on Distributions |
% |
% |
| Return After Taxes on Distributions and Sale of Fund Shares |
% |
% |
| Bloomberg US Aggregate Bond Index (reflects no deduction for fees, expenses or taxes) |
% |
% |
The Fund’s Management
Investment Adviser
Touchstone Advisors, Inc. serves as the Fund’s investment adviser.
| Sub-Adviser |
Portfolio Managers |
Investment Experience with the Fund |
Primary Title with Sub-Adviser |
| Fort Washington Investment Advisors, Inc. |
Daniel J. Carter, CFA |
Since inception in July 2022 |
Managing Director and Senior Portfolio Manager |
| |
Austin R. Kummer, CFA |
Since inception in July 2022 |
Managing Director, Senior Portfolio Manager |
| |
Brendan M. White, CFA |
Since inception in July 2022 |
Senior Vice President, Co-Chief Investment Officer and Portfolio Manager |
Buying and Selling Fund Shares
The Fund is an ETF. Individual Fund shares may only be purchased and sold on a national securities exchange through a broker-dealer and may not be purchased or redeemed directly with the Fund. The price of Fund shares is based on market price, and because ETF shares trade at market prices rather than NAV, shares may trade at a premium or a discount. An investor may incur costs attributable to the difference between the highest price a buyer is willing to pay to purchase shares of the Fund (“bid”) and the lowest price a seller is willing to accept for shares (“ask”) when buying or selling shares in the secondary market (the “bid-ask spread”). Recent information, including information about the Fund’s NAV, market price, premiums and discounts, and bid-ask spreads, is included on the Fund’s website at TouchstoneInvestments.com/ETFs.
Tax Information
The Fund intends to make distributions that may be taxed as ordinary income or capital gains except when shares are held through a tax-advantaged account, such as a 401(k) plan or an IRA. Withdrawals from a tax-advantaged account, however, may be taxable.
Financial Intermediary Compensation
If you purchase shares in the Fund through a broker-dealer or other financial intermediary (such as a bank), the Adviser and its related companies may pay the intermediary for the sale of Fund shares and related services. These payments may create a conflict of interest by influencing the broker-dealer or other financial intermediary and your salesperson to recommend the Fund over another investment. Ask your salesperson or visit your financial intermediary’s website for more information.
43
| |
Touchstone Ultra Short Income ETF |
| |
|
| Management Fees |
|
| Distribution and/or Shareholder Service (12b-1) Fees(1) |
|
| Other Expenses |
|
| Total Annual Fund Operating Expenses |
|
| Fee Waiver and/or Expense Reimbursement(2) |
( |
| Total Annual Fund Operating Expenses After Fee Waiver and/or Expense Reimbursement(2) |
|
(1)
(2)
| | |
| 1 Year |
$ |
| 3 Years |
$ |
| 5 Years |
$ |
| 10 Years |
$ |
44
The Fund’s Principal Risks
The Fund’s share price will fluctuate. You could lose money on your investment in the Fund and the Fund could also return less than other investments. Investments in the Fund are not bank guaranteed, are not deposits, and are not insured by the Federal Deposit Insurance Corporation or any other federal government agency. As with any ETF, there is no guarantee that the Fund will achieve its investment goal. You can find more information about the Fund’s investments and risks under the “Principal Investment Strategies and Risks” section of the Fund’s prospectus. The Fund is subject to the principal risks summarized below.
45
46
47
| | ||
| |
|
% |
| |
|
% |
| |
|
% |
| |
|
Since Inception |
| |
1 Year |
|
| Touchstone Ultra Short Income ETF |
|
|
| Return Before Taxes |
% |
% |
| Return After Taxes on Distributions |
% |
% |
| Return After Taxes on Distributions and Sale of Fund Shares |
% |
% |
| Bloomberg US Aggregate Bond Index (reflects no deduction for fees, expenses or taxes) |
% |
% |
| Bloomberg US Treasury Bellwether 3 Month Index(1) (reflects no deduction for fees, expenses or taxes) |
% |
% |
| Bloomberg US Treasury Bellwether 1 Year Index(1) (reflects no deduction for fees, expenses or taxes) |
% |
% |
| ICE BofA 3-Month U.S. Treasury Bill Index (reflects no deduction for fees, expenses or taxes) |
% |
% |
| ICE BofA 1-Year U.S. Treasury Note Index (reflects no deduction for fees, expenses or taxes) |
% |
% |
(1)
The Fund’s Management
Investment Adviser
Touchstone Advisors, Inc. serves as the Fund’s investment adviser.
| Sub-Adviser |
Portfolio Managers |
Investment Experience with the Fund |
Primary Title with Sub-Adviser |
| Fort Washington Investment Advisors, Inc. |
Scott D. Weston |
Since inception in August 2022 |
Managing Director and Senior Portfolio Manager |
| |
Brent A. Miller, CFA |
Since inception in August 2022 |
Vice President and Senior Portfolio Manager |
48
| Sub-Adviser |
Portfolio Managers |
Investment Experience with the Fund |
Primary Title with Sub-Adviser |
| |
Laura L. Mayfield |
Since inception in August 2022 |
Assistant Vice President and Senior Portfolio Manager |
| |
Richard V. Schneider |
Since April 2023 |
Vice President and Senior Portfolio Manager |
Buying and Selling Fund Shares
The Fund is an ETF. Individual Fund shares may only be purchased and sold on a national securities exchange through a broker-dealer and may not be purchased or redeemed directly with the Fund. The price of Fund shares is based on market price, and because ETF shares trade at market prices rather than NAV, shares may trade at a premium or a discount. An investor may incur costs attributable to the difference between the highest price a buyer is willing to pay to purchase shares of the Fund (“bid”) and the lowest price a seller is willing to accept for shares (“ask”) when buying or selling shares in the secondary market (the “bid-ask spread”). Recent information, including information about the Fund’s NAV, market price, premiums and discounts, and bid-ask spreads, is included on the Fund’s website at TouchstoneInvestments.com/ETFs.
Tax Information
The Fund intends to make distributions that may be taxed as ordinary income or capital gains except when shares are held through a tax-advantaged account, such as a 401(k) plan or an IRA. Withdrawals from a tax-advantaged account, however, may be taxable.
Financial Intermediary Compensation
If you purchase shares in the Fund through a broker-dealer or other financial intermediary (such as a bank), the Adviser and its related companies may pay the intermediary for the sale of Fund shares and related services. These payments may create a conflict of interest by influencing the broker-dealer or other financial intermediary and your salesperson to recommend the Fund over another investment. Ask your salesperson or visit your financial intermediary’s website for more information.
49
| |
Touchstone US Large Cap Focused ETF |
| |
|
| Management Fees |
|
| Distribution and/or Shareholder Service (12b-1) Fees(1) |
|
| Other Expenses |
|
| Acquired Fund Fees and Expenses (AFFE) |
|
| Total Annual Fund Operating Expenses(2) |
|
| Fee Waiver and/or Expense Reimbursement(3) |
( |
| Total Annual Fund Operating Expenses After Fee Waiver and/or Expense Reimbursement(2)(3) |
|
(1)
(2)
(3)
| | |
| 1 Year |
$ |
| 3 Years |
$ |
| 5 Years |
$ |
| 10 Years |
$ |
50
The Fund’s Principal Risks
The Fund’s share price will fluctuate. You could lose money on your investment in the Fund and the Fund could also return less than other investments. Investments in the Fund are not bank guaranteed, are not deposits, and are not insured by the Federal Deposit Insurance Corporation or any other federal government agency. As with any ETF, there is no guarantee that the Fund will achieve its investment goal. You can find more information about the Fund’s investments and risks under the “Principal Investment Strategies and Risks” section of the Fund’s prospectus. The Fund is subject to the principal risks summarized below.
51
52
| | ||
| |
|
% |
| |
|
% |
| |
|
% |
| |
|
Since Inception |
| |
1 Year |
|
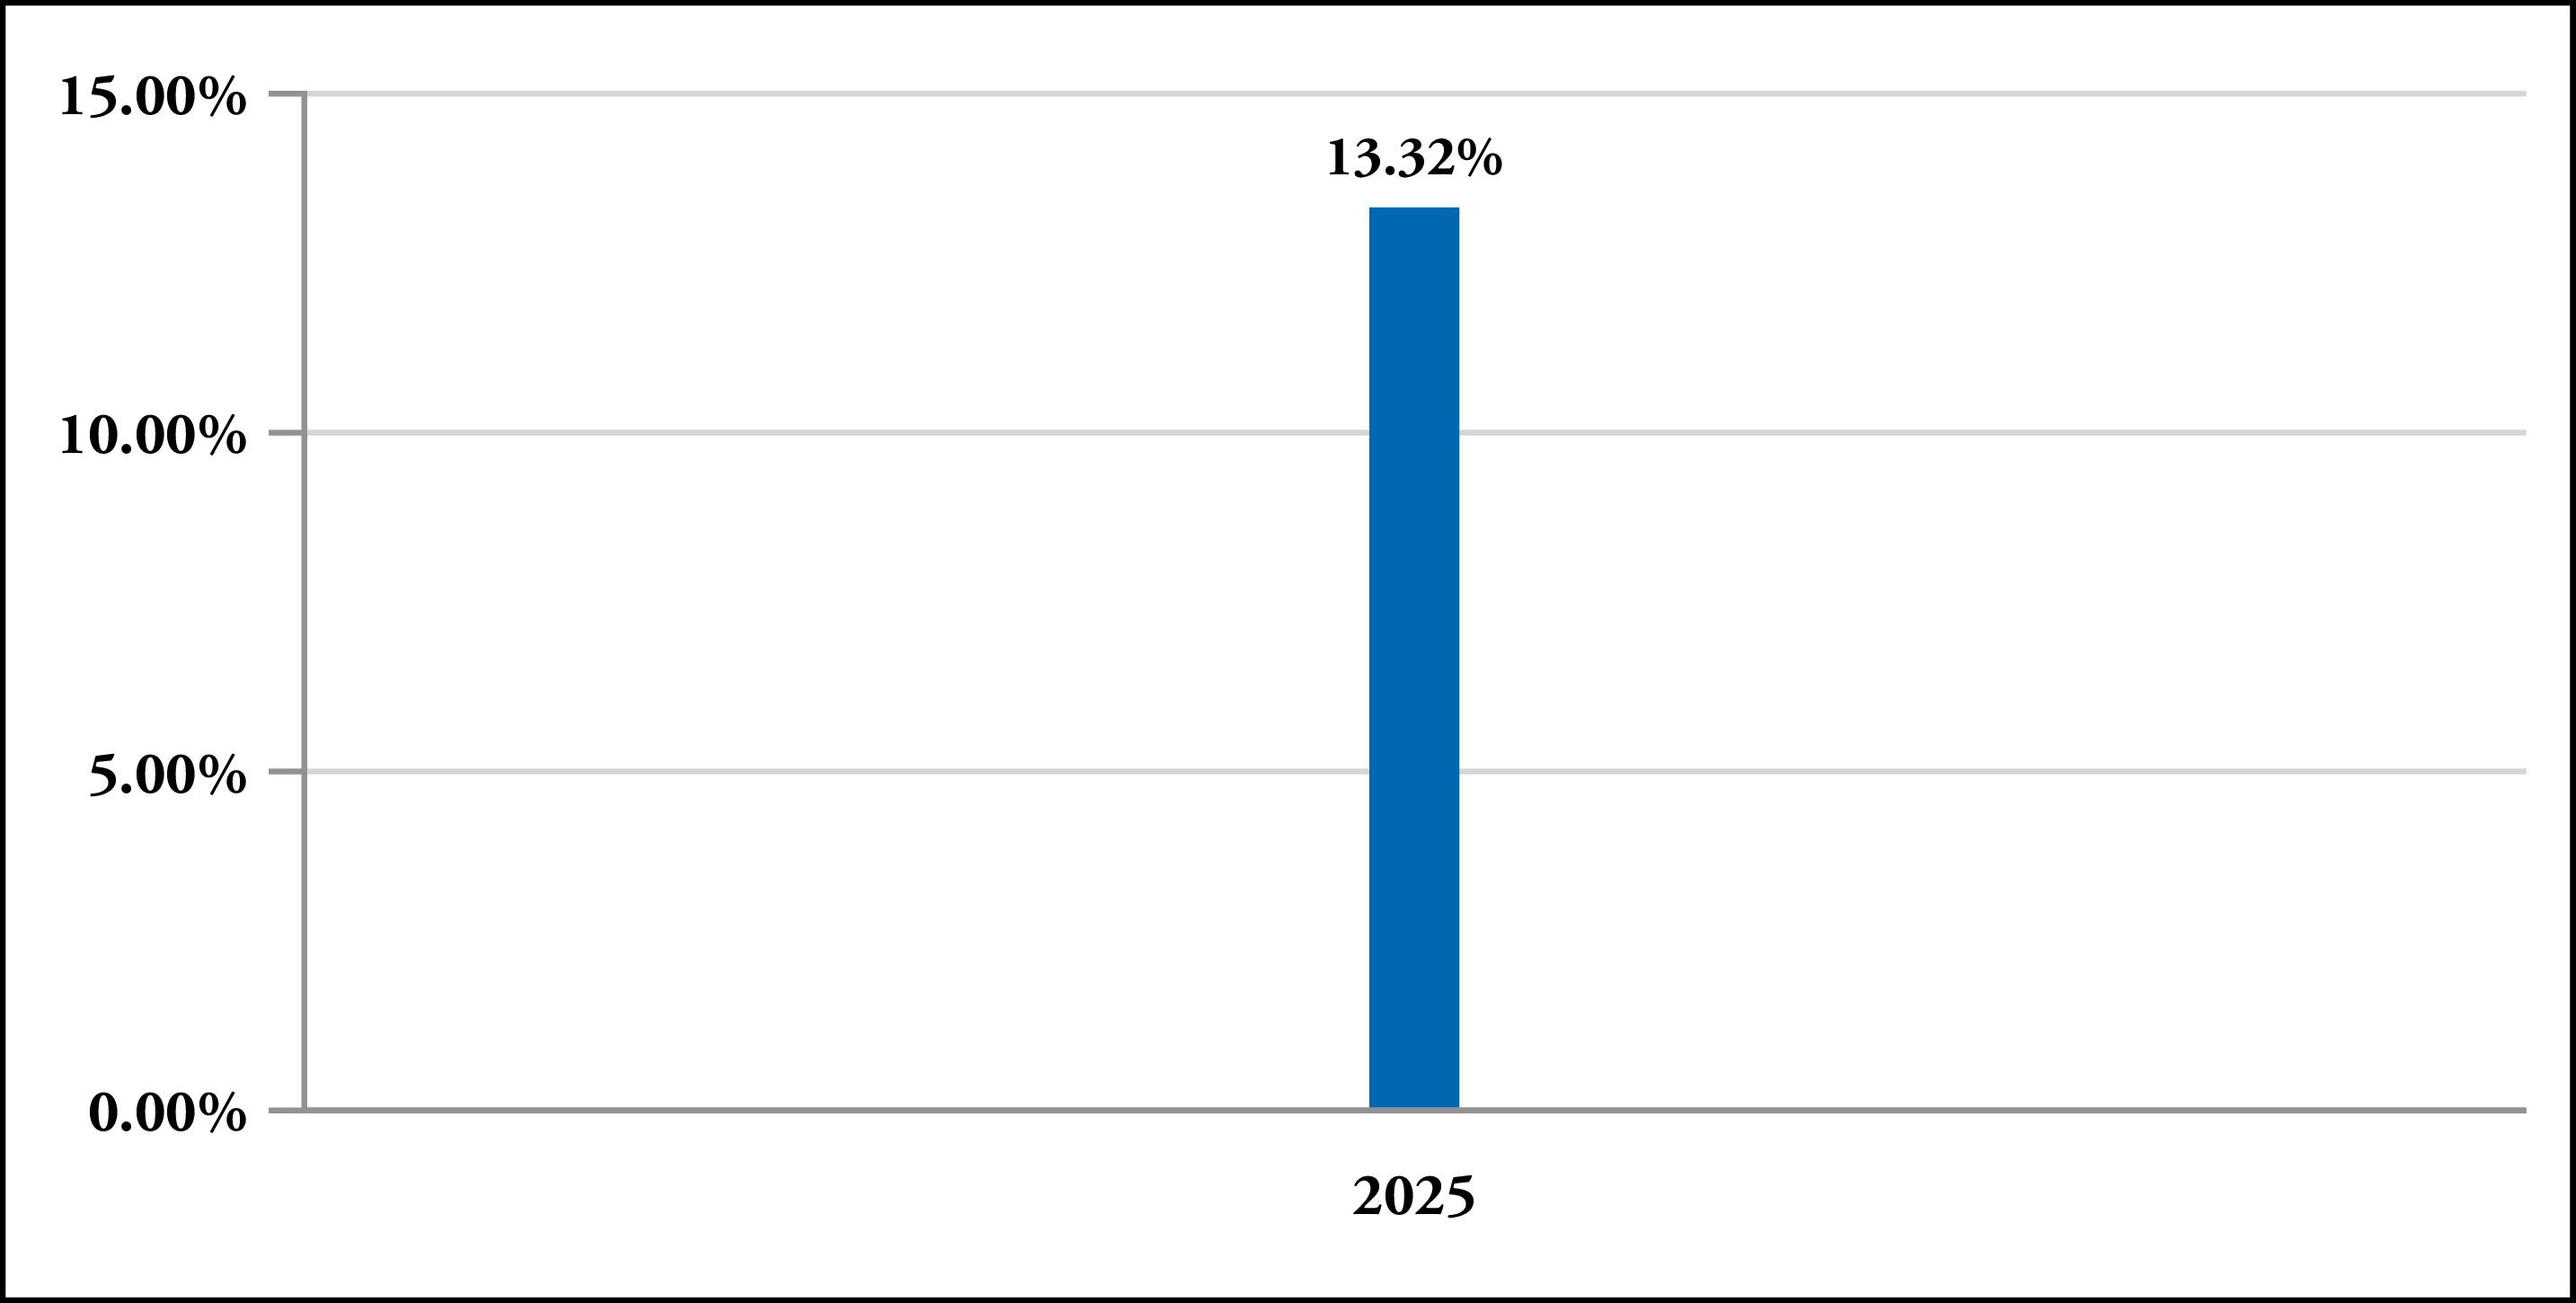
| Touchstone US Large Cap Focused ETF |
|
|
| Return Before Taxes |
% |
% |
| Return After Taxes on Distributions |
% |
% |
| Return After Taxes on Distributions and Sale of Fund Shares |
% |
% |
| Bloomberg US 3000 Index(1) (reflects no deduction for fees, expenses or taxes) |
% |
% |
| Bloomberg US 1000 Index(2) (reflects no deduction for fees, expenses or taxes) |
% |
% |
| Russell 3000® Index (reflects no deduction for fees, expenses or taxes) |
% |
% |
| Russell 1000® Index (reflects no deduction for fees, expenses or taxes) |
% |
% |
(1)
(2)
The Fund’s Management
Investment Adviser
Touchstone Advisors, Inc. serves as the Fund’s investment adviser.
| Sub-Adviser |
Portfolio Manager |
Investment Experience with the Fund |
Primary Title with Sub-Adviser |
| Fort Washington Investment Advisors, Inc. |
James E. Wilhelm, Jr. |
Since inception in July 2022 |
Managing Director & Senior Portfolio Manager |
| Sunit Gogia |
Since October 2024 |
Vice President, Portfolio Manager and Director of Equity Research |
53
Buying and Selling Fund Shares
The Fund is an ETF. Individual Fund shares may only be purchased and sold on a national securities exchange through a broker-dealer and may not be purchased or redeemed directly with the Fund. The price of Fund shares is based on market price, and because ETF shares trade at market prices rather than NAV, shares may trade at a premium or a discount. An investor may incur costs attributable to the difference between the highest price a buyer is willing to pay to purchase shares of the Fund (“bid”) and the lowest price a seller is willing to accept for shares (“ask”) when buying or selling shares in the secondary market (the “bid-ask spread”). Recent information, including information about the Fund’s NAV, market price, premiums and discounts, and bid-ask spreads, is included on the Fund’s website at TouchstoneInvestments.com/ETFs.
Tax Information
The Fund intends to make distributions that may be taxed as ordinary income or capital gains except when shares are held through a tax-advantaged account, such as a 401(k) plan or an IRA. Withdrawals from a tax-advantaged account, however, may be taxable.
Financial Intermediary Compensation
If you purchase shares in the Fund through a broker-dealer or other financial intermediary (such as a bank), the Adviser and its related companies may pay the intermediary for the sale of Fund shares and related services. These payments may create a conflict of interest by influencing the broker-dealer or other financial intermediary and your salesperson to recommend the Fund over another investment. Ask your salesperson or visit your financial intermediary’s website for more information.
54
Principal Investment Strategies and Risks
How Do The Funds Implement Their Investment Goal?
The investment goal(s) and principal investment strategies of Touchstone Dividend Select ETF (“Dividend Select ETF”), Touchstone Dynamic International ETF (“Dynamic International ETF”), Touchstone International Equity ETF (“International Equity ETF”), Touchstone Large Company Growth ETF (“Large Company Growth ETF”), Touchstone Sands Capital Emerging Markets ex-China Growth ETF (“Sands Capital Emerging Markets ex-China Growth ETF”), Touchstone Sands Capital US Select Growth ETF (“Sands Capital US Select Growth ETF”), Touchstone Securitized Income ETF (“Securitized Income ETF”), Touchstone Strategic Income ETF (“Strategic Income ETF”), Touchstone US Large Cap Focused ETF (“US Large Cap Focused ETF”) and Touchstone Ultra Short Income ETF (“Ultra Short Income ETF”) (each, a “Fund” and collectively, the “Funds”) are described in the “Principal Investment Strategies” sections in each Fund’s summary above.
The Funds are actively managed exchange-traded funds (“ETFs”). Shares of Dividend Select ETF (ticker: DVND), International Equity ETF (ticker: TLCI), Securitized Income ETF (ticker: TSEC) and Strategic Income ETF (ticker: SIO) are listed for trading on NYSE Arca, Inc., shares of Dynamic International ETF (ticker: TDI), Large Company Growth ETF (ticker: TLG) and Sands Capital US Select Growth ETF (ticker: TSEL) are listed on The Nasdaq Stock Market LLC, and shares of Sands Capital Emerging Markets ex-China Growth ETF (ticker: TEMX), US Large Cap Focused ETF (ticker: LCF) and Ultra Short Income ETF (ticker: TUSI) are listed for trading on Cboe BZX Exchange, Inc. The Nasdaq Stock Market LLC, NYSE Arca, Inc. and Cboe BZX Exchange, Inc. are referred to individually as an “Exchange” and together as the “Exchanges”. The market price for a share of each Fund may be different from a Fund’s most recent net asset value (“NAV”). ETFs are funds that trade like other publicly traded securities. Unlike shares of a mutual fund, which can be bought and redeemed from the issuing fund by all shareholders at a price based on NAV, shares of the Funds may be purchased or redeemed directly from the Funds at NAV solely by Authorized Participants. Also, unlike shares of a mutual fund, shares of the Funds are listed on an Exchange and trade in the secondary market at market prices that change throughout the day.
Dividend Select ETF. The Fund invests, under normal market conditions, at least 80% of its assets in equity securities of U.S. large-cap companies that have historically paid dividends. The Fund’s 80% policy is a non-fundamental investment policy that can be changed by the Fund’s Board upon 60 days’ prior notice to shareholders. In selecting securities for the Fund, the Fund’s sub-adviser, Fort Washington Investment Advisors, Inc. (“Fort Washington”), seeks to invest in companies that:
●
Have historically paid consistent, growing dividends;
●
Have sustainable competitive advantages that should result in excess profits to support future dividend payments; and
●
Trade at reasonable valuations compared to their intrinsic value.
For purposes of the Fund, historical dividend payout and growth generally focuses on companies that tend to have at least a three-year track record of consistent dividend growth; however, many of the Fund’s portfolio companies have historical track records of growing their dividend annually beyond three years.
The Sub-Adviser believes its unique approach results in a portfolio of high quality companies with sustainable competitive advantages that should pay reliable, growing dividends at reasonable valuations. Fort Washington evaluates a company’s competitive advantage by assessing its barrier(s) to entry. The barrier(s) to entry can be created through a cost advantage, economies of scale, high customer loyalty, or a government barrier (e.g., license or subsidy). Fort Washington believes that the strongest barrier to entry is the combination of economies of scale and higher customer loyalty.
Fort Washington believes that a key determinant of whether or not a company has a competitive advantage is its return on capital. For example, Fort Washington believes that if a company has a competitive advantage, this is often evidenced by its historical returns on capital exceeding its cost of capital. Knowing this, if a company has a competitive advantage, Fort Washington would expect returns on capital to exceed the cost of capital. This excess profit is then available to support future dividend payments. Fort Washington also assesses the amount of dividends paid relative to a company’s operating profit, and how that might change in different operating environments. As such, key metrics to assess whether a corporate competitive advantage should result in excess profits to support future dividend growth are historical excess returns on capital and low payout ratios.
Fort Washington believes the strength of a company’s competitive advantage can be assessed through various metrics such as: market share stability, returns on capital, pricing power, return stability, dominant competitors, and failed entry. Regarding valuations, Fort Washington assesses valuation through internal analysis and leveraging of third-party data. Fort Washington’s approach to valuation focuses on reliability classes where a company’s return on capital is a key input to assessing valuation. Fort Washington believes reasonable valuations are those where a company is trading below or near fair value and seeks to avoid companies that are trading well above Fort Washington’s assessment of fair value.
55
The Fund will generally hold 40 to 55 companies, with residual cash and cash equivalents expected to represent less than 10% of the Fund’s net assets. The Fund may, at times, hold fewer securities and a higher percentage of cash and cash equivalents when, among other reasons, Fort Washington cannot find a sufficient number of securities that meets its purchase requirements.
The Fund’s portfolio is typically repositioned monthly.
The Fund will generally sell a security if the security does not meet portfolio guidelines, if the security stops paying a dividend and future prospects of paying a dividend are limited, or if better opportunities exist based on the fundamentals and valuation of the business.
Dynamic International ETF. The Fund's sub-adviser, Los Angeles Capital Management LLC (“Los Angeles Capital”) employs a quantitative and dynamic approach to extract fundamental drivers of stock performance in the current market environment. Los Angeles Capital believes that investor attitudes towards key investment risks change over the course of a market cycle and are a key determinant in explaining security returns. Utilizing these characteristics, Los Angeles Capital seeks to construct a risk-controlled, forward-looking portfolio designed to adapt to changing market conditions. These risks include the relationship between projected and reported earnings, balance sheet strength, earnings quality, financing and investment decisions, and business risks.
Los Angeles Capital does not set price targets but rather Los Angeles Capital’s Dynamic Alpha Stock Selection Model® is the basis of security valuation and selection. Los Angeles Capital may limit or modify the portfolio’s holdings based upon a perceived risk or concern regarding a particular company’s investment merits.
Return forecasts are developed through a three-step process:
●
First, the research process measures each security’s exposure to different risk factors through an analysis of financial statements, earnings forecasts, and statistical properties of historic stock returns.
●
Second, the Model determines the “risk premium” or price of each risk factor through a rigorous attribution and statistical analysis of the returns related to each of the risk factors over the recent past.
●
Third, return forecasts are developed by combining each company’s exposure with the “risk premium” associated with each risk factor. Risk factors taken into account can change over time.
The portfolio generally will hold between 100 and 140 long positions that are diversified across countries and economic sectors with residual cash and cash equivalents generally expected to represent less than 10% of the Fund’s net assets.
The portfolio will be rebalanced, typically on a monthly basis, to reflect changes in investor preferences as measured by Los Angeles Capital’s factor forecasts. If a security no longer has the risk characteristics Los Angeles Capital believes investors are favoring, Los Angeles Capital may sell that stock. As economic conditions change and investor risk preferences evolve, Los Angeles Capital’s forecasts for these and other factors will change accordingly.
International Equity ETF. The Fund invests, under normal market conditions, at least 80% of its assets in equity securities of large capitalization, non-U.S. companies. The Fund's 80% policy is a non-fundamental investment policy that can be changed by the Fund upon 60 days' prior written notice to shareholders. For purposes of the Fund, a large capitalization company will generally have a market capitalization above $2 billion (USD) at the time of purchase. Equity securities in which the Fund invests include common stocks, but may also include American Depositary Receipts (“ADRs”) and Global Depositary Receipts (“GDRs”). The Fund considers a company to be a non-U.S. company if (1) the company's primary issue trades on a non-U.S. exchange; or (2) the company is organized, maintains its principal place of business, or has significant assets, production activities, trading or other businesses in countries outside of the United States. The Fund may also invest up to 10% of its assets in securities of companies domiciled in emerging markets.
The Fund's sub-adviser, London Company of Virginia d/b/a The London Company (“The London Company”), seeks to purchase financially stable companies that it believes are consistently generating high returns on unleveraged operating capital, run by shareholder-oriented management, and trading at a discount to The London Company's estimate of intrinsic value. Guiding principles of The London Company's international equity philosophy include: (1) a focus on cash return on tangible capital, not earnings per share, (2) balance sheet strength, (3) a focused investment approach, and (4) low portfolio turnover enhances returns.
The Fund will typically hold securities of approximately 25 to 40 companies. The London Company invests for the long term and attempts to minimize turnover in an effort to reduce transaction costs and taxes. The Fund may invest a high percentage of its assets in specific sectors of the market in order to achieve a potentially greater investment return. The London Company generally sells a security when: it becomes overvalued and has reached its price target; the issuer's fundamentals deteriorate; there is significant trading activity by insiders; or there is a more promising alternative. The London Company may also sell a security to adjust the Fund's overall portfolio risk. The Fund’s portfolio is typically repositioned monthly.
Large Company Growth ETF. In selecting investments for the Fund, the Fund’s sub-adviser, DSM Capital Partners LLC (“DSM”), manages the Fund using a bottom-up, “idea-driven,” growth-style with a long-term (i.e., three-year) investment horizon. This means in general terms that DSM seeks to identify issuers which it believes exhibit certain quality characteristics. For instance, DSM selects issuers
56
that it believes have growing businesses with solid fundamentals, attractive profitability, and successful managements. DSM holds securities with long-term investment horizons and does not engage in short-term frequent trading. DSM generally sells an equity security when its projected future return becomes unattractive relative to the rest of the portfolio or the investable universe.
The Fund may invest up to 20% of its assets in equity securities of foreign issuers, including emerging markets, through, but not limited to, ADRs or other depositary receipts. In determining whether an issuer is foreign, DSM will consider various factors, including where the issuer is headquartered, where the issuer’s principal operations are located, where the issuer’s revenues are derived, where the principal trading market is located and the country in which the issuer is legally organized. The weight given to each of these factors will vary depending upon the circumstances and as determined by DSM. The Fund is a non-diversified fund and may, from time to time, have significant exposure to one or more issuers, industries, geographic regions or sectors of the global economy. The Fund may invest greater than 25% of its assets in one or more of the following sectors: consumer discretionary, consumer staples, energy, financials, health care, industrials, materials, technology and telecommunication services.
DSM is a research-driven investment manager. Potential investments are identified based on each issuer’s detailed financial and operational history and on proprietary projections of future company results prepared by in-house analysts. These projections are based on modeling of the company, discussions with the management of the company and its competitors, interviews with industry experts, a study of the candidate’s industry, and the significant factors that drive industry growth. The “bottom-up” research process involves using various criteria, including reviewing a company’s:
●
revenue growth
●
prudent use of debt
●
earnings growth
●
lack of earnings misses
●
free cash flow
●
open and experienced management
●
profitability
In addition to superior fundamental characteristics, in order for DSM to purchase an equity security, the issuer must also have an attractive valuation. One of DSM’s valuation methods involves a historical evaluation of investor sentiment regarding each issuer’s shares to determine typical price-to-earnings (“P/E”) ratios when the issuer is “in favor” or “out of favor.” In addition, DSM studies the effect of past and current interest rates on the P/E ratio of each company’s shares, and projects these effects going forward. These valuation methods support investment decisions regarding the price and timing of purchases and sales of equity securities as well as the size of positions. The Fund's portfolio is typically rebalanced on a monthly basis.
Sands Capital Emerging Markets ex-China Growth ETF. The Fund invests, under normal market conditions, at least 80% of its assets in equity and equity-related securities issued by companies in “emerging” or “frontier” market countries, excluding China and Hong Kong, that the Fund's sub-adviser, Sands Capital Management, LLC (“Sands Capital”) believes have above-average potential for revenue or earnings growth. The Fund’s 80% policy is a non-fundamental investment policy that can be changed by the Fund upon 60 days’ prior written notice to shareholders. The Fund invests primarily in a portfolio of equity securities such as common stock, preferred stock, and depositary receipts. Emerging or frontier market companies are companies of any size that are economically tied to emerging or frontier markets. The Fund generally considers qualifying investments to be in companies that are domiciled in, organized under the laws of, or maintain their principal place of business in, an emerging or frontier market country; have securities that are principally traded in such countries; or derive at least 50% of revenues or profits from, or have at least 50% of their assets in, such countries. The Fund generally invests in a portfolio of 25 to 45 issuers selected on the basis of “bottom-up” research undertaken by Sands Capital.
The Fund classifies emerging markets as those countries not included in the MSCI World Index, a developed market index. As of December 31, 2025, the countries in the MSCI World Index included: Australia, Austria, Belgium, Canada, Denmark, Finland, France, Germany, Hong Kong, Ireland, Israel, Italy, Japan, the Netherlands, New Zealand, Norway, Portugal, Singapore, Spain, Sweden, Switzerland, the United Kingdom, and the United States. The country composition of the MSCI World Index can change over time. Frontier markets are those emerging market countries that have the smallest, least mature economies and least developed capital markets. The Fund classifies frontier markets as those countries included in the MSCI Frontier Markets Index. As of December 31, 2025, the countries in the MSCI Frontier Markets Index included: Bahrain, Bangladesh, Benin, Burkina Faso, Croatia, Estonia, Guinea-Bissau, Iceland, Ivory Coast, Jordan, Kazakhstan, Kenya, Latvia, Lithuania, Mali, Mauritius, Morocco, Niger, Oman, Pakistan, Romania, Senegal, Serbia, Slovenia, Sri Lanka, Togo, Tunisia and Vietnam.
Sands Capital uses a “bottom-up” approach to investment selection, as opposed to sector or regional allocations that focuses on a company’s long-term business fundamentals. Therefore, the Fund may overweight certain geographies or sectors and may underweight other geographies or sectors. Sands Capital looks for companies that have: sustainable above-average earnings growth; a leadership position in a promising business space; significant competitive advantages, such as profitability, superior quality, or distribution relative to competitors, or strong brand and consumer loyalty; a clear mission in an understandable business model; financial strength; and a rational valuation in relation to competitors, the market, and business prospects.
57
As an integral part of the evaluation of a company, Sands Capital considers corporate governance, social, and environmental factors (collectively, “ESG”) when it believes such factors may be material to the long-term shareowner value creation potential of the company. Sands Capital utilizes proprietary ESG-related research to enhance its evaluation of portfolio businesses. The relevance and materiality of ESG factors vary and are highly dependent on the region, country, industry, and company. Sands Capital’s analysis of these factors is integrated into the investment decision making process to the extent it believes they may affect a company’s value creation potential.
Sands Capital generally intends for the Fund’s investments to be held for an average term of three to five years, although the Fund may hold any investment for any length of time. Sands Capital generally considers selling a security when it no longer meets the investment criteria outlined above, for risk management purposes, or if a more attractive investment opportunity presents itself. The Fund’s portfolio is typically repositioned monthly.
The Fund is non-diversified and may invest a significant percentage of its assets in the securities of a single company.
Sands Capital US Select Growth ETF. The Fund invests primarily in common stocks of U.S. companies that have above-average potential for revenue or earnings growth. The Fund emphasizes investments in large and mid capitalization growth companies. The weighted-average market capitalization of these companies is generally in excess of $25 billion, and the Fund generally does not invest in companies that have a market capitalization of less than $2 billion at the time of purchase. The Fund will typically own between 25 and 35 companies.
The Fund may own the ordinary shares of non-U.S. companies listed on U.S. exchanges but normally will not invest in American Depositary Receipts (“ADRs”) and Global Depositary Receipts (“GDRs”).
As an integral part of the evaluation of a company, Sands Capital considers corporate governance, social, and environmental factors (collectively, “ESG”) when it believes such factors may be material to the long-term shareowner value creation potential of the company. Sands Capital utilizes proprietary ESG-related research to enhance its evaluation of portfolio businesses. The relevance and materiality of ESG factors vary and are highly dependent on the region, country, industry, and company. Sands Capital’s analysis of these factors is integrated into the investment decision-making process to the extent it believes they may affect a company’s value-creation potential.
The Fund is non-diversified and may invest a significant percentage of its assets in the securities of a single company or in the securities of a smaller number of companies than a diversified fund. The Fund may invest a high percentage of its assets in specific sectors of the market in order to achieve a potentially greater investment return. The Fund’s portfolio is typically repositioned monthly.
The Fund will invest, under normal market conditions, at least 80% of its assets in common stocks of U.S. companies that Sands Capital believes have above-average potential for revenue or earnings growth. This is a nonfundamental investment policy that can be changed by the Fund upon 60 days' prior written notice to shareholders.
Securitized Income ETF. The Fund may invest in a variety of securitized fixed-income securities, including residential mortgage-backed securities (“RMBS”), commercial mortgage-backed securities (“CMBS”), asset-backed securities (“ABS”), and collateralized loan obligations (“CLOs”). RMBS are fixed-income securities representing an interest in a pool of underlying residential mortgage loans, while CMBS include securities that reflect an interest in, and are secured by, mortgage loans on commercial real estate. The ABS in which the Fund may invest include fixed-income securities backed by other assets such as credit card, automobile or consumer loan receivables, retail installment loans, or participations in pools of leases. A CLO is a type of asset-backed security that is an obligation of a trust typically collateralized by pools of loans, which may include domestic and foreign senior secured and unsecured loans and subordinate corporate loans, including loans that may be rated below investment grade, or equivalent unrated loans.
Securities within each subsector may serve a variety of purposes within the Fund, including contributing high credit quality exposure (across any sector), providing liquidity (cash equivalents or short, high quality securities), providing near-term cashflow for reinvestment or liquidity purposes (amortizing securities, or securities with short-dated maturities), providing attractive yield for a given risk profile (across any sector), or contributing toward the targeted duration positioning (any sector), among other things. These attributes are not mutually exclusive, and the Fund’s sub-adviser Fort Washington’s security-level selection process is intended to optimize the benefit and/or positioning gained from each security in the portfolio, within the overall sector allocation and risk budgeting framework.
Fort Washington’s targeted sector and risk positioning for the Fund will vary in different types of market conditions. For example, during periods of elevated market uncertainty or increased redemption activity, Fort Washington may seek to increase liquidity in the Fund via higher exposure to cash-equivalents, Treasuries, or other short duration, high quality securities. During periods of a compressed credit curve (relatively flat credit spreads across the credit spectrum) the Sub-Adviser may seek to reduce exposure to securities with higher risk profiles or lower credit ratings, which may represent a reduction in those types of securities across any structured product or corporate sector. Fort Washington may also seek to increase or reduce exposure to specific sectors based on relevant fundamental or economic views—either favorable or unfavorable. Sector and risk targets will vary depending on myriad factors, and the Sub-Adviser seeks to execute security selection in such a manner as to optimize positioning relative to the target at any given time.
While the Fund may invest in both investment-grade debt securities and non-investment-grade debt securities, Fort Washington, the Fund’s sub-adviser, seeks to invest at least 50% of the Fund's portfolio in investment-grade debt securities. Investment-grade debt securities are those having a rating of BBB-/Baa3 or higher from a nationally recognized statistical rating organization (“NRSRO”) or, if a rating is not available, deemed to be of comparable quality by Fort Washington.
58
Fort Washington considers the “effective duration” of the Fund’s entire portfolio when making investment decisions. Effective duration is a measure of a security’s price volatility or the risk associated with changes in interest rates. While the Fund may invest in securities with any maturity or duration, Fort Washington seeks to maintain an effective duration for the Fund between one and four years under normal market conditions.
In selecting investments for the Fund, Fort Washington chooses fixed-income securities that it believes are attractively priced relative to the market or to similar instruments. Fort Washington is continually assessing the risk and return profile available in the market across a broad range of sectors and security types. An investment may be determined to be “attractively priced” if it is offered at a level that is expected to yield a return greater than it historically has and/or a greater return than generally available in the market for other securities of a similar risk profile (i.e., similar credit quality, duration, liquidity and expected volatility). In performing this analysis, Fort Washington uses a proprietary metric that estimates security or sector potential returns relative to risk in a standardized downside scenario. This comparison is made not only to securities within the same sector, but also across all relevant, investible sectors available to the Fund.
Strategic Income ETF. The Fund invests, under normal market conditions, at least 80% of its assets in income producing fixed-income securities. This is a non-fundamental investment policy that can be changed by the Fund’s Board upon 60 days’ prior notice to shareholders. Income producing securities generally include corporate debt securities, mortgage-related securities, asset-backed securities, government securities (both U.S. government securities and foreign sovereign debt), and preferred stocks.
The Fund’s sub-adviser, Fort Washington, seeks to employ a high conviction, yield-oriented investment approach with a relatively focused number of issuers, coupled with sector diversification and diligent risk management that is intended to result in attractive risk-adjusted returns via high levels of income. In selecting individual securities for the Fund, Fort Washington applies a rigorous bottom-up security selection process. A key characteristic of this process is the identification and implementation of high conviction ideas that can result in meaningful alpha generation. Fort Washington utilizes a variety of proprietary tools to assist with security screening and analysis. The Fund seeks to incorporate the best investment ideas available to Fort Washington, utilizing Fort Washington’s core competencies of bottom-up credit and structure analysis. The portfolio management team believes risk monitoring, performance measurement, and active management are key components to achieving attractive risk-adjusted returns.
A starting point for Fort Washington’s identification of attractive opportunities is the quantification of return potential along with associated risk. Fort Washington seeks to identify opportunities with the highest level of expected return relative to the risk. Fort Washington quantifies risk as downside risk (i.e., what can happen in a recession), not volatility. The quantification of risk and reward are an important part of the investment process that is combined with the company specific credit analysis.
In building the Fund’s portfolio, Fort Washington invests at least 50% of the Fund’s portfolio in investment-grade rated debt securities. The Fund may also invest up to 50% of the Fund’s portfolio in non-investment-grade debt securities. Non-investment-grade debt securities are often referred to as “junk bonds” and are considered speculative. The Fund’s investment policies are based on credit ratings at the time of purchase. The proportion of non-investment grade debt is influenced by the top-down component of the Sub-Advisor’s investment process that assesses the current macro environment focusing on trends in the global economy, financial conditions, sentiment, and valuation. Generally, the exposure to non-investment grade debt increases when credit spreads are wide, taking account of economic growth, financial conditions, and sentiment. Once the targets for macro risks are determined, the Fund’s portfolio managers and research teams analyze the individual sectors on a risk-adjusted basis using proprietary tools, including qualitative and quantitative methods. Analysis is performed to determine a sector’s potential excess return compared to the downside risk in a stress scenario. This allows the Sub-Adviser to compare sectors with different characteristics using a consistent methodology.
With respect to the criteria used to select from among the asset- and mortgage-backed securities available, the Sub-Adviser believes in-depth specialization is critical to valuing structured products and maximizing returns. These securities tend to have more complex and uncertain cash flows, offering the potential for more inefficient markets. To capitalize on this inefficiency, the Sub-Advisor’s asset specialists apply a rigorous and quantitative valuation process to each potential holding, utilizing both proprietary models and third-party systems to evaluate the complexities of collateral, structure, credit, relative value, and econometric modeling. This process involves a loan-level analysis of the underlying collateral, followed by a robust analysis of the security’s cash flow structure. As a result of this analysis, the Sub-Advisor’s asset specialists are able to identify securities that they believe have the most attractive risk and return characteristics.
The Fund may also invest up to 20% of its total assets in income producing fixed-income securities that are emerging markets debt securities denominated in either the U.S. dollar or a foreign currency. Within the emerging markets debt (or “EMD”) sleeve of the Fund’s portfolio, there is no specific geographic limit or focus. Fort Washington’s EMD research and screening process begins with assessing global market and economic conditions and their impact on emerging market fixed income assets. This assessment provides context for Fort Washington’s views on individual credits, and helps drive portfolio positioning and risk parameters. A bottom up approach is utilized in analyzing individual sovereign issuers applying both qualitative and quantitative methods. Fort Washington starts with a fundamental base assessment of the country, evaluating economic resiliency as well as the strength of fiscal and external accounts. Fort Washington then builds on the fundamental base assessment by evaluating the impact of government policy on credit quality going forward. The investment process analyzes multiple policy areas, ranging from those that directly shape country fundamentals such as structural economic reforms and fiscal frameworks, to international relations and potential impacts on policy continuity from upcoming elections.
59
Additionally, in order to implement its investment strategy, the Fund may invest in mortgage dollar-roll transactions, reverse repurchase agreements, and other derivatives, including forwards, futures contracts, interest rate and credit default swap agreements, and options. These investments may be used to gain or hedge market exposure, to adjust the Fund’s duration, to manage interest rate risk, and for any other purposes consistent with the Fund’s investment strategies and limitations. The use of derivatives in the Fund’s portfolio allows the Sub-Adviser to hedge risks and/or express views in the portfolio that may not be possible given availability of cash or securities to buy/sell. Fort Washington believes that the use of derivatives increases the flexibility of the strategy to react swiftly to changes in market conditions and adds another method to add value and diversify Fund returns over time.
Although not expected to be a principal investment strategy, the Fund may also invest up to 20% of its assets in public equities and may also invest in other ETFs.
The Fund will generally sell a security if the price/yield no longer adequately compensates for the risk profile or if there is a change to allocation between sectors based on relative value.
Ultra Short Income ETF. The Fund invests, under normal market conditions, at least 80% of its assets in fixed-income securities. This is a non-fundamental investment policy that can be changed by the Fund’s Board upon 60 days’ prior notice to shareholders. The Fund invests in a diversified portfolio of securities of different maturities, including U.S. Treasury securities, U.S. government agency securities, securities of U.S. government-sponsored enterprises, corporate bonds (including those of foreign issuers), mortgage-backed securities, commercial mortgage-backed securities, asset-backed securities, municipal bonds, collateralized loan obligations and cash equivalent securities including repurchase agreements, commercial paper and variable rate demand notes. The Fund invests primarily in U.S. fixed-income securities, but may invest to a lesser extent in U.S. dollar-dominated foreign securities generally in the form of corporate bonds of foreign issuers.
The Fund invests primarily in investment-grade debt securities. Investment-grade debt securities are those having a rating of BBB-/Baa3 or higher from a nationally recognized statistical rating organization (“NRSRO”) or, if a rating is not available, deemed to be of comparable quality by the sub-adviser, Fort Washington. The Fund’s investment policies are based on credit ratings at the time of purchase. The Fund can also invest up to 15% of its net assets in non-investment-grade debt securities. Non-investment-grade debt securities are often referred to as “junk bonds” and are considered speculative.
The Fund’s investment strategy places a greater emphasis on fixed-income securities that are structured products, and therefore the Fund expects to maintain a greater exposure to the structured products sectors (i.e., mortgage-backed securities, commercial mortgage-backed securities, asset-backed securities, and collateralized loan obligations) than other types of fixed-income securities. Generally, total structured product exposure is expected to be approximately 50-70% of the Fund’s overall portfolio, although it may fall outside that range from time to time.
Fort Washington also expects to maintain a meaningful exposure to corporate credit, which generally is not expected to represent less than 20% of the Fund’s portfolio. The remainder of Fund assets are expected to be invested in other sectors, which may include municipal bonds, U.S. Treasuries, and various types of cash-equivalent securities.
Fort Washington maintains strategic (long-term) and tactical (short-term) allocation ranges for each of these sectors, which may be revised over time based on Fort Washington’s assessment of risk and return across sectors, in conjunction with the market outlook and desired risk positioning of the Fund. Bottom-up security selection is executed by sector specialists within the parameters of the targeted sector allocations and desired risk positioning.
Securities within each subsector may serve a variety of purposes within the Fund, including contributing high credit quality exposure (across any sector), providing liquidity (cash equivalents or short, high quality securities), providing near-term cashflow for reinvestment or liquidity purposes (amortizing securities, or securities with short-dated maturities), providing attractive yield for a given risk profile (across any sector), or contributing toward the targeted duration positioning (any sector), among other things. These attributes are not mutually exclusive, and Fort Washington’s security-level selection process is intended to optimize the benefit and/or positioning gained from each security in the portfolio, within the overall sector allocation and risk budgeting framework.
Fort Washington’s targeted sector and risk positioning for the Fund will vary in different types of market conditions. For example, during periods of elevated market uncertainty or increased redemption activity, Fort Washington may seek to increase liquidity in the Fund via higher exposure to cash-equivalents, Treasuries, or other short duration, high quality securities. During periods of a compressed credit curve (relatively flat credit spreads across the credit spectrum) the Sub-Adviser may seek to reduce exposure to securities with higher risk profiles or lower credit ratings, which may represent a reduction in those types of securities across any structured product or corporate sector. Fort Washington may also seek to increase or reduce exposure to specific sectors based on relevant fundamental or economic views—either favorable or unfavorable. Sector and risk targets will vary depending on myriad factors, and the Sub-Adviser seeks to execute security selection in such a manner as to optimize positioning relative to the target at any given time.
In selecting investments for the Fund, Fort Washington chooses fixed-income securities that it believes are attractively priced relative to the market or to similar instruments. Fort Washington is continually assessing the risk and return profile available in the market across a broad range of sectors and security types. An investment may be determined to be “attractively priced” if it is offered at a level that is expected to
60
yield a return greater than it historically has and/or a greater return than generally available in the market for other securities of a similar risk profile (i.e., similar credit quality, duration, liquidity and expected volatility). This comparison is made not only to securities within the same sector, but also across all relevant, investible sectors available to the Fund.
In addition, Fort Washington considers the “effective duration” of the Fund’s entire portfolio. Effective duration is a measure of a security’s price volatility or the risk associated with changes in interest rates. While the Fund may invest in securities with any maturity or duration, Fort Washington seeks to maintain an effective duration for the Fund of one year or less under normal market conditions.
US Large Cap Focused ETF. The Fund invests, under normal market conditions, at least 80% of its assets in U.S.-listed large capitalization equity securities. This is a non-fundamental investment policy that can be changed by the Fund’s Board upon 60 days’ prior notice to shareholders. For the purpose of the Fund’s 80% policy, a large capitalization company has a market capitalization, at the time of purchase, above $5 billion. For purposes of the Fund’s principal investment strategy, equity securities generally include common stocks; however, the Fund may also invest to a lesser extent in preferred stocks. These securities may be listed on an exchange or traded over-the-counter.
In selecting securities for the Fund, the Fund’s sub-adviser, Fort Washington, seeks to invest in companies that:
●
Are trading below its estimate of the companies’ intrinsic value; and
●
Have a sustainable competitive advantage in place. Fort Washington evaluates a company’s competitive advantage by assessing its barrier(s) to entry. A company’s barrier(s) to entry can be created through a cost advantage, economies of scale, high customer loyalty, or a government barrier (e.g., license or subsidy). Fort Washington believes that the strongest barrier to entry is the combination of economies of scale and higher customer loyalty.
The Fund is non-diversified and, therefore may, from time to time, have significant exposure to a limited number of issuers. The Fund will generally hold 25 to 45 companies, with residual cash and cash equivalents expected to represent less than 10% of the Fund’s net assets. The Fund may, at times, hold fewer securities and a higher percentage of cash and cash equivalents when, among other reasons, Fort Washington cannot find a sufficient number of securities that meets its purchase requirements. Although the Fund may invest in any economic sector, at times it may emphasize one or more particular sectors.
The Fund will generally sell a security if it reaches Fort Washington’s estimate of fair value, if a more attractive investment opportunity is available, or if a structural change has taken place and Fort Washington cannot reliably estimate the impact of the change on the business fundamentals. The Fund’s portfolio is typically repositioned monthly.
The Fund is restricted from investing in securities of foreign issuers, including through the use of ordinary shares or depositary receipts such as American Depositary Receipts (“ADRs”). This restriction is a non-fundamental investment policy that can be changed by the Fund’s Board upon 60 days’ prior written notice to shareholders.
Can a Fund Depart From its Principal Investment Strategies?
In addition to the investments and strategies described in this prospectus, each Fund may invest in other securities, use other strategies and engage in other investment practices. These permitted investments and strategies are described in detail in the Funds’ Statement of Additional Information (“SAI”).
Each Fund’s investment goal is non-fundamental and may be changed by the Board of Trustees (the “Board”) without shareholder approval. Shareholders will be notified at least 60 days before any change takes effect.
The investments and strategies described throughout this prospectus are those that the Funds use under normal circumstances. During unusual economic or market conditions, or for temporary defensive purposes, each Fund may invest up to 100% of its assets in cash, repurchase agreements, and short-term obligations (i.e., fixed and variable rate securities and high quality debt securities of corporate and government issuers) that would not ordinarily be consistent with each Fund’s investment strategy. This defensive investing may increase a Fund’s taxable income, and when a Fund is invested defensively, it may not achieve its investment goal. A Fund will do so only if the Fund’s sub-adviser believes that the risk of loss in using the Fund’s normal strategies and investments outweighs the opportunity for gains. Of course, there can be no guarantee that any Fund will achieve its investment goal.
80% Investment Policy. Each Fund has adopted a policy to invest, under normal circumstances, at least 80% of the value of its “assets” in certain types of investments suggested by its name (the “80% Policy”). For purposes of this 80% Policy, the term “assets” means net assets plus the amount of borrowings for investment purposes. Each Fund must comply with its 80% Policy at the time the Fund invests its assets. Accordingly, when a Fund no longer meets the 80% requirement as a result of circumstances beyond its control, such as changes in the value of portfolio holdings, it would not have to sell its holdings but would have to make any new investments in such a way as to comply with the 80% Policy. A Fund’s 80% Policy may be changed by the Board without shareholder approval. Shareholders will be notified in writing at least 60 days before any change to a Fund’s 80% Policy takes effect.
61
Other Investment Companies. A Fund may invest in securities issued by other investment companies to the extent permitted by the Investment Company Act of 1940, as amended (the “1940 Act”) the rules thereunder and applicable Securities and Exchange Commission (“SEC”) staff interpretations thereof, or applicable exemptive relief granted by the SEC.
Lending of Portfolio Securities. The Funds may lend their portfolio securities to brokers, dealers, and financial institutions under guidelines adopted by the Board, including a requirement that a Fund must receive collateral equal to no less than 100% of the market value of the securities loaned. The risk in lending portfolio securities, as with other extensions of credit, consists of possible loss of rights in the collateral should the borrower fail financially. In determining whether to lend securities, the Adviser will consider all relevant facts and circumstances, including the creditworthiness of the borrower. More information on securities lending is available in the SAI.
Change in Market Capitalization. A Fund may specify in its principal investment strategy a market capitalization range for acquiring portfolio securities. If a security that is within the range for a Fund at the time of purchase later falls outside the range, which is most likely to happen because of market fluctuation, the Fund may continue to hold the security if, in the sub-adviser’s judgment, the security remains otherwise consistent with the Fund’s investment goal and strategies. However, this change in market capitalization could affect the Fund’s flexibility in making new investments.
International Equity ETF and Sands Capital US Select Growth ETF have a specified market capitalization range.
What are the Principal Risks of Investing in the Funds?
The risks that may apply to your investment in a Fund are listed below in a table of principal risks followed by a description of each risk. Unless otherwise noted, in this section, references to a single Fund apply equally to all of the Funds. Further information about investment strategies and risks is available in the Funds’ SAI:
| |
Dividend Select ETF |
Dynamic International ETF |
International Equity ETF |
Large Company Growth ETF |
Sands Capital Emerging Markets ex-China Growth ETF |
Sands Capital US Select Growth ETF |
Securitized Income ETF |
Strategic Income ETF |
Ultra Short Income ETF |
US Large Cap Focused ETF |
| Asset-Backed Securities Risk |
|
|
|
|
|
|
X |
X |
X |
|
| Authorized Participants Concentration Risk |
X |
X |
X |
X |
X |
X |
X |
X |
X |
X |
| Cash and Cash Equivalents Risk |
X |
|
|
|
|
|
|
|
|
X |
| Collateralized Loan Obligations Risk |
|
|
|
|
|
|
X |
|
X |
|
| Counterparty Risk |
|
|
|
|
|
|
X |
X |
X |
|
| Convertible Securities Risk |
|
|
|
X |
|
|
|
|
|
|
| Credit Risk |
|
|
|
|
|
|
X |
X |
X |
|
| Cybersecurity Risk |
X |
X |
X |
X |
X |
X |
X |
X |
X |
X |
| Depositary Receipt Risk |
|
X |
X |
X |
X |
|
|
|
|
|
| Derivatives Risk |
|
|
|
|
|
|
|
X |
|
|
| Dividend Risk |
X |
|
|
|
|
|
|
|
|
|
| Economic and Market Events Risk |
X |
X |
X |
X |
X |
X |
X |
X |
X |
X |
| Emerging Markets Risk |
|
X |
X |
X |
X |
|
|
X |
|
|
| Equity-Related Securities Risk |
|
|
|
|
X |
|
|
|
|
|
| Equity Securities Risk |
X |
X |
X |
X |
X |
X |
|
X |
|
X |
| ESG Investing Risk |
|
|
|
|
X |
X |
|
|
|
|
| ETF Risk |
X |
X |
X |
X |
X |
X |
X |
X |
X |
X |
| Fixed-Income Risk |
|
|
|
|
|
|
X |
X |
X |
|
| Foreign Securities Risk |
|
X |
X |
X |
X |
X |
|
X |
X |
|
| Forward Foreign Currency Exchange Contract Risk |
|
|
|
|
|
|
|
X |
|
|
| Frontier Markets Risk |
|
|
|
|
X |
|
|
|
|
|
| Futures Contracts Risk |
|
|
|
|
|
|
|
X |
|
|
| Growth-Investing Risk |
|
|
|
X |
X |
X |
|
|
|
|
| India Risk |
|
|
|
|
X |
|
|
|
|
|
| Interest Rate Risk |
|
|
|
|
|
|
X |
X |
X |
|
62
| |
Dividend Select ETF |
Dynamic International ETF |
International Equity ETF |
Large Company Growth ETF |
Sands Capital Emerging Markets ex-China Growth ETF |
Sands Capital US Select Growth ETF |
Securitized Income ETF |
Strategic Income ETF |
Ultra Short Income ETF |
US Large Cap Focused ETF |
| Investment-Grade Debt Securities Risk |
|
|
|
|
|
|
X |
X |
X |
|
| Large-Cap Risk |
X |
|
X |
X |
X |
X |
|
|
|
X |
| Leverage Risk |
|
|
|
|
|
|
|
X |
|
|
| Management Risk |
X |
X |
X |
X |
X |
X |
X |
X |
X |
X |
| Mid-Cap Risk |
|
|
|
|
X |
X |
|
|
|
X |
| Mortgage-Backed Securities Risk |
|
|
|
|
|
|
X |
X |
X |
|
| Mortgage Dollar Roll Risk |
|
|
|
|
|
|
|
X |
|
|
| Municipal Securities Risk |
|
|
|
|
|
|
X |
|
X |
|
| Non-Diversification Risk |
|
|
|
X |
X |
X |
|
|
|
X |
| Non-Investment-Grade Debt Securities Risk |
|
|
|
|
|
|
X |
X |
X |
|
| Options Risk |
|
|
|
|
|
|
|
X |
|
|
| Other Investment Companies Risk |
|
X |
|
|
|
|
|
|
|
|
| Portfolio Turnover Risk |
|
X |
|
|
|
|
|
X |
X |
|
| Preferred Stock Risk |
|
X |
|
X |
X |
|
|
X |
|
|
| Premium/Discount Risk |
X |
X |
X |
X |
X |
X |
X |
X |
X |
X |
| Prepayment Risk |
|
|
|
|
|
|
X |
X |
X |
|
| Quantitative Strategy Risk |
|
X |
|
|
|
|
|
|
|
|
| REIT Risk |
|
X |
|
|
|
|
|
|
|
|
| Repurchase Agreement Risk |
|
|
|
|
|
|
X |
|
X |
|
| Reverse Repurchase Agreement Risk |
|
|
|
|
|
|
|
X |
|
|
| Secondary Market Trading Risk |
X |
X |
X |
X |
X |
X |
X |
X |
X |
X |
| Sector and Industry Focus Risk |
|
|
|
X |
X |
|
|
|
|
X |
| Sector Focus Risk |
|
|
X |
|
|
X |
|
|
|
|
| Small-Cap Risk |
|
|
|
|
X |
|
|
|
|
|
| Sovereign Debt Risk |
|
|
|
|
|
|
|
X |
|
|
| Swap Agreement Risk |
|
|
|
|
|
|
|
X |
|
|
| U.S. Government Securities Risk |
|
|
|
|
|
|
X |
X |
X |
|
| Value Investing Risk |
X |
|
|
|
|
|
|
|
|
|
Cash and Cash Equivalents Risk: Under certain market conditions, such as during a rising stock market, rising interest rates or rising credit spread markets, the use of cash and/or cash equivalents, including money market instruments, could have a negative effect on the Fund’s ability to achieve its investment objective and may negatively impact the Fund’s performance. Holding cash or cash equivalents may cause the Fund to risk losing opportunities to participate in market appreciation and may cause the Fund to experience potentially lower returns than the Fund’s benchmark or other funds that remain fully invested. In rising markets, holding cash or cash equivalents may negatively affect the Fund’s performance relative to its benchmark, and there is a possibility that these holdings may not be able to keep pace with inflation. Cash equivalents are not guaranteed as to principal or interest, and the Fund could lose money through these investments.
Collateralized Loan Obligations Risk: A collateralized loan obligation (“CLO”) is a type of asset-backed security that is an obligation of a trust typically collateralized by pools of loans, which may include domestic and foreign senior secured and unsecured loans and subordinate corporate loans, including loans that may be rated below investment grade, or equivalent unrated loans. The cash flows from the trust are split into two or more portions, called tranches, which vary in risk and yield. The riskier portion is the residual, or “equity,” tranche, which bears some or all of the risk of default by the loans in the trust. The risks of an investment in a CLO largely depend on the type of underlying collateral securities and the tranche in which a Fund invests. Typically, CLOs are privately offered and sold, and thus are not registered under the securities laws. As a result, a Fund may in certain circumstances characterize its investments in CLOs as illiquid. In assessing liquidity, a Fund will consider various factors including whether the CLO may be purchased and sold in Rule 144A transactions and whether an active dealer market exists. CLOs are subject to the typical risks associated with debt instruments (i.e., interest rate risk and credit risk). Additional risks of CLOs include the possibility that distributions from collateral securities will be insufficient to
63
make interest or other payments, the potential for a decline in the quality of the collateral, and the possibility that a Fund may invest in a subordinate tranche of a CLO. In addition, due to the complex nature of a CLO, an investment in a CLO may not perform as expected. An investment in a CLO also is subject to the risk that the issuer and the investors may interpret the terms of the instrument differently, giving rise to disputes.
Convertible Securities Risk: Convertible securities are subject to the risks of both debt securities and equity securities. Convertible securities may be converted or exchanged (by the holder or by the issuer) into shares of the underlying common stock (or cash or securities of equivalent value) at a stated exchange ratio. A convertible security may also be called for redemption or conversion by the issuer after a particular date and under certain circumstances (including a specified price) established upon issue. The values of convertible securities tend to decline as interest rates rise and, due to the conversion feature, tend to vary with fluctuations in the market value of the underlying security.
Counterparty Risk: The issuer or guarantor of a fixed-income security, a counterparty (the other party to a transaction or an agreement) to a transaction with the Fund, or a borrower of the Fund’s securities may be unable or unwilling to make timely principal, interest or settlement payments, or otherwise honor its obligations.
Cybersecurity Risk: With the increased use of technologies, such as mobile devices and cloud-based service offerings and the dependence on the Internet and computer systems to perform necessary business functions, the Funds' service providers are susceptible to operational and information or cybersecurity risks that could result in losses to a Fund and its shareholders. Cybersecurity breaches are either intentional or unintentional events that allow an unauthorized party to gain access to Fund assets, customer data, or proprietary information, or cause a Fund or Fund service provider to suffer data corruption or lose operational functionality. Intentional cybersecurity incidents include: unauthorized access to systems, networks, or devices (such as through “hacking” activity or “phishing”); infection from computer viruses or other malicious software code; and attacks that shut down, disable, slow, or otherwise disrupt operations, business processes, or website access or functionality. Cyber-attacks can also be carried out in a manner that does not require gaining unauthorized access, such as causing denial-of-service attacks on the Funds' service providers’ systems or websites rendering them unavailable to intended users or via “ransomware” that renders the systems inoperable until appropriate actions are taken. In addition, unintentional incidents can occur, such as the inadvertent release of confidential information (possibly resulting in the violation of applicable privacy laws).
A cybersecurity breach could result in the loss or theft of customer data or funds, loss or theft of proprietary information or corporate data, physical damage to a computer or network system, or costs associated with system repairs, any of which could have a substantial impact on the Funds. For example, in a denial of service, Fund shareholders could lose access to their electronic accounts indefinitely, and employees of the Adviser, a Sub-Adviser, or the Funds' other service providers may not be able to access electronic systems to perform critical duties for the Fund, such as trading, NAV calculation, shareholder accounting, or fulfillment of Fund share purchases and redemptions. Cybersecurity incidents could cause a Fund, the Adviser, a Sub-Adviser, or other service provider to incur regulatory penalties, reputational damage, compliance costs associated with corrective measures, litigation costs, or financial loss. They may also result in violations of applicable privacy and other laws. In addition, such incidents could affect issuers in which a Fund invests, thereby causing the Fund’s investments to lose value.
Cyber-events have the potential to materially affect the Funds', the Adviser’s and the Sub-Adviser’s relationships with accounts, shareholders, clients, customers, employees, products, and service providers. The Funds have established risk management systems reasonably designed to seek to reduce the risks associated with cyber-events. There is no guarantee that the Funds will be able to prevent or mitigate the impact of any or all cyber-events.
The Funds is exposed to operational risk arising from a number of factors, including, but not limited to, human error, processing and communication errors, errors of the Funds' service providers, counterparties, or other third parties, failed or inadequate processes, and technology or system failures.
The Adviser, Sub-Advisers, and their affiliates have established risk management systems that seek to reduce cybersecurity and operational risks, and business continuity plans in the event of a cybersecurity breach or operational failure. However, there are inherent limitations in such plans, including that certain risks have not been identified, and there is no guarantee that such efforts will succeed, especially since none of the Adviser, the Sub-Advisers, or their affiliates controls the cybersecurity or operations systems of the Funds' third party service providers (including the Funds' custodian), or those of the issuers of securities in which a Fund invests.
In addition, other disruptive events, including (but not limited to) natural disasters and public health crises, may adversely affect a Fund’s ability to conduct business, in particular if the Fund’s employees or the employees of its service providers are unable or unwilling to perform their responsibilities as a result of any such event. Even if the Fund’s employees and the employees of its service providers are able to work remotely, those remote work arrangements could result in the Fund’s business operations being less efficient than under normal circumstances, could lead to delays in its processing of transactions, and could increase the risk of cyber-events.
Derivatives Risk: The use of derivatives may expose a Fund to additional risks that it would not be subject to if it invested directly in the securities underlying those derivatives. Risks associated with derivatives may include correlation risk, which is the risk that the derivative does not correlate well with the security, index, or currency to which it relates. Other risks include liquidity risk, which is the risk that a Fund may be unable to sell or close out the derivative due to an illiquid market, counterparty risk, which is the risk that the counterparty
64
to a derivative instrument may be unwilling or unable to make required payments or otherwise meet its obligations, and leverage risk, which is the risk that a derivative could expose a Fund to magnified losses resulting from leverage. The use of derivatives for hedging purposes may result in losses that partially or completely offset gains in portfolio positions. Using derivatives can increase the volatility of a Fund’s share price. For some derivatives, it is possible for a Fund to lose more than the amount invested in the derivative instrument. Derivatives may, for federal income tax purposes, affect the character of gain and loss realized by a Fund , accelerate recognition of income to a Fund , affect the holding periods for certain of a Fund ’s assets and defer recognition of certain of a Fund ’s losses. A Fund ’s ability to invest in derivatives may be restricted by certain provisions of the federal income tax laws relating to a Fund ’s qualification as a regulated investment company (“RIC”). These additional risks could cause a Fund to experience losses to which it would otherwise not be subject. Regulatory changes in derivatives markets could impact the cost of or a Fund ’s ability to engage in derivative transactions.
To limit risks associated with leverage, a fund is required to comply with Rule 18f-4 under the Investment Company Act of 1940, as amended (the “Derivatives Rule”). The Derivatives Rule mandates that a fund adopt and/or implement: (i) value-at-risk limitations (“VaR”); (ii) a written derivatives risk management program; (iii) new Board oversight responsibilities; and (iv) new reporting and recordkeeping requirements. In the event that a Fund's derivative exposure is 10% or less of its net assets, excluding certain currency and interest rate hedging transactions, it can elect to be classified as a limited derivatives user (“Limited Derivatives User”) under the Derivatives Rule, in which case a fund is not subject to the full requirements of the Derivatives Rule. Limited Derivatives Users are excepted from VaR testing, implementing a derivatives risk management program, and certain Board oversight and reporting requirements mandated by the Derivatives Rule. However, a Limited Derivatives User is still required to implement written compliance policies and procedures reasonably designed to manage its derivatives risks.
The Derivatives Rule also provides special treatment for reverse repurchase agreements, similar financing transactions and unfunded commitment agreements. Specifically, a fund may elect whether to treat reverse repurchase agreements and similar financing transactions as “derivatives transactions” subject to the requirements of the Derivatives Rule or as senior securities equivalent to bank borrowings for purposes of Section 18 of the 1940 Act. In addition, when-issued or forward settling securities transactions that physically settle within 35 days are deemed not to involve a senior security.
●
Forward Foreign Currency Exchange Contract Risk: A forward foreign currency exchange contract is an agreement to buy or sell a specific currency at a future date and at a price set at the time of the contract. Forward foreign currency exchange contracts may reduce the risk of loss from a change in value of a currency, but they also limit any potential gains and do not protect against fluctuations in the value of the underlying position and are subject to counterparty risk. The forecasting of currency market movement is extremely difficult, and whether any hedging strategy will be successful is highly uncertain. Moreover, it is impossible to forecast with precision the market value of portfolio securities at the expiration of a forward foreign currency contract. Accordingly, a Fund may be required to buy or sell additional currency on the spot market (and bear the expense of such transaction) if the sub-adviser’s predictions regarding the movement of foreign currency or securities markets prove inaccurate. Because foreign currency forward contracts are privately negotiated transactions, there can be no assurance that a Fund will have flexibility to rollover a forward foreign currency contract upon its expiration if it desires to do so. Additionally, there can be no assurance that the other party to the contract will perform its services under the contract.
●
Futures Contracts Risk: Futures contracts provide for the future sale by one party and purchase by another party of a specified amount of a specific security at a specified future time and at a specified price. An option on a futures contract gives the purchaser the right, in exchange for a premium, to assume a position in a futures contract at a specified exercise price during the term of the option. There are risks associated with these activities, including the following: (1) the success of a hedging strategy may depend on an ability to predict movements in the prices of individual securities, fluctuations in markets and movements in interest rates; (2) there may be an imperfect or no correlation between the changes in market value of the securities held by a Fund and the prices of futures and options on futures; (3) there may not be a liquid secondary market for a futures contract or option; (4) trading restrictions or limitations may be imposed by an exchange; and (5) government regulations may restrict trading in futures contracts and futures options.
●
Leverage Risk: Leverage occurs when a Fund uses derivatives or similar instruments or techniques to gain exposure to investments in an amount that exceeds a Fund’s initial investment. The use of leverage magnifies changes in a Fund’s net asset value and thus results in increased portfolio volatility and increased risk of loss. Leverage can also create an interest expense that may lower a Fund’s overall returns. There can be no guarantee that a leveraging strategy will be successful.
●
Options Risk: Options trading is a highly specialized activity that involves investment techniques and risks different from those associated with ordinary portfolio securities transactions. The value of options can be highly volatile, and their use can result in loss if the Sub-Adviser is incorrect in its expectation of price fluctuations. The successful use of options for hedging purposes also depends in part on the ability of the Sub-Adviser to predict future price fluctuations and the degree of correlation between the options and securities markets. When options are purchased over the counter, a Fund bears counterparty risk, which is the risk that the counterparty that wrote the option will be unable or unwilling to perform its obligations under the option contract. Such options may also be illiquid, and in such cases, a Fund may have difficulty closing out its position.
●
Swap Agreements Risk: Swap agreements (“swaps”) are individually negotiated and structured to include exposure to a variety of different types of investments or market factors, such as interest rates, foreign currency rates, mortgage securities, corporate borrowing rates, security prices, indexes or inflation rates. Swaps may increase or decrease the overall volatility of the investments of a Fund and
65
its share price. The performance of swaps may be affected by a change in the specific interest rate, currency, or other factors that determine the amounts of payments due to and from a Fund. If a swap calls for payments by a Fund, a Fund must be prepared to make such payments when due. Additionally, if the counterparty’s creditworthiness declines, the value of a swap may decline. If the counterparty is unable to meet its obligations under the contract, declares bankruptcy, defaults, or becomes insolvent, a Fund may not be able to recoup the money it expected to receive under the contract. Finally, a swap can be a form of leverage, which can magnify a Fund’s gains or losses.
Dividend Risk: Dividends the Fund receives on common stocks are not fixed but are declared at the discretion of an issuer’s board of directors. There is no guarantee that the companies in which the Fund invests will declare dividends in the future or that dividends, if declared, will remain at current levels or increase over time. Securities that pay dividends may be sensitive to changes in interest rates, and as interest rates rise, or fall, the prices of such securities may fall. A sharp rise in interest rates, or other market downturn, could result in a decision to decrease or eliminate a dividend.
Economic and Market Events Risk: Events in certain sectors historically have resulted, and may in the future result, in an unusually high degree of volatility in the financial markets, both domestic and foreign. These events have included, but are not limited to: bankruptcies, corporate restructurings, bank failures, and other similar events; governmental efforts to limit short selling and high frequency trading; measures to address U.S. federal and state budget deficits; social, political, and economic instability in Europe; economic stimulus by the Japanese central bank; dramatic changes in energy prices and currency exchange rates; and China’s economic slowdown. Interconnected global economies and financial markets increase the possibility that conditions in one country or region might adversely impact issuers in a different country or region. Both domestic and foreign equity markets have experienced increased volatility and turmoil, with issuers that have exposure to the real estate, mortgage, and credit markets particularly affected. Financial institutions could suffer losses as interest rates rise or economic conditions deteriorate. In addition, relatively high market volatility and reduced liquidity in credit and fixed-income markets may adversely affect many issuers worldwide.
Government Actions. Actions taken by the U.S. Federal Reserve (“Fed”) or foreign central banks to stimulate or stabilize economic growth, such as interventions in currency markets, could cause high volatility in the equity and fixed-income markets. Reduced liquidity may result in less money being available to purchase raw materials, goods, and services from emerging markets, which may, in turn, bring down the prices of these economic staples. It may also result in emerging-market issuers having more difficulty obtaining financing, which may, in turn, cause a decline in their securities prices.
In response to certain economic conditions, including periods of high inflation, governmental authorities and regulators may respond with significant fiscal and monetary policy changes such as raising interest rates. A Fund may be subject to heightened interest rate risk when the Fed raises interest rates. Recent and potential future changes in government monetary policy may affect interest rates. It is difficult to accurately predict the timing, frequency, or magnitude of potential interest rate increases or decreases by the Fed, and the evaluation of macro-economic and other conditions could cause a change in approach in the future. If the Fed and other central banks increase the federal funds rate and equivalent rates, such increases generally will cause market interest rates to rise and could cause the value of a Fund’s investments, and a Fund’s NAV, to decline, potentially suddenly and significantly. As a result, a Fund may experience high redemptions and, as a result, increased portfolio turnover, which could increase the costs that a Fund incurs and may negatively impact a Fund’s performance.
In addition, if the Fed increases the target Fed funds rate, any such rate increases, among other factors, could cause markets to experience continuing high volatility. A significant increase in interest rates may cause a decline in the market for equity securities. These events and the possible resulting market volatility may have an adverse effect on a Fund.
Health Crises. A widespread health crisis such as a global pandemic could cause substantial market volatility, exchange trading suspensions and closures, which may lead to less liquidity in certain instruments, industries, sectors or the markets generally, and may ultimately affect Fund performance. For example, the coronavirus (“COVID-19”) pandemic resulted and may continue to result in significant disruptions to global business activity and market volatility due to disruptions in market access, resource availability, facilities operations, imposition of tariffs, export controls and supply chain disruption, among others. The impact of a health crisis and other epidemics and pandemics that may arise in the future could affect the global economy in ways that cannot necessarily be foreseen at the present time. A health crisis may exacerbate other pre-existing political, social and economic risks. Any such impact could adversely affect a Fund’s performance, resulting in losses to your investment.
Foreign Market Disruptions. Uncertainties surrounding the sovereign debt of a number of European Union (EU) countries and the viability of the EU have disrupted and may in the future disrupt markets in the United States and around the world. If one or more countries leave the EU, as the United Kingdom did in January of 2020 (commonly referred to as “Brexit”), or the EU dissolves, the global securities markets likely will be significantly disrupted. See “Foreign Securities Risk” for additional risks associated with investments in foreign securities.
Political Turmoil and Military Events. Political turmoil within the United States and abroad may also impact a Fund. Although the U.S. government has honored its credit obligations, it remains possible that the United States could default on its obligations. While it is impossible to predict the consequences of such an unprecedented event, it is likely that a default by the United States would be highly disruptive to the U.S. and global securities markets and could significantly impair the value of a Fund’s investments. Similarly, political
66
events within the United States at times have resulted, and may in the future result, in a shutdown of government services, which could negatively affect the U.S. economy, decrease the value of a Fund’s investments, and increase uncertainty in or impair the operation of the U.S. or other securities markets. The imposition by the U.S. of import tariffs on goods from foreign countries and the reciprocal tariffs levied on U.S. goods may lead to price volatility and instability in U.S. and global investment markets. Among other effects, tariffs may increase the cost of production for certain goods or reduce demand for products, which could affect the performance of a Fund’s investments. It is not known whether, or to what extent, any tariff or other trade protections may affect a Fund or its investments.
Political and military events, including in North Korea, Venezuela, Russia, Ukraine, Iran, Syria, and other areas of the Middle East, and nationalist unrest in Europe and South America, also may cause market disruptions. As a result of continued political tensions and armed conflicts, including the Russian invasion of Ukraine commencing in February of 2022, the extent and ultimate result of which are unknown at this time, the United States and the EU, along with the regulatory bodies of a number of countries, have imposed economic sanctions on certain Russian corporate entities and individuals, and certain sectors of Russia’s economy, which may result in, among other things, the continued devaluation of Russian currency, a downgrade in the country’s credit rating, and/or a decline in the value and liquidity of Russian securities, property or interests. These sanctions could also result in the immediate freeze of Russian securities and/or funds invested in prohibited assets, impairing the ability of a Fund to buy, sell, receive or deliver those securities and/or assets. These sanctions or the threat of additional sanctions could also result in Russia taking counter measures or retaliatory actions, which may further impair the value and liquidity of Russian securities. The United States and other nations or international organizations may also impose additional economic sanctions or take other actions that may adversely affect Russia exposed issuers and companies in various sectors of the Russian economy. Any or all of these potential results could lead Russia’s economy into a recession. Economic sanctions and other actions against Russian institutions, companies, and individuals resulting from the ongoing conflict may also have a substantial negative impact on other economies and securities markets both regionally and globally, as well as on companies with operations in the conflict region, the extent to which is unknown at this time. The United States and the EU have also imposed similar sanctions on Belarus for its support of Russia’s invasion of Ukraine. Additional sanctions may be imposed on Belarus and other countries that support Russia. Any such sanctions could present substantially similar risks as those resulting from the sanctions imposed on Russia, including substantial negative impacts on the regional and global economies and securities markets.
Inflation/Deflation. In addition, there is a risk that the prices of goods and services in the United States and many foreign economies may decline over time, known as deflation. Deflation may have an adverse effect on stock prices and creditworthiness and may make defaults on debt more likely. If a country’s economy slips into a deflationary pattern, it could last for a prolonged period and may be difficult to reverse. Further, there is a risk that the present value of assets or income from investments will be less in the future, known as inflation. Inflation rates may change frequently and drastically as a result of various factors, including unexpected shifts in the domestic or global economy, and a Fund’s investments may be affected, which may reduce a Fund’s performance. Further, inflation may lead to the rise in interest rates, which may negatively affect the value of debt instruments held by a Fund, resulting in a negative impact on a Fund’s performance. Generally, securities issued in emerging markets are subject to a greater risk of inflationary or deflationary forces, and more developed markets are better able to use monetary policy to normalize markets.
ETF Risk: As an ETF, each Fund is subject to the following risks:
●
Authorized Participants Concentration Risk: A Fund has a limited number of financial institutions that may act as APs, which are responsible for the creation and redemption activity for the Fund. To the extent APs exit the business, become unable or are otherwise unwilling to engage in creation and redemption transactions with the Fund and no other AP steps in to create or redeem, Fund shares may trade at a material discount to NAV and possibly face delisting.
●
Premium/Discount Risk: As with all ETFs, Fund shares may only be bought and sold in the secondary market at market prices. The NAV of the Fund’s shares will generally fluctuate with changes in the market value of the Fund’s portfolio holdings. The trading prices of Fund shares in the secondary market will generally fluctuate in accordance with changes in the Fund’s NAV and supply and demand of shares on the secondary market. It cannot be predicted whether Fund shares will trade below, at or above its NAV. As a result, shareholders of the Fund may pay more than NAV when purchasing shares (a premium) and receive less than NAV when selling Fund shares (a discount). This risk is heightened in times of market volatility or periods of steep market declines. In such market conditions, market or stop-loss orders to sell the ETF shares may be executed at market prices that are significantly below a Fund’s NAV. The market prices of Fund shares may deviate significantly from the NAV of the shares during periods of market volatility or if the Fund’s holdings are or become more illiquid. Disruptions to creations and redemptions may result in trading prices that differ significantly from the Fund’s NAV. In addition, market prices of Fund shares may deviate significantly from the NAV if the number of Fund shares outstanding is smaller or if there is less active trading in a Fund’s shares. Investors purchasing and selling Fund shares in the secondary market may not experience investment results consistent with those experienced by those creating and redeeming directly with the Fund.
●
Secondary Market Trading Risk: Investors buying or selling shares in the secondary market will normally pay brokerage commissions, which are often a fixed amount and may be a significant proportional cost for investors buying or selling relatively small amounts of Fund shares. In addition, an investor may also incur the cost of the spread (the difference between the bid price (the price secondary market investors are willing to pay for shares) and the ask price (the price at which secondary market investors are willing to sell shares)). This difference in bid and ask prices is often referred to as the “spread” or “bid/ask spread.” The bid/ask spread varies over time for shares based on trading volume and market liquidity, and is generally tighter if a Fund’s shares have more trading volume
67
and market liquidity and wider if the Fund’s shares have little trading volume and market liquidity. Increased market volatility may cause increased bid/ask spreads. Although Fund shares are listed for trading on an Exchange, there can be no assurance that an active trading market for such shares will develop or be maintained or that the Fund’s shares will continue to be listed. Trading in Fund shares may be halted due to market conditions or for reasons that, in the view of the Exchanges, make trading in shares inadvisable. In addition, trading in shares is subject to trading halts caused by extraordinary market volatility pursuant to Exchange “circuit breaker” rules. There can be no assurance that the requirements of the Exchanges necessary to maintain the listing of any Fund will continue to be met or will remain unchanged or that the shares will trade with any volume, or at all. A portion of the securities owned by the Fund may trade in a market that is closed while the Exchange on which the Fund’s shares are listed is open. As a result, there may be changes between the last quote for a security from a closed foreign market and the value of such security during the Fund’s domestic trading day, which could lead to differences between the market price of the ETF shares and the underlying value of those shares.
Equity Securities Risk: A Fund is subject to the risk that stock prices will fall over short or extended periods of time. Individual companies may report poor results or be negatively affected by industry and/or economic trends and developments, or as a result of irregular and/or unexpected trading activity among retail investors. The prices of securities issued by these companies may decline in response to such developments, which could result in a decline in the value of a Fund’s shares. These factors contribute to price volatility. In addition, common stocks represent a share of ownership in a company, and rank after bonds and preferred stock in their claim on the company’s assets in the event of liquidation.
●
Equity-Related Securities Risk: The Fund may invest in equity-related securities, including low-exercise-price options (“LEPOs”), low-exercise-price-warrants (“LEPWs”), and participatory notes (“P-notes”) to gain exposure to issuers in certain emerging or frontier market countries. LEPOs, LEPWs, and P-notes are offshore derivative instruments issued to foreign institutional investors and their sub-accounts against underlying securities traded in emerging or frontier markets. These securities may be listed on an exchange or traded over-the-counter, and are similar to ADRs. As a result, the risks of investing in LEPOs, LEPWs, and P-notes are similar to depositary receipts risk and foreign securities risk in general. Specifically these securities entail both counterparty risk—the risk that the issuer of the LEPO, LEPW, or P-Note may not be able to fulfill its obligations or that the holder and counterparty or issuer may disagree as to the meaning or application of contractual terms—and liquidity risk—the risk that a liquid market may not exist for such securities.
●
Small-Cap Risk: A Fund is subject to the risk that small capitalization stocks may underperform other types of stocks or the equity markets as a whole. Stocks of smaller companies may be subject to more abrupt or erratic market movements than stocks of larger, more established companies. Small companies may have limited product lines or financial resources, or may be dependent upon a small or inexperienced management group. In addition, small-cap stocks typically are traded in lower volume, and their issuers typically are subject to greater degrees of changes in their earnings and prospects.
●
Large-Cap Risk: A Fund is subject to the risk that stocks of larger companies may underperform relative to those of small and mid-sized companies. Large-cap companies may be unable to respond quickly to new competitive challenges, such as changes in technology and consumer tastes, and also may not be able to attain the high growth rate of successful smaller companies, especially during extended periods of economic expansion.
●
Mid-Cap Risk: A Fund is subject to the risk that medium capitalization stocks may underperform other types of stocks or the equity markets as a whole. Stocks of mid-sized companies may be subject to more abrupt or erratic market movements than stocks of larger, more established companies. Mid-sized companies may have limited product lines or financial resources, and may be dependent upon a particular niche of the market.
●
Preferred Stock Risk: Preferred stock represents an equity interest in an issuer that pays dividends at a specified rate and that has precedence over common stock in the payment of dividends. In the event an issuer is liquidated or declares bankruptcy, the claims of owners of bonds take precedence over the claims of those who own preferred and common stock. If interest rates rise, the fixed dividend on preferred stocks may be less attractive, causing the price of preferred stocks to decline. Preferred stock may have mandatory sinking fund provisions, as well as provisions allowing the stock to be called or redeemed prior to its maturity, both of which can have a negative impact on the stock’s price when interest rates decline.
●
Real Estate Investment Trust Risk: Real Estate Investment Trusts (“REITs”) are pooled investment vehicles that primarily invest in commercial real estate or real estate-related loans. REITs are susceptible to the risks associated with direct ownership of real estate, such as declines in property values and rental rates and increases in property taxes. Additionally, REITs typically incur fees that are separate from those of the Fund.
ESG Investing Risk: Incorporating ESG criteria and investing primarily in instruments that have certain ESG characteristics, as determined by the Sub-Adviser, carries the risk that the Fund may perform differently, including underperforming funds that do not utilize an ESG investment strategy. The application of ESG investment principles may affect the Fund’s exposure to certain sectors or types of investments and may impact the Fund’s investment performance depending on whether such sectors or investments are in or out of favor in the market. A company’s ESG performance or the Sub-Adviser’s assessment of a company’s ESG performance may change over time. In evaluating a company, the manager is reliant upon information and data that may turn out to be incomplete, inaccurate or unavailable, which may negatively impact the Sub-Adviser’s assessment of a company’s ESG performance. Although the Sub-Adviser has established its own process for evaluation of ESG factors, successful application of the Fund’s responsible investment strategy will depend on the Sub-Adviser’s skill in identifying and analyzing material ESG issues. ESG factors may be evaluated differently by different managers, and may
68
not carry the same meaning to all investors and managers. The risk that the Fund may forego opportunities to buy certain instruments when it might otherwise be advantageous to do so, or sell securities for ESG-related reasons when it might be otherwise disadvantageous for it to do so is heightened when ESG exclusionary criteria is applied.
Fixed Income Risk: The market value of a Fund’s fixed-income securities responds to economic developments, particularly interest rate changes, as well as to perceptions about the creditworthiness of individual issuers, including governments. Generally, a Fund’s fixed-income securities will decrease in value if interest rates rise and increase in value if interest rates fall. Normally, the longer the maturity or duration of the fixed-income securities a Fund owns, the more sensitive the value of a Fund’s shares will be to changes in interest rates. In response to certain economic disruptions, governmental authorities and regulators typically respond to this crisis with significant fiscal and monetary policy changes, including considerably lowering interest rates, which, in some cases could result in negative interest rates. These actions, including their reversal or potential ineffectiveness, could further increase volatility in securities and other financial markets and reduce market liquidity. To the extent a Fund has a bank deposit or holds a debt instrument with a negative interest rate to maturity, a Fund would generate a negative return on that investment. Similarly, negative rates on investments by money market funds and similar cash management products could lead to losses on investments, including on investments of a Fund's uninvested cash. In response to certain economic conditions, including periods of high inflation, governmental authorities and regulators may respond with significant fiscal and monetary policy changes such as raising interest rates. A Fund may be subject to heightened interest rate risk when the Fed raises interest rates. Recent and potential future changes in government monetary policy may affect interest rates. It is difficult to accurately predict the timing, frequency, or magnitude of potential interest rate increases or decreases by the Fed, and the evaluation of macro-economic and other conditions could cause a change in approach in the future. If the Fed and other central banks increase the federal funds rate and equivalent rates, such increases generally will cause market interest rates to rise and could cause the value of a Fund’s investments, and a Fund’s NAV, to decline, potentially suddenly and significantly. As a result, a Fund may experience high redemptions and, as a result, increased portfolio turnover, which could increase the costs that a Fund incurs and may negatively impact a Fund's performance.
●
Asset-Backed Securities Risk: Asset-backed securities are fixed income securities backed by other assets such as credit card, automobile or consumer loan receivables, retail installment loans, or participations in pools of leases. Credit support for these securities may be based on the structural features such as subordination or overcollateralization and/or provided through credit enhancements by a third party. Even with a credit enhancement by a third party, there is still risk of loss. There could be inadequate collateral or no collateral for asset-backed securities. The values of these securities are sensitive to changes in the credit quality of the underlying collateral, the credit strength of the credit enhancement, changes in interest rates, and, at times, the financial condition of the issuer. Some asset-backed securities also may receive prepayments that can change the securities’ effective durations.
●
Credit Risk: The fixed-income securities in a Fund’s portfolio are subject to the possibility that a deterioration, whether sudden or gradual, in the financial condition of an issuer, or a deterioration in general economic conditions, could cause an issuer to fail to make timely payments of principal or interest when due. This may cause the issuer’s securities to decline in value. Credit risk is particularly relevant to those portfolios that invest a significant amount of their assets in non-investment grade (or “junk”) bonds or lower-rated securities.
●
Interest Rate Risk: The market price of debt securities is generally linked to the prevailing market interest rates. In general, when interest rates rise, the prices of debt securities fall, and when interest rates fall, the prices of debt securities rise. The price volatility of a debt security also depends on its maturity. Longer-term securities are generally more volatile, so the longer the average maturity or duration of these securities, the greater their price risk. Duration is a measure used to determine the sensitivity of a security’s price to changes in interest rates that incorporates a security’s yield, coupon, final maturity, and call features, among other characteristics. The longer a fixed-income security’s duration, the more sensitive it will be to changes in interest rates. Specifically, duration is the change in the value of a fixed-income security that will result from a 1% change in interest rates, and generally is stated in years. For example, as a general rule a 1% rise in interest rates means a 1% fall in value for every year of duration. Maturity, on the other hand, is the date on which a fixed-income security becomes due for payment of principal. There may be less governmental intervention in the securities markets in the near future. An increase in interest rates could negatively impact a Fund’s net asset value. Recent and potential future changes in government monetary policy may affect interest rates.
●
Investment-Grade Debt Securities Risk: Investment-grade debt securities may be downgraded by a NRSRO to below-investment-grade status, which would increase the risk of holding these securities. Investment-grade debt securities rated in the lowest rating category by a NRSRO involve a higher degree of risk than fixed-income securities with higher credit ratings. While such securities are considered investment-grade quality and are deemed to have adequate capacity for payment of principal and interest, such securities lack outstanding investment characteristics and may share certain speculative characteristics with non-investment-grade securities.
●
Mortgage-Backed Securities Risk: Mortgage-backed securities are fixed income securities representing an interest in a pool of underlying mortgage loans. Mortgage-backed securities are sensitive to changes in interest rates, but may respond to these changes differently from other fixed income securities due to the possibility of prepayment of the underlying mortgage loans. As a result, it may not be possible to determine in advance the actual maturity date or average life of a mortgage-backed security. Rising interest rates tend to discourage re-financings, with the result that the average life and volatility of the security will increase, exacerbating its decrease in market price. When interest rates fall, however, mortgage-backed securities may not gain as much in market value because of the expectation of additional mortgage prepayments that must be reinvested at lower interest rates. Prepayment risk may make it difficult to calculate the average duration of a Fund’s mortgage-backed securities and, therefore, to fully assess the interest rate risk of a Fund. An unexpectedly high rate of defaults on the mortgages held by a mortgage pool may adversely affect the value of mortgage-backed
69
securities and could result in losses to a Fund. The risk of such defaults is generally higher in the cases of mortgage pools that include subprime mortgages. Subprime mortgages refer to loans made to borrowers with weakened credit histories or with lower capacity to make timely payments on their mortgages. In addition, mortgage-backed securities may fluctuate in price based on deterioration in the perceived or actual value of the collateral underlying the pool of mortgage loans, typically residential or commercial real estate, which may result in negative amortization or negative equity meaning that the value of the collateral would be worth less than the remaining principal amount owed on the mortgages in the pool.
●
Non-Investment-Grade Debt Securities Risk: Non-investment-grade debt securities are sometimes referred to as “junk bonds” and are considered speculative with respect to their issuers’ ability to make payments of interest and principal. There is a high risk that a Fund could suffer a loss from investments in non-investment-grade debt securities caused by the default of an issuer of such securities. Part of the reason for this high risk is that non-investment-grade debt securities are generally unsecured and therefore, in the event of a default or bankruptcy, holders of non-investment-grade debt securities generally will not receive payments until the holders of all other debt have been paid. Non-investment-grade debt securities may also be less liquid than investment-grade debt securities.
●
Prepayment Risk: Prepayment risk is the risk that a debt security may be paid off and proceeds invested earlier than anticipated. Prepayment risk is more prevalent during periods of falling interest rates. Prepayment impacts both the interest rate sensitivity of the underlying asset, such as an asset-backed or mortgage-backed security, and its cash flow projections. Therefore, prepayment risk may make it difficult to calculate the average duration of a Fund’s asset- or mortgage-backed securities which in turn would make it difficult to assess the interest rate risk of the Fund.
●
U.S. Government Securities Risk: Certain U.S. government securities are backed by the right of the issuer to borrow from the U.S. Treasury while others are supported only by the credit of the issuer or instrumentality. While the U.S. government is able to provide financial support to U.S. government-sponsored agencies or instrumentalities, no assurance can be given that it will always do so. Such securities are neither issued nor guaranteed by the U.S. Treasury.
Foreign Securities Risk: Investing in foreign securities poses additional risks since political and economic events unique in a country or region will affect those markets and their issuers, while such events may not necessarily affect the U.S. economy or issuers located in the United States. In addition, investments in foreign securities are generally denominated in foreign currency. As a result, changes in the value of those currencies compared to the U.S. dollar may affect the value of a Fund’s investments. These currency movements may happen separately from, or in response to, events that do not otherwise affect the value of the security in the issuer’s home country. There is a risk that issuers of foreign securities may not be subject to accounting standards or governmental supervision comparable to those to which U.S. companies are subject and that less public information about their operations may exist. There is risk associated with the clearance and settlement procedures in non-U.S. markets, which may be unable to keep pace with the volume of securities transactions and may cause delays. Foreign markets may be less liquid and more volatile than U.S. markets and offer less protection to investors. Over-the-counter securities may also be less liquid than exchange-traded securities. Investments in securities of foreign issuers may be subject to foreign withholding and other taxes. In addition, it may be more difficult and costly for a Fund to seek recovery from an issuer located outside the United States in the event of a default on a portfolio security or an issuer’s insolvency proceeding. To the extent a Fund focuses its investments in a single country or only a few countries in a particular geographic region, economic, political, regulatory or other conditions affecting such country or region may have a greater impact on Fund performance relative to a more geographically diversified fund.
While a Fund’s net assets are valued in U.S. dollars, the securities of foreign companies are frequently denominated in foreign currencies. Thus, a change in the value of a foreign currency against the U.S. dollar will result in a corresponding change in value of securities denominated in that currency. Some of the factors that may impair the investments denominated in a foreign currency are: (1) it may be expensive to convert foreign currencies into U.S. dollars and vice versa; (2) complex political and economic factors may significantly affect the values of various currencies, including U.S. dollars, and their exchange rates; (3) government intervention may increase risks involved in purchasing or selling foreign currency options, forward contracts and futures contracts, since exchange rates may not be free to fluctuate in response to other market forces; (4) there may be no systematic reporting of last sale information for foreign currencies or regulatory requirement that quotations available through dealers or other market sources be firm or revised on a timely basis; (5) available quotation information is generally representative of very large round-lot transactions in the inter-bank market and thus may not reflect exchange rates for smaller odd-lot transactions (less than $1 million) where rates may be less favorable; and (6) the inter-bank market in foreign currencies is a global, around-the-clock market. To the extent that a market is closed while the markets for the underlying currencies remain open, certain markets may not always reflect significant price and rate movements.
Political events in foreign countries may cause market disruptions. Uncertainties surrounding the sovereign debt of a number of European Union (“EU”) countries and the viability of the EU have disrupted and may in the future disrupt markets in the United States and around the world. If one or more countries leave the EU, as the United Kingdom did in January of 2020 (commonly referred to as “Brexit”), or the EU dissolves, the global securities markets likely will be significantly disrupted.
●
Depositary Receipts Risk: Foreign receipts, which include American Depository Receipts (“ADRs”), Global Depositary Receipts (“GDRs”), and European Depositary Receipts (“EDRs”), are securities that evidence ownership interests in a security or a pool of securities issued by a foreign issuer. The risks of depositary receipts include many risks associated with investing directly in foreign securities, such as individual country risk and liquidity risk. Unsponsored ADRs, which are issued by a depositary bank without the participation or consent of the issuer, involve additional risks because U.S. reporting requirements do not apply, and the issuing bank will recover shareholder distribution costs from movement of share prices and payment of dividends. Additionally, the Holding
70
Foreign Companies Accountable Act “HFCAA” could cause securities of foreign companies, including ADRs, to be delisted from U.S. stock exchanges if the companies do not allow the U.S. government to oversee the auditing of their financial information. Although the requirements of the HFCAA apply to securities of all foreign issuers, the SEC has thus far limited its enforcement efforts to securities of Chinese companies. If securities are delisted, a Fund’s ability to transact in such securities will be impaired, and the liquidity and market price of the securities may decline. The Fund may also need to seek other markets in which to transact in such securities, which could increase the Fund’s costs.
●
Emerging Markets Risk: Investments in the securities of issuers based in countries with emerging-market economies are subject to greater levels of risk and uncertainty than investments in more-developed foreign markets. This is as a result of the fact that emerging-market securities may present market, credit, currency, liquidity, legal, political, and other risks greater than, or in addition to, the risks of investing in developed foreign countries. These risks include: (i) high currency exchange-rate fluctuations; (ii) increased risk of default (including both government and private issuers); (iii) greater social, economic, and political uncertainty and instability (including the risk of war); (iv) more substantial governmental involvement in the economy; (v) less governmental supervision and regulation of the securities markets and participants in those markets; (vi) controls on foreign investment and limitations on repatriation of invested capital and on a fund’s ability to exchange local currencies for U.S. dollars; (vii) unavailability of currency hedging techniques in certain emerging-market countries; (viii) the fact that companies in emerging-market countries may be newly organized, smaller, and less seasoned; (ix) the difference in, or lack of, auditing and financial reporting requirements or standards, which may result in the unavailability of material information about issuers; (x) different clearance and settlement procedures, which may be unable to keep pace with the volume of securities transactions or otherwise make it difficult to engage in such transactions; (xi) difficulties in obtaining and/or enforcing legal judgments against non-U.S. companies and non-U.S. persons, including company directors and officers, in foreign jurisdictions; and (xii) significantly smaller market capitalizations of emerging-market issuers. In addition, shareholders of emerging market issuers, such as the Fund, often have limited rights and few practical remedies in emerging markets. Finally, the risks associated with investments in emerging markets often are significant, and vary from jurisdiction to jurisdiction and company to company.
●
Frontier Markets Risk: Frontier markets have similar risks to emerging markets, except that these risks are often magnified in a frontier market due to its smaller and less developed economy. As a result, frontier markets may experience greater changes in market or economic conditions, financial stability, price volatility, currency fluctuations, and other risks inherent in foreign securities.
●
India Risk: Government actions, bureaucratic obstacles and inconsistent economic reform within the Indian government have had a significant effect on its economy and could adversely affect market conditions, economic growth and the profitability of companies in India. Global economic developments may inhibit the flow of foreign capital on which India is dependent to sustain its growth. Large portions of many Indian companies remain in the hands of individuals and corporate governance standards of Indian companies may be weaker and less transparent, which may increase the risk of loss and unequal treatment of investors. Investments in Indian securities may be limited or prevented, at times, due to the limits on foreign ownership imposed by the Indian regulatory authorities, including the Reserve Bank of India and the Securities and Exchange Board of India. Investments in India are subject to risks presented by investments in an emerging market country, including liquidity risk, which may result in extreme volatility in the prices of Indian securities. Religious, cultural and military disputes persist in India, and between India and Pakistan. Both India and Pakistan have tested nuclear arms, and the threat of deployment of such weapons could hinder development of the Indian economy, and escalating tensions could impact the broader region. In addition, the Indian economy could be adversely impacted by natural disasters and acts of terrorism.
●
Sovereign Debt Risk: The actions of foreign governments concerning their respective economies could have an important effect on their ability or willingness to service their sovereign debt. Such actions could have significant effects on market conditions and on the prices of securities and instruments held by a Fund, including the securities and instruments of foreign private issuers. Factors which may influence the ability or willingness of foreign sovereigns to service debt include, but are not limited to: the availability of sufficient foreign exchange on the date payment is due; the relative size of its debt service burden to the economy as a whole; its balance of payments (including export performance) and cash flow situation; its access to international credits and investments; fluctuations in interest and currency rates and reserves; and its government’s policies towards the International Monetary Fund, the World Bank, and other international agencies. If a foreign sovereign defaults on all or a portion of its foreign debt, a Fund may have limited legal recourse against the issuer and/or guarantor. In some cases, remedies must be pursued in the courts of the defaulting party itself, and the ability of the holder of foreign sovereign debt securities to obtain recourse may be subject to the political climate in the prevailing country, which could substantially delay or defeat any recovery.
Growth-Investing Risk: Growth-oriented funds may underperform when value investing is in favor, and growth stocks may be more volatile than other stocks because they are more sensitive to investor perceptions of the issuing company’s growth of earnings potential. Also, because growth companies usually reinvest a high portion of earnings in their businesses, growth stocks may lack the dividends of some value stocks that can cushion stock prices in a falling market.
Management Risk: In managing a Fund’s portfolio, the Adviser may engage one or more sub-advisers to make investment decisions on a portion of or the entire portfolio. There is a risk that the Adviser may be unable to identify and retain sub-advisers who achieve superior investment returns relative to other similar sub-advisers. The value of your investment may decrease if the Sub-Adviser incorrectly judges the attractiveness, value, or market trends affecting a particular security, issuer, industry, or sector.
71
Mortgage Dollar Roll Risk: Mortgage “dollar rolls” are transactions in which mortgage-backed securities are sold for delivery in the current month and the seller simultaneously contracts to repurchase substantially similar securities on a specified future date. The difference between the sale price and the purchase price (plus any interest earned on the cash proceeds of the sale) is netted against the interest income foregone on the securities sold to arrive at an implied borrowing rate. Alternatively, the sale and purchase transactions can be executed at the same price, with the Fund being paid a fee as consideration for entering into the commitment to purchase. If the broker-dealer to whom the Fund sells the security becomes insolvent, the Fund’s right to repurchase the security may be restricted. Other risks involved in entering into mortgage dollar rolls include the risk that the value of the security may change adversely over the term of the mortgage dollar roll and that the security the Fund is required to repurchase may be worth less than the security that the Fund originally held.
Municipal Securities Risk: The value of municipal securities may be affected by uncertainties in the municipal market related to legislation or litigation involving the taxation of municipal securities or the rights of municipal securities holders in the event of a bankruptcy. In addition, the ongoing issues facing the national economy may negatively impact the economic performance of issuers of municipal securities, and may increase the likelihood that issuers of securities in which a Fund may invest may be unable to meet their obligations. Proposals to restrict or eliminate the federal income tax exemption for interest on municipal securities are introduced before Congress from time to time. Proposals also may be introduced before state legislatures that would affect the state tax treatment of a municipal fund’s distributions. If such proposals were enacted, the availability of municipal securities and the value of a municipal fund’s holdings would be affected, and the Trustees would reevaluate a Fund’s investment goals and policies. Municipal bankruptcies are relatively rare, and certain provisions of the U.S. Bankruptcy Code governing such bankruptcies are unclear and remain untested. Further, the application of state law to municipal issuers could produce varying results among the states or among municipal securities issuers within a state. The ability of a municipal issuer to seek bankruptcy protection may be subject to the authorization of the executive or legislative branch of the state’s government, and a municipal bankruptcy may be subject to challenge in the state’s courts. These legal uncertainties could affect the municipal securities market generally, certain specific segments of the market, or the relative credit quality of particular securities. There is also the possibility that as a result of litigation or other conditions, the power or ability of issuers to meet their obligations for the payment of interest and principal on their municipal securities may be materially affected or their obligations may be found to be invalid or unenforceable. Such litigation or conditions may from time to time have the effect of introducing uncertainties in the market for municipal securities or certain segments thereof, or of materially affecting the credit risk with respect to particular bonds. Adverse economic, business, legal or political developments might affect all or a substantial portion of a Fund’s municipal securities in the same manner. Also, some municipal obligations may be backed by a letter of credit issued by a bank or other financial institution. Adverse developments affecting banks or other financial institutions could have a negative effect on the value of a Fund’s portfolio securities.
In making investments, a Fund and the investment sub-adviser will rely on the opinion of issuers’ bond counsel. Neither a Fund nor the sub-adviser will independently review the basis for those tax opinions. If any of those tax opinions are ultimately determined to be incorrect, a Fund and its shareholders could be subject to substantial tax liabilities. Certain provisions of the Internal Revenue Code of 1986, as amended (the “Code”), relating to the issuance of municipal obligations may reduce the volume of municipal securities that qualify for federal tax exemptions. Proposals that may further restrict or eliminate the income tax exemptions for interest on municipal obligations may be introduced in the future. If any such proposal became law, it may reduce the number of municipal obligations available for purchase by a Fund and could adversely affect a Fund’s shareholders by subjecting the income from a Fund to tax. If this occurs, a Fund would reevaluate its investment goals and policies to the extent that legislative or legal developments materially affect the Fund.
In order to be tax exempt, tax-exempt securities must meet certain legal requirements. Failure to meet such requirements may cause the interest received and distributed by a Fund to shareholders to be taxable. a Fund may invest in securities whose interest is subject to state tax, federal regular income tax, or federal alternative minimum tax. Consult your tax professional for more information.
The effects of a widespread health crisis such as a global pandemic could affect the ability of states and their political subdivisions to make payments on debt obligations when due and could adversely impact the value of their bonds, which could negatively impact the performance of a Fund.
Non-Diversification Risk: A non-diversified Fund may invest a significant percentage of its assets in the securities of a limited number of issuers, subject to federal income tax restrictions relating to the Fund’s qualification as a regulated investment company. Because a higher percentage of a non-diversified Fund’s holdings may be invested in the securities of a limited number of issuers, the Fund may be more susceptible to risks associated with a single economic, business, political or regulatory event than a diversified fund.
Other Investment Companies Risk: A Fund’s investments in other investment companies, such as ETFs and closed-end funds, will be subject to substantially the same risks as those associated with the direct ownership of the securities comprising the portfolios of such investment companies, and the value of a Fund’s investment will fluctuate in response to the performance of such portfolios. The risks of owning shares of other investment companies generally reflect the risks of owning the underlying securities, although lack of liquidity in an investment company could result in it being more volatile than its underlying securities, and other investment companies have management fees that increase their costs. Other investment companies’ portfolio compositions and performance may not match that of the index it is designed to track due to delays in the investment company’s implementation of changes to the composition of the index and other factors. The value of the shares of closed-end funds may be lower than the value of the portfolio securities held by the closed-end fund. Also, although many ETFs seek to provide investment results that correspond generally to the price and yield performance of a particular market index, the price movement of an ETF may not track the underlying index. In addition, if a Fund acquires shares of
72
investment companies, shareholders of a Fund will bear both their proportionate share of the fees and expenses of a Fund (including management and advisory fees) and, indirectly, the fees and expenses of the investment companies. There may also not be an active trading market available for shares of some investment companies. Additionally, trading of investment company shares may be halted or delisted by the listing exchange. To the extent a Fund is held by an affiliated fund, the ability of a Fund itself to hold other investment companies may be limited.
Portfolio Turnover Risk: Each Fund may sell its portfolio securities, regardless of the length of time that they have been held, if the sub-adviser determines that it would be in the Fund’s best interest to do so. It may be appropriate to buy or sell portfolio securities due to economic, market, or other factors that are not within the sub-adviser’s control. These transactions will increase a Fund’s “portfolio turnover.” A 100% portfolio turnover rate would occur if all of the securities in the Fund were replaced during a given period. Frequent and active trading may result in greater expenses to a Fund, which may lower the Fund’s performance and may result in the realization of substantial capital gains, including net short-term capital gains. As a result, high portfolio turnover may reduce the Fund’s returns.
Reverse Repurchase Agreement Risk: A reverse repurchase agreement involves the sale of a portfolio security by a Fund, coupled with its agreement to repurchase the instrument at a specified time and price. Reverse repurchase agreements involve the risk that the value of securities that a Fund is obligated to repurchase under the agreement may decline below the repurchase price. When a Fund enters into a reverse repurchase agreement, it is subject to the risk that the buyer (counterparty) may default on its obligations to the Fund, potentially resulting in delays, costs, and losses to the Fund. Reverse repurchase agreements involve leverage risk; a Fund may lose money as a result of declines in the values both of the security subject to the reverse repurchase agreement and the instruments in which the Fund invested the proceeds of the reverse repurchase agreement. Use of reverse repurchase agreements by a Fund will increase the volatility and potential losses of the Fund.
Quantitative Strategy Risk: A Fund’s sub-adviser may use proprietary statistical analyses and models to construct the Fund’s portfolio. A securities portfolio selected using these proprietary models can perform differently than the market as a whole as a result of the correlation factors used in the analysis to construct the models, the weight placed on each factor, and changes in the factors’ historical trends. As a result, the Fund may be more or less exposed to a risk factor than its individual holdings. Quantitative models are subject to technical issues, including programming and data inaccuracies, are based on assumptions, and rely on data that is subject to limitations (e.g., inaccuracies, staleness), any of which could adversely affect their effectiveness or predictive value. Quantitative models may not accurately predict future market movements or characteristics due to the fact that market performance can be affected by non-quantitative factors that are not easily integrated into quantitative analysis, among other factors.
Repurchase Agreement Risk: Under all repurchase agreements entered into by a Fund, a Fund’s custodian or its agent must take possession of the underlying collateral. However, if the counterparty defaults, a Fund could realize a loss on the sale of the underlying security to the extent that the proceeds of sale, including accrued interest, are less than the resale price provided in the agreement including interest. In addition, even though the Bankruptcy Code provides protection for most repurchase agreements, if the seller should be involved in bankruptcy or insolvency proceedings, a Fund may incur delay and costs in selling the underlying security or may suffer a loss of principal and interest if a Fund is treated as an unsecured creditor and is required to return the underlying security to the seller’s estate. Repurchase agreements are considered loans by a Fund.
Sector and Industry Focus Risk: A Fund that focuses its investments in the securities of a particular market sector and/or industry is subject to the risk that adverse circumstances will have a greater impact on the Fund than a fund that does not focus its investments in a particular sector and/or industry. It is possible that economic, business or political developments or other changes affecting one security in the sector and/or industry of focus will affect other securities in that sector and/or industry of focus in the same manner, thereby increasing the risk of such investments.
Value Investing Risk: Value investing presents the risk that a Fund’s security holdings may never reach their full market value because the market fails to recognize what the portfolio managers consider the true business value or because the portfolio managers have misjudged those values. In addition, value investing may fall out of favor and underperform growth or other styles of investing during given certain periods. There is also the risk that the portfolio managers may determine to sell a position prior to it reaching its intrinsic value.
73
THE FUNDS’ MANAGEMENT
Investment Adviser
Touchstone Advisors, Inc. (“Touchstone Advisors” or the “Adviser”)
303 Broadway, Suite 1100, Cincinnati, Ohio 45202
303 Broadway, Suite 1100, Cincinnati, Ohio 45202
Touchstone Advisors has been a registered investment adviser since 1994. As of March 31, 2026, Touchstone Advisors had approximately $29.6 billion in assets under management. As the Funds’ investment adviser, Touchstone Advisors reviews, supervises, and administers the Funds’ investment programs and also ensures compliance with the Funds’ investment policies and guidelines.
Touchstone Advisors is responsible for selecting each Fund’s sub-adviser(s), subject to approval by the Board. Touchstone Advisors selects a sub-adviser that has shown good investment performance in its areas of expertise. Touchstone Advisors considers various factors in evaluating a sub-adviser, including:
●
Level of knowledge and skill;
●
Performance as compared to its peers or benchmark;
●
Consistency of performance over 5 years or more;
●
Level of compliance with investment rules and strategies;
●
Employees, facilities and financial strength; and
●
Quality of service.
Touchstone Advisors will also continually monitor each sub-adviser’s performance through various analyses and through in-person, telephone, and written consultations with a sub-adviser. Touchstone Advisors discusses its expectations for performance with each sub-adviser and provides evaluations and recommendations to the Board of Trustees, including whether or not a sub-adviser’s contract should be renewed, modified, or terminated.
The SEC has granted an exemptive order that permits Touchstone ETF Trust (the “Trust”) or Touchstone Advisors, under certain conditions, to select or change sub-advisers, enter into new sub-advisory agreements, or amend existing sub-advisory agreements, regardless of whether the sub-adviser is affiliated or unaffiliated, without first obtaining shareholder approval. Shareholders of a Fund will be notified of any changes to its sub-adviser.
Two or more sub-advisers may manage a Fund, from time to time, with each managing a portion of the Fund’s assets. If a Fund has more than one sub-adviser, Touchstone Advisors allocates how much of a Fund’s assets are managed by each sub-adviser. Touchstone Advisors may change these allocations from time to time, often based upon the results of its evaluations of the sub-advisers.
Touchstone Advisors is also responsible for running all of the operations of the Funds, except those that are subcontracted to a sub-adviser, custodian, transfer agent, sub-administrative agent or other parties. For its services, Touchstone Advisors is entitled to receive an investment advisory fee from each Fund at an annualized rate, based on the average daily net assets of the Fund. The Annual Fee Rate below is the fee paid to Touchstone Advisors by each Fund, net of any advisory fee waivers and/or expense reimbursements, for the fiscal year ended December 31, 2025. Touchstone Advisors pays sub-advisory fees to each sub-adviser from its advisory fee.
| Fund |
Net Annual Fee Rate as a % of average daily net assets(1) |
| Dividend Select ETF |
0.04% |
| Dynamic International ETF |
0.29% |
| International Equity ETF |
0.10% |
| Sands Capital Emerging Markets ex-China Growth ETF |
0.00% |
| Sands Capital US Select Growth ETF |
0.49% |
| Securitized Income ETF |
0.19% |
| Strategic Income ETF |
0.37% |
| Ultra Short Income ETF |
0.14% |
74
| Fund |
Net Annual Fee Rate as a % of average daily net assets(1) |
| US Large Cap Focused ETF |
0.21% |
(1) The Net Annual Fee Rate is the fee paid to Touchstone Advisors by each Fund, net of any advisory fee waivers and/or expense reimbursements, for the fiscal period ended December 31, 2025. These advisory fee waivers and/or expense reimbursements are described in the “Annual Fund Operating Expenses” table and the related footnotes in each Fund’s summary above.
| Fund |
Annual Investment Advisory Fee |
| Large Company Growth ETF(1) |
0.60% |
(1) The Fund commenced operations on March 13, 2026.
Advisory and Sub-Advisory Agreement Approval. A discussion of the basis for the Board’s approval of the Funds’ advisory and sub-advisory agreements was included in the Trust’s December 31, 2025 financial statements for all Funds except Large Company Growth ETF, which will be reported in the Trust’s June 30, 2026 financial statements.
Additional Information
The Trustees of the Trust oversee generally the operations of each Fund and the Trust. The Trust enters into contractual arrangements with various parties, including, among others, the Funds investment adviser, custodian, transfer agent, accountants and distributor, who provide services to each Fund. Shareholders are not parties to, or intended (or “third-party”) beneficiaries of, any of those contractual arrangements, and those contractual arrangements are not intended to create in any such individual shareholder or group of shareholders any right to enforce the terms of the contractual arrangements against the service providers or to seek any remedy under the contractual arrangements against the service providers, either directly or on behalf of the Trust.
The Adviser has also entered into a contractual expense limitation agreement with the Trust as described in the footnotes to the “Annual Fund Operating Expenses” tables found in the Summary sections of the Prospectus. After the expiration of the current expense limitations, if the expense limitations are not continued past their termination date at their current levels, the expenses borne by shareholders of a Fund would increase. With respect to the International Equity ETF, after the expiration of the current expense limitation agreement, the expense limitation levels are anticipated to increase to a level that is competitive with the Fund’s peer group.
This prospectus provides information concerning the Trust and each Funds that you should consider in determining whether to purchase shares of each Fund. The Fund may make changes to this information from time to time. Neither this prospectus, the SAI or any document filed as an exhibit to the Trust’s registration statement, is intended to, nor does it, give rise to an agreement or contract between the Trust or a Fund and its shareholders, or give rise to any contract or other rights in any such individual shareholder, group of shareholders or other person other than any rights conferred explicitly by federal or state securities laws that may not be waived.
Sub-Advisers and Portfolio Managers
Listed below are the sub-advisers and their respective portfolio managers that have responsibility for the day-to-day management of each Fund. A brief biographical description of each portfolio manager is also provided. The SAI provides additional information about the portfolio managers’ investments in the Fund or Funds that they manage, a description of their compensation structure, and information regarding other accounts that they manage.
DSM Capital Partners LLC (“DSM”), located at 7111 Fairway Drive, Suite 350, Palm Beach Gardens, Florida 33418, serves as sub-adviser to the Large Company Growth ETF and served as sub-adviser to the Large Company Growth Fund, the predecessor fund to the Large Company Growth ETF. As sub-adviser, DSM makes investment decisions for the Fund and also seeks to ensure compliance with the Fund’s investment policies and guidelines. DSM was founded in 2001 and serves as investment adviser to endowments and foundations, pensions plans, family offices, high net worth individual investors, and corporations. DSM is wholly owned by its co-founders Daniel Strickberger and Stephen Memishian, and by employees. As of December 31, 2025, DSM had approximately $6.9 billion in assets under management.
Large Company Growth ETF
Daniel Strickberger, Chief Investment Officer, co-founded DSM in February 2001 and has served as a Managing Partner ever since. Mr. Strickberger serves as portfolio manager for the Fund and served as portfolio manager for the Large Company Growth Fund. Prior to co-founding DSM, Mr. Strickberger was a partner at W.P. Stewart & Company and Lazard Freres & Co. Mr. Strickberger is a member of DSM’s Board of Managers.
75
David McVey, Deputy Chief Investment Officer and Portfolio Manager, started his investment career in 1992 at Mutual Funds Service Company in Boston. In 1995 he became equity research associate for biotechnology and healthcare at Hambrecht & Quist. He then moved to Furman Selz, becoming a vice president and serving as a media and entertainment analyst. Most recently, he was a media and entertainment associate analyst at J.P. Morgan H&Q. David received a Bachelor of Science degree in Economics and Finance from New Hampshire College, and holds a Chartered Financial Analyst designation. David joined DSM in 2001 and is a member of DSM’s Board of Managers.
Eric Woodworth CFA, Deputy Chief Investment Officer and Portfolio Manager, joined PricewaterhouseCoopers (PwC) in 1994 as a technology consultant. He became a team leader and managed projects for PwC in Toronto and Chicago. He also served as an internal instructor for PwC in Tampa, Florida. Eric left PwC in 1999 to attend business school, spending his summer in equity research at Merrill Lynch. Eric holds a Bachelor of Arts in Economics from Williams College, an MBA in Finance from New York University, and holds a Chartered Financial Analyst designation. Eric joined DSM in 2001 and is a member of DSM's Board of Managers.
Fort Washington Investment Advisors, Inc. (“Fort Washington”), located at 303 Broadway, Suite 1200, Cincinnati, Ohio 45202, serves as the sub-adviser to the Dividend Select ETF, the Strategic Income ETF, the US Large Cap Focused ETF and the Ultra Short Income ETF. As the sub-adviser, Fort Washington makes investment decisions for the Funds and also ensures compliance with the Funds’ investment policies and guidelines. Fort Washington is controlled by Western & Southern Mutual Holding Company. Jill T. McGruder and E. Blake Moore, Jr., interested Trustees of the Trust, may be deemed to be affiliates of Fort Washington. As of December 31, 2025, Fort Washington had approximately $95.0 billion in assets under management, which includes $5.5 billion in commitments managed by Fort Washington Capital Partners Group, a division of Fort Washington.
Dividend Select ETF
Austin R. Kummer, CFA, Managing Director and Senior Portfolio Manager. Mr. Kummer joined Fort Washington in 2013. He focuses on portfolio management and research functions within Multi-Sector Fixed Income and Dividend Equity strategies. He also contributes to asset allocation and macro positioning for the firm and has shared responsibility for the company’s Private Debt portfolio. Mr. Kummer received a BBA from Ohio University in Finance and Business Economics and an MBA in Finance from Xavier University. He is a CFA charterholder.
James E. Wilhelm, Jr. Mr. Wilhelm joined Fort Washington in 2002. Mr. Wilhelm has investment experience dating back to 1993. He began as a Senior Equity Analyst in 2002 and was named Portfolio Manager in 2005. He became Assistant Vice President in 2007, Vice President in 2008, Managing Director in 2014, and was Head of Public Equities from 2015 to 2020.
Prior Performance for Similar Accounts Managed by Fort Washington
The following table sets forth composite performance data relating to the historical performance of all accounts (except as noted below) managed by Fort Washington for the periods indicated with investment objectives, policies, strategies, and risks substantially similar to those of the Dividend Select ETF. The data is provided to illustrate the past performance of Fort Washington in managing substantially similar accounts as measured against market indexes and does not represent the performance of the Fund. The following accounts are excluded from the composite: accounts that do not pay fees, accounts that are not fully discretionary, and accounts that have less than $25 million under management, which is the minimum amount necessary to fully implement the investment strategy.
The following performance information is not the Dividend Select ETF’s performance, should not be considered indicative of the past or future performance of the Fund, and should not be considered a substitute for the Fund’s performance.
Average Annual Total Returns
For the periods ended December 31, 2025
For the periods ended December 31, 2025
| |
1 Year |
Since Inception* |
| Fort Washington Dividend Select Equity Composite (Gross) |
16.59 % |
11.93 % |
| Fort Washington Dividend Select Equity Composite (Net) |
16.01 % |
11.37 % |
| Russell 1000® Value Index (reflects no deductions for fees, expenses or taxes) |
15.91 % |
9.86 % |
*
The inception date for the Composite is January 1, 2020.
The Fort Washington Dividend Select Equity Composite (the “Composite”) represents the investment performance track record of Fort Washington’s dividend select equity strategy, which is the strategy that is used to manage the Fund. The accounts comprising the Composite are not subject to the same types of expenses to which the Fund is subject, certain investment limitations, diversification requirements, and other restrictions imposed by the 1940 Act and the Internal Revenue Code of 1986, as amended. Thus, the performance results for the account could have been adversely affected if the account had been regulated as investment companies under federal securities and tax laws. The method for computing historical performance information for the Composite differs from the SEC’s method for computing the historical performance of the Dividend Select ETF.
76
The Composite’s returns shown above are presented gross and net of management fees and include the reinvestment of all income. Gross returns will be reduced by investment advisory fees and other expenses that may be incurred in the management of the account. Net of fee performance was calculated using all actual fees and expenses including the management fee. Individual portfolio returns are calculated on a daily valuation basis. These fees and expenses are not reflective of the fees and expenses of the Dividend Select ETF and may vary depending on, among other things, the applicable fee schedule and portfolio size. All returns are expressed in U.S. dollars. The Dividend Select ETF’s fees are reflected in its fee table in the “Summary” section of this prospectus.
The performance information for the Composite was calculated in accordance with Global Investment Performance Standards (GIPS®). The Composite performance information is intended to illustrate past performance for substantially similarly managed accounts by Fort Washington. Past performance of the Composite is not indicative of future results. As with any investment there is always the potential for gains as well as the possibility of losses. The Composite performance information presented herein has been calculated and provided by the Dividend Select ETF’s sub-adviser.
Securitized Income ETF
Scott D. Weston, Managing Director and Senior Portfolio Manager, joined Fort Washington in September 1999. He is also Fort Washington’s head of structured products and lead sector specialist in collateralized loan obligations. Mr. Weston is a graduate of the University of Utah with a BS in Political Science and the University of Cincinnati with an MBA in Finance. He has investment experience dating back to 1992 and is jointly and primarily responsible for the management of the Fund.
Brent A. Miller, CFA, Vice President and Senior Portfolio Manager, joined Fort Washington in June 2001 and is jointly and primarily responsible for the management of the Fund. He became a portfolio manager in 2008 and was an assistant portfolio manager prior to 2008. He is also lead sector specialist in mortgage-backed securities. Mr. Miller graduated Magna Cum Laude from the University of Evansville with a BS in Mathematics. He has investment experience dating back to 1999. He is a CFA charterholder.
Laura L. Mayfield, Assistant Vice President and Senior Portfolio Manager, joined Fort Washington in 2007. She became Senior Portfolio Manager in 2020 and is lead sector specialist in asset-backed securities. Ms. Mayfield graduated from Olivet Nazarene University with a BA in Marketing and Spanish, and received her MBA from Xavier University. She has investment experience dating back to 2010 and is jointly and primarily responsible for the management of the Fund.
Richard Schneider, Vice President and Senior Portfolio Manager, joined Fort Washington in 2019. He is responsible for the commercial mortgage-backed securities portfolios for both Western & Southern Financial Group and third-party institutional clients. Prior to joining Fort Washington, he was with Mesirow Financial in Chicago where he was a Managing Director responsible for trading CMBS and other structured products. He also has previous experience at Loop Capital Markets, Lehman Brothers Asset Management, and Lincoln Capital Management. Schneider received a BS in Mathematics and an MBA from the University of Notre Dame.
Prior Performance for Similar Accounts Managed by Fort Washington
The following table sets forth composite performance data relating to the historical performance of all accounts managed by Fort Washington for the periods indicated with investment objectives, policies, strategies, and risks substantially similar to those of the Securitized Income ETF. The data is provided to illustrate the past performance of Fort Washington in managing substantially similar accounts as measured against market indexes and does not represent the performance of the Securitized Income ETF. The same sub-adviser, Fort Washington, has been responsible for the day-to-day management of the accounts for all periods shown in the performance table.
The following performance information is not the Securitized Income ETF’s performance, should not be considered indicative of the past or future performance of the Fund, and should not be considered a substitute for the Fund’s performance.
Average Annual Total Returns
For the periods ended December 31, 2025
For the periods ended December 31, 2025
| |
1 Year |
5 Year |
10 Year |
Since Inception* |
| Fort Washington Securitized Composite (Gross) |
8.23 % |
4.04 % |
4.61 % |
6.12 % |
| Fort Washington Securitized Composite (Net) |
7.85 % |
3.68 % |
4.25 % |
5.75 % |
| Bloomberg US MBS Index (reflects no deductions for fees, expenses or taxes)** |
8.58 % |
0.15 % |
1.59 % |
1.78 % |
| Bloomberg US Aggregate Bond Index (reflects no deductions for fees, expenses or taxes)** |
7.30 % |
(0.36 %) |
2.01 % |
2.09 % |
*The inception date for the Composite is October 1, 2011.
77
** The Bloomberg US MBS Index and the Bloomberg US Aggregate Bond Index are included to provide comparative relative performance against the Composite. These indexes are broad-based securities indexes that reflect the investment strategies and performance target of the accounts underlying the Composite. An index is unmanaged and it is not possible to invest directly in an index. As such, year-by-year index figures do not account for any fees or expenses.
The Fort Washington Securitized Opportunities Composite (the “Composite”) represents the investment performance track record of Fort Washington’s securitized income strategy, which is the strategy that will be used to manage the Fund. Because of the similarities between the Securitized Income ETF and the Composite, this information may help provide an indication of the Fund’s risks by showing how a similar Composite has performed historically. The performance of the Composite, however, is not the performance of the Fund, and you should not assume that the Fund will have the same performance as the Composite. The performance of the Fund may be greater or less than the performance of the Composite due to, among other things, the number of the holdings in and composition of the Fund's portfolio, as well as the asset size and cash flow differences between the Fund and the Composite. The accounts comprising the Composite are not subject to the same types of expenses to which the Fund is subject, certain investment limitations, diversification requirements, and other restrictions imposed by the 1940 Act and the Internal Revenue Code of 1986, as amended. Thus, the performance results for the account could have been adversely affected if the account had been regulated as investment companies under federal securities and tax laws. The method for computing historical performance information for the Composite differs from the SEC’s method for computing the historical performance of the Securitized Income ETF.
The Composite’s returns shown above are presented gross and net of management fees and expenses and include the reinvestment of all income. Gross returns will be reduced by investment advisory fees and other expenses that may be incurred in the management of the account. Net of fee performance was calculated using all actual fees and expenses including the management fee. Individual portfolio returns are calculated on a daily valuation basis. These fees and expenses are not reflective of the fees and expenses of the Securitized Income ETF and may vary depending on, among other things, the applicable fee schedule and portfolio size. All returns are expressed in U.S. dollars. The Securitized Income ETF’s fees are reflected in its fee table in the “Summary” section of this prospectus.
The performance information for the Composite was calculated in accordance with Global Investment Performance Standards (GIPS®). The Composite performance information is intended to illustrate past performance for substantially similarly managed accounts by Fort Washington. Past performance of the Composite is not indicative of future results. As with any investment there is always the potential for gains as well as the possibility of losses. The Composite performance information presented herein has been calculated and provided by the Securitized Income ETF’s sub-adviser.
Strategic Income ETF
Daniel J. Carter, CFA, Managing Director and Senior Portfolio Manager. Mr. Carter began as an Assistant Portfolio Manager of Fort Washington in 2000 and has been an Assistant Vice President and Portfolio Manager since 2007. Mr. Carter’s responsibilities include portfolio management of diversified broad market fixed income portfolios and the Emerging Markets Debt strategy. He also serves as an asset specialist for the Government (Treasury/Agency/TIPS) sectors within the fixed income markets. Mr. Carter joined the firm in 2000 as a credit analyst. Prior to joining Fort Washington, Mr. Carter was an analyst focusing on fixed income with the Ohio Casualty Group and Provident Financial Group. He received a BS in Business (Finance and Accounting) from Miami University and is a CFA charterholder.
Austin R. Kummer, CFA, Managing Director and Senior Portfolio Manager. Mr. Kummer joined Fort Washington in 2013. He focuses on portfolio management and research functions within Multi-Sector Fixed Income and Dividend Equity strategies. He also contributes to asset allocation and macro positioning for the firm and has shared responsibility for the company’s Private Debt portfolio. Mr. Kummer received a BBA from Ohio University in Finance and Business Economics and an MBA in Finance from Xavier University. He is a CFA charterholder.
Brendan M. White, CFA, Senior Vice President and Co-Chief Investment Officer of Fort Washington. In this role, Mr. White is responsible for overseeing the investment activity for all assets under management with emphasis on all fixed-income functions while collaborating with Chris Shipley, Co-Chief Investment Officer, on all investment decisions. Mr. White also shares responsibility for asset allocation and macro-positioning for both Fort Washington and Western & Southern Financial Group. Mr. White joined Fort Washington in 1993 and has more than 30 years of industry experience. Prior to joining the firm, he was with Ohio Casualty Corporation where he was a securities analyst supporting the High Yield and Mortgage-Backed Securities portfolios. He is a CFA charterholder.
Prior Performance for Similar Accounts Managed by Fort Washington
The following table sets forth composite performance data relating to the historical performance of all accounts (except as noted below) managed by Fort Washington for the periods indicated with investment objectives, policies, strategies, and risks substantially similar to those of the Strategic Income ETF. The data is provided to illustrate the past performance of Fort Washington in managing
78
substantially similar accounts as measured against market indexes and does not represent the performance of the Fund. The following accounts are excluded from the composite: accounts that do not pay fees, accounts that are not fully discretionary, and accounts that have less than $25 million under management, which is the minimum amount necessary to fully implement the investment strategy.
The following performance information is not the Strategic Income ETF’s performance, should not be considered indicative of the past or future performance of the Fund, and should not be considered a substitute for the Fund’s performance.
Average Annual Total Returns
For the periods ended December 31, 2025
For the periods ended December 31, 2025
| |
1 Year |
3 Years |
5 Years |
Since Inception* |
| Fort Washington Strategic Income Composite (Gross) |
9.75 % |
8.55 % |
3.55 % |
5.22 % |
| Fort Washington Strategic Income Composite (Net) |
9.31 % |
8.12 % |
3.13 % |
4.80 % |
| Bloomberg U.S. Aggregate Bond Index (reflects no deductions for fees, expenses or taxes) |
7.30 % |
4.66 % |
(0.36 )% |
1.78 % |
*
The inception date for the Composite is July 1, 2017.
The Fort Washington Strategic Income Composite (the “Composite”) represents the investment performance track record of Fort Washington’s strategic income strategy, which is the strategy that is used to manage the Fund. The accounts comprising the Composite are not subject to the same types of expenses to which the Fund is subject, certain investment limitations, diversification requirements, and other restrictions imposed by the 1940 Act and the Internal Revenue Code of 1986, as amended. Thus, the performance results for the account could have been adversely affected if the account had been regulated as investment companies under federal securities and tax laws. The method for computing historical performance information for the Composite differs from the SEC’s method for computing the historical performance of the Strategic Income ETF.
The Composite’s returns shown above are presented gross and net of management fees and include the reinvestment of all income. Gross returns will be reduced by investment advisory fees and other expenses that may be incurred in the management of the account. Net of fee performance was calculated using all actual fees and expenses including the management fee. Individual portfolio returns are calculated on a daily valuation basis. These fees and expenses are not reflective of the fees and expenses of the Strategic Income ETF and may vary depending on, among other things, the applicable fee schedule and portfolio size. All returns are expressed in U.S. dollars. The Strategic Income ETF’s fees are reflected in its fee table in the “Summary” section of this prospectus.
The performance information for the Composite was calculated in accordance with Global Investment Performance Standards (GIPS®). The Composite performance information is intended to illustrate past performance for substantially similarly managed accounts by Fort Washington. Past performance of the Composite is not indicative of future results. As with any investment there is always the potential for gains as well as the possibility of losses. The Composite performance information presented herein has been calculated and provided by the Strategic Income ETF’s sub-adviser.
US Large Cap Focused ETF
James E. Wilhelm, Jr., Managing Director and Senior Portfolio Manager, joined Fort Washington in 2002. He has investment experience dating back to 1993. He began as a Senior Equity Analyst in 2002 and was named Portfolio Manager in 2005. He became Assistant Vice President in 2007, Vice President in 2008, Managing Director in 2014, and was Head of Public Equities from 2015 to 2020.
Sunit Gogia, Vice President, Portfolio Manager and Director of Equity Research joined Fort Washington in 2012. He has investment experience dating back to 2003. He began as a Senior Equity Analyst with Fort Washington in 2012 covering the technology and telecom sectors. He was named Associate Portfolio Manager and Director of Equity Research in 2017. Prior to joining Fort Washington, Sunit was a Senior Equity Analyst with Morningstar, Inc. following the enterprise software industry. Prior to that he was a Software Developer and Program Manager at Microsoft.
Ultra Short Income ETF
Scott D. Weston, Managing Director and Senior Portfolio Manager, joined Fort Washington in September 1999. He is also Fort Washington’s head of structured products and lead sector specialist in collateralized loan obligations. Mr. Weston is a graduate of the University of Utah with a BS in Political Science and the University of Cincinnati with an MBA in Finance. He has investment experience dating back to 1992 and is jointly and primarily responsible for the management of the Fund.
Brent A. Miller, CFA, Vice President and Senior Portfolio Manager, joined Fort Washington in June 2001 and is jointly and primarily responsible for the management of the Fund. He became a portfolio manager in 2008 and was an assistant portfolio manager prior to 2008. He is also lead sector specialist in mortgage-backed securities. Mr. Miller graduated Magna Cum Laude from the University of Evansville with a BS in Mathematics. He has investment experience dating back to 1999. He is a CFA charterholder.
79
Laura L. Mayfield, Assistant Vice President and Senior Portfolio Manager, joined Fort Washington in 2007. She became Senior Portfolio Manager in 2020 and is lead sector specialist in asset-backed securities. Ms. Mayfield graduated from Olivet Nazarene University with a BA in Marketing and Spanish, and received her MBA from Xavier University. She has investment experience dating back to 2010 and is jointly and primarily responsible for the management of the Fund.
Richard V. Schneider, Vice President and Senior Portfolio Manager, joined Fort Washington in 2019. Mr. Schneider is a Vice President and Senior Portfolio Manager on Fort Washington’s Structured Products desk. He is responsible for the commercial mortgage-backed securities (CMBS) portfolios for both Western & Southern Financial Group (the sub-adviser’s parent company) and third-party institutional clients. Prior to joining Fort Washington, he was with Mesirow Financial in Chicago where he was a Managing Director responsible for trading CMBS and other structured products. He also has previous experience at Loop Capital Markets, Lehman Brothers Asset Management, and Lincoln Capital Management. Mr. Schneider received a BS in Mathematics and an MBA from the University of Notre Dame.
London Company of Virginia, LLC d/b/a The London Company (“The London Company”), located at 1800 Bayberry Court, Suite 301, Richmond, Virginia, 23226, serves as sub-adviser to the International Equity ETF. As sub-adviser, The London Company makes investment decisions for the Fund and also ensures compliance with the Fund’s investment policies and guidelines. The London Company was founded in 1994 and is majority employee owned. Stephen Goddard may be deemed to be a control person of The London Company through his ownership in TLC Holdings LLC, which owns a majority of The London Company. As of December 31, 2025, The London Company had approximately $14.9 billion in assets under management.
International Equity ETF
TJ Carter, CFA, CPA. Mr. Carter has nearly 20 years of experience investing in equities across both US and non-US markets. He joined The London Company from Barrow Hanley Global Investors where he spent nine years as a portfolio manager and analyst for both the Global Value and Non-US Value strategies and led the non-US Value research process. Prior to his time at Barrow Hanley, he was an analyst at Kingstown Capital Management and Outpoint Capital Management, both of which are value-oriented firms. Mr. Carter received a BS in Business Administration from the University of Arkansas and an MBA from Columbia Business School. He is a CFA charterholder and a CPA licensed in Texas.
Prior Performance for Similar Accounts Managed by The London Company
The following table sets forth composite performance data relating to the historical performance of all accounts managed by The London Company for the periods indicated with investment objectives, policies, strategies, and risks substantially similar to those of the Fund. The data is provided to illustrate the past performance of The London Company in managing substantially similar accounts as measured against a market index and does not represent the performance of the Fund.
The following performance information is not the International Equity ETF’s performance, should not be considered indicative of the past or future performance of the Fund, and should not be considered a substitute for the Fund’s performance.
Average Annual Total Returns
For the periods ended December 31, 2025
For the periods ended December 31, 2025
| |
1 Year |
Since Inception* |
| The London Company International Equity Strategy (Gross) |
17.6 % |
18.6 % |
| The London Company International Equity Strategy (Net) |
16.7 % |
17.7 % |
| MSCI EAFE Index (Net) (reflects no deductions for fees, expenses or taxes)** |
31.2 % |
19.9 % |
*The inception date for the Composite is September 30, 2023.
**The MSCI EAFE Index (Net) measures performance of large and mid-cap securities across developed markets around the world, including countries in Europe, Australia, Asia, and the Far East, excluding the U.S. and Canada. It includes over 900 securities, and covers approximately 85% of the free float-adjusted market capitalization in each of the 21 countries. Index returns are shown net of withholding taxes. The index reflects the investment strategies and performance of the Composite and is provided for comparative purposes. An index is unmanaged and it is not possible to invest directly in an index. Index performance figures do not account for any sales charges, fees or fund expenses.
The London Company International Equity Composite (the “Composite”) represents the investment performance track record of The London Company’s international equity strategy, which is the strategy that will be used to manage the Fund. Because of the similarities between the Fund and the Composite, this information may help provide an indication of the Fund's risks by showing how a similar Composite has performed historically. The performance of the Composite, however, is not the performance of the Fund, and you should not assume the Fund will have the same performance as the Composite. The performance of the Fund may be greater or less than the performance of the Composite due to, among other things, the number of the holdings in and composition of the Fund's portfolio, as well as the asset size and cash flow differences between the Fund and the Composite. The accounts comprising the Composite are not subject to the same types of expenses to which the Fund is subject, certain investment limitations,
80
diversification requirements, and other restrictions imposed by the 1940 Act and the Internal Revenue Code of 1986, as amended. Thus, the performance results for the account could have been adversely affected if the account had been regulated as an investment company under federal securities and tax laws. The method for computing historical performance information for the Composite differs from the SEC's method for computing the historical performance of the Fund.
The Composite's returns above are presented gross of management and custodian fees and net of transaction costs. Net of fee returns are calculated net of actual The London Company management fees and transaction costs and gross of custodian and other fees. Non-fee paying accounts net performance is calculated using a model fee of 0.75%, which is the highest tier of the composite fee schedule. Returns may be net of miscellaneous fund expenses. Returns are calculated and stated in U.S. dollars. Composite performance is calculated net or gross of foreign withholding taxes on dividends and interest income dependent on custodian data. Composite returns are calculated on a monthly basis. These fees and expenses are not reflective of the fees and expenses of the Fund and may vary depending on, among other things, the applicable fee schedule and portfolio size. The Fund’s fees are reflected in its fee table in the “Summary” section of this prospectus.
The performance information for the Composite was calculated in accordance with Global Investment Performance Standards (GIPS®). The Composite performance information is intended to illustrate past performance for substantially similarly managed accounts by The London Company. Past performance of the Composite is not indicative of future results. As with any investment there is always the potential for gains as well as the possibility of losses. The Composite performance information presented herein has been calculated and provided by the Fund's sub-adviser.
Los Angeles Capital Management LLC (“Los Angeles Capital” or the “Firm”), located at 11150 Santa Monica Blvd., Suite 200, Los Angeles, California 90025 serves as the sub-adviser to the Dynamic International ETF. As the sub-adviser, Los Angeles Capital makes investment decisions for the Fund and also ensures compliance with the Fund’s investment policies and guidelines. Formed in 2002, Los Angeles Capital is independent and employee-owned. Los Angeles Capital provides investment management advice across a range of equity investment strategies that are broadly categorized as U.S. equities, Emerging Markets equities, Global equities, Developed Markets outside the U.S. equities, and long/short equities. Founding members include Tom Stevens CFA, Chairman; Hal Reynolds CFA, Vice Chairman; and Stuart Matsuda, Chief Trading Officer. Daniel Allen CFA, is CEO & President and joined the Firm in 2009. As of December 31, 2025, Los Angeles Capital had approximately $40 billion in assets under management.
Dynamic International ETF
Hal W. Reynolds, CFA. Hal Reynolds is Vice Chairman and Senior Portfolio Manager at Los Angeles Capital. He is also a member of the Board of Directors and the Investment, Management, and Portfolio Review Committees of the Firm. Hal served as Chief Investment Officer for Los Angeles Capital and LACM Global, as well as Chair of the Firm’s Investment Committee from 2002 until June 2025.
Since co-founding Los Angeles Capital in 2002, Mr. Reynolds has worked closely with the Research team to develop Investor Preference Theory®, Los Angeles Capital’s Dynamic Alpha Stock Selection Model®, and the Forward Attribution® process for developing forwarding looking expected factor returns. He offers guidance on key projects to enhance the stock selection, portfolio construction, and trading processes, works closely with clients, and provides leadership on strategic initiatives for the Firm, including in the areas of research and product development. As a member of the Portfolio Review Committee, Mr. Reynolds also works with senior members of the Portfolio Management team to establish key parameters for portfolio construction and rebalancing, as well as to develop procedures for monitoring and controlling portfolio risk.
Prior to Los Angeles Capital, Mr. Reynolds was a managing director and principal at Wilshire Associates and prior to joining Wilshire, Mr. Reynolds was a vice president at Mellon Bank where he was responsible for the design and management of Mellon’s portfolio analysis product for plan sponsors.
Ed Rackham, Ph.D. Ed Rackham is Chief Investment Officer of Los Angeles Capital Management, Chair of the Investment Committee, and a member of the Firm’s Board of Directors.
In his current role, Dr. Rackham works to bring the Los Angeles Capital Investment Team’s latest ideas to the investment process. He collaborates closely with the Chief Research Officer to enhance the Firm’s quantitative models and portfolio management tools and has demonstrated leadership in bringing together the best ideas from the Firm’s Research and Information Technology groups to create a cloud-based platform to spur innovation. By working closely with the Firm’s Portfolio Managers, Ed continues to improve implementation by achieving greater alignment between Dynamic Alpha Model views and portfolio holdings, and through coordination of the Relationship and Portfolio Management teams, he works with the Firm’s clients to discuss key research findings and investment results. Prior to assuming the role of Chief Investment Officer, Ed served as the Co-Director of Research managing development of the Firm’s Investment models with a focus on the risk management and portfolio construction toolset.
Prior to joining Los Angeles Capital, Dr. Rackham spent six years at Wilshire Associates researching and developing risk and portfolio analytics tools, most recently as the Head of Research and Development of their Equity Analytics group. Previously, Dr. Rackham was an instructor in mathematics and physical chemistry at the University of Oxford, where he also earned his doctorate.
81
Daniel Arche, CFA. As a Senior Portfolio Manager and Director, Portfolio Strategy, Mr. Arche is responsible for select client relationships and managing their accounts in accordance with Los Angeles Capital's investment philosophy and process. Mr. Arche works to ensure that portfolios reflect the investment outlook of the Model and that portfolios are operating within expected risk tolerances and guidelines. He recommends changes to portfolio parameters with the goal of enhancing returns or better controlling risk. Mr. Arche is a member of the Firm’s Investment Committee, which is comprised of senior members of the investment team and is responsible for overseeing all decisions regarding improvements to the investment process. Mr. Arche is also chair of the Portfolio Review Committee, which meets to review the performance, risk profile, and characteristics of client portfolios and the outlook of Los Angeles Capital’s Dynamic Alpha Stock Selection Model® . Previously, Mr. Arche worked in the wealth management division of City National Bank.
Sands Capital Management, LLC (“Sands Capital”), located at 1000 Wilson Boulevard, Suite 3000, Arlington, Virginia 22209, serves as sub-adviser to the Sands Capital Emerging Markets ex-China Growth ETF and Sands Capital US Select Growth ETF. As sub-adviser, Sands Capital makes investment decisions for the Funds and also ensures compliance with the Funds’ investment policies and guidelines. Sands Capital is controlled by Frank M. Sands. As of December 31, 2025, Sands Capital had approximately $44.3 billion in discretionary assets under management in the firm’s public equity strategies.
Sands Capital Emerging Markets ex-China Growth ETF
Brian A. Christiansen, CFA, Senior Portfolio Manager, Research Analyst and Executive Managing Director joined Sands Capital in June 2006 as a Research Associate. Mr. Christiansen received his BA in Economics from Yale University (2005). He also earned his MBA from Yale School of Management (2009).
Teeja Boye, CFA, Portfolio Manager and Senior Research Analyst joined Sands Capital in 2014 as a Research Analyst. Prior to 2014, Mr. Boye worked as an Investment Analyst for Insparo Asset Management in London, UK, from 2008 to 2013. From 2006 to 2008, he worked as an Associate Analyst for UBS in London, UK. Mr. Boye received his BSc in Economics and Economic History from the London School of Economics (2006) and an MBA from the Darden School at the University of Virginia (2019).
Prior Performance for Similar Accounts Managed by Sands Capital
Sands Capital is the Fund’s sub-adviser. The following table sets forth composite performance data relating to the historical performance of all accounts managed by Sands Capital for the periods indicated with investment objectives, policies, strategies, and risks substantially similar to those of the Fund. The data is provided to illustrate the past performance of Sands Capital in managing substantially similar accounts as measured against a market index and does not represent the performance of the Fund.
The following performance information is not the Sands Capital Emerging Markets ex-China Growth ETF’s performance, should not be considered indicative of the past or future performance of the Fund, and should not be considered a substitute for the Fund’s performance.
Average Annual Total Returns
For the periods ended December 31, 2025
For the periods ended December 31, 2025
| |
1 Year |
Since Inception* |
| Sands Capital Emerging Markets ex-China Strategy (Gross) |
27.30 % |
18.04 % |
| Sands Capital Emerging Markets ex-China Strategy (Net) |
26.27 % |
17.07 % |
| MSCI Emerging Markets ex-China Index (reflects no deductions for fees, expenses or taxes)** |
34.61 % |
18.70 % |
*The inception date for the Composite is December 31, 2022.
**The MSCI Emerging Markets ex-China Index captures large and mid cap representation across 23 of the 24 emerging market countries, excluding China. With 673 constituents, the index covers approximately 85% of the free float-adjusted market capitalization in each country. The index reflects the investment strategies and performance of the Composite and is provided for comparative purposes. An index is unmanaged and it is not possible to invest directly in an index. Index performance figures do not account for any sales charges, fees or fund expenses.
The Sands Capital Emerging Markets ex-China Composite (the “Composite”) represents the investment performance track record of Sands Capital’s emerging markets ex-China strategy, which is the strategy that is used to manage the Fund. Because of the similarities between the Fund and the Composite, this information may help provide an indication of the Fund’s risks by showing how a similar Composite has performed historically. The performance of the Composite, however, is not the performance of the Fund, and you should not assume the Fund will have the same performance as the Composite. The performance of the Fund may be greater or less than the performance of the Composite due to, among other things, the number of the holdings in and composition of the Fund's portfolio, as well as the asset size and cash flow differences between the Fund and the Composite. The accounts comprising the Composite are not subject to the same types of expenses to which the Fund is subject, certain investment limitations, diversification requirements, and other restrictions imposed by the 1940 Act and the Internal Revenue Code of 1986, as amended.
82
Thus, the performance results for the account could have been adversely affected if the account had been regulated as an investment company under federal securities and tax laws. The method for computing historical performance information for the Composite differs from the SEC's method for computing the historical performance of the Fund.
The Composite’s returns shown above are presented gross and net of management fees and expenses and include the reinvestment of all income. Gross returns will be reduced by investment advisory fees and other expenses that may be incurred in the management of the account. Net of fee performance was calculated using all actual fees and expenses including the management fee. Individual portfolio returns are calculated on a daily valuation basis. These fees and expenses are not reflective of the fees and expenses of the Fund and may vary depending on, among other things, the applicable fee schedule and portfolio size. All returns are expressed in U.S. dollars. The Fund’s fees are reflected in its fee table in the “Summary” section of this prospectus.
The performance information for the Composite was calculated in accordance with Global Investment Performance Standards (GIPS®). The Composite performance information is intended to illustrate past performance for substantially similarly managed accounts by Sands Capital. Past performance of the Composite is not indicative of future results. As with any investment there is always the potential for gains as well as the possibility of losses. The Composite performance information presented herein has been calculated and provided by the Fund's sub-adviser.
Sands Capital US Select Growth ETF
Wesley A. Johnston, CFA, Senior Portfolio Manager, Research Analyst, joined Sands Capital in 2004. He has investment experience dating back to 2004.
Thomas H. Trentman, CFA, Senior Portfolio Manager, Research Analyst, joined Sands Capital in 2005. He has investment experience dating back to 2005.
Benjamin H. Betcher, CFA, Portfolio Manager and Senior Research Analyst joined Sands Capital in 2021. He has investment experience dating back to 2014.
Additional Information. The SAI provides additional information about the portfolio managers’ compensation structure, other managed accounts and ownership of securities in the Funds.
83
DISTRIBUTION AND FINANCIAL INTERMEDIARIES
Distributor. Foreside Fund Services, LLC (the “Distributor”) serves as the distributor of each Fund. Touchstone Advisors will pay the Distributor for distribution-related services provided to the Funds from its own resources and not from each Fund’s assets.
Rule 12b-1 Distribution Plans. The Board has adopted a Rule 12b-1 plan, which allows payment of marketing fees of up to 0.25% of a Fund’s average net assets; however, the Funds' Board of Trustees has not authorized such payments to be made. The Rule 12b-1 plan is intended to remain dormant. None of the Funds will accrue or incur any Rule 12b-1 fees under the Rule 12b-1 plan until such future date as the Board determines to activate the plan.
Additional Compensation to Financial Intermediaries. Touchstone Advisors may pay certain broker-dealers, banks and other financial intermediaries, from its own resources, that support the sale of Fund shares or provide services to Fund shareholders or for participating in activities that are designed to make registered representatives and other professionals more knowledgeable about exchange-traded products, including each Fund, or for other activities such as participating in marketing activities and presentations, educational training programs, conferences, the development of technology platforms and reporting systems. The amounts of these payments could be significant, and may create an incentive for the financial intermediary or its employees or associated persons to recommend or sell shares of the Fund to you. Not all financial intermediaries receive such payments, and the amount of compensation may vary by intermediary. In some cases, such payments may be made by or funded from the resources of companies affiliated with Touchstone Advisors. These payments are not reflected in the fees and expenses listed in the fee table sections of the Funds' Prospectus and described above because they are not paid by the Fund.
For more information on payment arrangements, please see the section entitled “The Adviser” in the SAI.
84
BUYING AND SELLING SHARES
Choosing the Appropriate Investments to Match Your Goals. Investing well requires a plan. We recommend that you meet with your financial adviser to plan a strategy that will best meet your financial goals.
Individual Shares
Shares of the Funds are listed for trading on a national securities exchange. Shares of Dividend Select ETF (ticker: DVND), International Equity ETF (ticker: TLCI), Securitized Income ETF (ticker: TSEC) and Strategic Income ETF (ticker: SIO) are principally listed on NYSE Arca, Inc. (“NYSE Arca”), shares of Dynamic International ETF (ticker: TDI), Large Company Growth ETF (ticker:TLG) and Sands Capital US Select Growth ETF (ticker: TSEL) are listed on The Nasdaq Stock Market LLC (“Nasdaq”), and shares of Sands Capital Emerging Markets ex-China Growth ETF (ticker: TEMX), US Large Cap Focused ETF (ticker: LCF) and Ultra Short Income ETF (ticker: TUSI) are principally listed on Cboe BZX Exchange, Inc. (“Cboe BZX”). Nasdaq, NYSE Arca and Cboe BZX are referred to individually as an “Exchange” and together as the “Exchanges”.
Any amount of shares can be bought and sold throughout the trading day like shares of other publicly traded companies, and when you buy or sell a Fund’s shares in the secondary market, you will pay or receive the market price. However, there can be no guarantee that an active trading market will develop or be maintained, or that the Fund shares listing will continue or remain unchanged. Buying or selling a Fund’s shares involves certain costs that apply to all securities transactions. For example, when buying or selling shares of a Fund through a financial intermediary, you may incur a brokerage commission or other charges determined by your financial intermediary. The commission is frequently a fixed amount and may be a significant cost for investors seeking to buy or sell small amounts of shares. In addition, you may also incur the cost of the spread (the difference between the bid price (the price secondary market investors are willing to pay for shares) and the ask price (the price at which secondary market investors are willing to sell shares)). The spread varies over time for shares of a Fund based on its trading volume and market liquidity, and is generally less if a Fund has more trading volume and market liquidity and more if a Fund has less trading volume and market liquidity.
Creations and Redemptions
Shares of the Funds may only be acquired through the Distributor and redeemed directly with the Fund by or through an Authorized Participant in Creation Units or multiples thereof. “Authorized Participants” are registered clearing agents that enter into an agreement with the Distributor to transact in Creation Units. Once created, shares of the Funds normally trade in the secondary market in amounts less than a Creation Unit. See the “Purchases and Redemptions” section of the SAI for more information on Creation Units.
The Funds are open on every “Business Day,” which is any day a Fund’s respective Exchange is open. The Exchanges are open for trading Monday through Friday and are generally closed on the following holidays: New Year’s Day, Martin Luther King, Jr. Day, Presidents’ Day, Good Friday, Memorial Day, Juneteenth, Independence Day, Labor Day, Thanksgiving Day and Christmas Day. On days when an Exchange closes earlier than normal, a Fund may require orders to create or redeem Creation Units to be placed earlier in the day. See the “Purchases and Redemptions” section of the SAI.
Purchases and redemptions of Creation Units will take place in-kind and/or for cash at the discretion of the Funds. The determination of whether purchases and redemptions of Creation Units will be for cash or in-kind depends primarily on the regulatory requirements and settlement mechanisms relevant to a Fund’s portfolio holdings and a Fund is not limited to engaging in in-kind transactions to any particular market circumstances. As further described in the SAI, Creation Units typically are issued on a two Business Days (“T+1”) basis after a purchase order has been received in good order and the transfer of good title to a Fund of any in-kind securities and/or cash required to purchase a Creation Unit have been completed (subject to certain exceptions). Similarly, and also as further described in the SAI, deliveries of redemption proceeds by the Fund generally will be made on a T+1 basis after a redemption order has been received in good order and the requisite number of Fund shares have been delivered (subject to certain exceptions). The Funds reserve the right to settle Creation Unit transactions on a basis other than T+1 in order to, among other matters, accommodate non-U.S. market holiday schedules, closures and settlement cycles, to account for different treatment among non-U.S. and U.S. markets of dividend record dates and ex-dividend dates (i.e., the last day the holder of a security can sell the security and still receive dividends payable on the security) and in certain other circumstances. The Funds may delay settlement for up to 15 days from the date an order has been submitted in good order and the requisite cash and/or assets delivered to the relevant Fund to accommodate foreign holidays, as further described in the SAI, and otherwise may delay redemptions up to seven days or longer as permitted by applicable law, regulations and interpretations, such as where unusual market conditions affect the Nasdaq, NYSE Arca or Cboe BZX, as applicable, or an emergency exists which makes it impracticable for a Fund to dispose of or value securities it owns or a Fund has received an SEC exemptive order.
85
The Funds intend to comply with the U.S. federal securities laws in accepting securities for deposit and satisfying redemptions with redemption securities by, among other means, assuring that any securities accepted for deposit and any securities used to satisfy redemption requests will be sold in transactions that would be exempt from registration under the Securities Act of 1933, as amended (the “Securities Act”). Further, an Authorized Participant that is not a “qualified institutional buyer,” as such term is defined under Rule 144A of the Securities Act, will not be able to receive restricted securities eligible for resale under Rule 144A.
For more information on how to buy and sell shares of the Funds, contact Touchstone Investments at (833) 368-7383.
Share Trading Prices
The trading prices of a Fund’s shares listed on its Exchange may differ from a Fund’s daily NAV and will normally be affected by market forces, such as supply and demand, economic conditions, the market value of a Fund’s disclosed portfolio holdings and other factors. As a result, trading prices may be lower, higher or the same as a Fund’s NAV and investors may pay more than NAV when buying shares and receive less than NAV when selling shares through the Exchanges.
Book Entry
Shares of the Funds are held in book-entry form, which means that no stock certificates are issued. The Depository Trust Company (“DTC”) or its nominee is the record owner of all outstanding shares of the Funds and is recognized as the owner of all shares for all purposes.
Investors owning shares of the Funds are beneficial owners as shown on the records of DTC or its participants. DTC serves as the securities depository for shares of the Fund. DTC participants include securities brokers and dealers, banks, trust companies, clearing corporations and other institutions that directly or indirectly maintain a custodial relationship with DTC. As a beneficial owner of shares, you are not entitled to receive physical delivery of stock certificates or to have shares registered in your name, and you are not considered a registered owner of shares. Therefore, to exercise any right as an owner of shares, you must rely upon the procedures of DTC and its participants. These procedures are the same as those that apply to any other exchange-traded securities that you hold in book-entry or “street name” form.
Premium/Discount Information
The NAV of a Fund will fluctuate with changes in the market value of its portfolio holdings. The market price of a Fund will fluctuate in accordance with changes in its NAV, as well as market supply and demand.
There may be differences — premiums or discounts — between the daily market prices on secondary markets for shares of a Fund and a Fund’s NAV. NAV is the price per share at which a Fund issues and redeems its shares in transactions with APs. A Fund’s market price may be at, above or below its NAV. A premium is the amount that a Fund is trading above the reported NAV, expressed as a percentage of the NAV. A discount is the amount that a Fund is trading below the reported NAV, expressed as a percentage of the NAV. A discount or premium could be significant. Information regarding a Fund’s NAV, market price and daily premiums or discounts can be found at TouchstoneInvestments.com/ETFs.
Continuous Offering
The method by which Creation Units of Fund shares are created and traded may raise certain issues under applicable securities laws. Because new Creation Units of shares are issued and sold by a Fund on an ongoing basis, a “distribution,” as such term is used in the Securities Act, may occur at any point. Broker-dealers and other persons are cautioned that some activities on their part may, depending on the circumstances, result in their being deemed participants in a distribution in a manner which could render them statutory underwriters and subject them to the prospectus delivery requirement and liability provisions of the Securities Act.
For example, a broker-dealer firm or its client may be deemed a statutory underwriter if it takes Creation Units after placing an order with the Distributor, breaks them down into constituent shares and sells the shares directly to customers or if it chooses to couple the creation of a supply of new shares with an active selling effort involving solicitation of secondary market demand for shares. A determination of whether one is an underwriter for purposes of the Securities Act must take into account all the facts and circumstances pertaining to the activities of the broker-dealer or its client in the particular case, and the examples mentioned above should not be considered a complete description of all the activities that could lead to a characterization as an underwriter.
Broker-dealer firms should also note that dealers who are not “underwriters” but are effecting transactions in shares, whether or not participating in the distribution of shares, are generally required to deliver a prospectus. This is because the prospectus delivery exemption in Section 4(3) of the Securities Act is not available in respect of such transactions as a result of Section 24(d) of the 1940 Act. As a result, broker-dealer firms should note that dealers who are not “underwriters” but are participating in a distribution (as contrasted with engaging in ordinary secondary market transactions) and thus dealing with the shares that are part of an overallotment within the meaning of Section
86
4(3)(C) of the Securities Act, will be unable to take advantage of the prospectus delivery exemption provided by Section 4(3) of the Securities Act. For delivery of prospectuses to exchange members, the prospectus delivery mechanism of Rule 153 under the Securities Act is only available with respect to transactions on a national exchange.
Dealers effecting transactions in a Fund’s shares, whether or not participating in this distribution, are generally required to deliver a prospectus. This is in addition to any obligation of dealers to deliver a prospectus when acting as underwriters.
87
DISTRIBUTIONS AND TAXES
Each Fund intends to distribute to its shareholders substantially all of its net investment income and capital gains. The table below outlines when net investment income dividends are declared and paid by each Fund. If you own shares on a Fund’s distribution record date, you will be entitled to receive the distribution. Each Fund makes distributions of capital gains, if any, at least annually.
| Fund |
Dividends Declared |
Dividends Paid |
| Dividend Select ETF |
Quarterly |
Quarterly |
| Dynamic International ETF |
Annually |
Annually |
| International Equity ETF |
Annually |
Annually |
| Large Company Growth ETF |
Annually |
Annually |
| Sands Capital Emerging Markets ex-China Growth ETF |
Annually |
Annually |
| Sands Capital US Select Growth ETF |
Annually |
Annually |
| Securitized Income ETF |
Monthly |
Monthly |
| Strategic Income ETF |
Monthly |
Monthly |
| US Large Cap Focused ETF |
Annually |
Annually |
| Ultra Short Income ETF |
Monthly |
Monthly |
Dividend payments are made through DTC participants and indirect participants to beneficial owners then of record with proceeds received from a Fund.
No dividend reinvestment service is provided by the Trust. Financial intermediaries may make available the DTC book-entry Dividend Reinvestment Service for use by beneficial owners of Fund shares for reinvestment of their dividends and distributions. Beneficial owners should contact their financial intermediary to determine the availability and costs of the service and the details of participation therein. Financial intermediaries may require beneficial owners to adhere to specific procedures and timetables. If this service is available and used, dividends and distributions of both income and net capital gains will be automatically reinvested in additional whole shares of the Fund purchased in the secondary market.
A Fund’s dividends and other distributions are taxable to shareholders (other than retirement plans and other tax-exempt investors) whether received in cash or reinvested in additional shares of the Fund. A dividend or distribution paid by a Fund has the effect of reducing the NAV per share on the ex-dividend date by the amount of the dividend or distribution. A dividend or distribution declared shortly after a purchase of shares by an investor would, therefore, represent, in substance, a return of capital to the shareholder with respect to such shares even though it would be subject to federal income taxes.
For most shareholders, a statement will be sent to you within 45 days after the end of each year detailing the federal income tax status of your distributions. Please see “Federal Income Tax Information” below for more information on the federal income tax consequences of dividends and other distributions made by a Fund.
Federal Income Tax Information
The tax information in this prospectus is provided only for general information purposes for U.S. taxpayers and should not be considered as tax advice or relied on by a shareholder or prospective investor.
General. The Funds intend to qualify annually to be treated as a regulated investment company (“RIC”) under Subchapter M of Chapter 1, Subtitle A of the Code. As such, a Fund will not be subject to federal income taxes on the earnings they distribute to shareholders provided they satisfy certain requirements and restrictions of the Code, one of which is to distribute to a Funds shareholders substantially all of the Funds net investment income and net short-term capital gains each year. If for any taxable year a Fund fails to qualify as a RIC: (1) it will be subject to tax in the same manner as an ordinary corporation and thus will be subject to federal income tax at the corporate tax rate; and (2) distributions from its earnings and profits (as determined under federal income tax principles) will be taxable as ordinary
88
dividend income and generally eligible for the dividends-received deduction for corporate shareholders and for “qualified dividend income” treatment for non-corporate shareholders. In addition, the Fund could be required to recognize unrealized gains, pay substantial taxes and interest and make substantial distributions before requalifying for RIC treatment.
Taxes on Creations and Redemptions of Creation Units. A person who purchases a Creation Unit by exchanging securities in-kind generally will recognize a gain or loss equal to the difference between (i) the sum of the market value of the Creation Units at the time of the exchange and any net amount of cash received by the Authorized Participant in the exchange and (ii) the sum of the purchaser’s aggregate basis in the securities surrendered and any net amount of cash paid for the Creation Units. A person who redeems Creation Units and receives securities in-kind from a Fund will generally recognize a gain or loss equal to the difference between the redeemer’s basis in the Creation Units, and the aggregate market value of the securities received and any net cash received. The IRS, however, may assert that a loss realized upon an in-kind exchange of securities for Creation Units or an exchange of Creation Units for securities cannot be deducted currently under the rules governing “wash sales,” or on the basis that there has been no significant change in economic position. Persons effecting in-kind creations or redemptions should consult their own tax adviser with respect to these matters. The Funds have the right to reject an order for Creation Units if the purchaser (or a group of purchasers) would, upon obtaining the Fund shares so ordered, own 80% or more of the outstanding shares of a Fund and if, pursuant to section 351 of the Code, a Fund would have a basis in the deposit securities different from the market value of such securities on the date of deposit. The Funds also have the right to require information necessary to determine beneficial share ownership for purposes of the 80% determinations.
Distributions. Your Fund will make distributions to you that may be taxed as ordinary income or capital gains. The dividends and distributions you receive may be subject to federal, foreign, state and local taxation, depending upon your tax situation. Distributions, other than exempt-interest dividends, are taxable whether you reinvest such distributions in additional shares of the Fund or choose to receive cash. Taxable Fund distributions are taxable to a shareholder even if the distributions are paid from income or gains earned by a Fund prior to the shareholder’s investment and, thus, were included in the price the shareholder paid for the shares. For example, a shareholder who purchases shares on or just before the record date of a Fund distribution will pay full price for the shares and may receive a portion of the investment back as a taxable distribution. Distributions declared by a Fund during October, November or December to shareholders of record during such month and paid by January 31 of the following year are treated for federal income tax purposes as if received by shareholders and paid by the Fund on December 31 of the year in which the distribution was declared.
Ordinary Income. Net investment income, except for qualified dividend income and income designated as tax-exempt, and short-term capital gains that are distributed to you are taxable as ordinary income for federal income tax purposes regardless of how long you have held your Fund shares. Certain dividends distributed to non-corporate shareholders and designated by a Fund as “qualified dividend income” are eligible for the long-term capital gains rate, provided certain holding period and other requirements are satisfied.
Net Capital Gains. Net capital gains (i.e., the excess of net long-term capital gains over net short-term capital losses) distributed to you, if any, are taxable as long-term capital gains for federal income tax purposes regardless of how long you have held your Fund shares.
Returns of Capital. If a Fund makes a distribution in excess of its current and accumulated earnings and profits, the excess will be treated as a return of capital to the extent of a shareholder’s basis in his or her shares, and thereafter as capital gain. A return of capital is not taxable, but it reduces a shareholder’s basis in his or her shares, thus reducing any loss or increasing any gain on a subsequent taxable disposition by the shareholder of such shares.
Backup Withholding. A Fund (or a financial intermediary, such as a broker, through which a shareholder holds Fund shares) may be required to withhold U.S. federal income tax on all distributions and sales proceeds payable to shareholders who fail to provide their correct taxpayer identification number or to make required certifications, or who have been notified by the Internal Revenue Service (the “IRS”) that they are subject to backup withholding.
Medicare Tax. An additional 3.8% Medicare tax is imposed on certain net investment income (including dividends and distributions received from a Fund, other than exempt-interest dividends, and net gains from redemptions or other taxable dispositions of Fund shares) of U.S. individuals, estates and trusts to the extent that such person’s “modified adjusted gross income” (in the case of an individual) or “adjusted gross income” (in the case of an estate or trust) exceeds a threshold amount.
Foreign Taxation. Income received by a Fund or underlying fund from sources within foreign countries may be subject to foreign withholding and other taxes. Tax conventions between certain countries and the United States may reduce or eliminate such taxes. If more than 50% of a Fund’s total assets at the close of any taxable year consist of stock or securities of foreign corporations, or if a Fund is a qualified fund-of-funds (i.e., a RIC that invests at least 50% of its total assets in other RICs at the close of each quarter of its taxable year), and the Fund meets the distribution requirements described above, such Fund may file an election (the “pass-through election”) with the IRS pursuant to which shareholders of the Fund would be required to (i) include in gross income (in addition to taxable dividends actually received) their pro rata shares of foreign income taxes paid by the Fund, or in the case of a qualified fund of funds, such taxes paid by an underlying fund that has made the pass-through election, even though not actually received by such shareholders; and (ii) treat such respective pro rata portions as foreign income taxes paid by them. Each Fund making a pass-through election will furnish its shareholders with a written statement providing the amount of foreign taxes paid by the Fund that will “pass-through” for the year, if any.
89
Generally, a credit for foreign taxes is subject to the limitation that it may not exceed the shareholder’s U.S. tax attributable to his or her total foreign source taxable income. For this purpose, if the pass-through election is made, the source of a Fund’s income will flow through to shareholders. The limitation on the foreign tax credit is applied separately to foreign source passive income, and to certain other types of income. Shareholders may be unable to claim a credit for the full amount of their proportionate share of the foreign taxes paid by a Fund. Various limitations, including a minimum holding period requirement, apply to limit the credit and deduction for foreign taxes for purposes of regular federal income tax and alternative minimum tax.
Non-U.S. Shareholders. Non-U.S. shareholders may be subject to U.S. tax as a result of an investment in a Fund. This prospectus does not discuss the U.S. or foreign tax consequences of an investment by a non-U.S. shareholder in a Fund. Accordingly, non-U.S. shareholders are advised to consult their own tax advisers as to the U.S. and foreign tax consequences of an investment in a Fund.
Statements and Notices. You will receive an annual statement outlining the tax status of your distributions. You may also receive written notices of certain foreign taxes paid by a Fund during the prior taxable year.
Important Tax Reporting Considerations. The Funds or brokers are required to report cost basis and holding period information to both the IRS and shareholders for gross proceeds from the sales of Fund shares purchased on or after January 1, 2012 (“covered shares”). This information is reported on Form 1099-B. Please consult your tax adviser for additional information regarding cost basis reporting and your situation.
This section is only a summary of some important federal income tax considerations that may affect your investment in a Fund. More information regarding these considerations is included in the Funds' SAI. You are urged and advised to consult your own tax adviser regarding the effects of an investment in a Fund on your tax situation, including the application of foreign, state, local and other tax laws to your particular situation.
90
FINANCIAL HIGHLIGHTS
The financial highlights tables are intended to help you understand each Fund’s financial performance for the past five years, or if shorter, the period of each Fund's operations. Certain information reflects financial results for a single Fund share. The total returns in the tables represent the rate an investor would have earned (or lost) on an investment in a Fund, assuming reinvestment of all dividends and distributions. The financial highlights for each Fund, except as noted below, were audited by Ernst & Young LLP, an independent registered public accounting firm, whose report, along with each Fund’s financial statements and related notes, are included in the Funds’ December 31, 2025 Form N-CSR. The Large Company Growth ETF is newly formed, commenced operations March 13, 2026, and has adopted the performance history of Institutional Class shares of its predecessor fund, the Large Company Growth Fund, which operated as a mutual fund. All figures have been derived from the Large Company Growth Fund's financial statements, audited by Ernst & Young LLP, the Large Company Growth Fund's independent registered public accounting firm. Their report, along with full financial statements, appears in the Large Company Growth Fund’s June 30, 2025 Form N-CSR.
You can obtain a Fund's most recent annual report, semi-annual report or Form N-CSR at no charge by calling 1.800.543.0407 or by downloading a copy from the Touchstone Investments website at: TouchstoneInvestments.com/Resources. The Form N-CSR has been incorporated by reference into the SAI.
91
| Touchstone Dividend Select ETF | |||||||||||||
| Period ended |
Net asset value at beginning of period |
Net investment income |
Net realized and unrealized gains (losses) on investments |
Total from investment operations |
Distributions from net investment income |
Total distributions |
Net asset value at end of period |
Total return based on NAV |
Net assets at end of period (000's) |
Ratio of net expenses to average net assets |
Ratio of gross expenses to average net assets |
Ratio of net investment income (loss) to average net assets |
Portfolio turnover rate |
| 12/31/22(1) |
$25.00 |
$0.18 |
$0.31 |
$0.49 |
$(0.18 ) |
$(0.18 ) |
$25.31 |
1.94 % (2) |
$26,570 |
0.67 % (3) |
1.41 % (3) |
2.11 %(3) |
28 % (2)(4) |
| 12/31/23 |
25.31 |
0.58 |
2.91 |
3.49 |
(0.58 ) |
(0.58 ) |
28.22 |
14.01 |
31,040 |
0.67 |
1.21 |
2.22 |
16 (4) |
| 12/31/24 |
28.22 |
0.64 |
2.62 |
3.26 |
(0.64 ) |
(0.64 ) |
30.84 |
11.59 |
33,929 |
0.64 |
1.16 |
2.11 |
13 (4) |
| 12/31/25 |
30.84 |
0.69 |
4.29 |
4.98 |
(0.68 ) |
(0.68 ) |
35.14 |
16.27 |
37,775 |
0.49 |
1.14 |
2.09 |
17 (4) |
| |
|
|
|
|
|
|
|
|
|
|
|
|
|
| | |
| (1) |
Represents the period from commencement of operations (August 2, 2022) through December 31, 2022. |
| (2) |
Not annualized. |
| (3) |
Annualized. |
| (4) |
Portfolio turnover excludes securities delivered from processing redemptions-in-kind and received from processing subscriptions-in-kind. |
92
| Touchstone Dynamic International ETF | ||||||||||||||
| Period ended |
Net asset value at beginning of period |
Net investment income |
Net realized and unrealized gains (losses) on investments |
Total from investment operations |
Distributions from net investment income |
Distributions from realized capital gains |
Total distributions |
Net asset value at end of period |
Total return based on NAV |
Net assets at end of period (000's) |
Ratio of net expenses to average net assets |
Ratio of gross expenses to average net assets |
Ratio of net investment income (loss) to average net assets |
Portfolio turnover rate |
| 12/31/21(1) |
$29.55 |
$0.46 |
$1.14 |
$1.60 |
$(0.82 ) |
$ (0.93 ) |
$(1.75 ) |
$29.40 |
5.39 % |
$5,061 |
0.24 % |
0.87 % |
1.51 % |
20 % |
| 12/31/22(1) |
29.40 |
0.44 |
(5.23 ) |
(4.79 ) |
(0.71 ) |
(0.62 ) |
(1.33 ) |
23.28 |
(16.34 ) |
2,987 |
0.24 |
0.99 |
1.75 |
60 |
| 12/31/23(1)(2) |
23.28 |
0.31 |
3.65 |
3.96 |
(0.40 ) |
— |
(0.40 ) |
26.84 |
17.21 |
53,272 |
0.40 |
1.50 |
2.06 |
125 |
| 12/31/24 |
26.84 |
0.65 (3) |
1.13 |
1.78 |
(0.93 ) |
— |
(0.93 ) |
27.69 |
6.60 |
49,429 |
0.65 |
1.19 |
2.25 |
77 (4) |
| 12/31/25 |
27.69 |
0.73 (3) |
11.02 |
11.75 |
(0.75 ) |
— |
(0.75 ) |
38.69 |
42.43 |
74,858 |
0.65 |
1.04 |
2.16 |
67 (4) |
| |
|
|
|
|
|
|
|
|
|
|
|
|
|
|
| | |
| (1) |
On December 1, 2023, the Predecessor Fund effected a 0.4524:1 reverse share split. All per share data has been adjusted to reflect the reverse share split. |
| (2) |
Effective December 8, 2023, Class Y shares of the Dynamic Allocation Fund were reorganized into shares of the Fund. |
| (3) |
The net investment income (loss) per share was based on average shares outstanding for the period. |
| (4) |
Portfolio turnover excludes securities delivered from processing redemptions-in-kind and received from processing subscriptions-in-kind. |
93
| Touchstone International Equity ETF | |||||||||||||
| Period ended |
Net asset value at beginning of period |
Net investment income |
Net realized and unrealized gains (losses) on investments |
Total from investment operations |
Distributions from net investment income |
Total distributions |
Net asset value at end of period |
Total return based on NAV |
Net assets at end of period (000's) |
Ratio of net expenses to average net assets |
Ratio of gross expenses to average net assets |
Ratio of net investment income (loss) to average net assets |
Portfolio turnover rate |
| 12/31/25(1) |
$25.00 |
$0.29 (2) |
$0.96 |
$1.25 |
$(0.16 ) |
$(0.16 ) |
$26.09 |
4.98 % (3) |
$103,050 |
0.37 % (4) |
1.01 % (4) |
1.33 %(4) |
13 % (3)(5) |
| |
|
|
|
|
|
|
|
|
|
|
|
|
|
| | |
| (1) |
Represents the period from commencement of operations (March 3, 2025) through December 31, 2025. |
| (2) |
The net investment income (loss) per share was based on average shares outstanding for the period. |
| (3) |
Not annualized. |
| (4) |
Annualized. |
| (5) |
Portfolio turnover excludes securities delivered from processing redemptions-in-kind and received from processing subscriptions-in-kind. |
94
| Touchstone Large Company Growth Fund | |||||||||||||
| Period ended |
Net asset value at beginning of period |
Net investment loss |
Net realized and unrealized gains (losses) on investments |
Total from investment operations |
Distributions from realized capital gains |
Total distributions |
Net asset value at end of period |
Total return(1) |
Net assets at end of period (000's) |
Ratio of net expenses to average net assets(2) |
Ratio of gross expenses to average net assets(2) |
Ratio of net investment income (loss) to average net assets |
Portfolio turnover rate |
| Class A | |||||||||||||
| 06/30/21 |
$47.46 |
$(0.15 ) |
$16.56 |
$16.41 |
$ (6.61 ) |
$(6.61 ) |
$57.26 |
37.33 % |
$3,617 |
1.06 % |
1.59 % |
(0.71 )% |
36 % (3) |
| 06/30/22 |
57.26 |
(0.18 ) |
(10.40 ) |
(10.58 ) |
(10.52 ) |
(10.52 ) |
36.16 |
(23.29 ) |
3,290 |
1.07 |
1.58 |
(0.61 ) |
41 (3) |
| 06/30/23 |
36.16 |
(0.17 )(4) |
6.10 |
5.93 |
(1.23 ) |
(1.23 ) |
40.86 |
16.89 |
3,711 |
1.08 |
1.57 |
(0.46 ) |
44 (3) |
| 06/30/24 |
40.86 |
(0.30 )(4) |
16.72 |
16.42 |
(1.92 ) |
(1.92 ) |
55.36 |
41.47 |
5,337 |
1.07 |
1.53 |
(0.65 ) |
39 (3) |
| 06/30/25 |
55.36 |
(0.38 )(4) |
9.04 |
8.66 |
(1.61 ) |
(1.61 ) |
62.41 |
15.86 |
6,389 |
1.05 |
1.40 |
(0.68 ) |
30 (3) |
| Class C | |||||||||||||
| 06/30/21 |
$45.93 |
$(1.42 ) |
$16.81 |
$15.39 |
$ (6.61 ) |
$(6.61 ) |
$54.71 |
36.28 % |
$473 |
1.81 % |
3.39 % |
(1.46 )% |
36 % (3) |
| 06/30/22 |
54.71 |
(1.24 ) |
(9.03 ) |
(10.27 ) |
(10.52 ) |
(10.52 ) |
33.92 |
(23.87 ) |
206 |
1.82 |
4.24 |
(1.36 ) |
41 (3) |
| 06/30/23 |
33.92 |
(0.42 )(4) |
5.68 |
5.26 |
(1.23 ) |
(1.23 ) |
37.95 |
16.01 |
223 |
1.83 |
5.86 |
(1.21 ) |
44 (3) |
| 06/30/24 |
37.95 |
(0.58 )(4) |
15.41 |
14.83 |
(1.92 ) |
(1.92 ) |
50.86 |
40.43 |
216 |
1.82 |
6.43 |
(1.40 ) |
39 (3) |
| 06/30/25 |
50.86 |
(0.73 )(4) |
8.23 |
7.50 |
(1.61 ) |
(1.61 ) |
56.75 |
14.97 |
180 |
1.80 |
7.83 |
(1.43 ) |
30 (3) |
| Class Y | |||||||||||||
| 06/30/21 |
$47.97 |
$(0.26 ) |
$17.00 |
$16.74 |
$ (6.61 ) |
$(6.61 ) |
$58.10 |
37.64 % |
$28,952 |
0.81 % |
0.96 % |
(0.46 )% |
36 % (3) |
| 06/30/22 |
58.10 |
(0.18 ) |
(10.49 ) |
(10.67 ) |
(10.52 ) |
(10.52 ) |
36.91 |
(23.09 ) |
13,917 |
0.82 |
0.97 |
(0.36 ) |
41 (3) |
| 06/30/23 |
36.91 |
(0.08 )(4) |
6.24 |
6.16 |
(1.23 ) |
(1.23 ) |
41.84 |
17.17 |
7,266 |
0.83 |
1.07 |
(0.21 ) |
44 (3) |
| 06/30/24 |
41.84 |
(0.19 )(4) |
17.17 |
16.98 |
(1.92 ) |
(1.92 ) |
56.90 |
41.85 |
10,199 |
0.82 |
1.08 |
(0.40 ) |
39 (3) |
| 06/30/25 |
56.90 |
(0.25 )(4) |
9.31 |
9.06 |
(1.61 ) |
(1.61 ) |
64.35 |
16.15 |
10,726 |
0.80 |
1.01 |
(0.43 ) |
30 (3) |
| Institutional Class | |||||||||||||
| 06/30/21 |
$48.18 |
$(0.21 ) |
$17.10 |
$16.89 |
$ (6.61 ) |
$(6.61 ) |
$58.46 |
37.80 % |
$229,690 |
0.71 % |
0.85 % |
(0.36 )% |
36 % (3) |
| 06/30/22 |
58.46 |
(0.14 ) |
(10.58 ) |
(10.72 ) |
(10.52 ) |
(10.52 ) |
37.22 |
(23.03 ) |
145,441 |
0.72 |
0.84 |
(0.26 ) |
41 (3) |
| 06/30/23 |
37.22 |
(0.04 )(4) |
6.30 |
6.26 |
(1.23 ) |
(1.23 ) |
42.25 |
17.30 |
135,324 |
0.73 |
0.88 |
(0.11 ) |
44 (3) |
| 06/30/24 |
42.25 |
(0.14 )(4) |
17.35 |
17.21 |
(1.92 ) |
(1.92 ) |
57.54 |
41.99 |
137,363 |
0.72 |
0.89 |
(0.30 ) |
39 (3) |
| 06/30/25 |
57.54 |
(0.19 )(4) |
9.42 |
9.23 |
(1.61 ) |
(1.61 ) |
65.16 |
16.26 |
152,364 |
0.70 |
0.86 |
(0.33 ) |
30 (3) |
| |
|
|
|
|
|
|
|
|
|
|
|
|
|
| | |
| (1) |
Total returns shown exclude the effect of applicable sales loads and fees. If these charges were included, the returns would be lower. |
| (2) |
The ratio of net and gross expenses to average net assets excluding liquidity provider expenses would have been lower by 0.01%, 0.03%, 0.04%, 0.03% and 0.02% for the years ended June 30, 2025, 2024, 2023, 2022 and 2021, respectively. |
| (3) |
Portfolio turnover excludes securities delivered from processing redemptions-in-kind. |
| (4) |
The net investment income (loss) per share was based on average shares outstanding for the period. |
95
| Touchstone Sands Capital Emerging Markets ex-China Growth ETF | |||||||||||||
| Period ended |
Net asset value at beginning of period |
Net investment income |
Net realized and unrealized gains (losses) on investments |
Total from investment operations |
Distributions from net investment income |
Total distributions |
Net asset value at end of period |
Total return based on NAV |
Net assets at end of period (000's) |
Ratio of net expenses to average net assets |
Ratio of gross expenses to average net assets |
Ratio of net investment income (loss) to average net assets |
Portfolio turnover rate |
| 12/31/25(1) |
$25.00 |
$0.10 |
$4.86 |
$4.96 |
$(0.32 ) |
$(0.32 ) |
$29.64 |
19.85 % (2) |
$8,891 |
0.79 % (3) |
2.71 % (3) |
0.46 %(3) |
26 % (2)(4) |
| |
|
|
|
|
|
|
|
|
|
|
|
|
|
| | |
| (1) |
Represents the period from commencement of operations (February 24, 2025) through December 31, 2025. |
| (2) |
Not annualized. |
| (3) |
Annualized. |
| (4) |
Portfolio turnover excludes securities delivered from processing redemptions-in-kind and received from processing subscriptions-in-kind. |
96
| Touchstone Sands Capital US Select Growth ETF | |||||||||||
| Period ended |
Net asset value at beginning of period |
Net investment loss |
Net realized and unrealized gains (losses) on investments |
Total from investment operations |
Net asset value at end of period |
Total return based on NAV |
Net assets at end of period (000's) |
Ratio of net expenses to average net assets |
Ratio of gross expenses to average net assets |
Ratio of net investment income (loss) to average net assets |
Portfolio turnover rate |
| 12/31/25(1) |
$25.00 |
$(0.06 ) |
$3.39 |
$3.33 |
$28.33 |
13.32 % (2) |
$109,090 |
0.67 % (3) |
0.96 % (3) |
(0.33 )(3)% |
109 % (2)(4) |
| |
|
|
|
|
|
|
|
|
|
|
|
| | |
| (1) |
Represents the period from commencement of operations (January 2, 2025) through December 31, 2025. |
| (2) |
Not annualized. |
| (3) |
Annualized. |
| (4) |
Portfolio turnover excludes securities delivered from processing redemptions-in-kind and received from processing subscriptions-in-kind. |
97
| Touchstone Securitized Income ETF | ||||||||||||||
| Period ended |
Net asset value at beginning of period |
Net investment income |
Net realized and unrealized gains (losses) on investments |
Total from investment operations |
Distributions from net investment income |
Distributions from realized capital gains |
Total distributions |
Net asset value at end of period |
Total return based on NAV |
Net assets at end of period (000's) |
Ratio of net expenses to average net assets |
Ratio of gross expenses to average net assets |
Ratio of net investment income (loss) to average net assets |
Portfolio turnover rate |
| 12/31/23(1) |
$25.00 |
$0.73 |
$0.58 |
$1.31 |
$(0.73 ) |
$ — |
$(0.73 ) |
$25.58 |
5.37 % (2) |
$24,303 |
0.39 % (3) |
1.27 % (3) |
6.45 %(3) |
11 % (2) |
| 12/31/24 |
25.58 |
1.53 (4) |
0.31 |
1.84 |
(1.46 ) |
(0.05 ) |
(1.51 ) |
25.91 |
7.33 |
108,807 |
0.39 |
0.71 |
5.89 |
36 |
| 12/31/25 |
25.91 |
1.65 (4) |
0.24 |
1.89 |
(1.63 ) |
(0.06 ) |
(1.69 ) |
26.11 |
7.49 |
122,706 |
0.39 |
0.68 |
6.30 |
45 |
| |
|
|
|
|
|
|
|
|
|
|
|
|
|
|
| | |
| (1) |
Represents the period from commencement of operations (July 17, 2023) through December 31, 2023. |
| (2) |
Not annualized. |
| (3) |
Annualized. |
| (4) |
The net investment income (loss) per share was based on average shares outstanding for the period. |
98
| Touchstone Strategic Income ETF | ||||||||||||||
| Period ended |
Net asset value at beginning of period |
Net investment income |
Net realized and unrealized gains (losses) on investments |
Total from investment operations |
Distributions from net investment income |
Distributions from realized capital gains |
Total distributions |
Net asset value at end of period |
Total return based on NAV |
Net assets at end of period (000's) |
Ratio of net expenses to average net assets |
Ratio of gross expenses to average net assets |
Ratio of net investment income (loss) to average net assets |
Portfolio turnover rate |
| 12/31/22(1) |
$25.00 |
$0.48 |
$(0.50 ) |
$(0.02 ) |
$(0.49 ) |
$ — |
$(0.49 ) |
$24.49 |
(0.03 )% (2) |
$99,200 |
0.65 % (3) |
0.89 % (3) |
4.51 %(3) |
47 % (2) |
| 12/31/23 |
24.49 |
1.30 |
0.64 |
1.94 |
(1.27 ) |
— |
(1.27 ) |
25.16 |
8.14 |
102,522 |
0.65 |
0.87 |
5.27 |
120 |
| 12/31/24 |
25.16 |
1.25 (4) |
0.25 |
1.50 |
(1.20 ) |
(0.15 ) |
(1.35 ) |
25.31 |
6.09 |
174,668 |
0.61 |
0.87 |
4.91 |
107 |
| 12/31/25 |
25.31 |
1.35 (4) |
0.97 |
2.32 |
(1.32 ) |
(0.44 ) |
(1.76 ) |
25.87 |
9.34 |
228,929 |
0.49 |
0.81 |
5.22 |
208 |
| |
|
|
|
|
|
|
|
|
|
|
|
|
|
|
| | |
| (1) |
Represents the period from commencement of operations (July 21, 2022) through December 31, 2022. |
| (2) |
Not annualized. |
| (3) |
Annualized. |
| (4) |
The net investment income (loss) per share was based on average shares outstanding for the period. |
99
| Touchstone Ultra Short Income ETF | ||||||||||||||
| Period ended |
Net asset value at beginning of period |
Net investment income |
Net realized and unrealized gains (losses) on investments |
Total from investment operations |
Distributions from net investment income |
Distributions from realized capital gains |
Total distributions |
Net asset value at end of period |
Total return based on NAV |
Net assets at end of period (000's) |
Ratio of net expenses to average net assets |
Ratio of gross expenses to average net assets |
Ratio of net investment income (loss) to average net assets |
Portfolio turnover rate |
| 12/31/22(1) |
$25.00 |
$0.35 |
$(0.14 ) |
$0.21 |
$(0.34 ) |
$ — |
$(0.34 ) |
$24.87 |
0.87 % (2) |
$51,080 |
0.34 % (3) |
0.75 % (3) |
3.65 %(3) |
16 % (2) |
| 12/31/23 |
24.87 |
1.31 |
0.26 |
1.57 |
(1.36 ) |
— |
(1.36 ) |
25.08 |
6.47 |
60,297 |
0.31 |
0.66 |
5.28 |
87 |
| 12/31/24 |
25.08 |
1.37 (4) |
0.22 |
1.59 |
(1.34 ) |
(0.05 ) |
(1.39 ) |
25.28 |
6.50 |
99,961 |
0.25 |
0.52 |
5.41 |
85 |
| 12/31/25 |
25.28 |
1.27 (4) |
(0.01 ) |
1.26 |
(1.22 ) |
(0.01 ) |
(1.23 ) |
25.31 |
5.09 |
297,546 |
0.25 |
0.43 |
5.02 |
101 |
| |
|
|
|
|
|
|
|
|
|
|
|
|
|
|
| | |
| (1) |
Represents the period from commencement of operations (August 4, 2022) through December 31, 2022. |
| (2) |
Not annualized. |
| (3) |
Annualized. |
| (4) |
The net investment income (loss) per share was based on average shares outstanding for the period. |
100
| Touchstone US Large Cap Focused ETF | |||||||||||||
| Period ended |
Net asset value at beginning of period |
Net investment income |
Net realized and unrealized gains (losses) on investments |
Total from investment operations |
Distributions from net investment income |
Total distributions |
Net asset value at end of period |
Total return based on NAV |
Net assets at end of period (000's) |
Ratio of net expenses to average net assets |
Ratio of gross expenses to average net assets |
Ratio of net investment income (loss) to average net assets |
Portfolio turnover rate |
| 12/31/22(1) |
$25.00 |
$0.06 |
$(0.86 ) |
$(0.80 ) |
$(0.06 ) |
$(0.06 ) |
$24.14 |
(3.25 )% (2) |
$24,739 |
0.69 % (3) |
1.54 % (3) |
0.66 %(3) |
3 % (2)(4) |
| 12/31/23 |
24.14 |
0.21 |
6.09 |
6.30 |
(0.21 ) |
(0.21 ) |
30.23 |
26.17 |
31,742 |
0.69 |
1.23 |
0.79 |
3 (4) |
| 12/31/24 |
30.23 |
0.23 |
6.06 |
6.29 |
(0.23 ) |
(0.23 ) |
36.29 |
20.80 |
39,917 |
0.66 |
1.28 |
0.69 |
7 (4) |
| 12/31/25 |
36.29 |
0.23 |
5.94 |
6.17 |
(0.23 ) |
(0.23 ) |
42.23 |
17.00 |
54,897 |
0.55 |
1.17 |
0.62 |
8 (4) |
| |
|
|
|
|
|
|
|
|
|
|
|
|
|
| | |
| (1) |
Represents the period from commencement of operations (July 27, 2022) through December 31, 2022. |
| (2) |
Not annualized. |
| (3) |
Annualized. |
| (4) |
Portfolio turnover excludes securities delivered from processing redemptions-in-kind and received from processing subscriptions-in-kind. |
101
TOUCHSTONE INVESTMENTS*
INVESTMENT ADVISER
Touchstone Advisors, Inc.*
303 Broadway, Suite 1100
Cincinnati, Ohio 45202-4203
Touchstone Advisors, Inc.*
303 Broadway, Suite 1100
Cincinnati, Ohio 45202-4203
DISTRIBUTOR
Foreside Fund Services, LLC
Three Canal Plaza, Suite 100
Portland, Maine 04101
Foreside Fund Services, LLC
Three Canal Plaza, Suite 100
Portland, Maine 04101
TRANSFER AGENT
The Bank of New York Mellon
240 Greenwich St.
New York, NY 10286
The Bank of New York Mellon
240 Greenwich St.
New York, NY 10286
*
A Member of Western & Southern Financial Group
The following are federal trademark registrations and applications owned by either IFS Financial Services, Inc. or Touchstone Advisors, Inc., each a member of Western & Southern Financial Group: Touchstone, Touchstone Funds, Touchstone Investments, the Touchstone Family of Funds, and Distinctively Active.
102

303 Broadway, Suite 1100
Cincinnati, Ohio 45202-4203
Cincinnati, Ohio 45202-4203
For investors who want more information about the Funds, the following documents are available free upon request:
Statement of Additional Information (“SAI”): The SAI provides more detailed information about the Funds and is incorporated herein by reference, which means it is legally a part of this prospectus.
Annual/Semiannual Reports and Form N-CSR (“Financial Reports”): Additional information about a Fund's investments is available in the Fund's Financial Reports to shareholders. In a Fund's annual report, you will find a discussion of the market conditions and investment strategies that significantly affected the Fund's performance during its last fiscal year. In Form N-CSR, you will find the Fund's annual and semiannual financial statements.
You can get free copies of the current SAI, Financial Reports, other information such as Fund financial statements that the Fund files on Form N-CSR, and answers to your questions about the Funds by contacting your financial adviser, or by contacting Touchstone Investments at 1.800.543.0407. The SAI and Financial Reports are also available without charge on the Touchstone Investments' website at: www.TouchstoneInvestments.com/Resources.
The current SAI, Financial Reports, other information such as Fund financial statements that the Fund files on Form N-CSR, and other information about the Funds are available on the EDGAR database of the SEC’s Internet site at http://www.sec.gov. You may obtain copies of these documents and other information, after paying a duplicating fee, by sending an e-mail request to: publicinfo@sec.gov.
Investment Company Act File No. 811-23789
ETF-ETF-STATPRO-2604
103