Exhibit 99.1
| LANVIN GROUP 2025 FULL - YEAR RESULTS April 30, 2026 |
| 2 Forward-Looking Statements This presentation, including the sections “2026 GUIDANCE”, “BRAND-LEVEL PERFORMANCE” and “APPENDIX”, contain “forward-looking statements” within the meaning of the “safe harbor” provisions of the Private Securities Litigation Reform Act of 1995. Forward-looking statements generally are accompanied by words such as “believe,” “may,” “will,” “estimate,” “continue,” “anticipate,” “intend,” “expect,” “should,” “would,” “plan,” “predict,” “potential,” “seem,” “seek,” “future,” “outlook,” “project” and similar expressions that predict or indicate future events or trends or that are not statements of historical matters. These forward-looking statements include, but are not limited to, statements regarding estimates and forecasts of other financial and performance metrics and projections of market opportunity. These statements are based on various assumptions, whether or not identified in this presentation, and on the current expectations of the respective management of Lanvin Group and are not predictions of actual performance. These forward-looking statements are provided for illustrative purposes only and must not be relied on by an investor as, a guarantee, an assurance, a prediction or a definitive statement of fact or probability. Actual events and circumstances are difficult or impossible to predict and will differ from assumptions. Many actual events and circumstances are beyond the control of Lanvin Group. Potential risks and uncertainties that could cause the actual results to differ materially from those expressed or implied by forward-looking statements include, but are not limited to, changes adversely affecting the business in which Lanvin Group is engaged; Lanvin Group’s projected financial information, anticipated growth rate, profitability and market opportunity may not be an indication of its actual results or future results; management of growth; the impact of health epidemics, pandemics and similar outbreaks, including the COVID-19 pandemic on Lanvin Group’s business; Lanvin Group’s ability to safeguard the value, recognition and reputation of its brands and to identify and respond to new and changing customer preferences; the ability and desire of consumers to shop; Lanvin Group’s ability to successfully implement its business strategies and plans; Lanvin Group’s ability to effectively manage its advertising and marketing expenses and achieve desired impact; its ability to accurately forecast consumer demand; high levels of competition in the personal luxury products market; disruptions to Lanvin Group’s distribution facilities or its distribution partners; Lanvin Group’s ability to negotiate, maintain or renew its license agreements; Lanvin Group’s ability to protect its intellectual property rights; Lanvin Group’s ability to attract and retain qualified employees and preserve craftsmanship skills; Lanvin Group’s ability to develop and maintain effective internal controls; general economic conditions; the result of future financing efforts; and those factors discussed in the reports filed by Lanvin Group from time to time with the SEC. If any of these risks materialize or Lanvin Group’s assumptions prove incorrect, actual results could differ materially from the results implied by these forward-looking statements. There may be additional risks that Lanvin Group presently does not know, or that Lanvin Group currently believes are immaterial, that could also cause actual results to differ from those contained in the forward-looking statements. In addition, forward-looking statements reflect Lanvin Group’s expectations, plans, or forecasts of future events and views as of the date of this presentation. Lanvin Group anticipates that subsequent events and developments will cause Lanvin Group’s assessments to change. However, while Lanvin Group may elect to update these forward-looking statements at some point in the future, Lanvin Group specifically disclaim any obligation to do so. These forward-looking statements should not be relied upon as representing Lanvin Group’s assessments of any date subsequent to the date of this presentation. Accordingly, reliance should not be placed upon the forward-looking statements. Use of Non-IFRS Financial Metrics This presentation includes certain non-IFRS financial measures (including on a forward-looking basis) such as contribution profit, contribution profit margin, adjusted earnings before interest and taxes (“Adjusted EBIT”), and adjusted earnings before interest, taxes, depreciation and amortization (“Adjusted EBITDA”) and trade working capital. These non-IFRS measures are an addition, and not a substitute for or superior to measures of financial performance prepared in accordance with IFRS and should not be considered as an alternative to net income, operating income or any other performance measures derived in accordance with IFRS. Reconciliations of non-IFRS measures to their most directly comparable IFRS counterparts are included in the Appendix to this presentation. Lanvin Group believes that these non- IFRS measures of financial results (including on a forward-looking basis) provide useful supplemental information to investors about Lanvin Group. Lanvin Group's management uses forward looking non-IFRS measures to evaluate Lanvin Group's projected financial and operating performance. Lanvin Group believes that the use of these non-IFRS financial measures provides an additional tool for investors to use in evaluating projected operating results and trends in and in comparing Lanvin Group's financial measures with other similar companies, many of which present similar non-IFRS financial measures to investors. However, there are a number of limitations related to the use of these non-IFRS measures and their nearest IFRS equivalents. For example, other companies may calculate non-IFRS measures differently, or may use other measures to calculate their financial performance, and therefore Lanvin Group's non-IFRS measures may not be directly comparable to similarly titled measures of other companies. Lanvin Group does not consider these non-IFRS measures in isolation or as an alternative to financial measures determined in accordance with IFRS. The principal limitation of these non-IFRS financial measures is that they exclude significant expenses, income and tax liabilities that are required by IFRS to be recorded in Lanvin Group's financial statements. In addition, they are subject to inherent limitations as they reflect the exercise of judgements by Lanvin Group about which expense and income are excluded or included in determining these non-IFRS financial measures. In order to compensate for these limitations, Lanvin Group presents non-IFRS financial measures in connection with IFRS results. DISCLAIMER |
| BUILDING THE NEW LUXURY Lanvin Group is a leading global luxury fashion group headquartered in Shanghai, China and Milan, Italy, managing iconic brands worldwide, including Lanvin, Wolford, Sergio Rossi and St. John Knits. Harnessing the power of its unique strategic alliance of industry-leading partners in the luxury fashion sector, Lanvin Group strives to expand the global footprint of its portfolio brands and achieve sustainable growth through strategic investment and extensive operational know-how, combined with an understanding and access to the fastest-growing luxury fashion markets in the world. |

| 4 TABLE OF CONTENTS PAGE 9 A UNIQUE GLOBAL LUXURY PLATFORM PAGE 19 GROUP CONSOLIDATED FINANCIAL RESULTS BRAND - LEVEL PERFORMANCE PAGE 13 2025 KEY STRATEGIES AND ACHIEVEMENTS PAGE 27 |

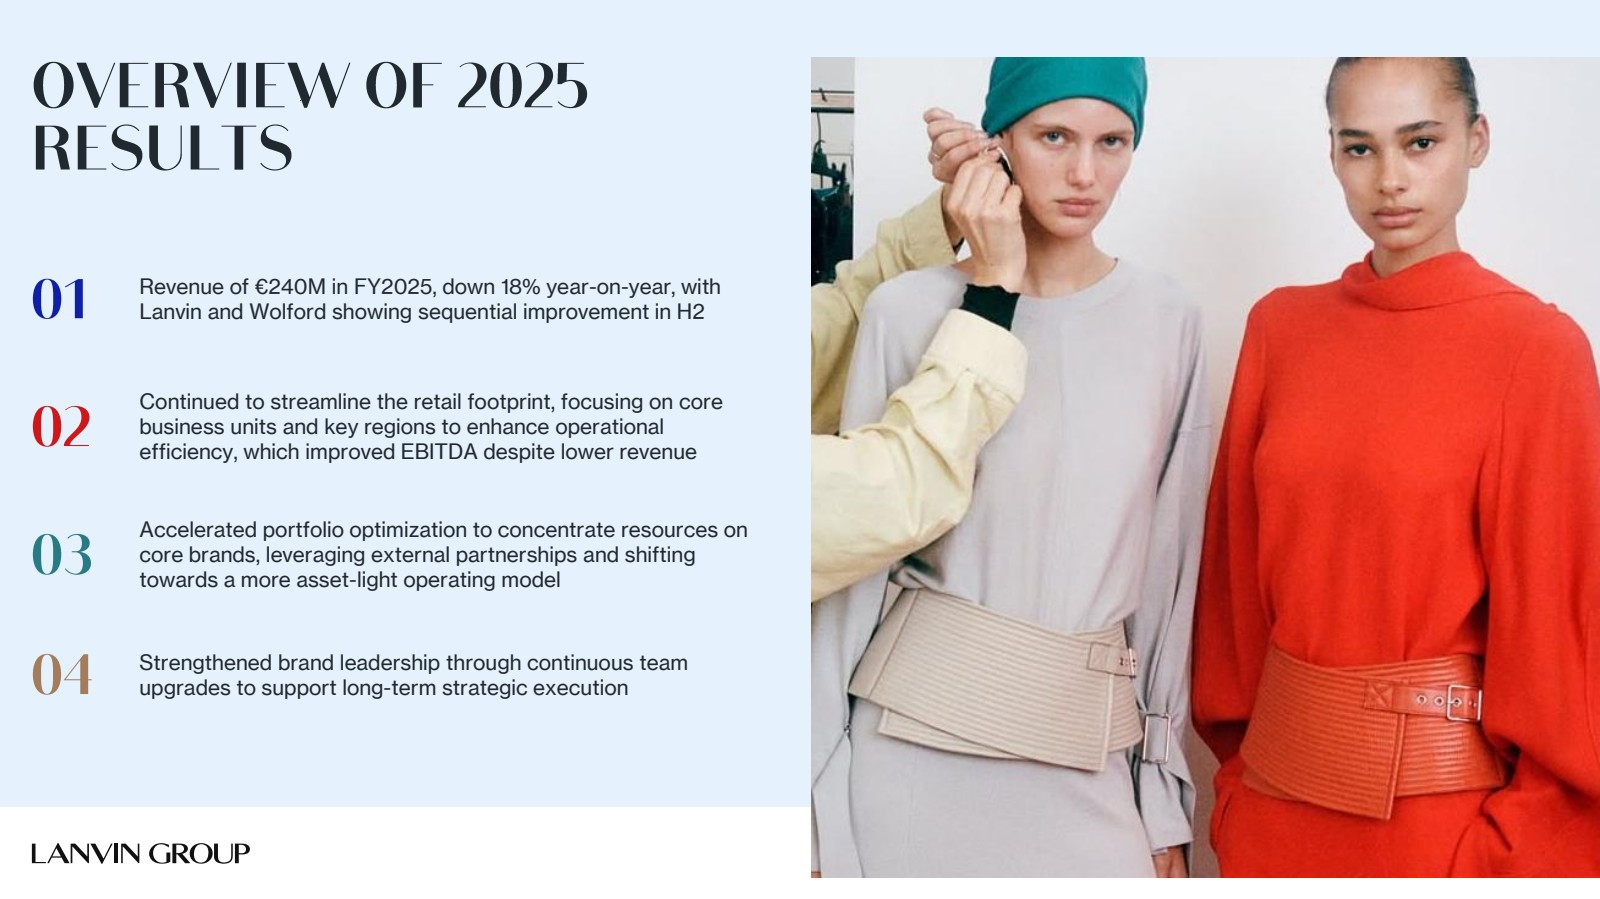
| OVERVIEW OF 2025 RESULTS 01 Revenue of €240M in FY2025, down 18% year-on-year, with Lanvin and Wolford showing sequential improvement in H2 02 Continued to streamline the retail footprint, focusing on core business units and key regions to enhance operational efficiency, which improved EBITDA despite lower revenue 03 Accelerated portfolio optimization to concentrate resources on core brands, leveraging external partnerships and shifting towards a more asset-light operating model 04 Strengthened brand leadership through continuous team upgrades to support long-term strategic execution |
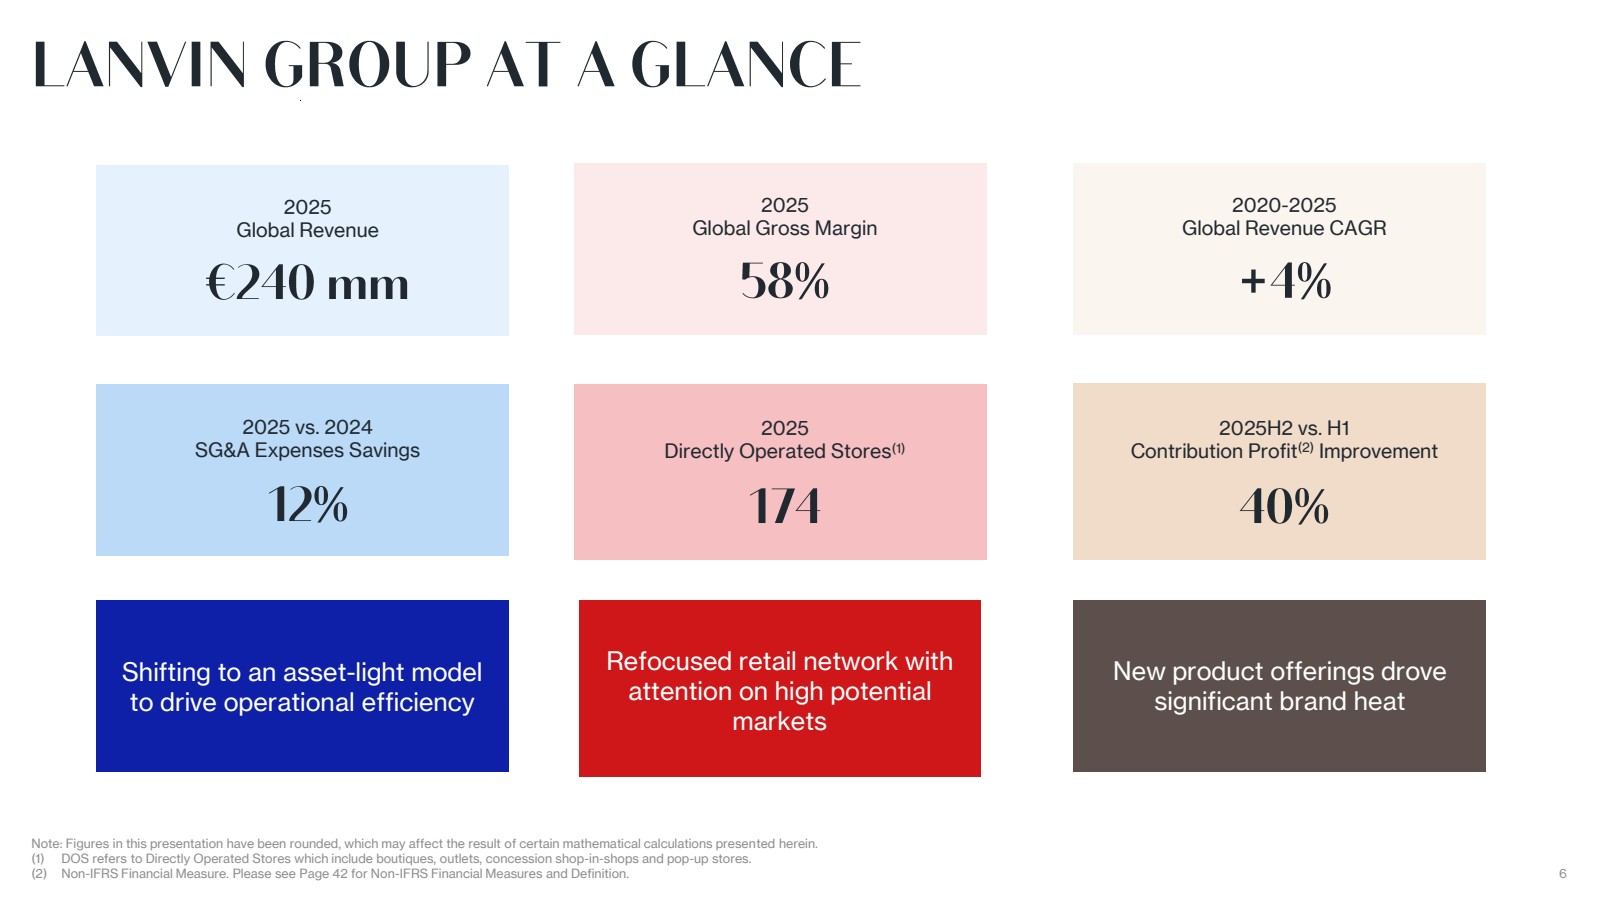
| 6 Note: Figures in this presentation have been rounded, which may affect the result of certain mathematical calculations presented herein. (1) DOS refers to Directly Operated Stores which include boutiques, outlets, concession shop-in-shops and pop-up stores. (2) Non-IFRS Financial Measure. Please see Page 42 for Non-IFRS Financial Measures and Definition. LANVIN GROUP AT A GLANCE 2025 Global Revenue €240 mm 2025 Directly Operated Stores(1) 174 2025 vs. 2024 SG&A Expenses Savings 12% 2025 Global Gross Margin 58% 2020-2025 Global Revenue CAGR +4% Shifting to an asset-light model to drive operational efficiency Refocused retail network with attention on high potential markets New product offerings drove significant brand heat 2025H2 vs. H1 Contribution Profit(2) Improvement 40% |
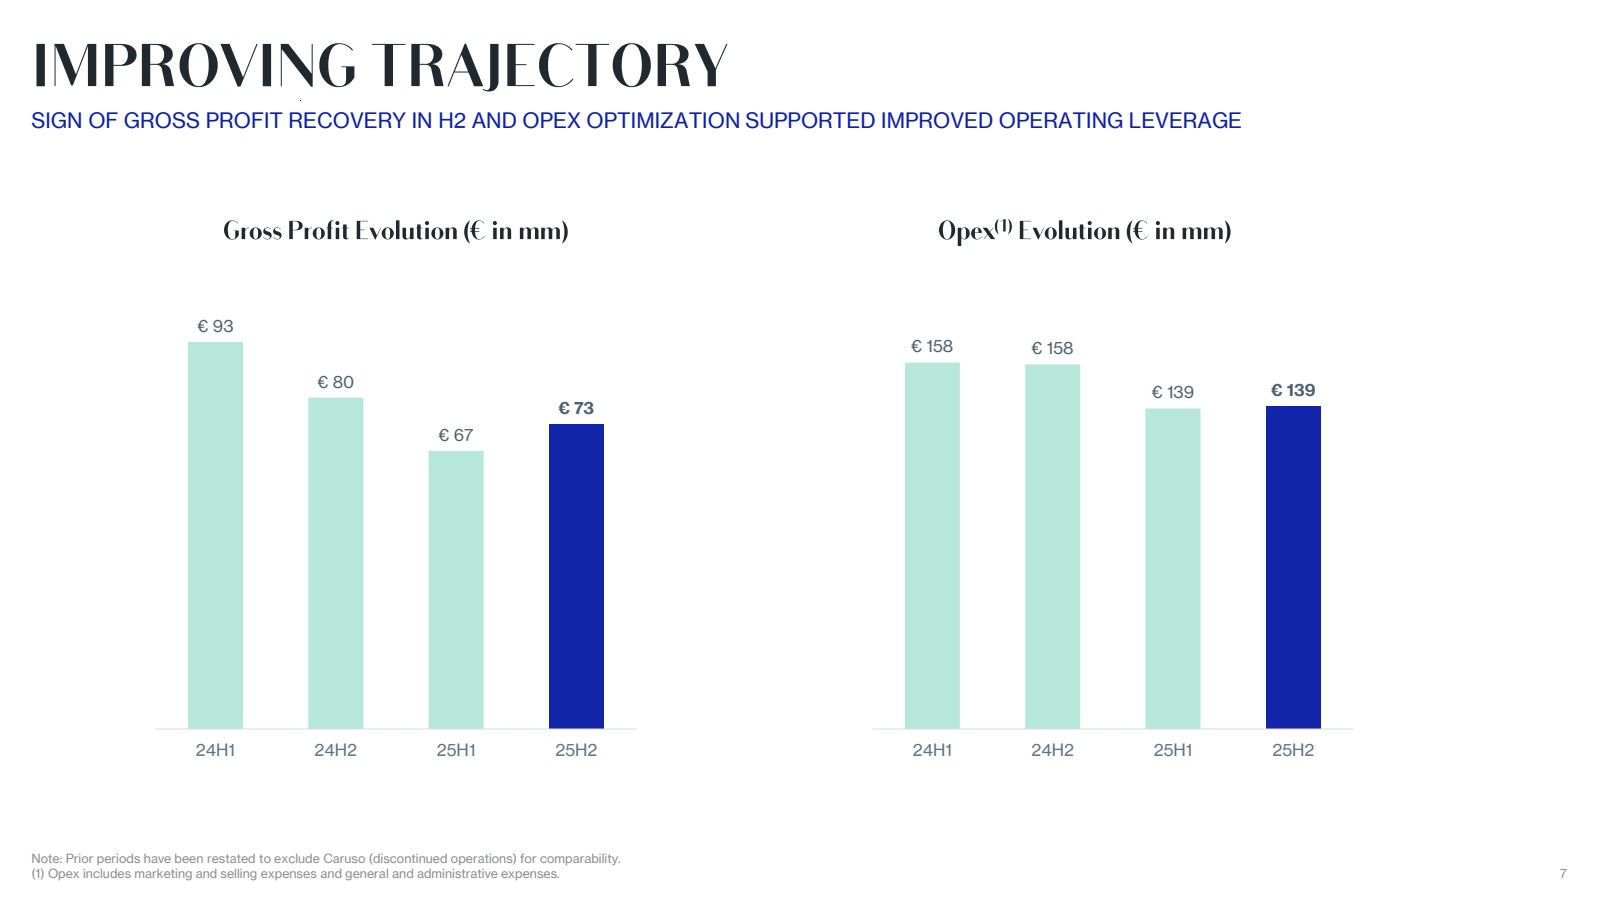
| 7 Note: Prior periods have been restated to exclude Caruso (discontinued operations) for comparability. (1) Opex includes marketing and selling expenses and general and administrative expenses. IMPROVING TRAJECTORY SIGN OF GROSS PROFIT RECOVERY IN H2 AND OPEX OPTIMIZATION SUPPORTED IMPROVED OPERATING LEVERAGE Gross Profit Evolution ( € in mm) € 93 € 80 € 67 € 73 24H1 24H2 25H1 25H2 € 158 € 158 € 139 € 139 24H1 24H2 25H1 25H2 Opex (1) Evolution ( € in mm) |
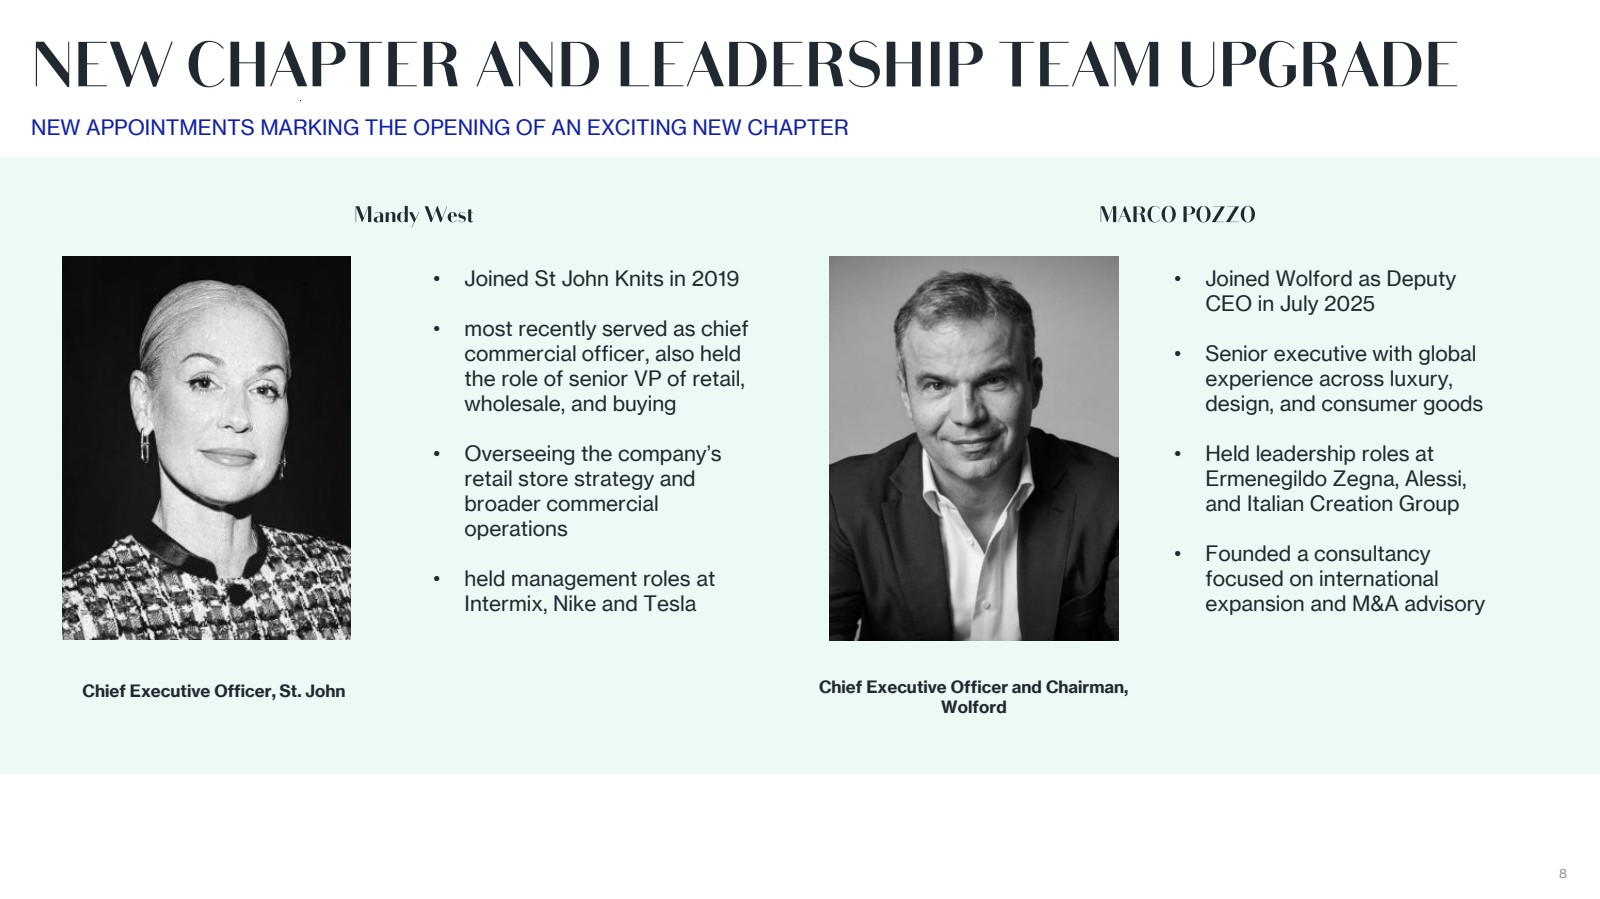
| 8 NEW CHAPTER AND LEADERSHIP TEAM UPGRADE Mandy West NEW APPOINTMENTS MARKING THE OPENING OF AN EXCITING NEW CHAPTER MARCO POZZO • Joined St John Knits in 2019 • most recently served as chief commercial officer, also held the role of senior VP of retail, wholesale, and buying • Overseeing the company’s retail store strategy and broader commercial operations • held management roles at Intermix, Nike and Tesla • Joined Wolford as Deputy CEO in July 2025 • Senior executive with global experience across luxury, design, and consumer goods • Held leadership roles at Ermenegildo Zegna, Alessi, and Italian Creation Group • Founded a consultancy focused on international expansion and M&A advisory Chief Executive Officer, St. John Chief Executive Officer and Chairman, Wolford |
| Source: Bain-Altagamma Luxury Goods Worldwide Market Study (Fall 2021-20th). Euromonitor. Section I 9 OUR UNIQUE GLOBAL PLATFORM AND RESILIENT STRATEGIES DELIVERED GROWTH |

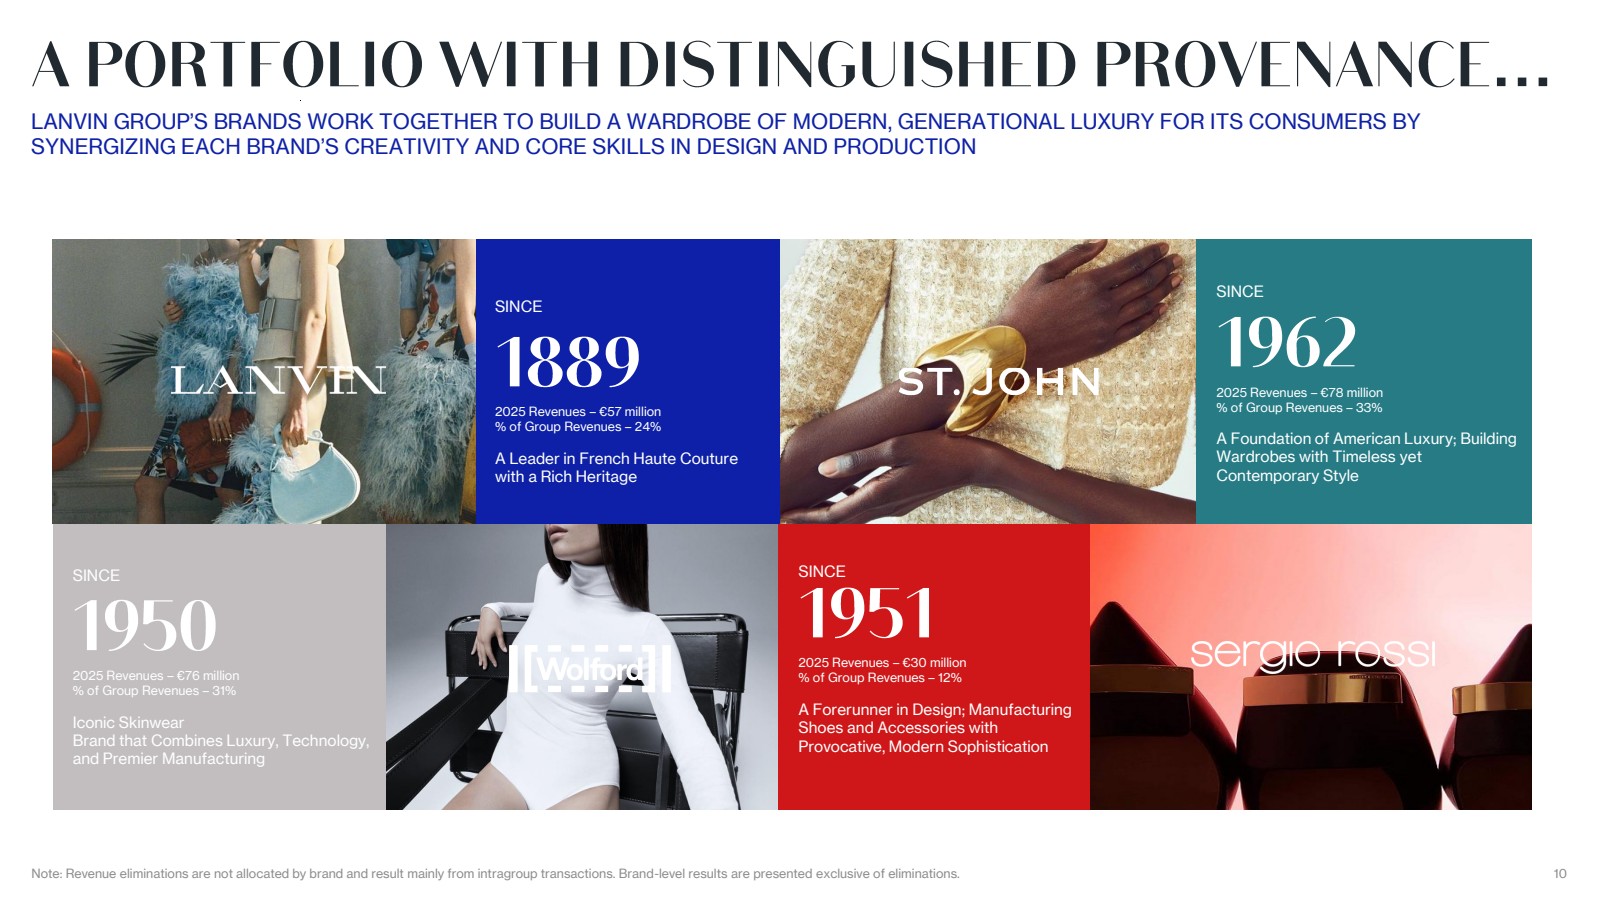
| 10 A PORTFOLIO WITH DISTINGUISHED PROVENANCE … SINCE 1889 2025 Revenues – €57 million % of Group Revenues – 24% A Leader in French Haute Couture with a Rich Heritage SINCE 1950 2025 Revenues – €76 million % of Group Revenues – 31% Iconic Skinwear Brand that Combines Luxury, Technology, and Premier Manufacturing SINCE 1962 2025 Revenues – €78 million % of Group Revenues – 33% A Foundation of American Luxury; Building Wardrobes with Timeless yet Contemporary Style SINCE 1951 2025 Revenues – €30 million % of Group Revenues – 12% A Forerunner in Design; Manufacturing Shoes and Accessories with Provocative, Modern Sophistication LANVIN GROUP’S BRANDS WORK TOGETHER TO BUILD A WARDROBE OF MODERN, GENERATIONAL LUXURY FOR ITS CONSUMERS BY SYNERGIZING EACH BRAND’S CREATIVITY AND CORE SKILLS IN DESIGN AND PRODUCTION Note: Revenue eliminations are not allocated by brand and result mainly from intragroup transactions. Brand-level results are presented exclusive of eliminations. |
| 11 …AND EXPANSIVE POSSIBILITIES KEY STRATEGIES AND INITIATIVES IN BRAND, PRODUCT, CHANNEL AND REGION CONTINUE TO PROMOTE GROWTH Refocused Brand Strategy • Back to brand DNAs and ethos • Focus on core iconic offerings Increased Brand Visibility • Continued investment in branding • Targeted brand collaborations Proven Category Initiatives • Increased accessory contribution • Successful category extension Balanced Regional Growth • Rebalanced store network • Light asset approach Digital & Omnichannel • Strengthened e-commerce channels • Digital infrastructure implementation |

| 12 THE KEYS TO SUCCESS DIGITAL MIND- SET START -UP VALUE UNICORN TRACK RECORD NIMBLE APPROACH |

| BRANDS’ KEY STRATEGIES AND ACHIEVEMENTS |

| 14 LANVIN Inventory Cleanup & Margin Discipline Organizational Realignment Retail Footprint Optimization Creative Vision Refresh 1 2 3 4 First collection under new creative leadership, setting the tone for a refined brand direction and reaffirming Lanvin’s positioning on the global stage Significant inventory reduction and tighter markdown control since H2 laying the groundwork for healthier margins and cleaner merchandising Leadership evolution and back office organizational streamlining to enhance agility, strengthen execution, and better align the platform with long-term strategic priorities Strategic store closures and network rationalization to refocus on high-productivity locations and improve overall network efficiency |

| 15 WOLFORD Balanced Product Strategy Channel Distribution Omni- channel Customer Experience Marketing & Communication 1 2 3 4 Celebrate 75th anniversary through The Thread of Attitude, a global marketing project to amplify brand heritage and contemporary relevance Enhance the webshop customer journey to improve discovery, navigation, and conversion, while elevating the in-store experience through an upgraded and more consistent store concept Optimize the network by focusing on high-potential locations, strengthening DTC while maintaining selective wholesale Strengthen the core collection through the introduction of new Essentials, reinforcing relevance and wearability alongside iconic signature pieces 2 4 |

| 16 SERGIO ROSSI Asset-light Model Transformation Retail Network Optimization Performance Improvement Supply Chain Enhancement 1 2 3 4 Streamlined vendor portfolio, strengthened strategic supplier partnerships and resolved legacy payables Implemented restructuring measures to reduce fixed costs, uplift back-office efficiency, and improve flexibility Continued retail network rationalization by focusing on higher-potential locations to optimize resource allocation Advance the light-asset transition, enabling greater focus on product development and merchandising while mitigating production-related risks |

| 17 ST. JOHN Digital Upgrade Nordstrom Partnership Malbon Collaboration Heritage Success 2 4 Upgraded e-commerce capabilities through strengthened team and new marketing partnerships, driving significant sales growth Successful collaboration with global golf brand Malbon, broadening audience reach and enhancing brand awareness and client acquisition Expanded and strengthened partnership with Nordstrom, delivering 40+% year-over-year growth through increased distribution Expanded knitwear offering, driving improved full-price sell-through and reinforcing core brand strengths 1 3 |

| 18 2026 GUIDANCE STRIVING FOR PROFITABILITY 01 Transformation Progress: advance the transformation initiated in 2025 toward 2026 completion, with new leadership appointments across key maisons 02 Portfolio Discipline: conduct stringent portfolio review to concentrate resources on high-value brands, with selective evaluation of strategic opportunities 03 Asset-Light Exploration: strengthen domestic market leadership through asset-light, regionally and category-focused partnerships that leverage local expertise to expand reach 04 Brand Recovery: sustain Lanvin’s momentum under Peter, advance Wolford’s recovery, drive Sergio Rossi toward profitability, and maintain St. John’s steady performance |
| GROUP CONSOLIDATED FINANCIAL RESULTS |

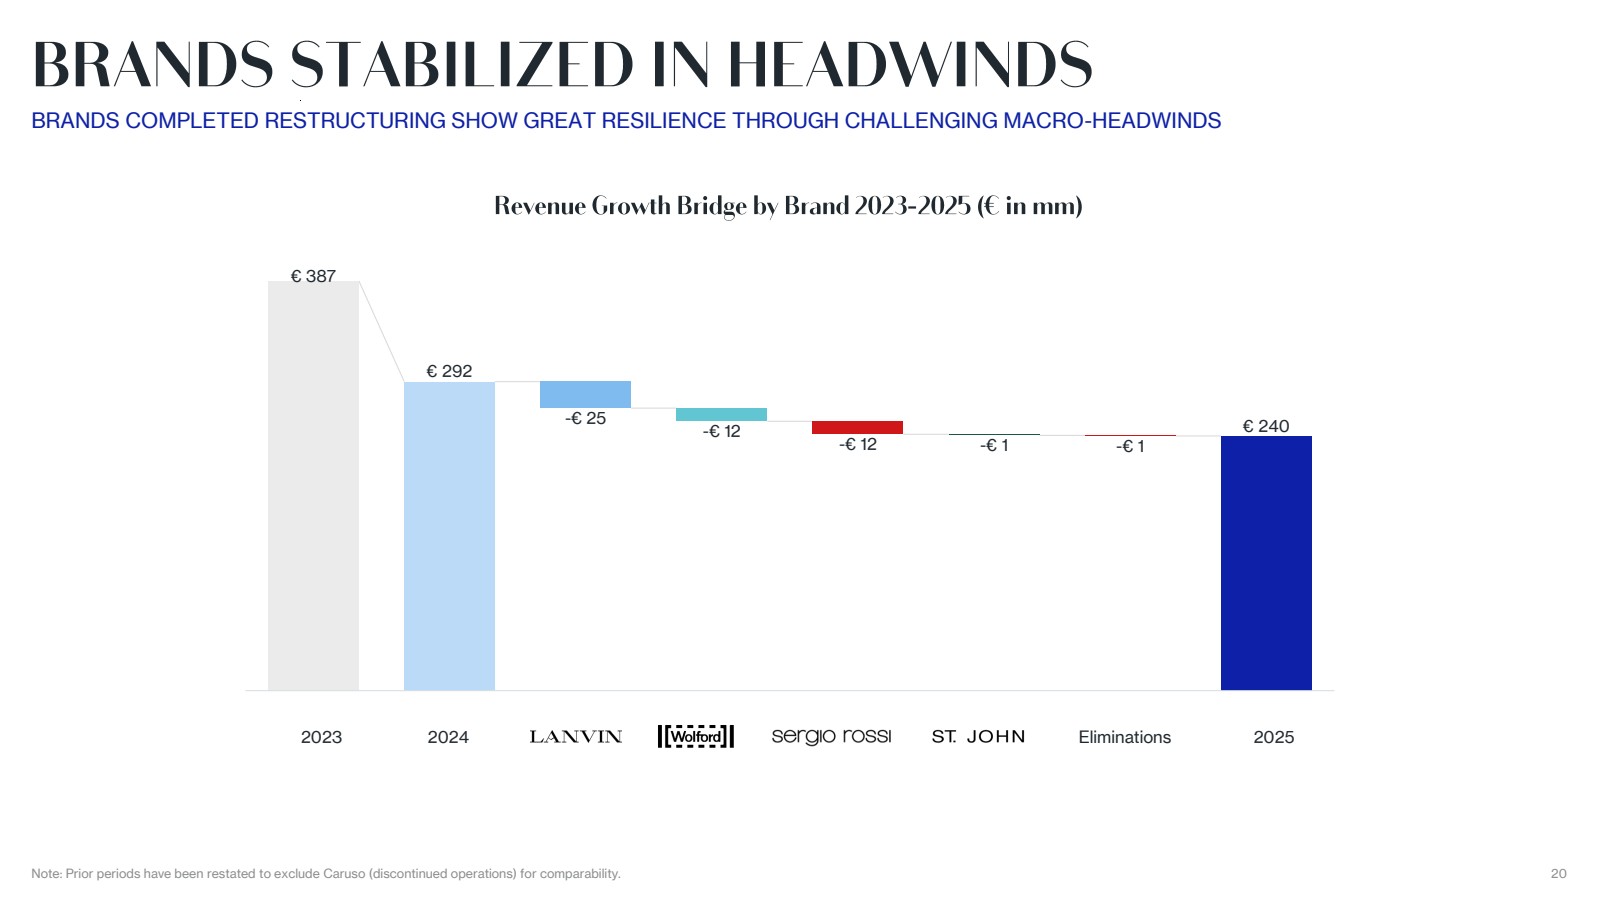
| 20 BRANDS STABILIZED IN HEADWINDS BRANDS COMPLETED RESTRUCTURING SHOW GREAT RESILIENCE THROUGH CHALLENGING MACRO-HEADWINDS Eliminations 2025 Note: Prior periods have been restated to exclude Caruso (discontinued operations) for comparability. Revenue Growth Bridge by Brand 2023 - 2025 (€ in mm) 2024 € 387 € 292 -€ 25 -€ 12 -€ 12 -€ 1 -€ 1 € 240 2023 2024 Lanvin Wolford Sergio Rossi SJK Elimination 2024 2023 |
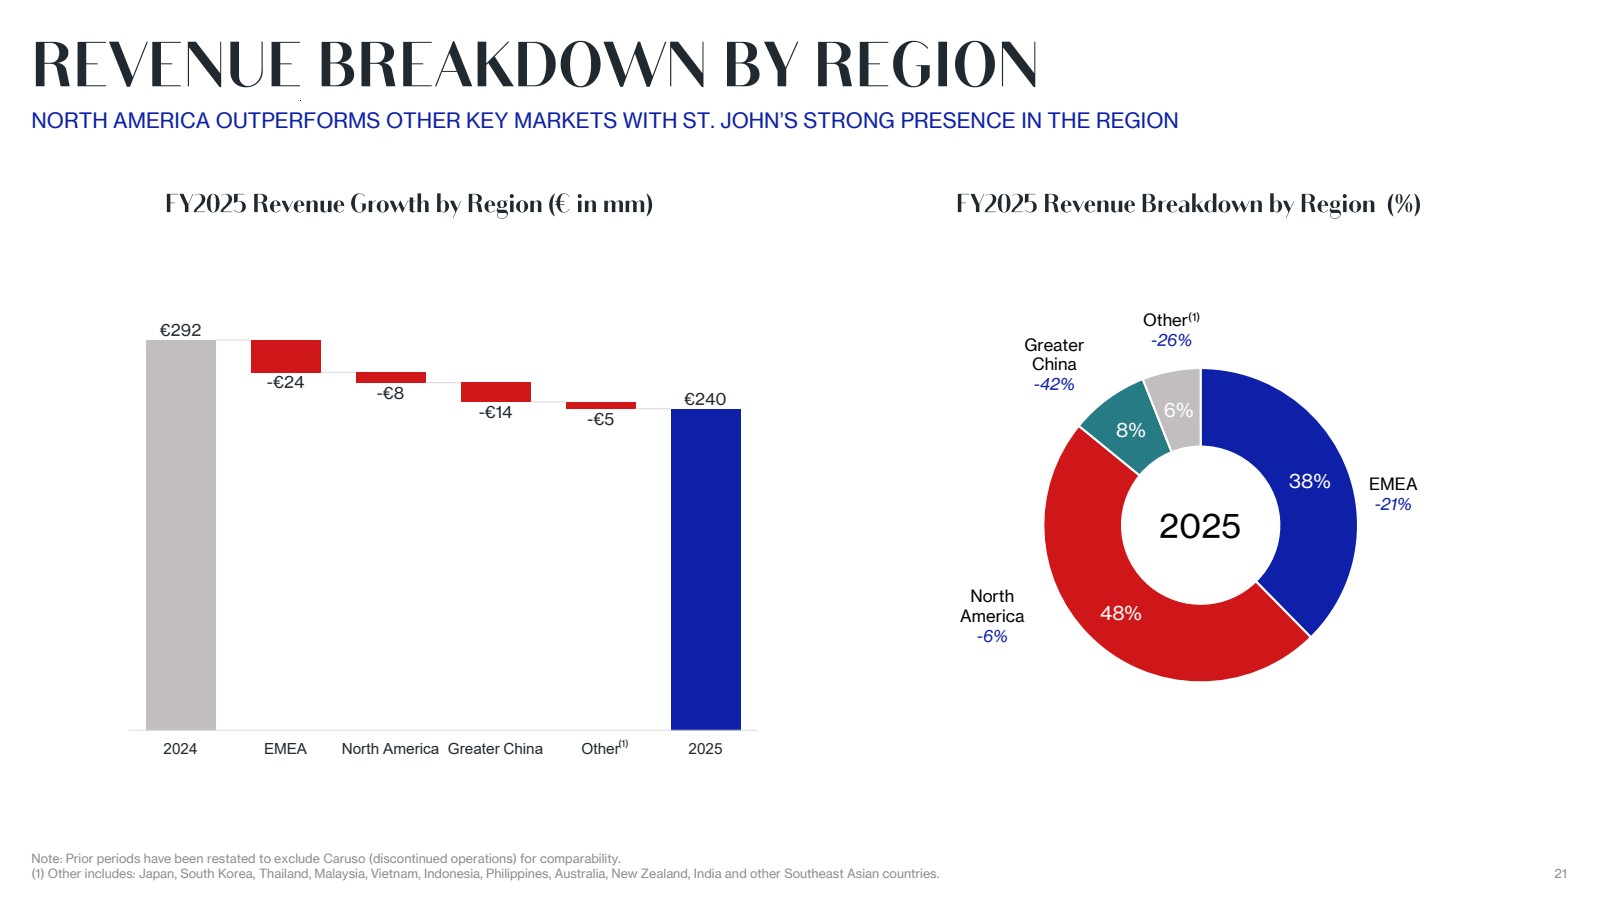
| 21 FY2025 Revenue Growth by Region ( € in mm) Note: Prior periods have been restated to exclude Caruso (discontinued operations) for comparability. (1) Other includes: Japan, South Korea, Thailand, Malaysia, Vietnam, Indonesia, Philippines, Australia, New Zealand, India and other Southeast Asian countries. REVENUE BREAKDOWN BY REGION FY2025 Revenue Breakdown by Region (%) NORTH AMERICA OUTPERFORMS OTHER KEY MARKETS WITH ST. JOHN’S STRONG PRESENCE IN THE REGION (1) -€8 -€14 -€5 €240 €292 -€24 2024 EMEA North America Greater China Other 2025 38% 48% 8% 6% 2025 North America -6% EMEA -21% Greater China -42% Other(1) -26% |
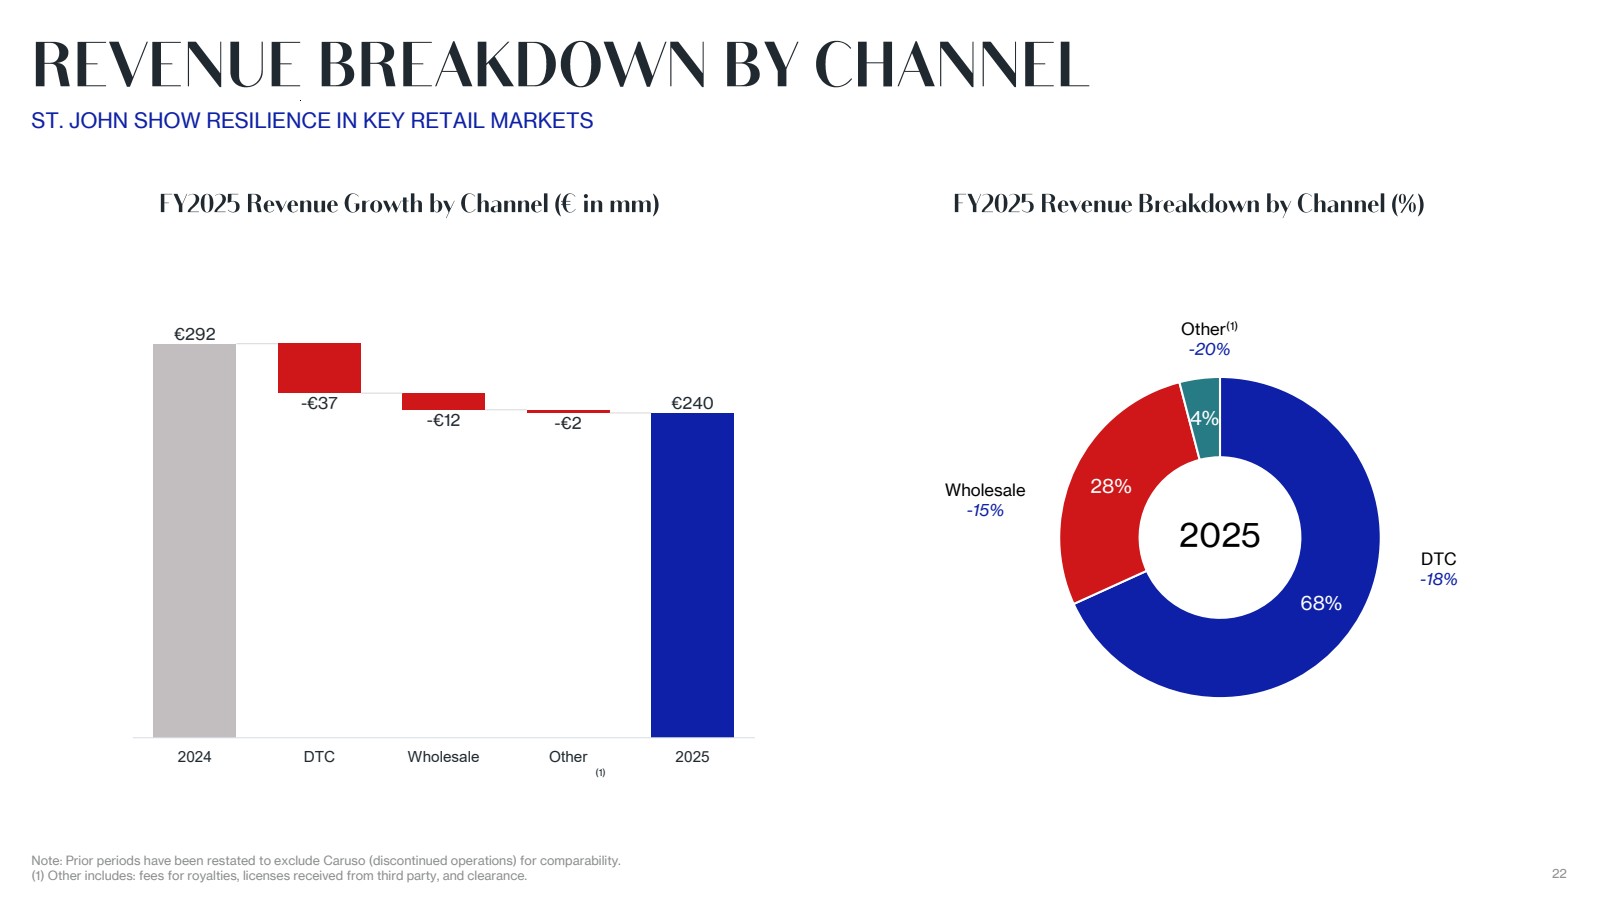
| 22 FY2025 Revenue Growth by Channel ( € in mm) FY2025 Revenue Breakdown by Channel ( %) REVENUE BREAKDOWN BY CHANNEL ST. JOHN SHOW RESILIENCE IN KEY RETAIL MARKETS Note: Prior periods have been restated to exclude Caruso (discontinued operations) for comparability. (1) Other includes: fees for royalties, licenses received from third party, and clearance. (1) €292 -€37 -€12 -€2 €240 2024 DTC Wholesale Other 2025 68% 28% 4% 2025 Other(1) -20% DTC -18% Wholesale -15% |
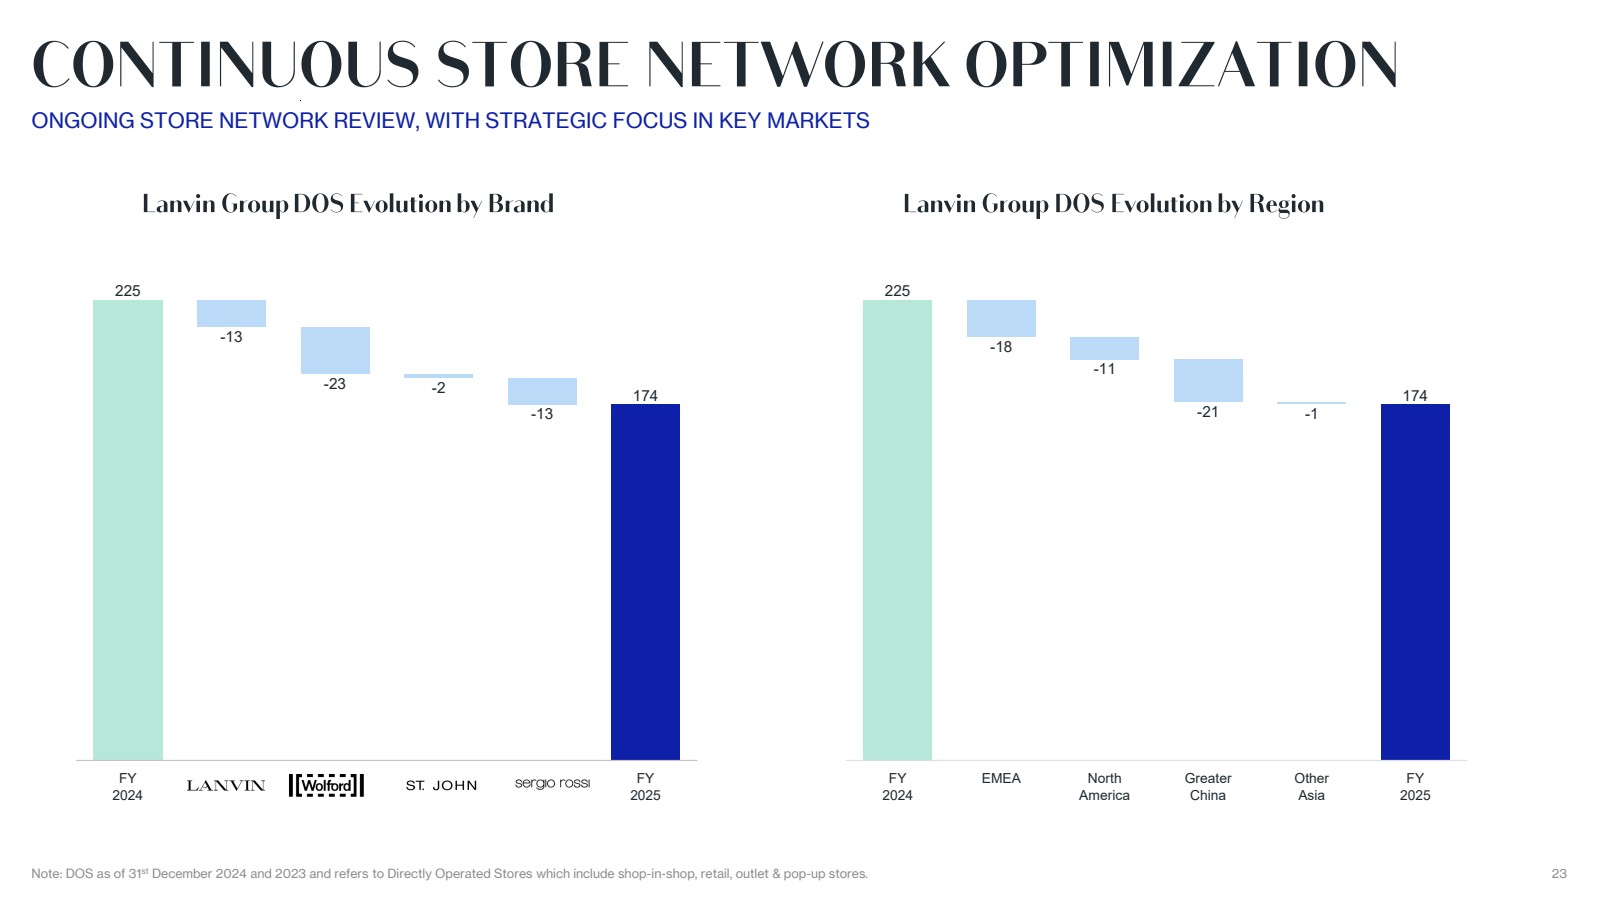
| 23 225 -13 -23 -2 -13 174 FY 2024 Lanvin Wolford St. John Sergio Rossi FY 2025 CONTINUOUS STORE NETWORK OPTIMIZATION Note: DOS as of 31st December 2024 and 2023 and refers to Directly Operated Stores which include shop-in-shop, retail, outlet & pop-up stores. ONGOING STORE NETWORK REVIEW, WITH STRATEGIC FOCUS IN KEY MARKETS Lanvin Group DOS Evolution by Brand Lanvin Group DOS E volution by Region 225 -18 -11 -21 -1 174 FY 2024 EMEA North America Greater China Other Asia FY 2025 |
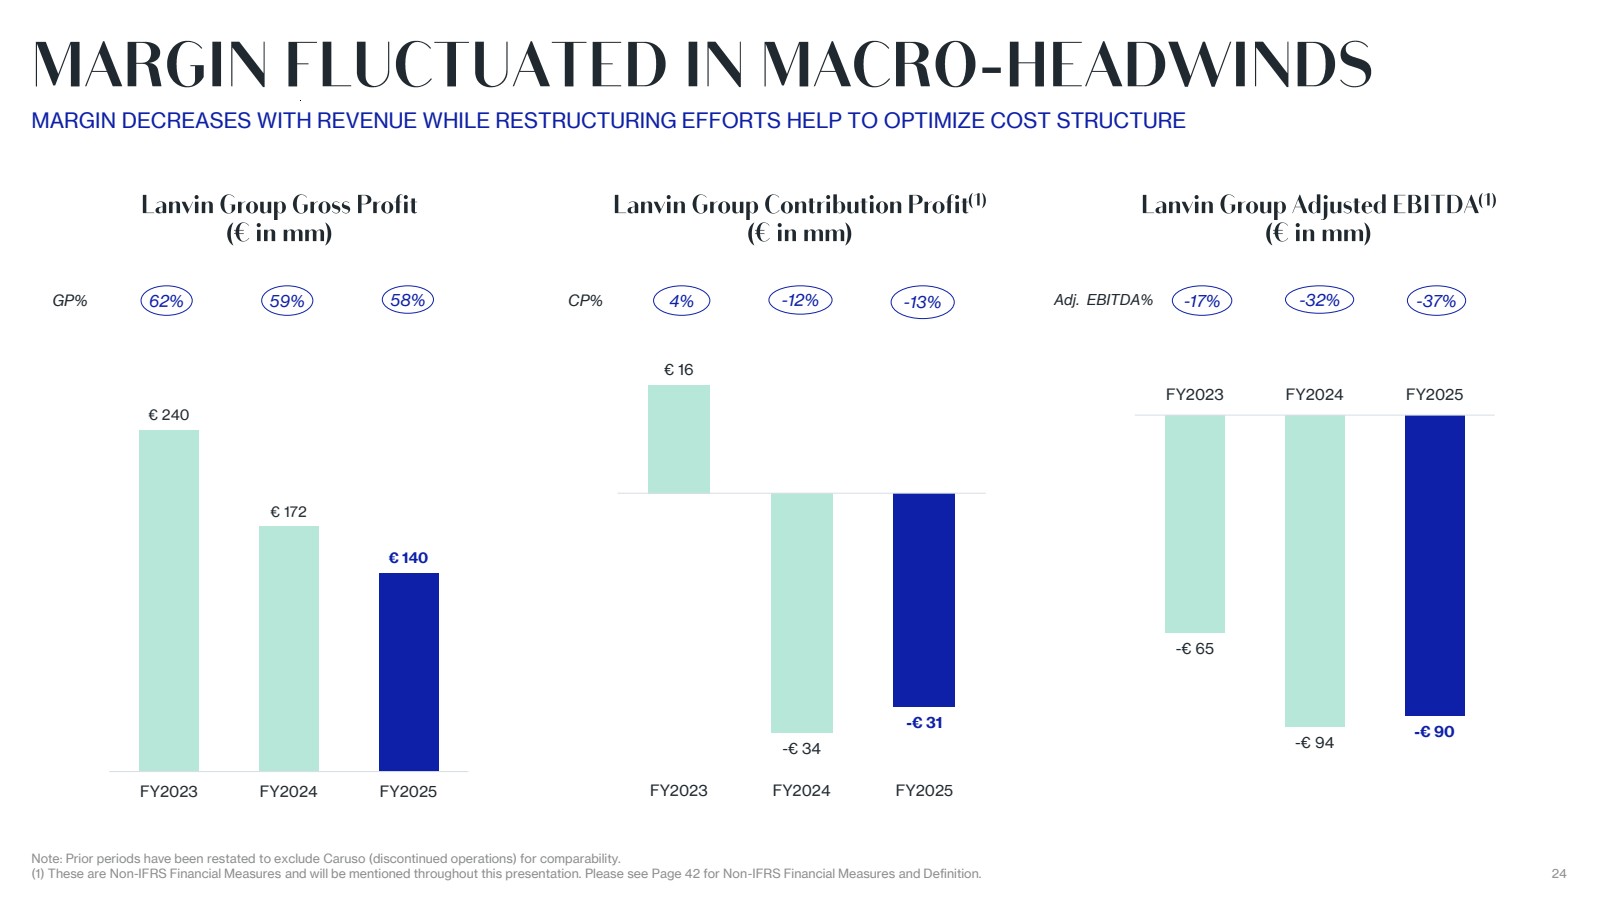
| 24 € 240 € 172 € 140 FY2023 FY2024 FY2025 Lanvin Group Gross Profit (€ in mm ) Note: Prior periods have been restated to exclude Caruso (discontinued operations) for comparability. (1) These are Non-IFRS Financial Measures and will be mentioned throughout this presentation. Please see Page 42 for Non-IFRS Financial Measures and Definition. MARGIN FLUCTUATED IN MACRO -HEADWINDS GP% Lanvin Group Contribution Profit (1) (€ in mm ) CP% Lanvin Group Adjusted EBITDA (1) (€ in mm ) Adj. EBITDA% MARGIN DECREASES WITH REVENUE WHILE RESTRUCTURING EFFORTS HELP TO OPTIMIZE COST STRUCTURE 62% 59% 58% 4% -12% -13% -17% -32% -37% € 16 -€ 34 -€ 31 FY2023 FY2024 FY2025 -€ 65 -€ 94 -€ 90 FY2023 FY2024 FY2025 |
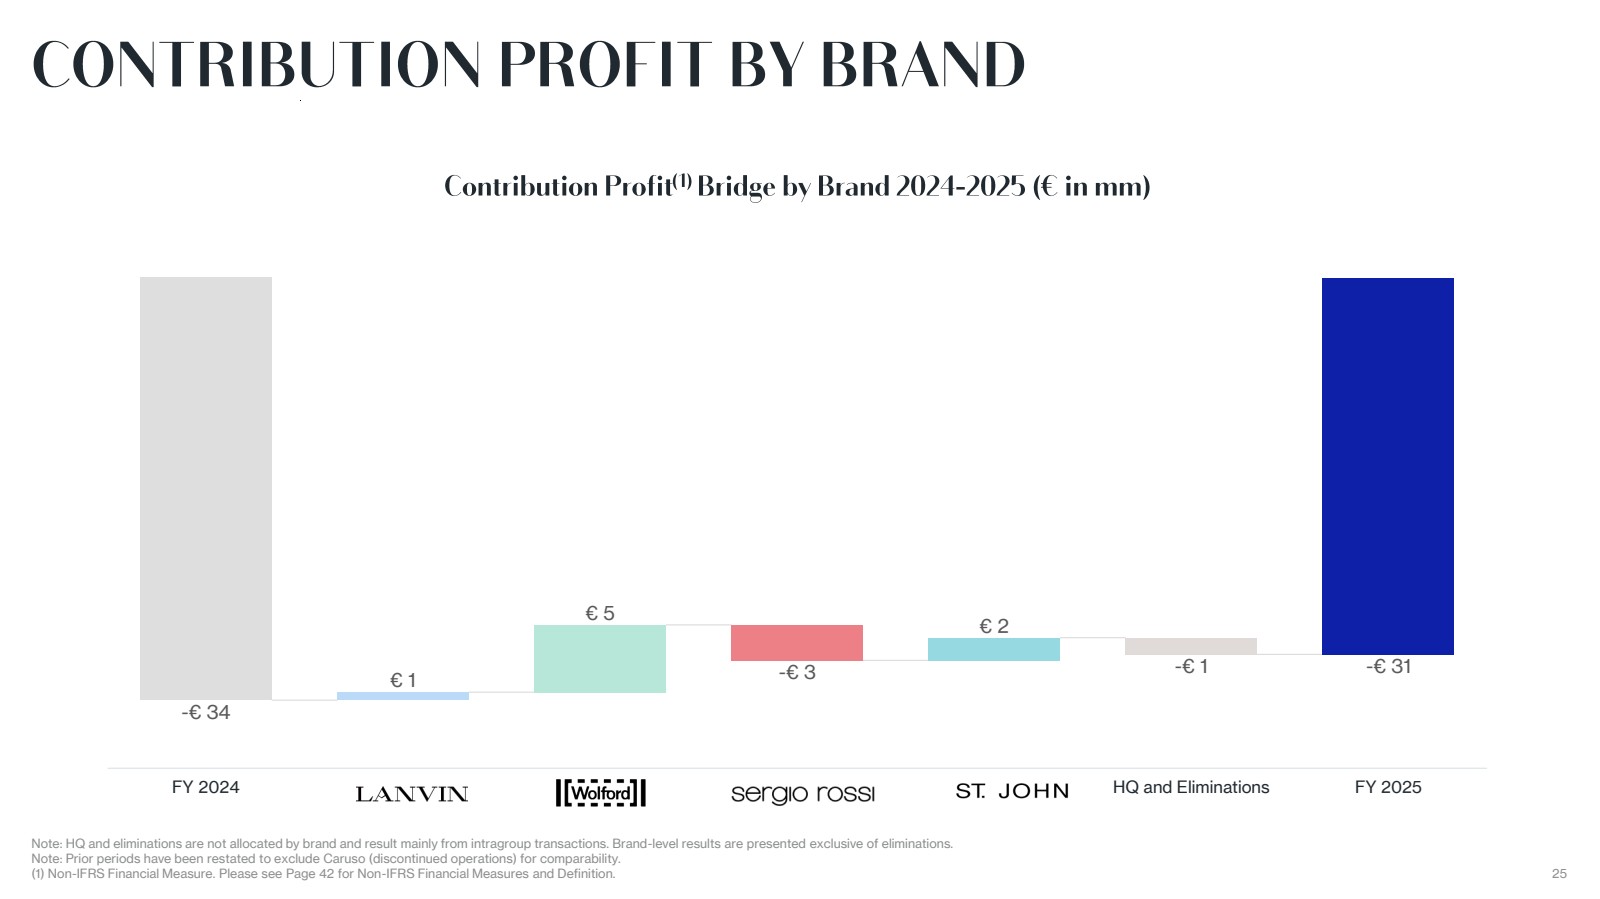
| 25 Contribution Profit (1) Bridge by Brand 2024 - 2025 (€ in mm) CONTRIBUTION PROFIT BY BRAND Note: HQ and eliminations are not allocated by brand and result mainly from intragroup transactions. Brand-level results are presented exclusive of eliminations. Note: Prior periods have been restated to exclude Caruso (discontinued operations) for comparability. (1) Non-IFRS Financial Measure. Please see Page 42 for Non-IFRS Financial Measures and Definition. -€ 34 € 1 € 5 € 2 -€ 1 -€ 31 -€ 3 FY 2024 Lanvin Wolford Sergio Rossi SJK HQ and Eliminations FY 2025 |
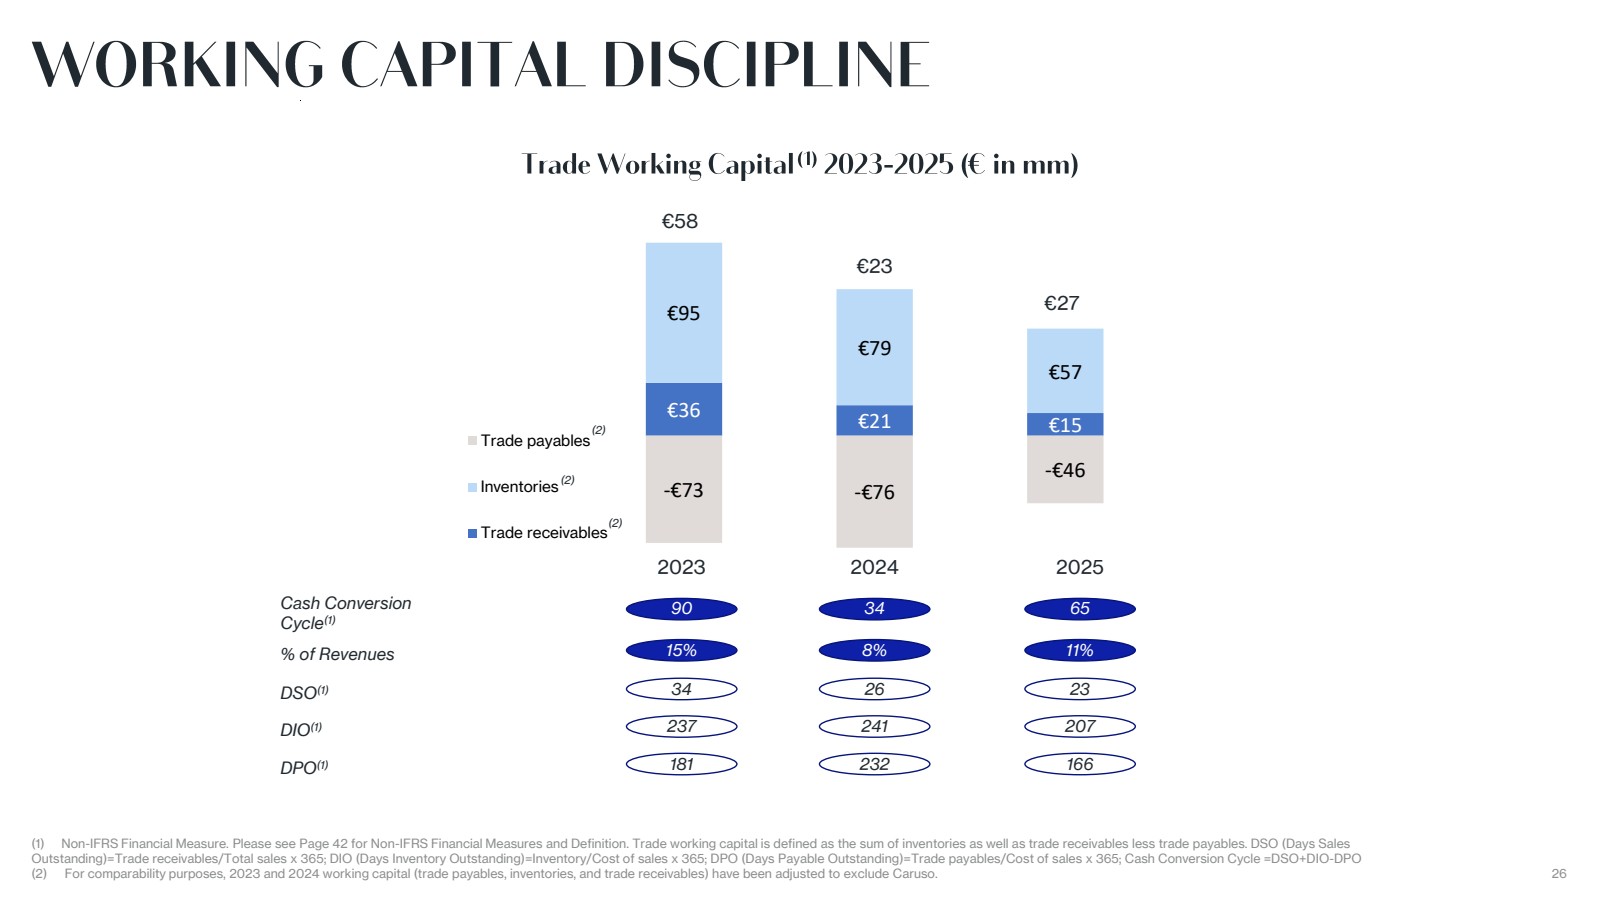
| 26 €36 €21 €15 €95 €79 €57 -€73 -€76 -€46 Y202 3 Y202 4 Y202 5 Trade payables Inventories Trade receivables WORKING CAPITAL DISCIPLINE Trade Working Capital (1) 2023- 2025 (€ in mm) €58 2023 DSO(1) 34 DIO(1) 237 DPO(1) 181 Cash Conversion Cycle(1) 90 % of Revenues 15% (1) Non-IFRS Financial Measure. Please see Page 42 for Non-IFRS Financial Measures and Definition. Trade working capital is defined as the sum of inventories as well as trade receivables less trade payables. DSO (Days Sales Outstanding)=Trade receivables/Total sales x 365; DIO (Days Inventory Outstanding)=Inventory/Cost of sales x 365; DPO (Days Payable Outstanding)=Trade payables/Cost of sales x 365; Cash Conversion Cycle =DSO+DIO-DPO (2) For comparability purposes, 2023 and 2024 working capital (trade payables, inventories, and trade receivables) have been adjusted to exclude Caruso. €23 2024 26 241 232 34 8% €27 2025 23 207 166 65 11% (2) (2) (2) |
| BRAND - LEVEL PERFORMANCE |

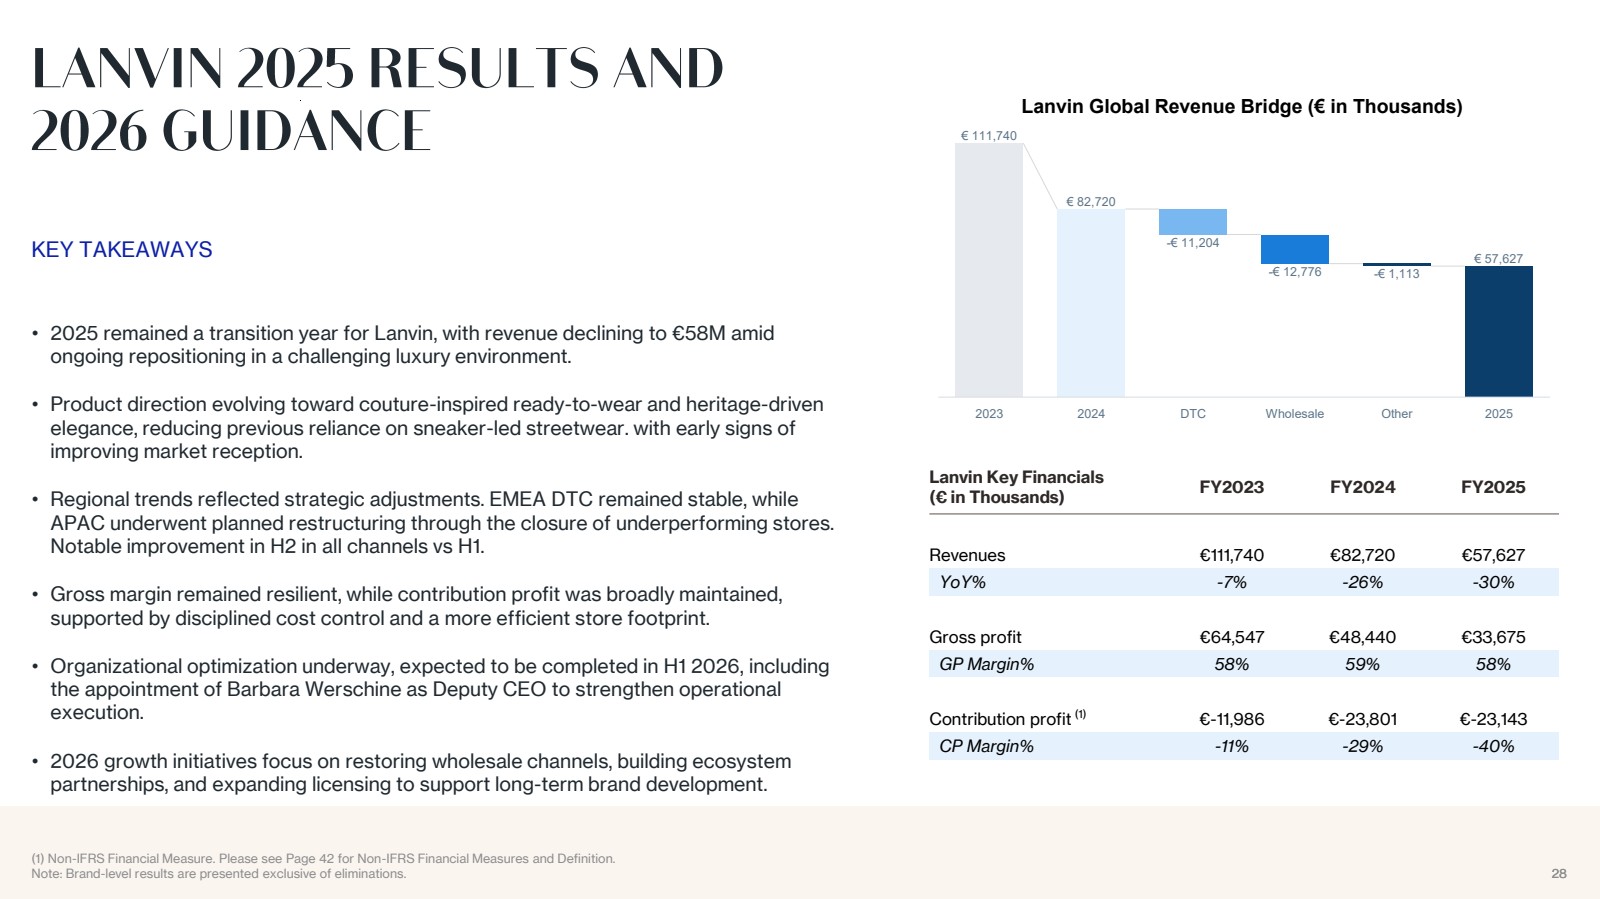
| 28 LANVIN 2025 RESULTS AND 2026 GUIDANCE KEY TAKEAWAYS (1) Non-IFRS Financial Measure. Please see Page 42 for Non-IFRS Financial Measures and Definition. Note: Brand-level results are presented exclusive of eliminations. • 2025 remained a transition year for Lanvin, with revenue declining to €58M amid ongoing repositioning in a challenging luxury environment. • Product direction evolving toward couture-inspired ready-to-wear and heritage-driven elegance, reducing previous reliance on sneaker-led streetwear. with early signs of improving market reception. • Regional trends reflected strategic adjustments. EMEA DTC remained stable, while APAC underwent planned restructuring through the closure of underperforming stores. Notable improvement in H2 in all channels vs H1. • Gross margin remained resilient, while contribution profit was broadly maintained, supported by disciplined cost control and a more efficient store footprint. • Organizational optimization underway, expected to be completed in H1 2026, including the appointment of Barbara Werschine as Deputy CEO to strengthen operational execution. • 2026 growth initiatives focus on restoring wholesale channels, building ecosystem partnerships, and expanding licensing to support long-term brand development. Lanvin Key Financials (€ in Thousands) FY2023 FY2024 FY2025 Revenues €111,740 €82,720 €57,627 YoY% -7% -26% -30% Gross profit €64,547 €48,440 €33,675 GP Margin% 58% 59% 58% Contribution profit (1) €-11,986 €-23,801 €-23,143 CP Margin% -11% -29% -40% € 111,740 € 82,720 -€ 11,204 -€ 12,776 -€ 1,113 € 57,627 2023 2024 DTC Wholesale Other 2025 Lanvin Global Revenue Bridge (€ in Thousands) |
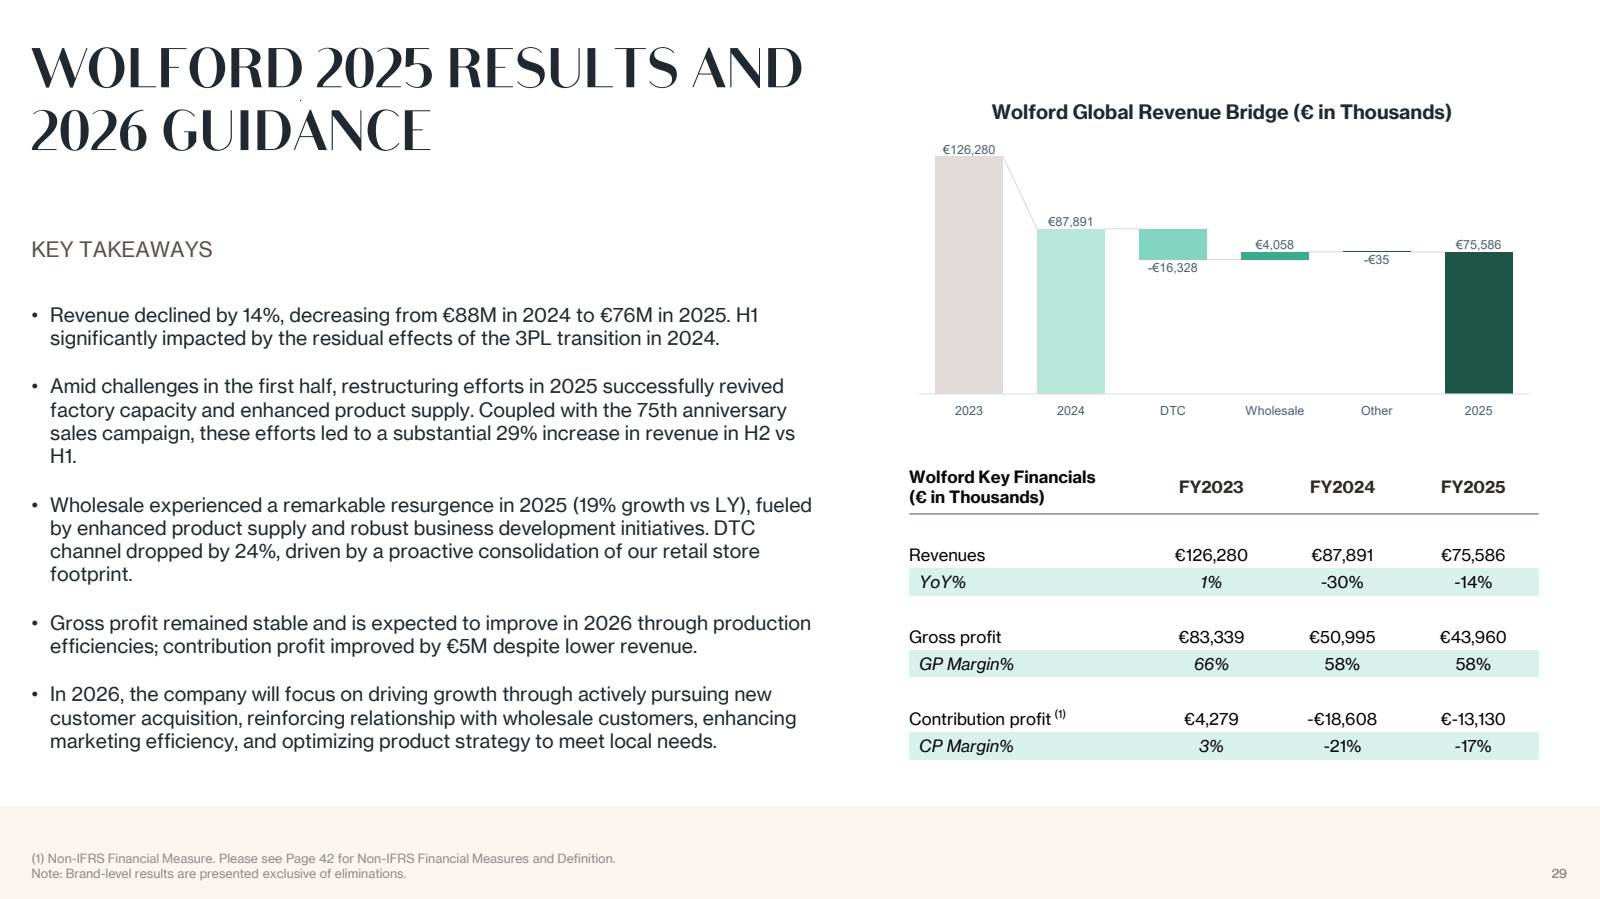
| 29 WOLFORD 2025 RESULTS AND 2026 GUIDANCE (1) Non-IFRS Financial Measure. Please see Page 42 for Non-IFRS Financial Measures and Definition. Note: Brand-level results are presented exclusive of eliminations. Wolford Key Financials (€ in Thousands) FY2023 FY2024 FY2025 Revenues €126,280 €87,891 €75,586 YoY% 1% -30% -14% Gross profit €83,339 €50,995 €43,960 GP Margin% 66% 58% 58% Contribution profit (1) €4,279 -€18,608 €-13,130 CP Margin% 3% -21% -17% • Revenue declined by 14%, decreasing from €88M in 2024 to €76M in 2025. H1 significantly impacted by the residual effects of the 3PL transition in 2024. • Amid challenges in the first half, restructuring efforts in 2025 successfully revived factory capacity and enhanced product supply. Coupled with the 75th anniversary sales campaign, these efforts led to a substantial 29% increase in revenue in H2 vs H1. • Wholesale experienced a remarkable resurgence in 2025 (19% growth vs LY), fueled by enhanced product supply and robust business development initiatives. DTC channel dropped by 24%, driven by a proactive consolidation of our retail store footprint. • Gross profit remained stable and is expected to improve in 2026 through production efficiencies; contribution profit improved by €5M despite lower revenue. • In 2026, the company will focus on driving growth through actively pursuing new customer acquisition, reinforcing relationship with wholesale customers, enhancing marketing efficiency, and optimizing product strategy to meet local needs. KEY TAKEAWAYS €126,280 €87,891 -€16,328 €4,058 -€35 €75,586 2023 2024 DTC Wholesale Other 2025 Wolford Global Revenue Bridge (€ in Thousands) |
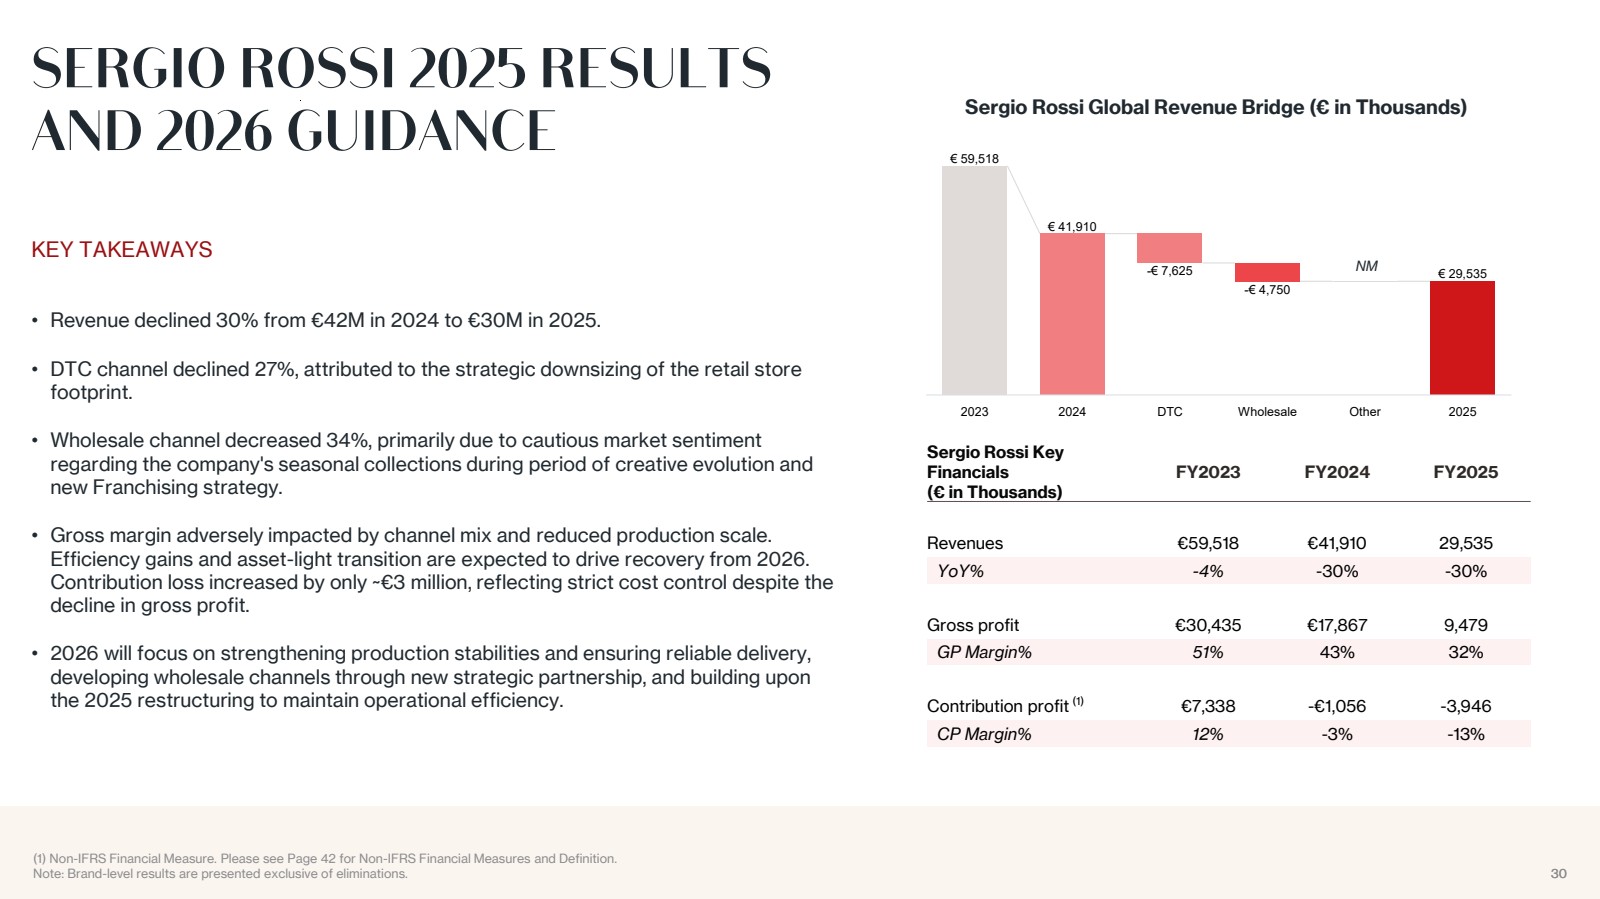
| 30 € 59,518 € 41,910 -€ 7,625 -€ 4,750 € 0 € 29,535 2023 2024 DTC Wholesale Other 2025 Sergio Rossi Global Revenue Bridge (€ in Thousands) SERGIO ROSSI 2025 RESULTS AND 2026 GUIDANCE KEY TAKEAWAYS • Revenue declined 30% from €42M in 2024 to €30M in 2025. • DTC channel declined 27%, attributed to the strategic downsizing of the retail store footprint. • Wholesale channel decreased 34%, primarily due to cautious market sentiment regarding the company's seasonal collections during period of creative evolution and new Franchising strategy. • Gross margin adversely impacted by channel mix and reduced production scale. Efficiency gains and asset-light transition are expected to drive recovery from 2026. Contribution loss increased by only ~€3 million, reflecting strict cost control despite the decline in gross profit. • 2026 will focus on strengthening production stabilities and ensuring reliable delivery, developing wholesale channels through new strategic partnership, and building upon the 2025 restructuring to maintain operational efficiency. 30 (1) Non-IFRS Financial Measure. Please see Page 42 for Non-IFRS Financial Measures and Definition. Note: Brand-level results are presented exclusive of eliminations. Sergio Rossi Key Financials (€ in Thousands) FY2023 FY2024 FY2025 Revenues €59,518 €41,910 29,535 YoY% -4% -30% -30% Gross profit €30,435 €17,867 9,479 GP Margin% 51% 43% 32% Contribution profit (1) €7,338 -€1,056 -3,946 CP Margin% 12% -3% -13% NM |
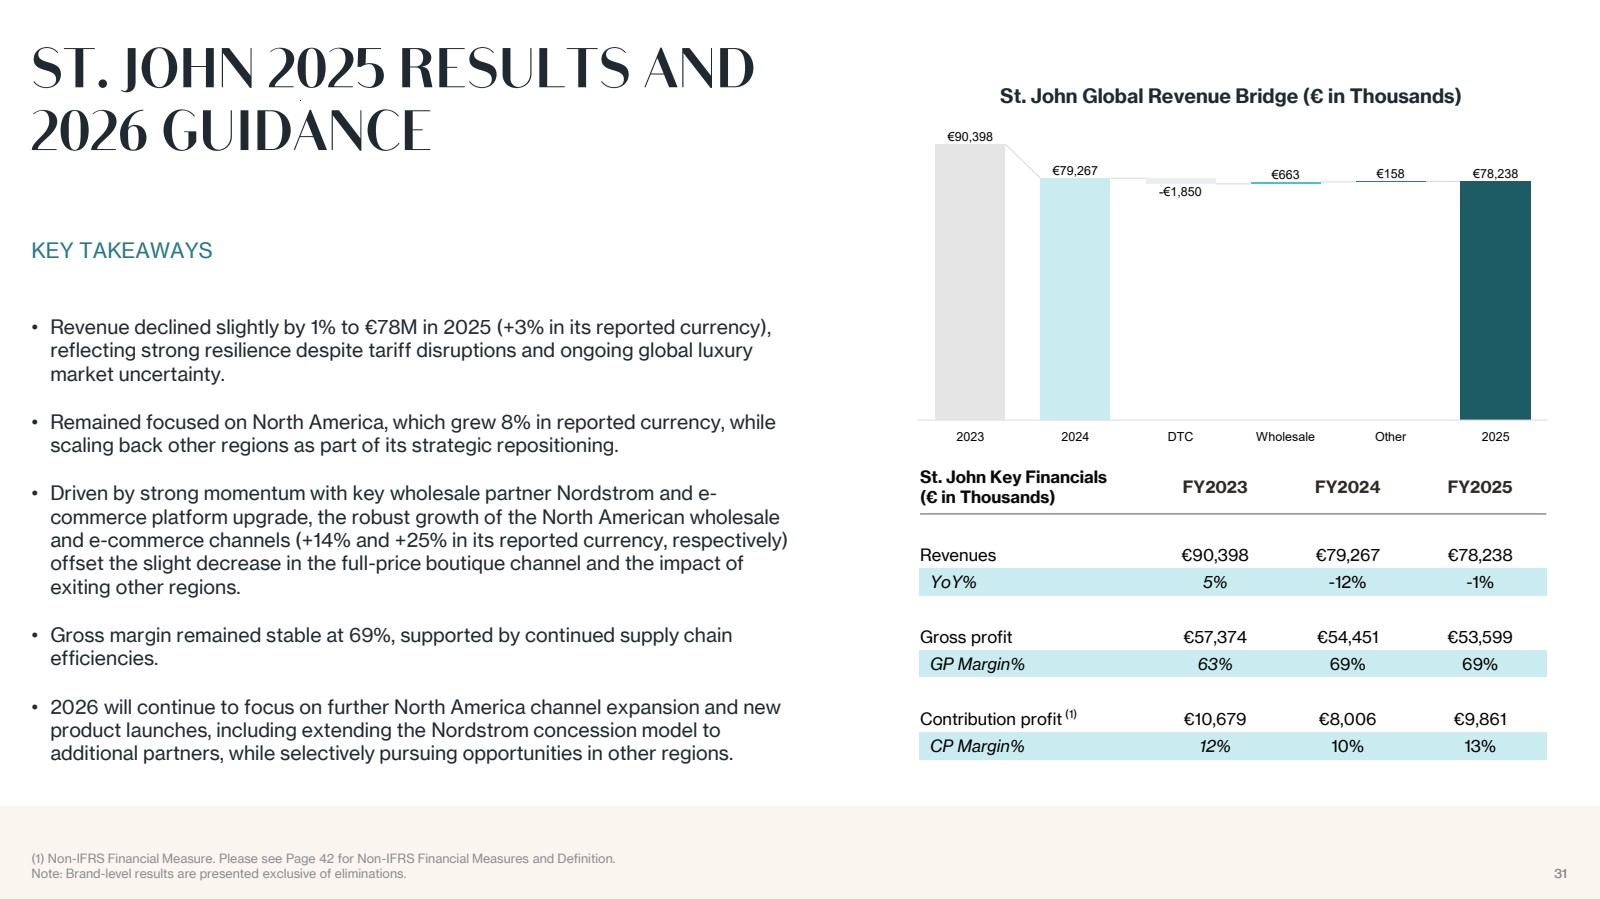
| 31 ST. JOHN 2025 RESULTS AND 2026 GUIDANCE KEY TAKEAWAYS (1) Non-IFRS Financial Measure. Please see Page 42 for Non-IFRS Financial Measures and Definition. Note: Brand-level results are presented exclusive of eliminations. St. John Key Financials (€ in Thousands) FY2023 FY2024 FY2025 Revenues €90,398 €79,267 €78,238 YoY% 5% -12% -1% Gross profit €57,374 €54,451 €53,599 GP Margin% 63% 69% 69% Contribution profit (1) €10,679 €8,006 €9,861 CP Margin% 12% 10% 13% • Revenue declined slightly by 1% to €78M in 2025 (+3% in its reported currency), reflecting strong resilience despite tariff disruptions and ongoing global luxury market uncertainty. • Remained focused on North America, which grew 8% in reported currency, while scaling back other regions as part of its strategic repositioning. • Driven by strong momentum with key wholesale partner Nordstrom and e-commerce platform upgrade, the robust growth of the North American wholesale and e-commerce channels (+14% and +25% in its reported currency, respectively) offset the slight decrease in the full-price boutique channel and the impact of exiting other regions. • Gross margin remained stable at 69%, supported by continued supply chain efficiencies. • 2026 will continue to focus on further North America channel expansion and new product launches, including extending the Nordstrom concession model to additional partners, while selectively pursuing opportunities in other regions. €90,398 €79,267 -€1,850 €663 €158 €78,238 2023 2024 DTC Wholesale Other 2025 St. John Global Revenue Bridge (€ in Thousands) |
| APPENDIX |

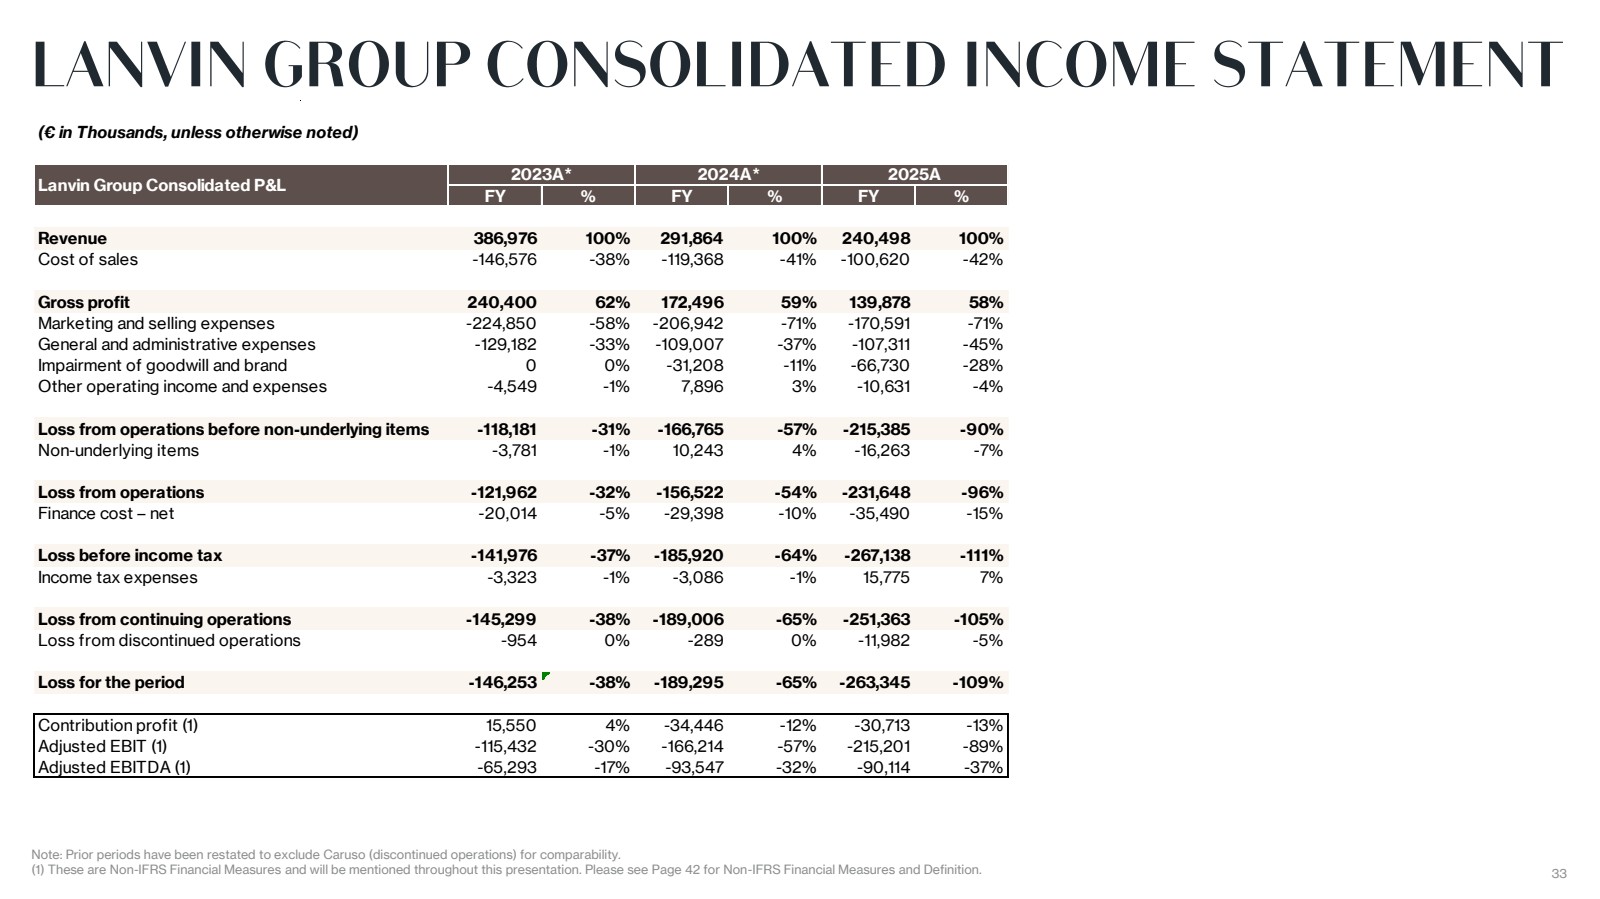
| 33 Note: Prior periods have been restated to exclude Caruso (discontinued operations) for comparability. (1) These are Non-IFRS Financial Measures and will be mentioned throughout this presentation. Please see Page 42 for Non-IFRS Financial Measures and Definition. LANVIN GROUP CONSOLIDATED INCOME STATEMENT (€ in Thousands, unless otherwise noted) FY % FY % FY % Revenue 386,976 100% 291,864 100% 240,498 100% Cost of sales -146,576 -38% -119,368 -41% -100,620 -42% Gross profit 240,400 62% 172,496 59% 139,878 58% Marketing and selling expenses -224,850 -58% -206,942 -71% -170,591 -71% General and administrative expenses -129,182 -33% -109,007 -37% -107,311 -45% Impairment of goodwill and brand 0 0 % -31,208 -11% -66,730 -28% Other operating income and expenses -4,549 -1% 7,896 3% -10,631 -4% Loss from operations before non-underlying items -118,181 -31% -166,765 -57% -215,385 -90% Non-underlying items -3,781 -1% 10,243 4% -16,263 -7% Loss from operations -121,962 -32% -156,522 -54% -231,648 -96% Finance cost – net -20,014 -5% -29,398 -10% -35,490 -15% Loss before income tax -141,976 -37% -185,920 -64% -267,138 -111% Income tax expenses -3,323 -1% -3,086 -1% 15,775 7% Loss from continuing operations -145,299 -38% -189,006 -65% -251,363 -105% Loss from discontinued operations -954 0 % -289 0 % -11,982 -5% Loss for the period -146,253 -38% -189,295 -65% -263,345 -109% Contribution profit (1) 15,550 4% -34,446 -12% -30,713 -13% Adjusted EBIT (1) -115,432 -30% -166,214 -57% -215,201 -89% Adjusted EBITDA (1) -65,293 -17% -93,547 -32% -90,114 -37% 2025A Lanvin Group Consolidated P&L 2023A* 2024A* |
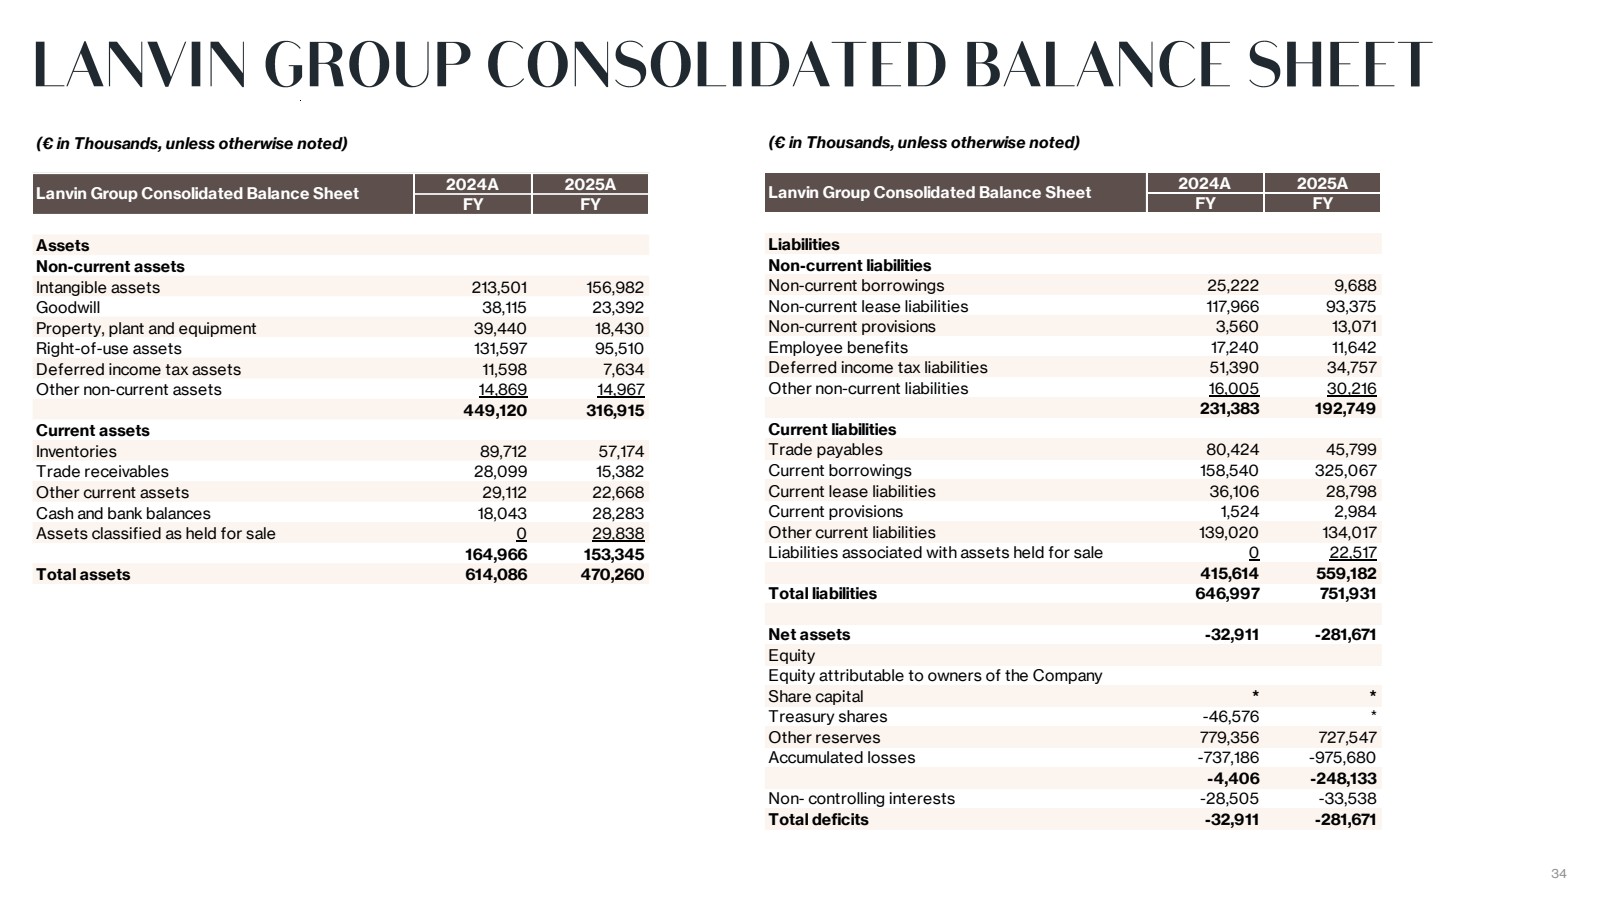
| 34 LANVIN GROUP CONSOLIDATED BALANCE SHEET (€ in Thousands, unless otherwise noted) 2024A 2025A FY FY Assets Non-current assets Intangible assets 213,501 156,982 Goodwill 38,115 23,392 Property, plant and equipment 39,440 18,430 Right-of-use assets 131,597 95,510 Deferred income tax assets 11,598 7,634 Other non-current assets 14,869 14,967 449,120 316,915 Current assets Inventories 89,712 57,174 Trade receivables 28,099 15,382 Other current assets 29,112 22,668 Cash and bank balances 18,043 28,283 Assets classified as held for sale 0 29,838 164,966 153,345 Total assets 614,086 470,260 Lanvin Group Consolidated Balance Sheet (€ in Thousands, unless otherwise noted) 2024A 2025A FY FY Liabilities Non-current liabilities Non-current borrowings 25,222 9,688 Non-current lease liabilities 117,966 93,375 Non-current provisions 3,560 13,071 Employee benefits 17,240 11,642 Deferred income tax liabilities 51,390 34,757 Other non-current liabilities 16,005 30,216 231,383 192,749 Current liabilities Trade payables 80,424 45,799 Current borrowings 158,540 325,067 Current lease liabilities 36,106 28,798 Current provisions 1,524 2,984 Other current liabilities 139,020 134,017 Liabilities associated with assets held for sale 0 22,517 415,614 559,182 Total liabilities 646,997 751,931 Net assets -32,911 -281,671 Equity Equity attributable to owners of the Company Share capital * * Treasury shares -46,576 * Other reserves 779,356 727,547 Accumulated losses -737,186 -975,680 -4,406 -248,133 Non- controlling interests -28,505 -33,538 Total deficits -32,911 -281,671 Lanvin Group Consolidated Balance Sheet |
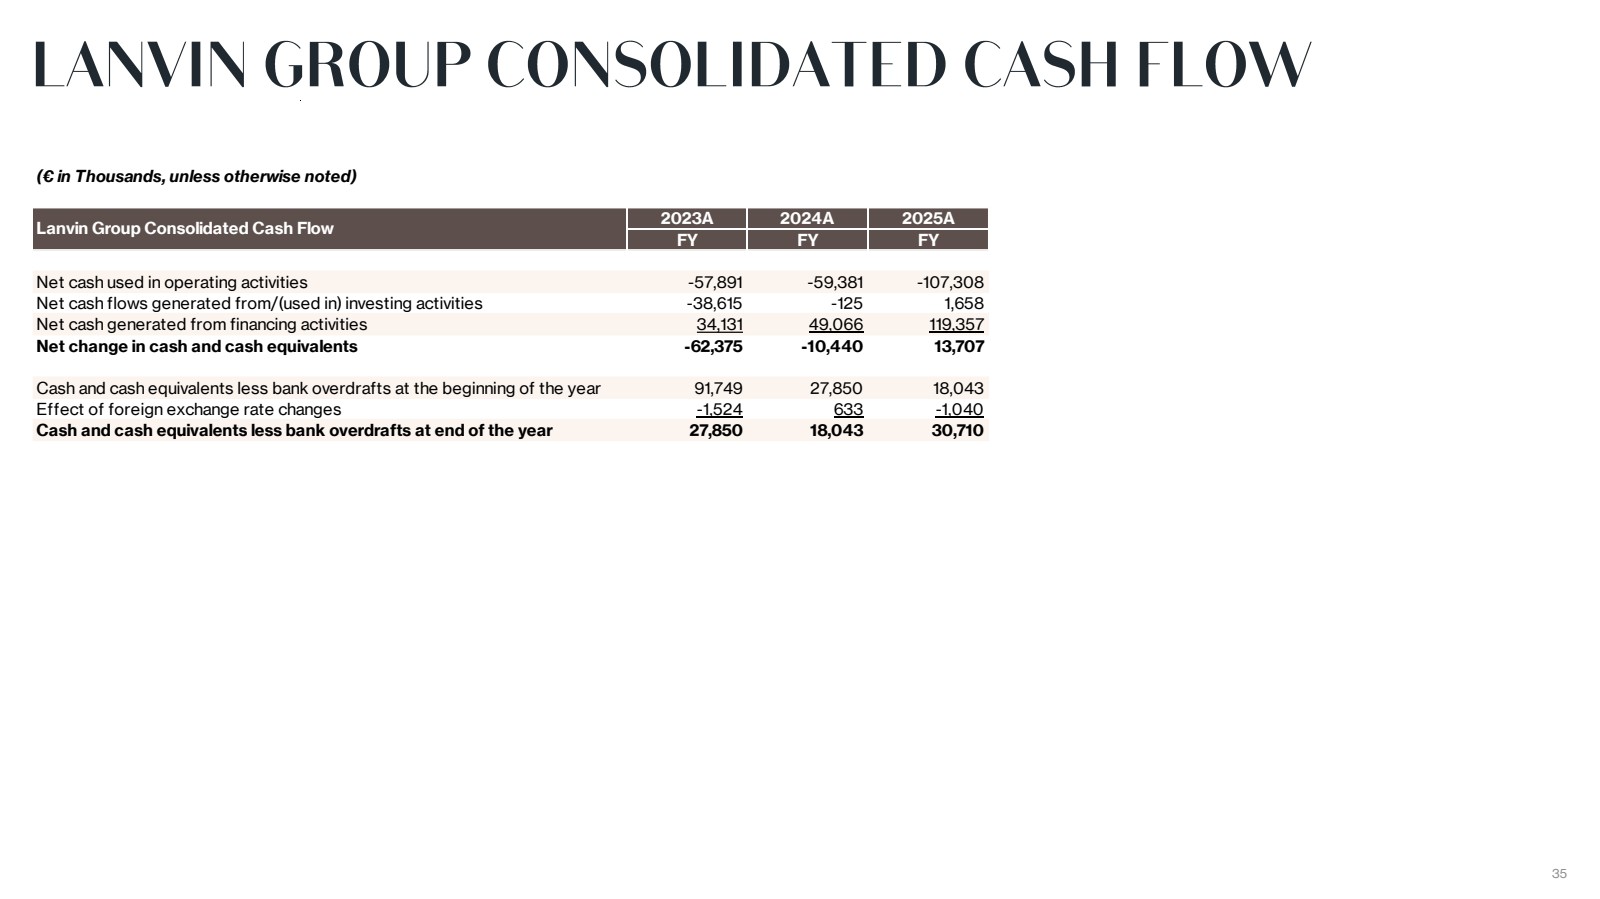
| 35 LANVIN GROUP CONSOLIDATED CASH FLOW (€ in Thousands, unless otherwise noted) 2023A 2024A 2025A FY FY FY Net cash used in operating activities -57,891 -59,381 -107,308 Net cash flows generated from/(used in) investing activities -38,615 -125 1,658 Net cash generated from financing activities 34,131 49,066 119,357 Net change in cash and cash equivalents -62,375 -10,440 13,707 Cash and cash equivalents less bank overdrafts at the beginning of the year 91,749 27,850 18,043 Effect of foreign exchange rate changes -1,524 633 -1,040 Cash and cash equivalents less bank overdrafts at end of the year 27,850 18,043 30,710 Lanvin Group Consolidated Cash Flow |
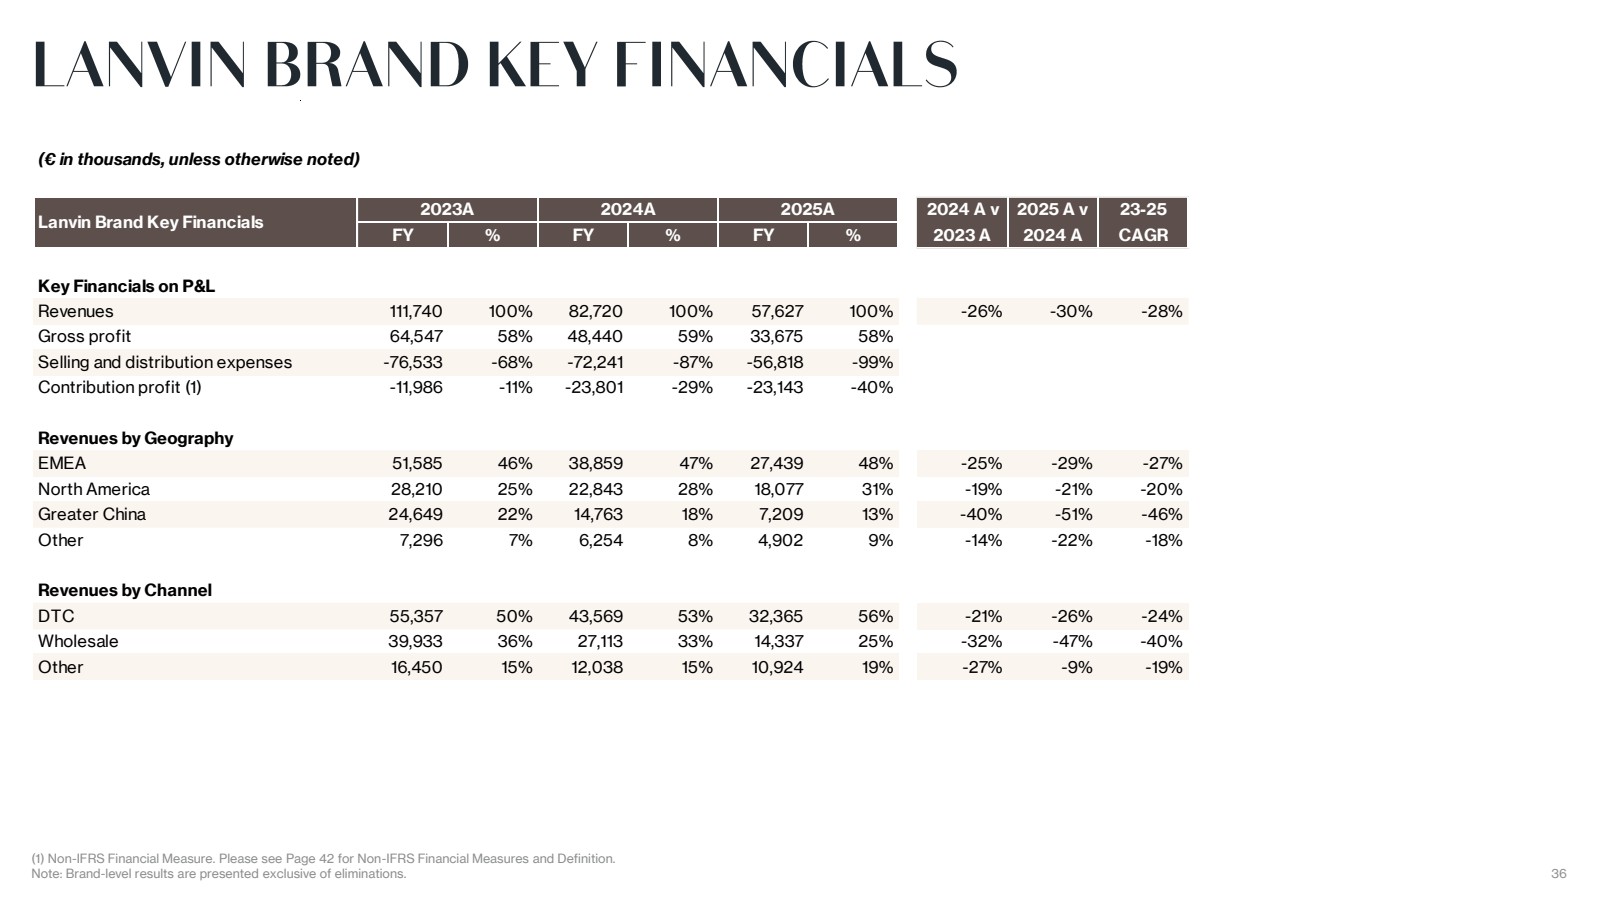
| 36 LANVIN BRAND KEY FINANCIALS (1) Non-IFRS Financial Measure. Please see Page 42 for Non-IFRS Financial Measures and Definition. Note: Brand-level results are presented exclusive of eliminations. (€ in thousands, unless otherwise noted) 2024 A v 2025 A v 23-25 FY % FY % FY % 2023 A 2024 A CAGR Key Financials on P&L Revenues 111,740 100% 82,720 100% 57,627 100% -26% -30% -28% Gross profit 64,547 58% 48,440 59% 33,675 58% Selling and distribution expenses -76,533 -68% -72,241 -87% -56,818 -99% Contribution profit (1) -11,986 -11% -23,801 -29% -23,143 -40% Revenues by Geography EMEA 51,585 46% 38,859 47% 27,439 48% -25% -29% -27% North America 28,210 25% 22,843 28% 18,077 31% -19% -21% -20% Greater China 24,649 22% 14,763 18% 7,209 13% -40% -51% -46% Other 7,296 7% 6,254 8% 4,902 9% -14% -22% -18% Revenues by Channel DTC 55,357 50% 43,569 53% 32,365 56% -21% -26% -24% Wholesale 39,933 36% 27,113 33% 14,337 25% -32% -47% -40% Other 16,450 15% 12,038 15% 10,924 19% -27% -9% -19% 2025A Lanvin Brand Key Financials 2023A 2024A |
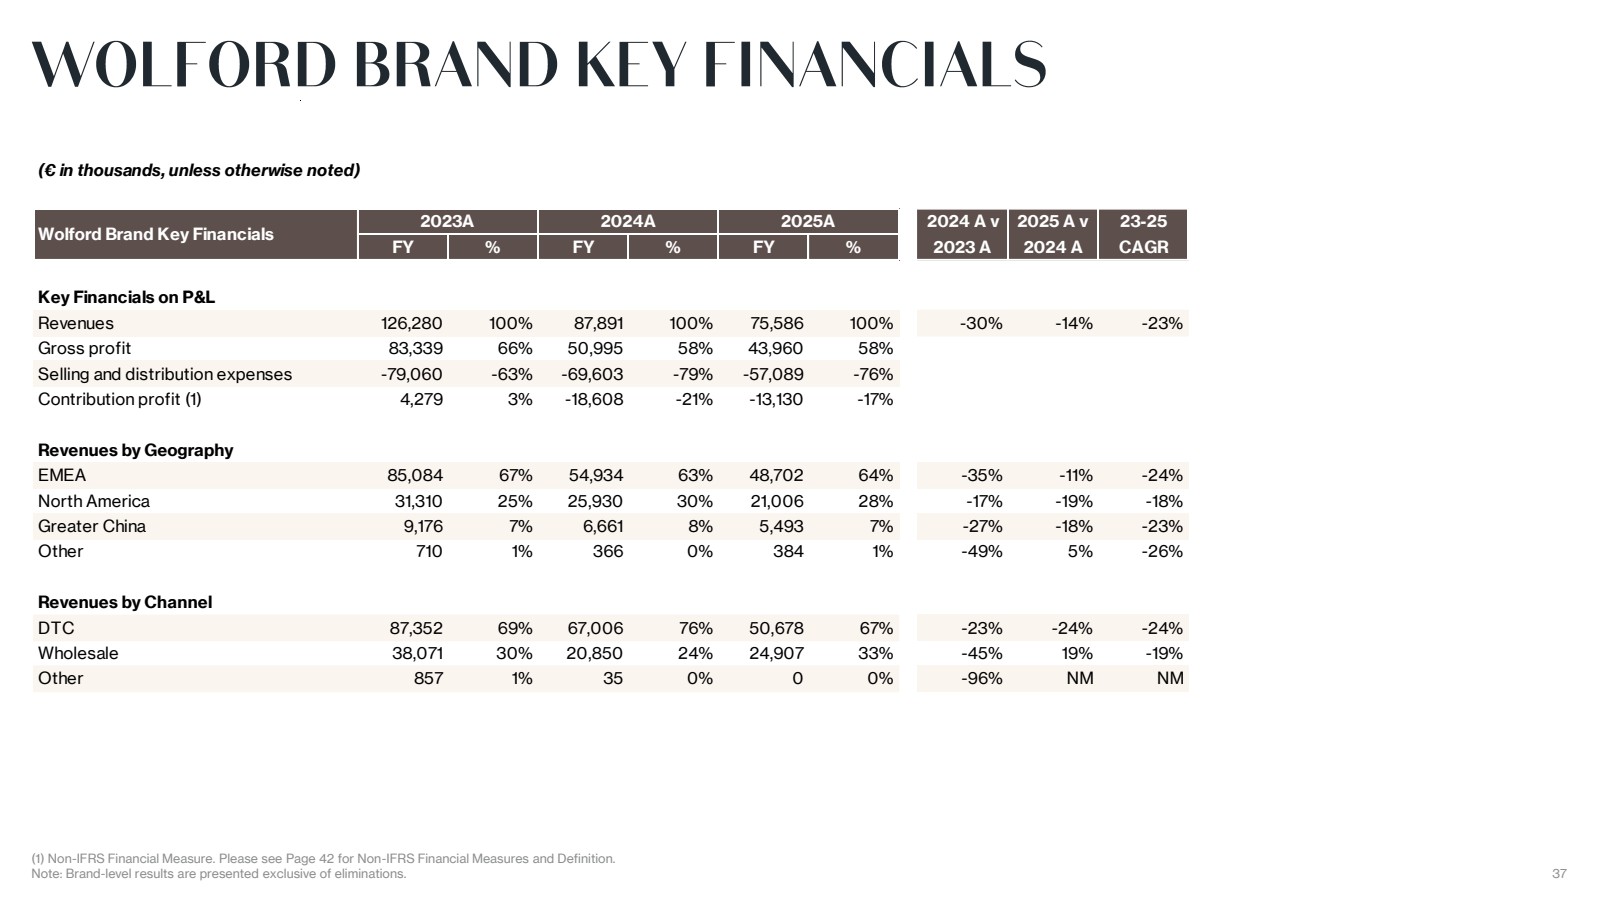
| 37 WOLFORD BRAND KEY FINANCIALS (1) Non-IFRS Financial Measure. Please see Page 42 for Non-IFRS Financial Measures and Definition. Note: Brand-level results are presented exclusive of eliminations. (€ in thousands, unless otherwise noted) 2024 A v 2025 A v 23-25 FY % FY % FY % 2023 A 2024 A CAGR Key Financials on P&L Revenues 126,280 100% 87,891 100% 75,586 100% -30% -14% -23% Gross profit 83,339 66% 50,995 58% 43,960 58% Selling and distribution expenses -79,060 -63% -69,603 -79% -57,089 -76% Contribution profit (1) 4,279 3% -18,608 -21% -13,130 -17% Revenues by Geography EMEA 85,084 67% 54,934 63% 48,702 64% -35% -11% -24% North America 31,310 25% 25,930 30% 21,006 28% -17% -19% -18% Greater China 9,176 7% 6,661 8% 5,493 7% -27% -18% -23% Other 710 1% 366 0 % 384 1% -49% 5 % -26% Revenues by Channel DTC 87,352 69% 67,006 76% 50,678 67% -23% -24% -24% Wholesale 38,071 30% 20,850 24% 24,907 33% -45% 19% -19% Other 857 1% 35 0 % 0 0 % -96% N M N M 2025A Wolford Brand Key Financials 2023A 2024A |
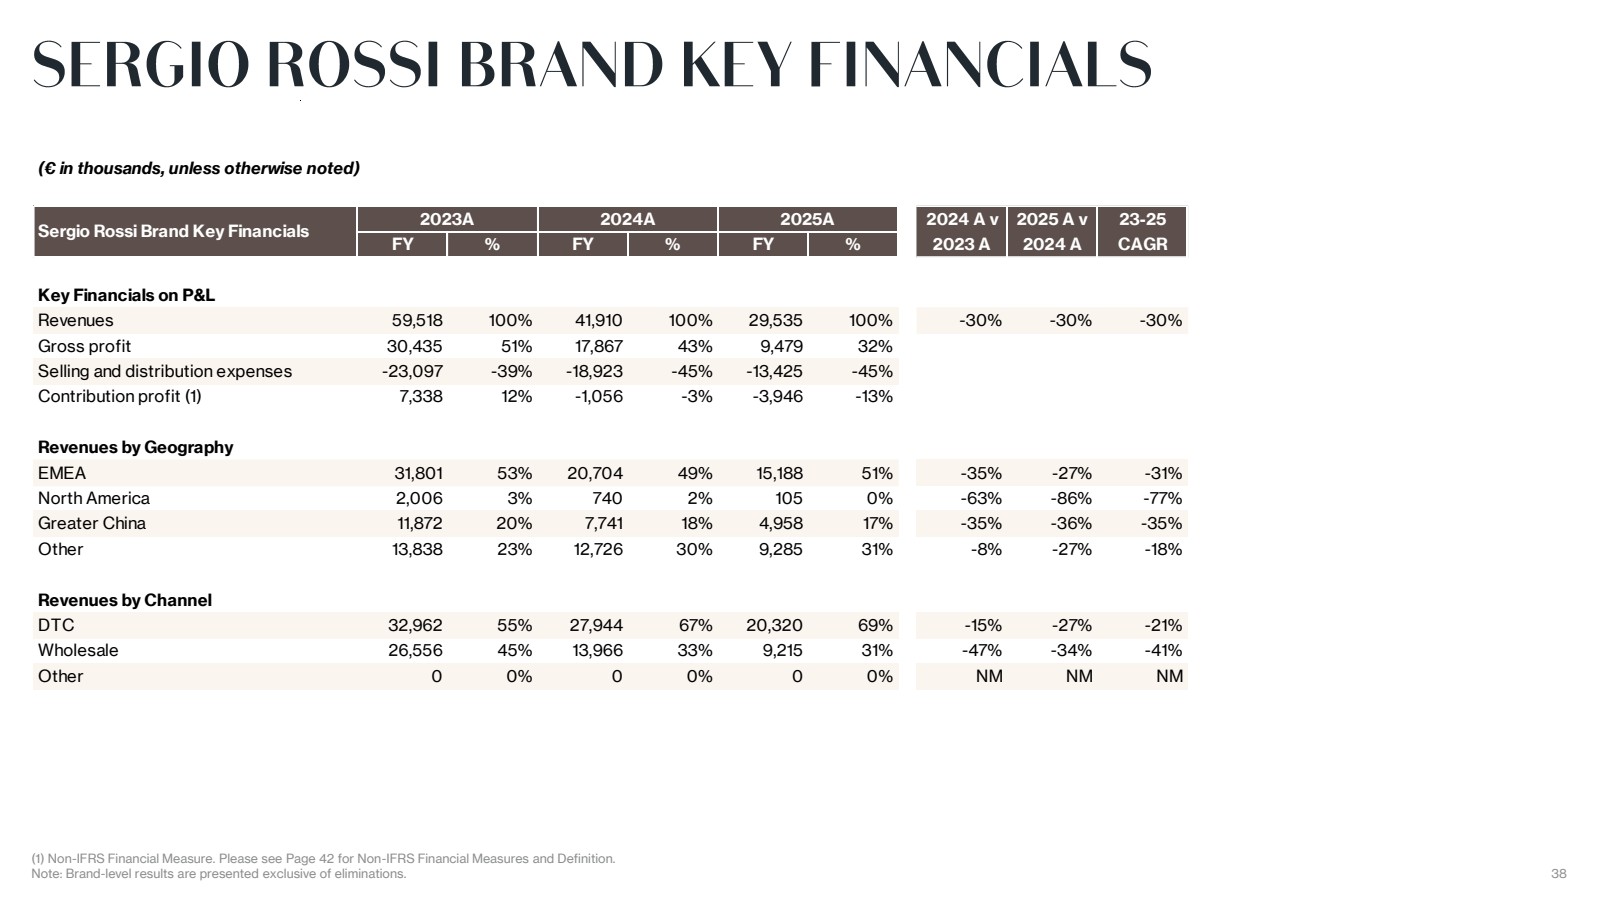
| 38 SERGIO ROSSI BRAND KEY FINANCIALS (1) Non-IFRS Financial Measure. Please see Page 42 for Non-IFRS Financial Measures and Definition. Note: Brand-level results are presented exclusive of eliminations. (€ in thousands, unless otherwise noted) 2024 A v 2025 A v 23-25 FY % FY % FY % 2023 A 2024 A CAGR Key Financials on P&L Revenues 59,518 100% 41,910 100% 29,535 100% -30% -30% -30% Gross profit 30,435 51% 17,867 43% 9,479 32% Selling and distribution expenses -23,097 -39% -18,923 -45% -13,425 -45% Contribution profit (1) 7,338 12% -1,056 -3% -3,946 -13% Revenues by Geography EMEA 31,801 53% 20,704 49% 15,188 51% -35% -27% -31% North America 2,006 3% 740 2 % 105 0 % -63% -86% -77% Greater China 11,872 20% 7,741 18% 4,958 17% -35% -36% -35% Other 13,838 23% 12,726 30% 9,285 31% -8% -27% -18% Revenues by Channel DTC 32,962 55% 27,944 67% 20,320 69% -15% -27% -21% Wholesale 26,556 45% 13,966 33% 9,215 31% -47% -34% -41% Other 0 0 % 0 0 % 0 0 % N M N M N M 2025A Sergio Rossi Brand Key Financials 2023A 2024A |
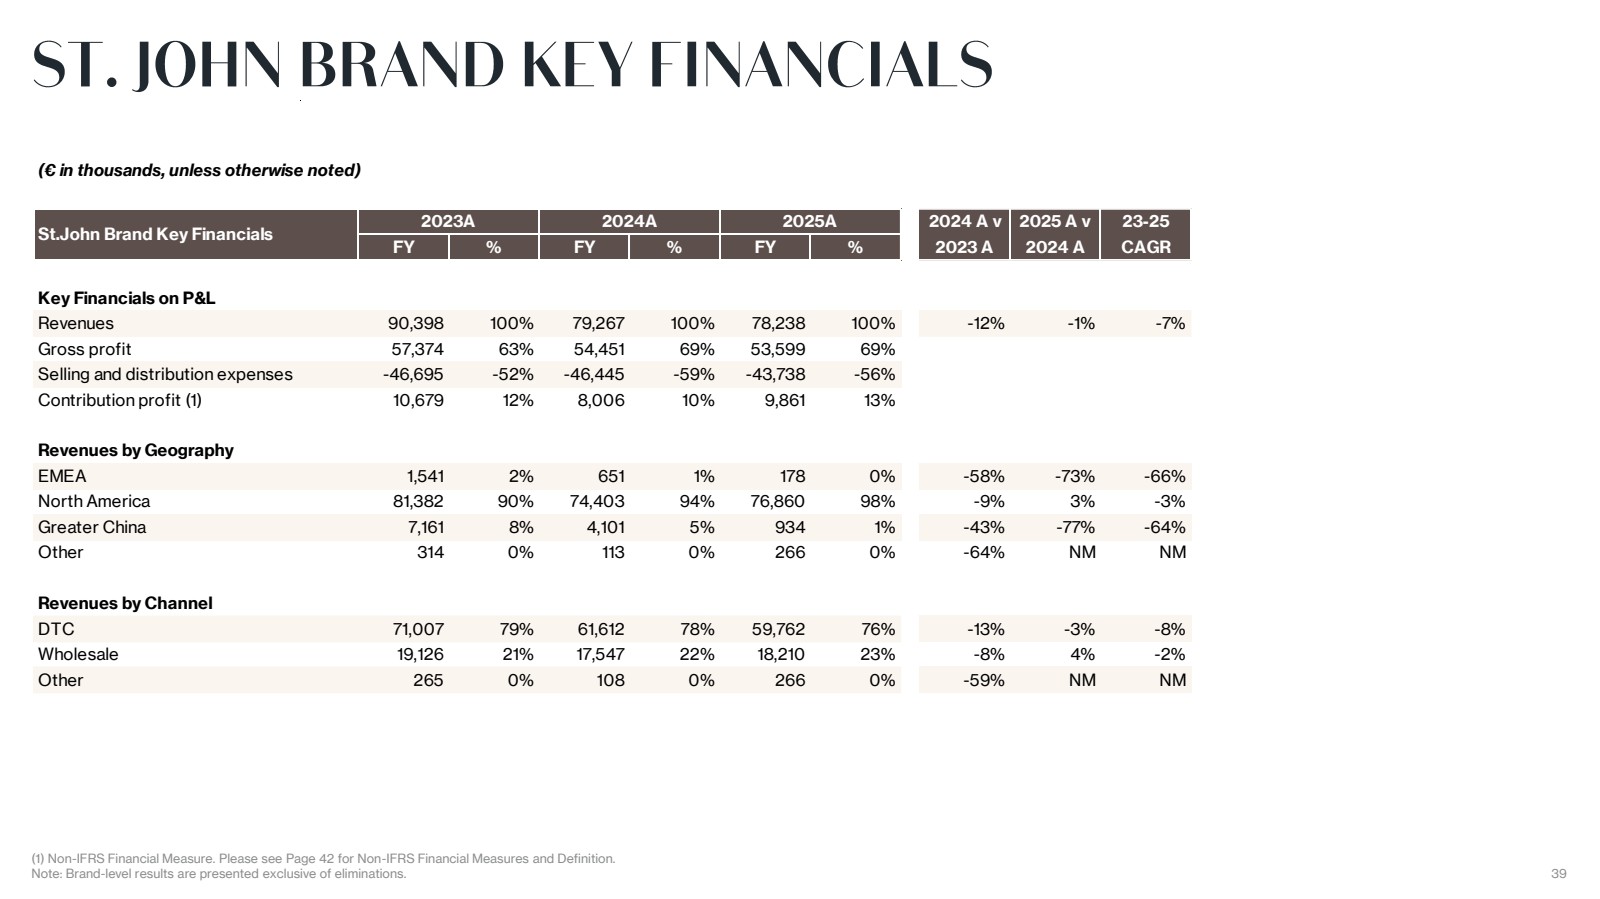
| 39 ST. JOHN BRAND KEY FINANCIALS (1) Non-IFRS Financial Measure. Please see Page 42 for Non-IFRS Financial Measures and Definition. Note: Brand-level results are presented exclusive of eliminations. (€ in thousands, unless otherwise noted) 2024 A v 2025 A v 23-25 FY % FY % FY % 2023 A 2024 A CAGR Key Financials on P&L Revenues 90,398 100% 79,267 100% 78,238 100% -12% -1% -7% Gross profit 57,374 63% 54,451 69% 53,599 69% Selling and distribution expenses -46,695 -52% -46,445 -59% -43,738 -56% Contribution profit (1) 10,679 12% 8,006 10% 9,861 13% Revenues by Geography EMEA 1,541 2 % 651 1% 178 0 % -58% -73% -66% North America 81,382 90% 74,403 94% 76,860 98% -9% 3% -3% Greater China 7,161 8% 4,101 5 % 934 1% -43% -77% -64% Other 314 0 % 113 0 % 266 0 % -64% N M N M Revenues by Channel DTC 71,007 79% 61,612 78% 59,762 76% -13% -3% -8% Wholesale 19,126 21% 17,547 22% 18,210 23% -8% 4% -2% Other 265 0 % 108 0 % 266 0 % -59% N M N M 2025A St.John Brand Key Financials 2023A 2024A |
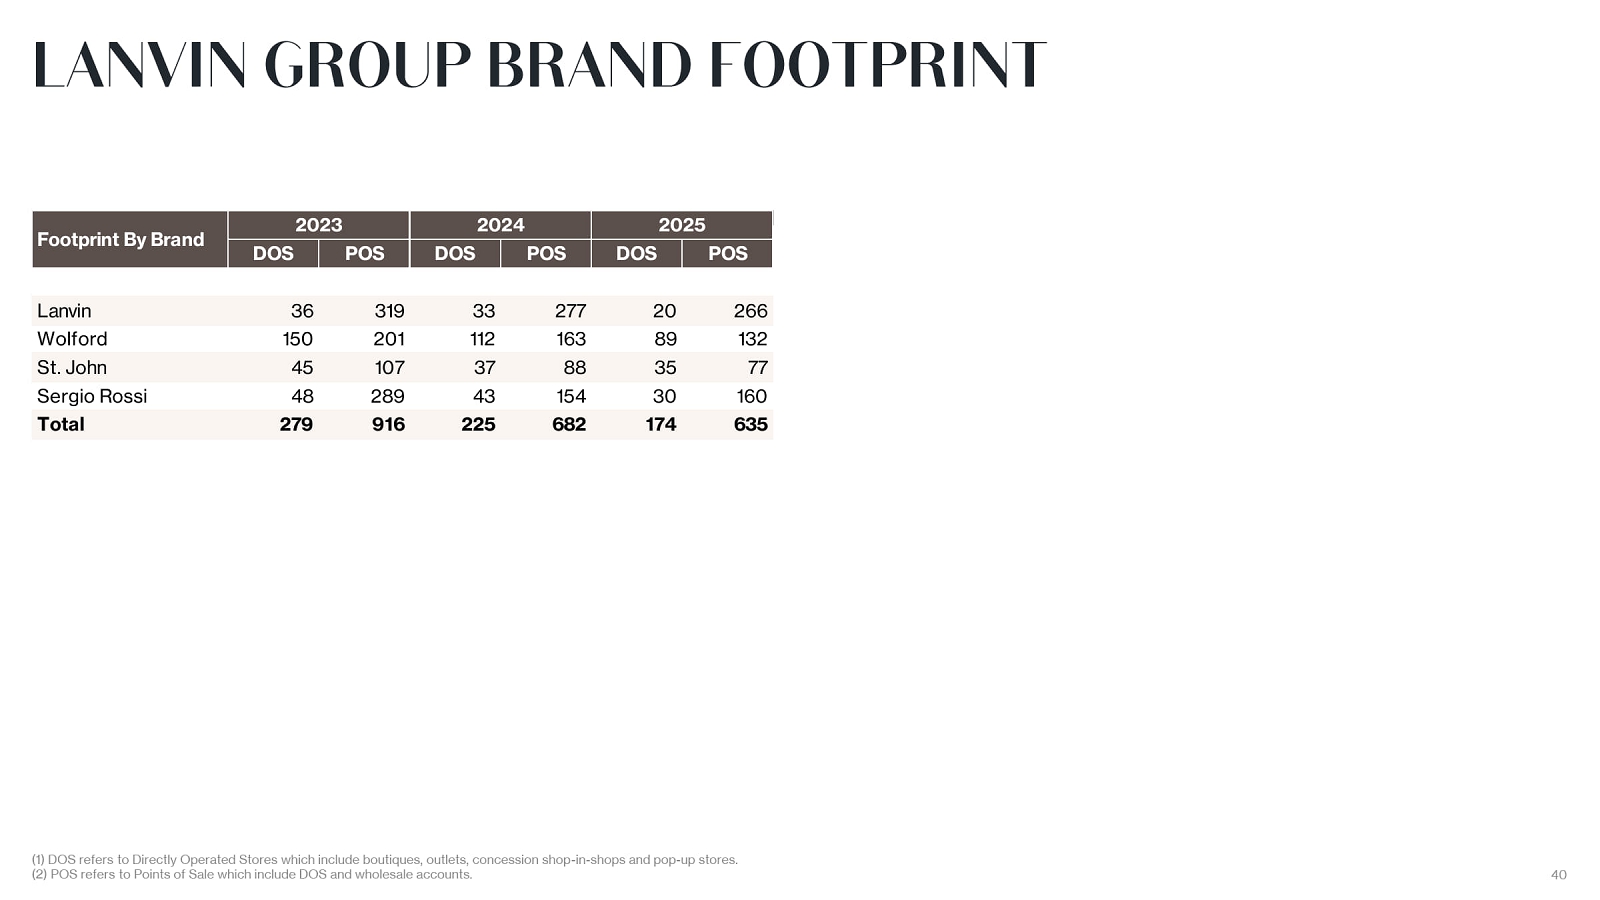
| 40 LANVIN GROUP BRAND FOOTPRINT (1) DOS refers to Directly Operated Stores which include boutiques, outlets, concession shop-in-shops and pop-up stores. (2) POS refers to Point of Sales which include DOS and wholesale accounts. (1) (2) (1) (2) DOS POS DOS POS DOS POS Lanvin 36 319 33 277 20 266 Wolford 150 201 112 163 89 132 St. John 45 107 37 88 35 77 Sergio Rossi 48 289 43 154 30 160 Total 279 916 225 682 174 635 2025 Footprint By Brand 2023 2024 |
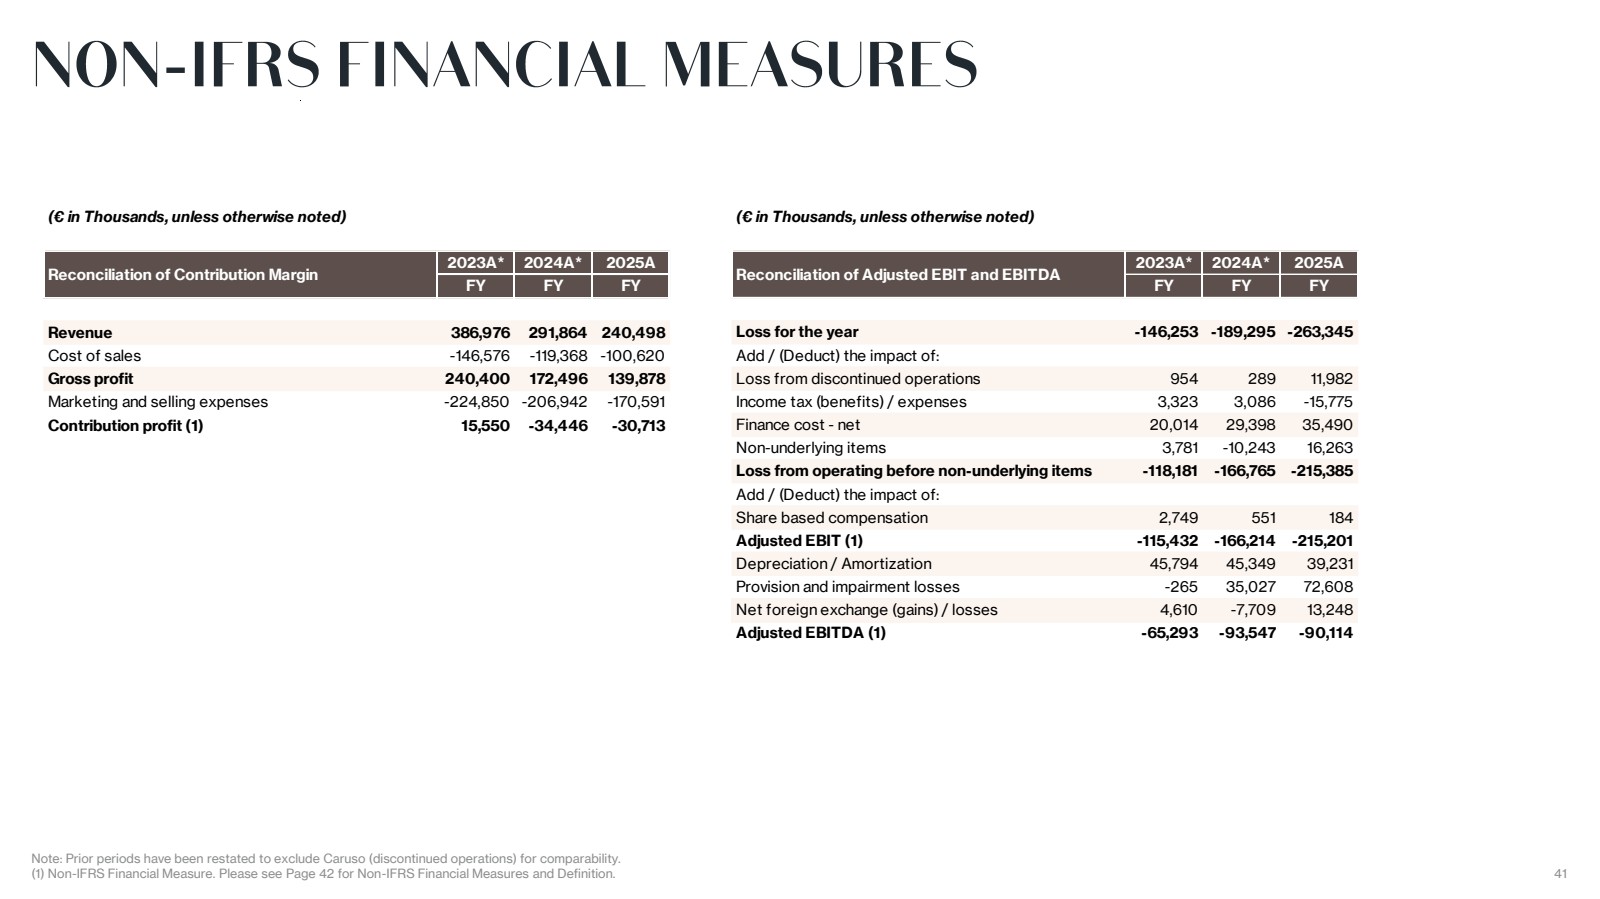
| 41 NON-IFRS FINANCIAL MEASURES Note: Prior periods have been restated to exclude Caruso (discontinued operations) for comparability. (1) Non-IFRS Financial Measure. Please see Page 42 for Non-IFRS Financial Measures and Definition. (€ in Thousands, unless otherwise noted) 2023A* 2024A* 2025A FY FY FY Revenue 386,976 291,864 240,498 Cost of sales -146,576 -119,368 -100,620 Gross profit 240,400 172,496 139,878 Marketing and selling expenses -224,850 -206,942 -170,591 Contribution profit (1) 15,550 -34,446 -30,713 Reconciliation of Contribution Margin (€ in Thousands, unless otherwise noted) 2023A* 2024A* 2025A FY FY FY Loss for the year -146,253 -189,295 -263,345 Add / (Deduct) the impact of: Loss from discontinued operations 954 289 11,982 Income tax (benefits) / expenses 3,323 3,086 -15,775 Finance cost - net 20,014 29,398 35,490 Non-underlying items 3,781 -10,243 16,263 Loss from operating before non-underlying items -118,181 -166,765 -215,385 Add / (Deduct) the impact of: Share based compensation 2,749 551 184 Adjusted EBIT (1) -115,432 -166,214 -215,201 Depreciation / Amortization 45,794 45,349 39,231 Provision and impairment losses -265 35,027 72,608 Net foreign exchange (gains) / losses 4,610 -7,709 13,248 Adjusted EBITDA (1) -65,293 -93,547 -90,114 Reconciliation of Adjusted EBIT and EBITDA |
| 42 Our management monitors and evaluates operating and financial performance using several non-IFRS financial measures including: contribution profit, contribution profit margin, Adjusted EBIT and Adjusted EBITDA. Our management believes that these non-IFRS financial measures provide useful and relevant information regarding our performance and improve their ability to assess financial performance and financial position. They also provide comparable measures that facilitate management’s ability to identify operational trends, as well as make decisions regarding future spending, resource allocations and other operational decisions. While similar measures are widely used in the industry in which we operate, the financial measures that we use may not be comparable to other similarly named measures used by other companies nor are they intended to be substitutes for measures of financial performance or financial position as prepared in accordance with IFRS. Contribution profit is defined as revenues less the cost of sales and selling and marketing expenses. Contribution profit subtracts the main variable expenses of selling and marketing expenses from gross profit, and our management believes this measure is an important indicator of profitability at the marginal level. Below contribution profit, the main expenses are general administrative expenses and other operating expenses (which include foreign exchange gains or losses and impairment losses). As we continue to improve the management of our portfolio brands, we believe we can achieve greater economy of scale across the different brands by maintaining the fixed expenses at a lower level as a proportion of revenue. We therefore use contribution profit margin as a key indicator of profitability at the group level as well as the portfolio brand level. Contribution profit margin is defined as contribution profit divided by revenues. Adjusted EBIT is defined as profit or loss before income taxes, net finance cost, share based compensation, adjusted for income and costs which are significant in nature and that management considers not reflective of underlying operational activities, mainly including net gains on disposal of long-term assets, negative goodwill from acquisition of Sergio Rossi, gain on debt restructuring and government grants. Adjusted EBITDA is defined as profit or loss before income taxes, net finance cost, exchange gains/(losses), depreciation, amortization, share based compensation and provisions and impairment losses adjusted for income and costs which are significant in nature and that management considers not reflective of underlying operational activities, mainly including net gains on disposal of long-term assets, negative goodwill from acquisition of Sergio Rossi, gain on debt restructuring and government grants. Trade working capital is defined as the sum of inventories as well as trade receivables less trade payables. NON-IFRS FINANCIAL MEASURES AND DEFINITION |