The following performance information provides some indication of the risks of investing in the Fund by showing changes in the Fund’s performance over time. The bar chart shows the annual returns for the Fund year over year. The table illustrates how the Fund’s average annual returns for the 1-year and since inception periods compare with those of a broad measure of market performance. The Fund’s past performance, before and after taxes, does not necessarily indicate how it will perform in the future. Updated performance information is available on the Fund’s website at www.returnstackedetfs.com.
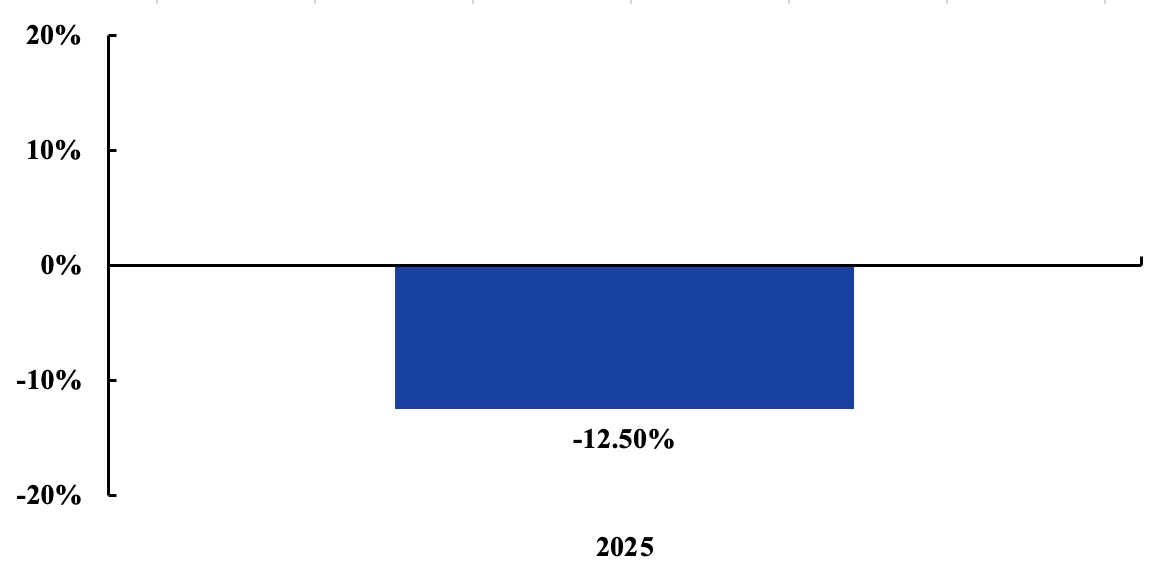
During the period of time shown in the bar chart, the Fund’s highest quarterly return was 2.30% for the quarter ended September 30, 2025 and the lowest quarterly return was -5.73% for the quarter ended June 30, 2025.
The performance information shown above is based on a calendar year. The Fund’s year-to-date return for the period ended March 31, 2026 was 20.60%.
| 1 Year | Since Inception August 20, 2024 | |
| Return Before Taxes | -12.50% | -14.65% |
| Return After Taxes on Distributions | -13.22% | -15.73% |
| Return After Taxes on Distributions and Sale of Fund Shares | -7.40% | -11.49% |
| Bloomberg U.S. Aggregate Bond Index(1) (reflects no deduction for fees, expenses, or taxes) | 7.30% | 3.71% |
| (1) | The Bloomberg U.S. Aggregate Bond Index is a broad-based flagship benchmark that measures the investment grade, U.S. dollar-denominated, fixed-rate taxable bond market. The index includes U.S. Treasuries, government-related and corporate securities, MBS (agency fixed-rate pass-throughs), ABS and CMBS (agency and non-agency). |
After-tax returns are calculated using the historical highest individual federal marginal income tax rates during the period covered by the table above and do not reflect the impact of state and local taxes. Actual after-tax returns depend on an investors’ tax situation and may differ from those shown. After-tax returns shown are not relevant to investors who hold their Shares through tax-deferred or other tax-advantaged arrangements such as an individual retirement account (“IRA”). In certain cases, the figures representing “Return After Taxes on Distributions and Sale of Fund Shares” may be higher than the other figures for the same period. A higher after-tax return results when a capital loss occurs upon redemption and provides an assumed tax deduction that benefits the investor.
The following performance information provides some indication of the risks of investing in the Fund by showing changes in the Fund’s performance over time. The bar chart shows the annual returns for the Fund year over year. The table illustrates how the Fund’s average annual returns for the 1-year and since inception periods compare with those of a broad measure of market performance. The Fund’s past performance, before and after taxes, does not necessarily indicate how it will perform in the future. Updated performance information is available on the Fund’s website at www.returnstackedetfs.com.
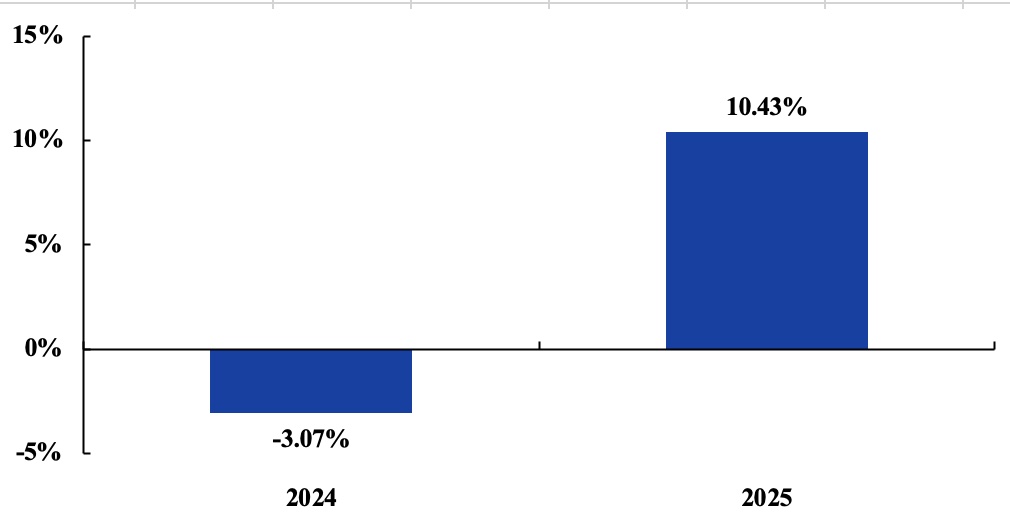
During the period of time shown in the bar chart, the Fund’s highest quarterly return was 6.51% for the quarter ended December 31, 2025 and the lowest quarterly return was -7.36% for the quarter ended December 31, 2024.
The performance information shown above is based on a calendar year. The Fund’s year-to-date return for the period ended March 31, 2026 was 4.91%.
| 1 Year | Since Inception February 7, 2023 | |
| Return Before Taxes | 10.43% | -1.81% |
| Return After Taxes on Distributions | 9.04% | -2.55% |
| Return After Taxes on Distributions and Sale of Fund Shares | 6.18% | -1.68% |
| Bloomberg U.S. Aggregate Bond Index(1) (reflects no deduction for fees, expenses, or taxes) | 7.30% | 4.06% |
| (1) | The Bloomberg U.S. Aggregate Bond Index is a broad-based flagship benchmark that measures the investment grade, U.S. dollar-denominated, fixed-rate taxable bond market. The index includes U.S. Treasuries, government-related and corporate securities, MBS (agency fixed-rate pass-throughs), ABS and CMBS (agency and non-agency). |
After-tax returns are calculated using the historical highest individual federal marginal income tax rates during the period covered by the table above and do not reflect the impact of state and local taxes. Actual after-tax returns depend on an investors tax situation and may differ from those shown. After-tax returns shown are not relevant to investors who hold their Shares through tax-deferred or other tax-advantaged arrangements such as an individual retirement account (“IRA”). In certain cases, the figures representing “Return After Taxes on Distributions and Sale of Fund Shares” may be higher than the other figures for the same period. A higher after-tax return results when a capital loss occurs upon redemption and provides an assumed tax deduction that benefits the investor.
The following performance information provides some indication of the risks of investing in the Fund by showing changes in the Fund’s performance over time. The bar chart shows the annual returns for the Fund year over year. The table illustrates how the Fund’s average annual returns for the 1-year and since inception periods compare with those of a broad measure of market performance. The Fund’s past performance, before and after taxes, does not necessarily indicate how it will perform in the future. Updated performance information is available on the Fund’s website at www.returnstackedetfs.com.
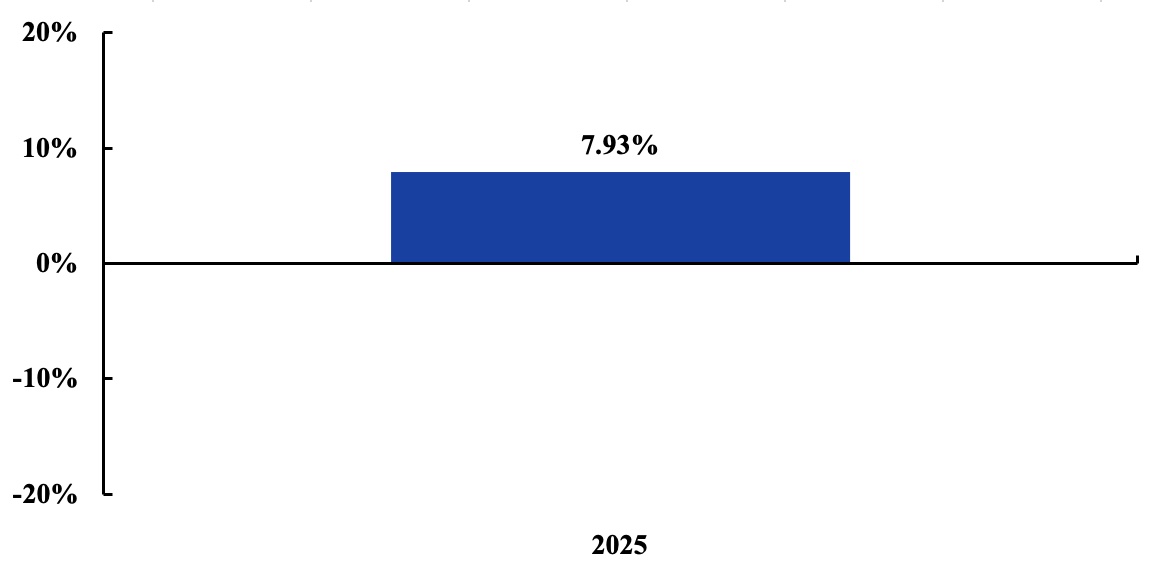
During the period of time shown in the bar chart, the Fund’s highest quarterly return was 2.90% for the quarter ended March 31, 2025 and the lowest quarterly return was 1.27% for the quarter ended December 31, 2025.
The performance information shown above is based on a calendar year. The Fund’s year-to-date return for the period ended March 31, 2026 was -0.67%.
| 1 Year | Since Inception December 17, 2024 | |
| Return Before Taxes | 7.93% | 7.68% |
| Return After Taxes on Distributions | 6.60% | 6.38% |
| Return After Taxes on Distributions and Sale of Fund Shares | 4.79% | 5.36% |
| Bloomberg U.S. Treasury Index(1) (reflects no deduction for fees, expenses, or taxes) | 6.32% | 5.37% |
| S&P 500® Total Return Index(2) (reflects no deduction for fees, expenses, or taxes) | 17.88% | 14.06% |
| (1) | The Bloomberg U.S. Treasury Index is a benchmark that tracks the performance of U.S. dollar-denominated, fixed-rate, nominal debt issued by the U.S. Treasury. |
| (2) | The S&P 500 Total Return Index is a benchmark that tracks the performance of the 500 largest publicly traded companies in the United States. |
After-tax returns are calculated using the historical highest individual federal marginal income tax rates during the period covered by the table above and do not reflect the impact of state and local taxes. Actual after-tax returns depend on an investors’ tax situation and may differ from those shown. After-tax returns shown are not relevant to investors who hold their Shares through tax-deferred or other tax-advantaged arrangements such as an individual retirement account (“IRA”). In certain cases, the figures representing “Return After Taxes on Distributions and Sale of Fund Shares” may be higher than the other figures for the same period. A higher after-tax return results when a capital loss occurs upon redemption and provides an assumed tax deduction that benefits the investor.
The following performance information provides some indication of the risks of investing in the Fund by showing changes in the Fund’s performance over time. The bar chart shows the annual returns for the Fund year over year. The table illustrates how the Fund’s average annual returns for the 1-year and since inception periods compare with those of a broad measure of market performance. The Fund’s past performance, before and after taxes, does not necessarily indicate how it will perform in the future. Updated performance information is available on the Fund’s website at www.returnstackedetfs.com.
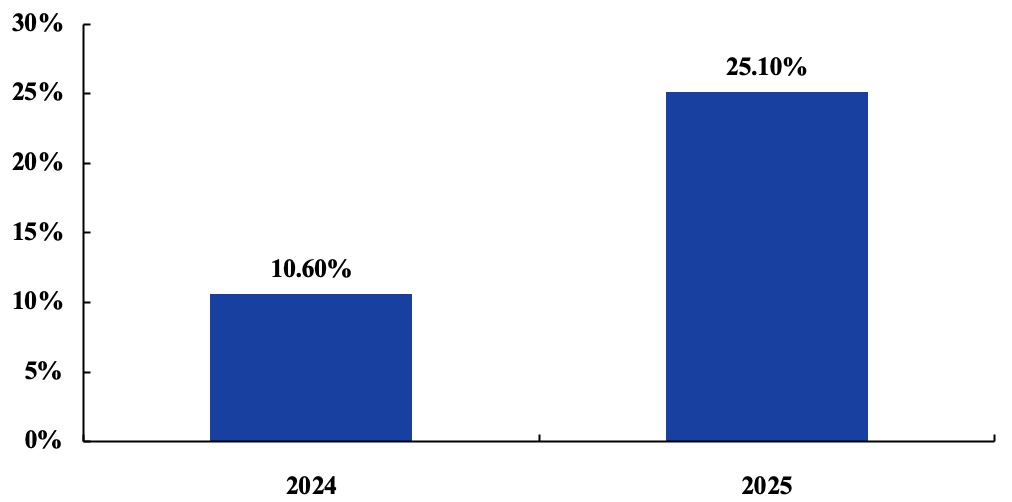
During the period of time shown in the bar chart, the Fund’s highest quarterly return was 11.74% for the quarter ended June 30, 2025 and the lowest quarterly return was -5.59% for the quarter ended December 31, 2024.
The performance information shown above is based on a calendar year. The Fund’s year-to-date return for the period ended March 31, 2026 was -2.88%.
| 1 Year | Since Inception December 4, 2023 | |
| Return Before Taxes | 25.10% | 20.71% |
| Return After Taxes on Distributions | 23.99% | 19.92% |
| Return After Taxes on Distributions and Sale of Fund Shares | 15.47% | 16.01% |
| S&P Composite 1500 Index (reflects no deduction for fees, expenses, or taxes)(1) | 17.02% | 22.28% |
| (1) | The S&P Composite 1500 Index®, is made up of the S&P 500®, S&P MidCap 400®, and S&P 600® Indices, and represents a broad measure of the U.S. equity market |
After-tax returns are calculated using the historical highest individual federal marginal income tax rates during the period covered by the table above and do not reflect the impact of state and local taxes. Actual after-tax returns depend on an investors tax situation and may differ from those shown. After-tax returns shown are not relevant to investors who hold their Shares through tax-deferred or other tax-advantaged arrangements such as an individual retirement account (“IRA”).
The following performance information provides some indication of the risks of investing in the Fund by showing changes in the Fund’s performance over time. The bar chart shows the annual returns for the Fund year over year. The table illustrates how the Fund’s average annual returns for the 1-year and since inception periods compare with those of a broad measure of market performance. The Fund’s past performance, before and after taxes, does not necessarily indicate how it will perform in the future. Updated performance information is available on the Fund’s website at www.returnstackedetfs.com.
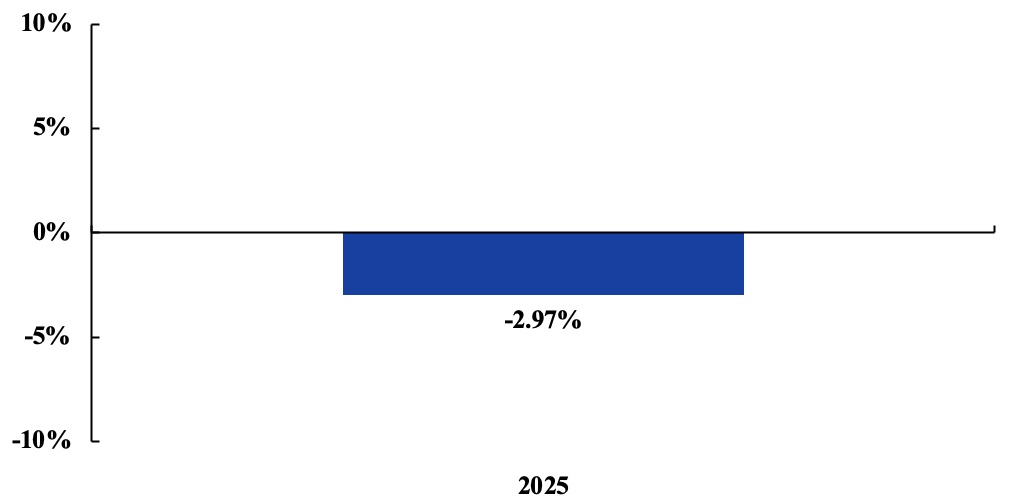
During the period of time shown in the bar chart, the Fund’s highest quarterly return was 8.78% for the quarter ended September 30, 2025 and the lowest quarterly return was -12.02% for the quarter ended March 31, 2025.
The performance information shown above is based on a calendar year. The Fund’s year-to-date return for the period ended March 31, 2026 was 15.51%.
| 1 Year | Since Inception May 28, 2024 | |
| Return Before Taxes | -2.97% | -0.88% |
| Return After Taxes on Distributions | -3.75% | -1.38% |
| Return After Taxes on Distributions and Sale of Fund Shares | -1.75% | -0.88% |
| S&P 500® Total Return Index (reflects no deduction for fees, expenses, or taxes)(1) | 17.88% | 18.87% |
| (1) | The S&P 500® Total Return Index is a benchmark that tracks the performance of the 500 largest publicly traded companies in the United States. |
After-tax returns are calculated using the historical highest individual federal marginal income tax rates during the period covered by the table above and do not reflect the impact of state and local taxes. Actual after-tax returns depend on an investors’ tax situation and may differ from those shown. After-tax returns shown are not relevant to investors who hold their Shares through tax-deferred or other tax-advantaged arrangements such as an individual retirement account (“IRA”). In certain cases, the figures representing “Return After Taxes on Distributions and Sale of Fund Shares” may be higher than the other figures for the same period. A higher after-tax return results when a capital loss occurs upon redemption and provides an assumed tax deduction that benefits the investor.
The following performance information provides some indication of the risks of investing in the Fund by showing changes in the Fund’s performance over time. The bar chart shows the annual returns for the Fund year over year. The table illustrates how the Fund’s average annual returns for the 1-year and since inception periods compare with those of a broad measure of market performance. The Fund’s past performance, before and after taxes, does not necessarily indicate how it will perform in the future. Updated performance information is available on the Fund’s website at www.returnstackedetfs.com.
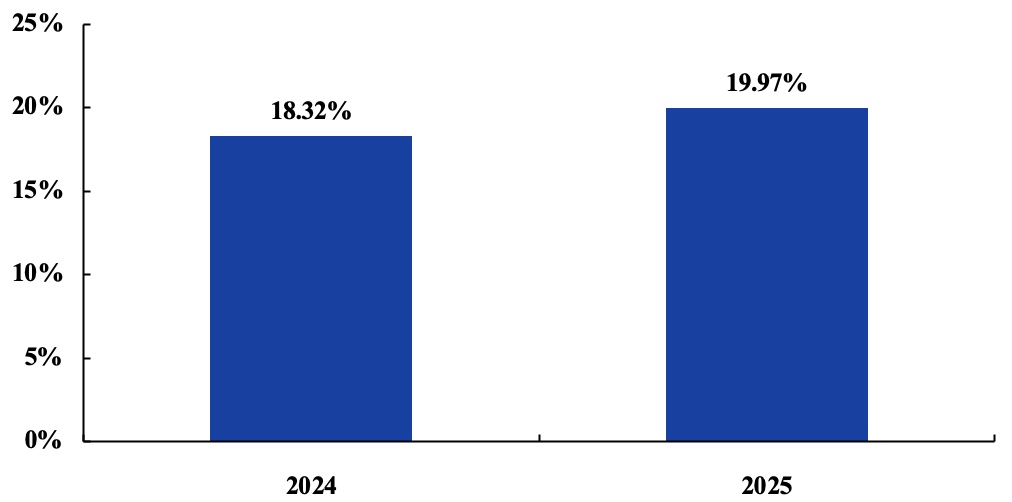
During the period of time shown in the bar chart, the Fund’s highest quarterly return was 15.75% for the quarter ended March 31, 2024 and the lowest quarterly return was -7.37% for the quarter ended March 31, 2025.
The performance information shown above is based on a calendar year. The Fund’s year-to-date return for the period ended March 31, 2026 was 0.09%.
| 1 Year | Since Inception September 5, 2023 | |
| Return Before Taxes | 19.97% | 17.17% |
| Return After Taxes on Distributions | 19.62% | 16.85% |
| Return After Taxes on Distributions and Sale of Fund Shares | 12.02% | 13.30% |
| S&P 500® Total Return Index (reflects no deduction for fees, expenses, or taxes)(1) | 17.88% | 21.50% |
| (1) | The S&P 500® Total Return Index is a widely recognized benchmark index that tracks the performance of the 500 largest publicly traded companies in the United States |
After-tax returns are calculated using the historical highest individual federal marginal income tax rates during the period covered by the table above and do not reflect the impact of state and local taxes. Actual after-tax returns depend on an investors tax situation and may differ from those shown. After-tax returns shown are not relevant to investors who hold their Shares through tax-deferred or other tax-advantaged arrangements such as an individual retirement account (“IRA”).
Performance information for the Fund is not included because the Fund has not completed a full calendar year of operations as of the date of this Prospectus. When such information is included, this section will provide some indication of the risks of investing in the Fund by showing changes in the Fund’s performance history from year to year and showing how the Fund’s average annual total returns compare with those of a broad measure of market performance. Although past performance of the Fund is no guarantee of how it will perform in the future, historical performance may give you some indication of the risks of investing in the Fund. Updated performance information will be available on the Fund’s website at www.returnstackedetfs.com.