Exhibit 99.2
1Q26 Earnings Presentation April 27 , 2026 COMMERCIAL BANCGROUP, INC.
2 Important Notices and Disclaimers Use of Defined Terms As used in this presentation, the terms “Company,” “Commercial,” “we,” “our,” and “us” refer to Commercial Bancgroup, Inc., a Te nnessee corporation. The term “Bank” refers to Commercial Bank, the Company’s wholly owned bank subsidiary. Forward - Looking Statements This presentation contains statements that constitute “forward - looking statements” within the meaning of the U.S. federal securi ties laws. The statements in this presentation that are not purely historical facts, including statements regarding our growth strategy, our strategic focus an d v ision, and the scalability of our business model, are forward - looking statements. These forward - looking statements are generally identified by the use of forward - looking t erminology, including the terms “anticipate,” “believe,” “could,” “estimate,” “expect,” “intend,” “may,” “plan,” “potential,” “predict,” “project,” “should,” “t arget,” “will,” “would” and, in each case, their negative or other variations or comparable terminology and expressions. You should not place undue reliance on these forward - loo king statements as actual future results may differ materially from those expressed or implied by any forward - looking statement. These forward - looking statements are subject to known and unknown risks, uncertainties, and other factors that could cause actual results to differ materially from those expressed in or implied by any forward - looking statements, including but not limited to: (1) business and economic conditions nationally, regionally, and in our target markets , particularly in Kentucky, North Carolina, and Tennessee and the particular geographic areas in which we operate; (2) the level of, or changes in the level of , i nterest rates and inflation, including the effects thereof on our earnings and financial condition and the market value of our investment securities and loan portfo lio s; (3) the concentration of our loan portfolio in real estate loans and changes in the prices, values, and sales volumes of commercial and residential real estate ; ( 4) the concentration of our business within our geographic areas of operation in Kentucky, North Carolina, and Tennessee and neighboring markets; (5) credit and l end ing risks associated with our commercial real estate, commercial, and construction and land development loan portfolios; (6) risks associated with our focu s o n lending to small and medium - sized businesses; (7) our ability to maintain important deposit customer relationships, maintain our reputation, or otherwise av oid liquidity risks; (8) changes in demand for our products and services; (9) the failure of assumptions and estimates underlying the establishment of allowances fo r possible credit losses and other asset impairments, valuations of assets and liabilities, and other estimates; (10) the sufficiency of our capital, including sou rces of such capital and the extent to which capital may be used or required; (11) our inability to maintain a “satisfactory” rating under the Community Reinvestmen t A ct; (12) the risk that our cost of funding could increase in the event we are unable to continue to attract stable, low - cost deposits and reduce our cost of deposi ts; (13) our inability to raise necessary capital to fund our growth strategy and operations or to meet increased required minimum regulatory capital levels; (1 4) our ability to execute and prudently manage our growth and execute our business strategy, including expansionary activities; (15) the composition of and ch anges in our management team and our ability to attract, incentivize, and retain key personnel; (16) the effects of competition from a wide variety of loc al, regional, national, and other providers of financial, investment, trust, and other wealth management services and insurance services, including the disruptive effects o f f inancial technology and other competitors who are not subject to the same level of supervision and regulation as the Company and the Bank; (17) the deterio rat ion of our asset quality or the value of collateral securing loans; (18) changes in accounting standards; (19) the effectiveness of our risk management framework, inc luding internal controls; (20) severe weather, natural disasters, pandemics, epidemics, acts of war, terrorism, or other external events, such as the transition ri sk associated with climate change, and other matters beyond our control; BS0
3 Important Notices and Disclaimers (21) changes in technology or products that may be more difficult or costly or less effective than anticipated; (22) the risk s o f acquisitions and other expansionary activities, including without limitation our ability to identify and consummate transactions with potential future acquisitio n c andidates, the time and costs associated with pursuing such transactions, our ability to successfully integrate operations as part of such transactions, and our abili ty, and possible failures, to achieve expected gains, revenue growth, expense savings, and/or other synergies from such transactions; (23) our ability to maintain our historical rate of growth; (24) failure to keep pace with technological change or difficulties when implementing new technologies; (25) systems failures or interrupt ion s involving our risk management framework, our information technology and telecommunications systems, or third - party service providers; (26) our ability to iden tify and address unauthorized data access, cyber - crime, and other threats to data security and customer privacy; (27) our compliance with governmental and regulato ry requirements, including the Bank Holding Company Act of 1956, as amended, and other laws relating to banking, consumer protection, securities, and tax matte rs, and our ability to maintain licenses required in connection with mortgage origination, sale, and servicing operations; (28) compliance with the Bank Secr ecy Act of 1970, Office of Foreign Assets Control rules, and anti - money laundering laws and regulations; (29) governmental monetary and fiscal policies; (30) chang es in laws, rules, or regulations, or interpretations thereof, or policies relating to financial institutions or accounting, tax, trade, monetary, or fiscal matter s; (31) our ability to receive dividends from the Bank and satisfy our obligations as they become due; (32) the institution and outcome of litigation and other legal proceedin gs against us or to which we become subject; (33) the limited experience of our management team in managing and operating a public company; (34) the incremental cos ts of operating as a public company; and (35) our ability to meet our obligations as a public company, including our obligations under Section 404 of the Sa rbanes - Oxley Act of 2002. Additional factors that could affect forward - looking statements in this presentation can be found in the sections titled “Risk F actors” and “Management’s Discussion and Analysis of Financial Condition and Results of Operations” in our Annual Report on Form 10 - K for the fiscal year ended Decem ber 31, 2025, with the U.S. Securities and Exchange Commission (the “SEC”) and in other documents that we file with the SEC from time to time, which are ava ilable on the SEC’s website, www.sec.gov. The Company can provide no assurance that the results contemplated, expressed, or implied by any forward - looking statement will be realized. Our actual future financial results or performance may differ from that currently expected due to additional risks and uncertainties of which w e a re currently not aware or which we currently do not consider, but in the future may become, material to our business or operating results. Readers are cautioned to not place undue reliance on any of the forward - looking statements contained in this presentation. The f orward - looking statements contained in this presentation speak only as of the date they are made, and the Company undertakes no obligation to review or up date any forward - looking statements, whether as a result of new information, changes in assumptions, or otherwise, except as required by law. Non - GAAP Financial Measures This presentation contains certain financial measures that are not measures recognized under generally accepted accounting pr inc iples in the U.S. (“GAAP”) and, therefore, are considered non - GAAP financial measures. The Appendix to this presentation includes reconciliations of these non - G AAP financial measures to the most directly comparable financial measures calculated in accordance with GAAP. We use non - GAAP financial measures, certain of w hich are included in this presentation, both to explain our operating results to shareholders and the investment community and to evaluate, analyze, an d m anage our business. We believe that these non - GAAP financial measures provide a better understanding of ongoing operations, enhance the comparability of result s across periods, and enable investors to better understand our performance. However, non - GAAP financial measures should not be considered in isolation and s hould be considered supplemental in nature and not as a substitute for or superior to the most directly comparable or other financial measures ca lcu lated in accordance with GAAP. Additionally, the manner in which the non - GAAP financial measures contained in this presentation are calculated may differ from the manner in which measures with similar names are calculated by other companies. You should understand how other companies calculate their financial measures si milar to, or with names similar to, the non - GAAP financial measures contained in this presentation when comparing such non - GAAP financial measures.
4 Important Notices and Disclaimers Industry Information Certain industry and market data and forecasts, and other information, contained in this presentation has been prepared based , i n part, upon data, forecasts, and other information that we obtained from regulatory sources, periodic industry publications, third - party studies and surveys, fil ings of public companies in our industry, internal company surveys, or other independent information publicly available to us. Although we believe such information is rel iable and are not aware of any inaccuracies therein as of the date of this presentation, we have not independently verified this information, and this infor mat ion could prove to be inaccurate or incomplete. Readers are solely responsible for their own assessment of all such information. The delivery of this presentation will not, under any circumstances, create an implication that there has been no change in t he affairs of the Company since the date of this presentation. The Company is not making any representation or warranty, express or implied, as to the accuracy or com ple teness of the information summarized herein or made available in connection with any further investigation of the Company. The Company disclaims any an d a ll liability based on such information or errors therein or omissions therefrom.
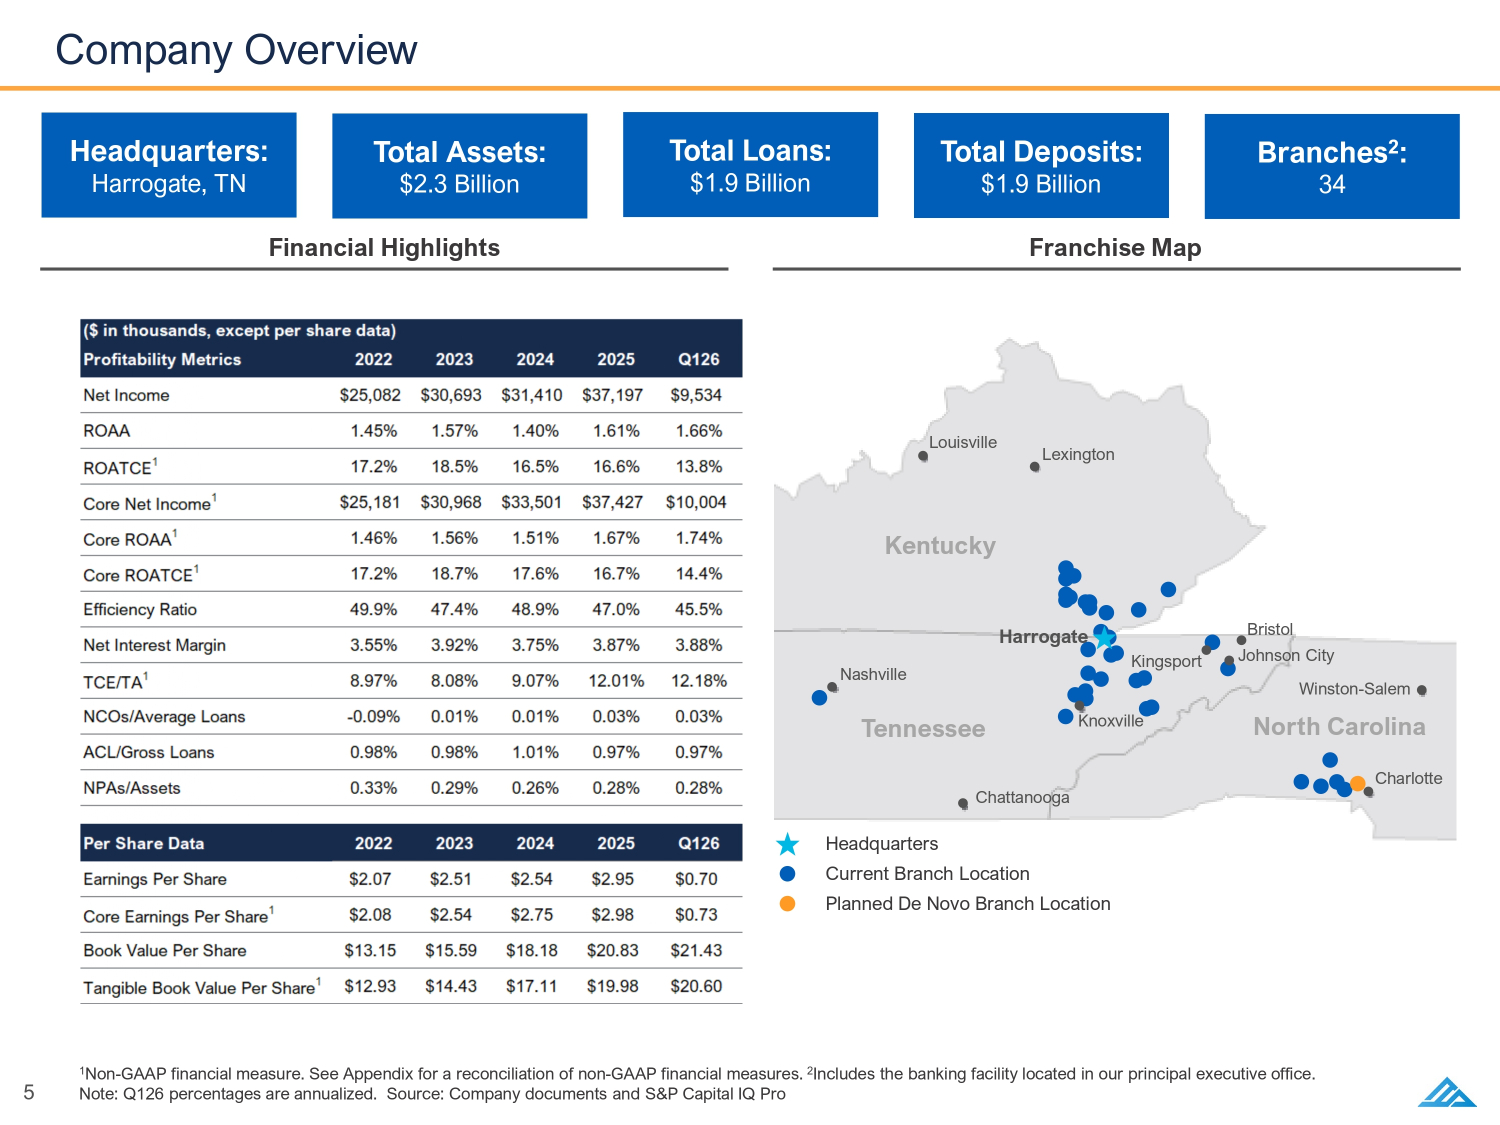
5 Company Overview Headquarters: Harrogate, TN Branches 2 : 34 Total Assets: $2.3 Billion Total Loans: $1.9 Billion Total Deposits: $1.9 Billion 1 Non - GAAP financial measure. See Appendix for a reconciliation of non - GAAP financial measures. 2 Includes the banking facility located in our principal executive office. Note: Q126 percentages are annualized. Source: Company documents and S&P Capital IQ Pro Franchise Map Financial Highlights Louisville Lexington Nashville Chattanooga Knoxville Harrogate Kingsport Johnson City Bristol Charlotte Winston - Salem Kentucky Tennessee North Carolina Headquarters Current Branch Location Planned De Novo Branch Location BS0 BS1
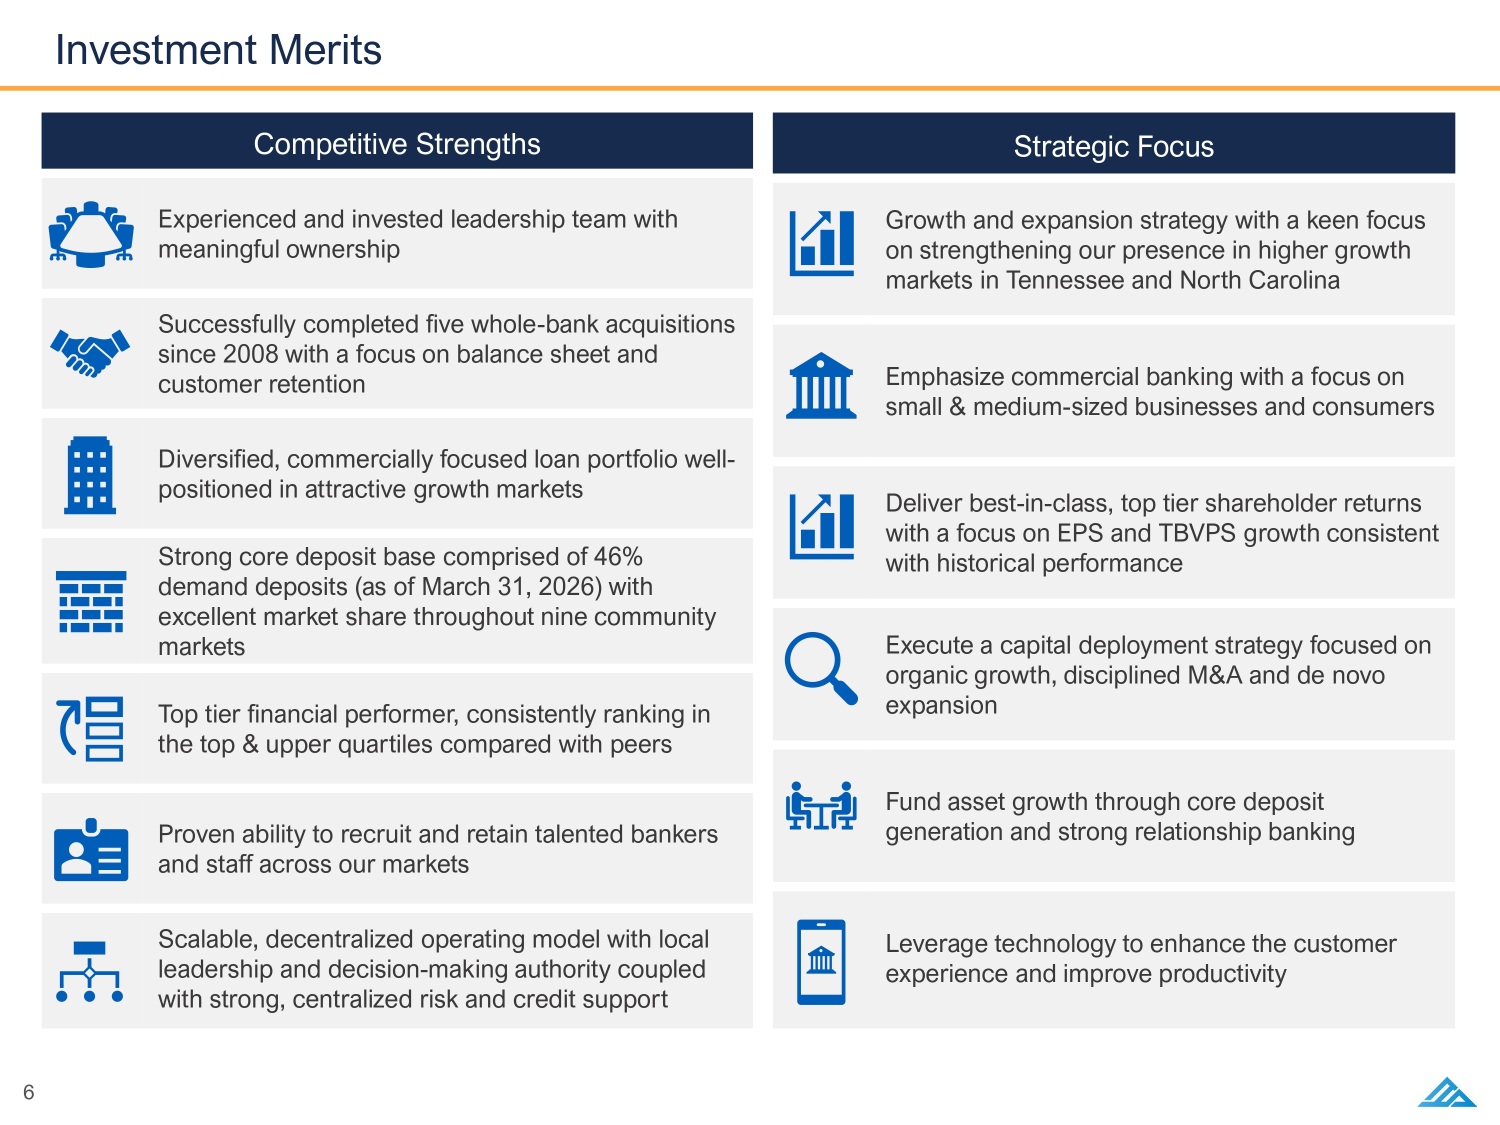
6 Investment Merits Competitive Strengths Experienced and invested leadership team with meaningful ownership Successfully completed five whole - bank acquisitions since 2008 with a focus on balance sheet and customer retention Diversified, commercially focused loan portfolio well - positioned in attractive growth markets Strong core deposit base comprised of 46% demand deposits (as of March 31, 2026) with excellent market share throughout nine community markets Top tier financial performer, consistently ranking in the top & upper quartiles compared with peers Proven ability to recruit and retain talented bankers and staff across our markets Scalable, decentralized operating model with local leadership and decision - making authority coupled with strong, centralized risk and credit support Strategic Focus Growth and expansion strategy with a keen focus on strengthening our presence in higher growth markets in Tennessee and North Carolina Emphasize commercial banking with a focus on small & medium - sized businesses and consumers Deliver best - in - class, top tier shareholder returns with a focus on EPS and TBVPS growth consistent with historical performance Execute a capital deployment strategy focused on organic growth, disciplined M&A and de novo expansion Fund asset growth through core deposit generation and strong relationship banking Leverage technology to enhance the customer experience and improve productivity
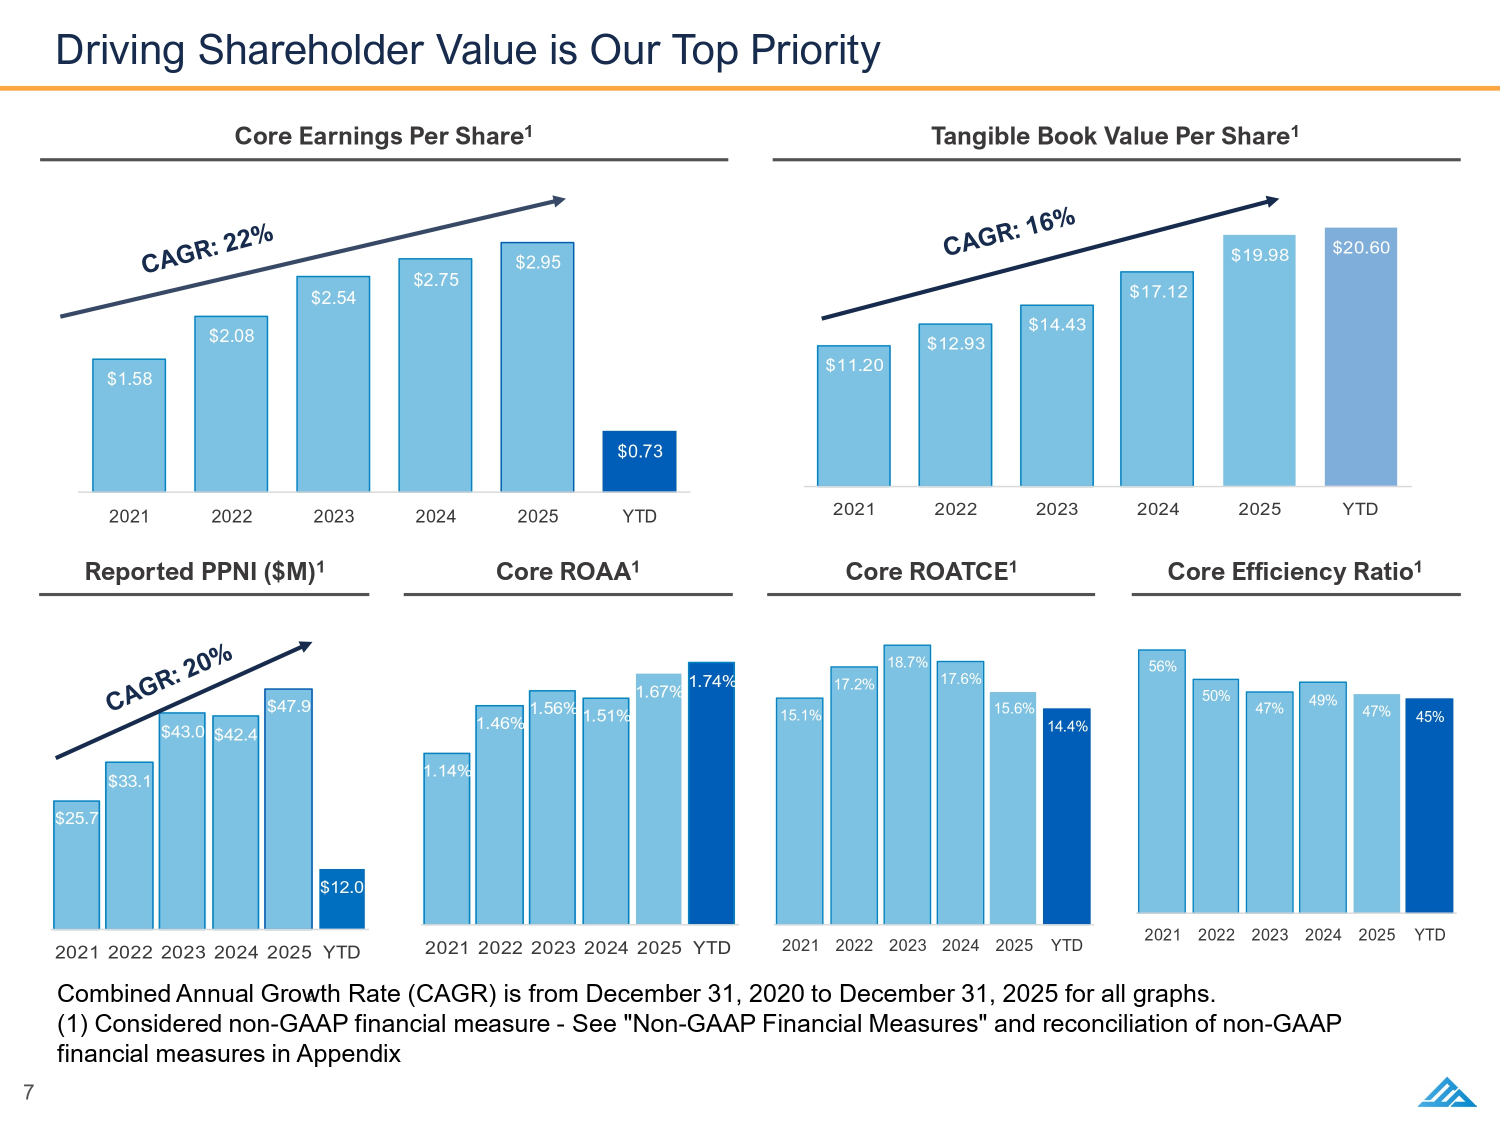
<7' <7' 7 Driving Shareholder Value is Our Top Priority Tangible Book Value Per Share 1 Core Earnings Per Share 1 Core Efficiency Ratio 1 Core ROATCE 1 Core ROAA 1 Reported PPNI ($M) 1 <7' <7' <7' <7' 2 Combined Annual Growth Rate (CAGR) is from December 31, 2020 to December 31, 2025 for all graphs. (1) Considered non - GAAP financial measure - See "Non - GAAP Financial Measures" and reconciliation of non - GAAP financial measures in Appendix BS0 BS1 BS2 BS3
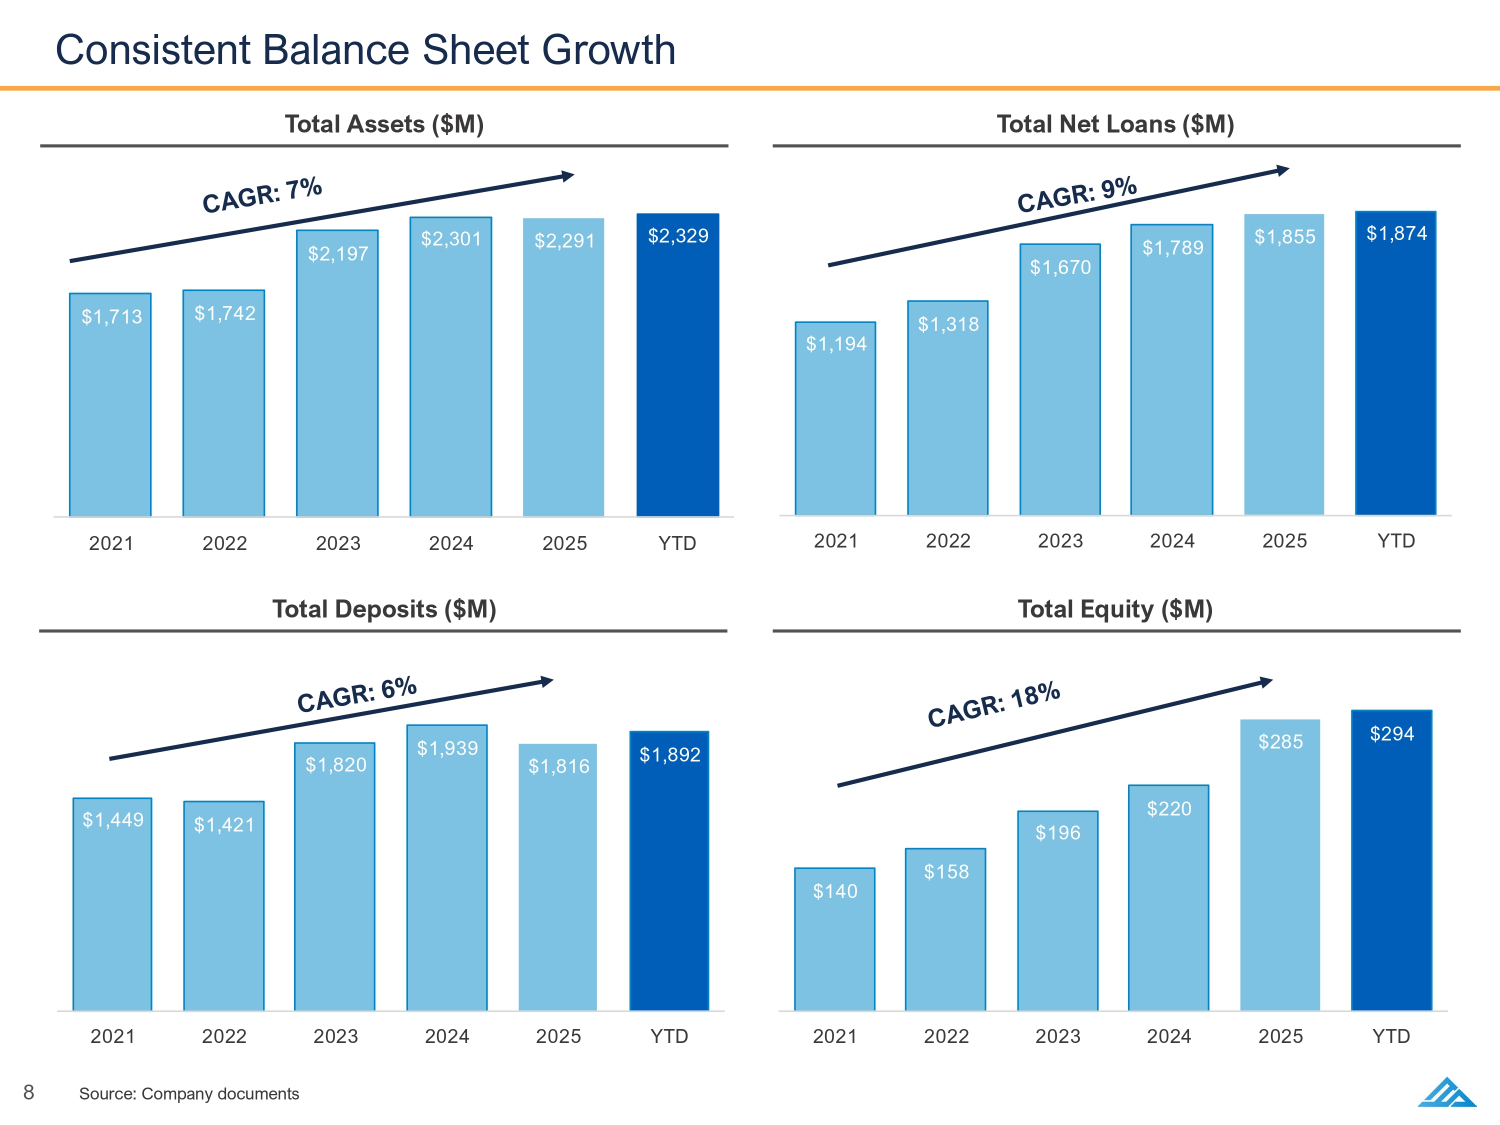
<7' <7' <7' <7' 8 Consistent Balance Sheet Growth Total Net Loans ($M) Total Assets ($M) Total Equity ($M) Total Deposits ($M) Source: Company documents
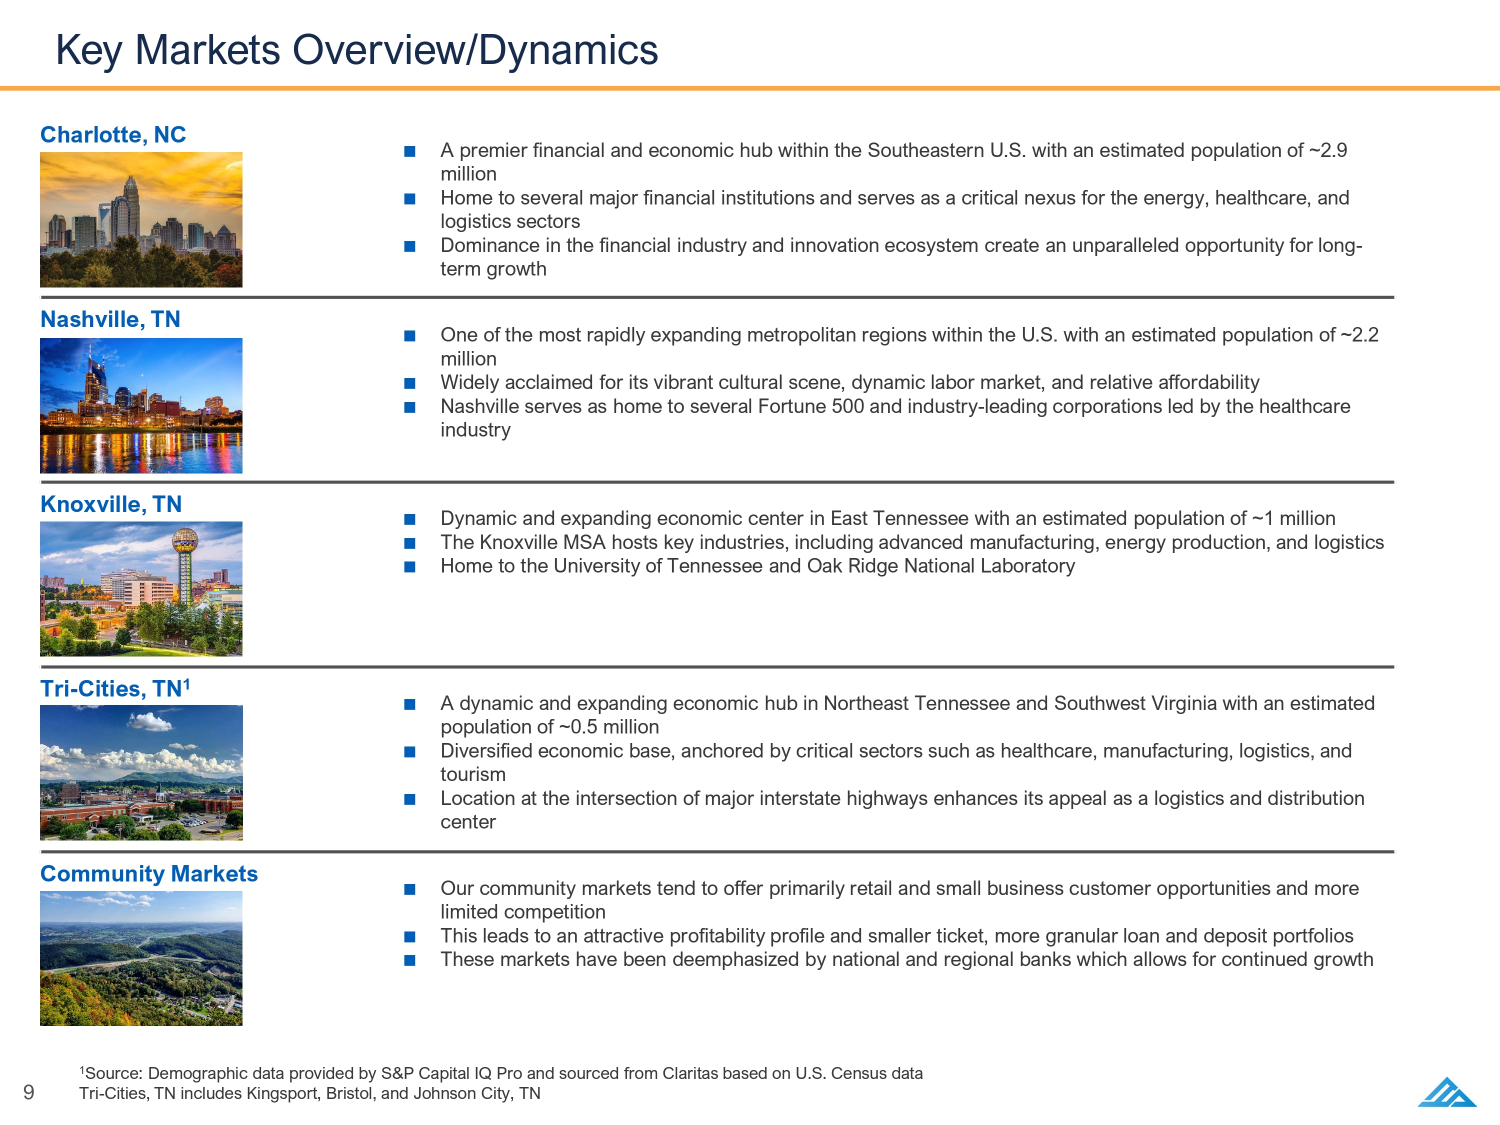
9 Key Markets Overview/Dynamics ■ A premier financial and economic hub within the Southeastern U.S. with an estimated population of ~2.9 million ■ Home to several major financial institutions and serves as a critical nexus for the energy, healthcare, and logistics sectors ■ Dominance in the financial industry and innovation ecosystem create an unparalleled opportunity for long - term growth Charlotte, NC ■ One of the most rapidly expanding metropolitan regions within the U.S. with an estimated population of ~2.2 million ■ Widely acclaimed for its vibrant cultural scene, dynamic labor market, and relative affordability ■ Nashville serves as home to several Fortune 500 and industry - leading corporations led by the healthcare industry Nashville, TN ■ Dynamic and expanding economic center in East Tennessee with an estimated population of ~1 million ■ The Knoxville MSA hosts key industries, including advanced manufacturing, energy production, and logistics ■ Home to the University of Tennessee and Oak Ridge National Laboratory Knoxville, TN ■ A dynamic and expanding economic hub in Northeast Tennessee and Southwest Virginia with an estimated population of ~0.5 million ■ Diversified economic base, anchored by critical sectors such as healthcare, manufacturing, logistics, and tourism ■ Location at the intersection of major interstate highways enhances its appeal as a logistics and distribution center Tri - Cities, TN 1 ■ Our community markets tend to offer primarily retail and small business customer opportunities and more limited competition ■ This leads to an attractive profitability profile and smaller ticket, more granular loan and deposit portfolios ■ These markets have been deemphasized by national and regional banks which allows for continued growth Community Markets 1 Source: Demographic data provided by S&P Capital IQ Pro and sourced from Claritas based on U.S. Census data Tri - Cities, TN includes Kingsport, Bristol, and Johnson City, TN
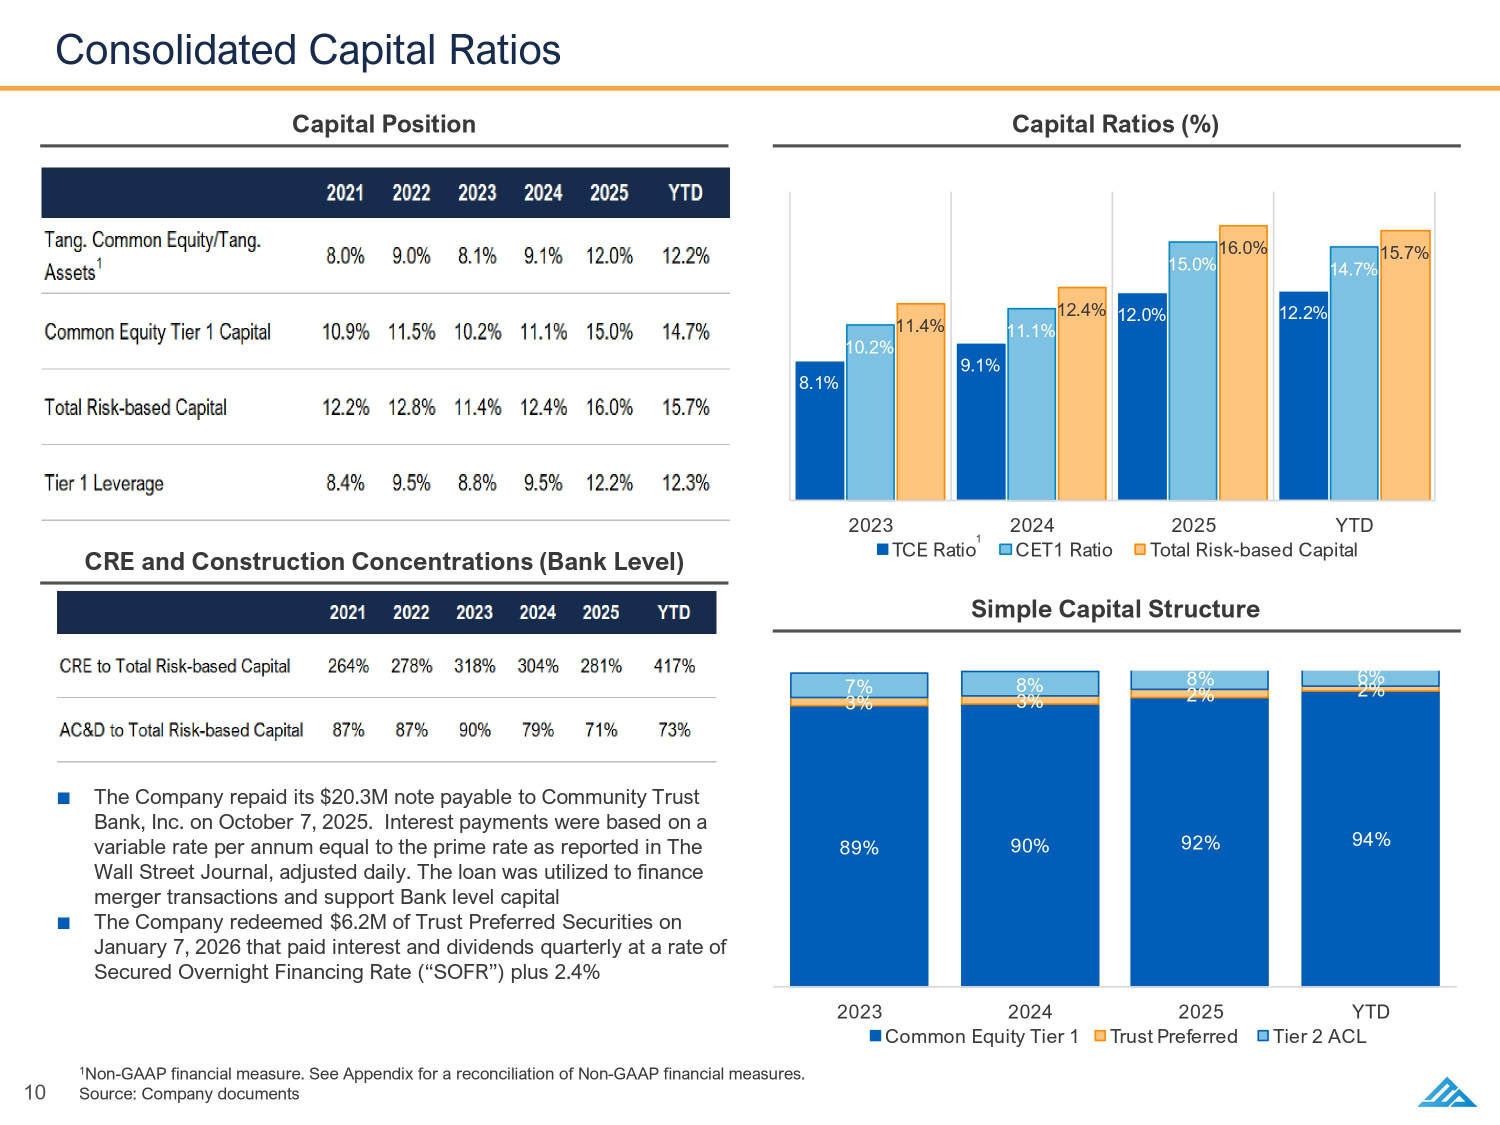
<7' 7&(5DWLR &(7 5DWLR 7RWDO5LVN EDVHG&DSLWDO 10 Consolidated Capital Ratios Capital Ratios (%) Capital Position Simple Capital Structure <7' &RPPRQ(TXLW\7LHU 7UXVW3UHIHUUHG 7LHU $&/ 1 Non - GAAP financial measure. See Appendix for a reconciliation of Non - GAAP financial measures. Source: Company documents ■ The Company repaid its $20.3M note payable to Community Trust Bank, Inc. on October 7, 2025. Interest payments were based on a variable rate per annum equal to the prime rate as reported in The Wall Street Journal, adjusted daily. The loan was utilized to finance merger transactions and support Bank level capital ■ The Company redeemed $6.2M of Trust Preferred Securities on January 7, 2026 that paid interest and dividends quarterly at a rate of Secured Overnight Financing Rate (“SOFR”) plus 2.4% 1 CRE and Construction Concentrations (Bank Level)
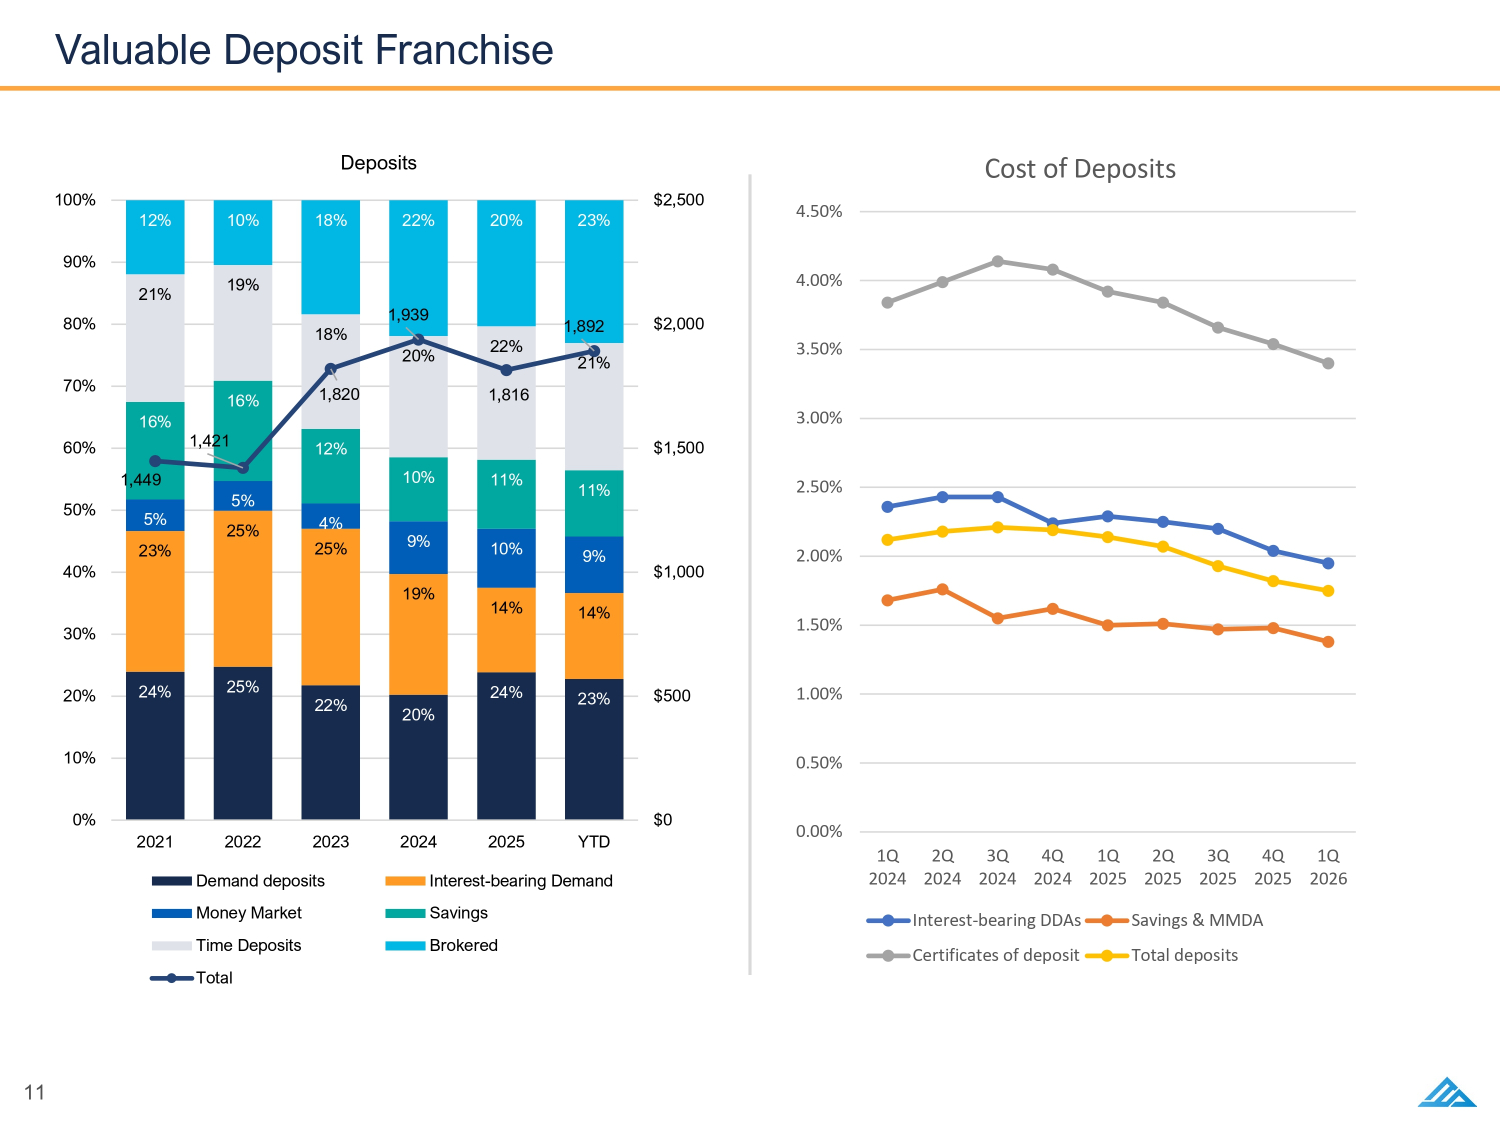
11 24% 25% 22% 20% 24% 23% 23% 25% 25% 19% 14% 14% 5% 5% 4% 9% 10% 9% 16% 16% 12% 10% 11% 11% 21% 19% 18% 20% 22% 21% 12% 10% 18% 22% 20% 23% 1,449 1,421 1,820 1,939 1,816 1,892 $0 $500 $1,000 $1,500 $2,000 $2,500 0% 10% 20% 30% 40% 50% 60% 70% 80% 90% 100% 2021 2022 2023 2024 2025 YTD Deposits Demand deposits Interest-bearing Demand Money Market Savings Time Deposits Brokered Total Valuable Deposit Franchise 0.00% 0.50% 1.00% 1.50% 2.00% 2.50% 3.00% 3.50% 4.00% 4.50% 1Q 2024 2Q 2024 3Q 2024 4Q 2024 1Q 2025 2Q 2025 3Q 2025 4Q 2025 1Q 2026 Cost of Deposits Interest-bearing DDAs Savings & MMDA Certificates of deposit Total deposits
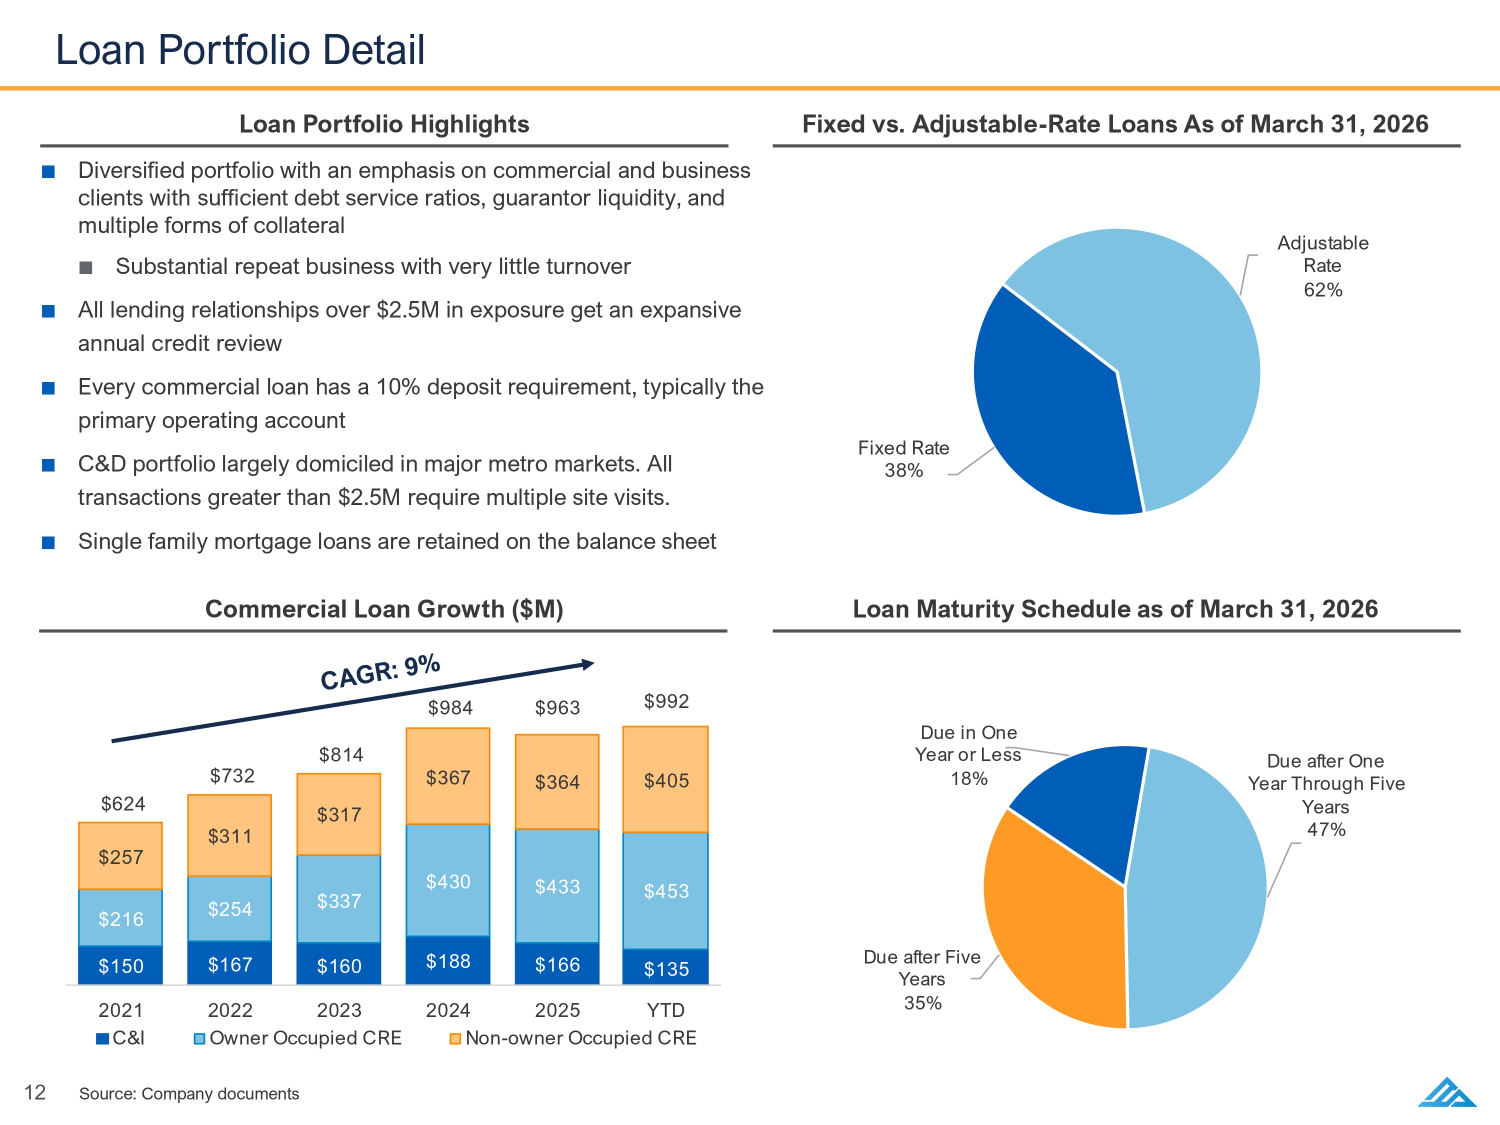
'XHLQ2QH <HDURU/HVV 'XHDIWHU2QH <HDU7KURXJK)LYH <HDUV 'XHDIWHU)LYH <HDUV <7' & , 2ZQHU2FFXSLHG&5( 1RQ RZQHU2FFXSLHG&5( )L[HG5DWH $GMXVWDEOH 5DWH 12 Loan Portfolio Detail Loan Maturity Schedule as of March 31, 2026 Commercial Loan Growth ($M) Fixed vs. Adjustable - Rate Loans As of March 31, 2026 Loan Portfolio Highlights ■ Diversified portfolio with an emphasis on commercial and business clients with sufficient debt service ratios, guarantor liquidity, and multiple forms of collateral ■ Substantial repeat business with very little turnover ■ All lending relationships over $2.5M in exposure get an expansive annual credit review ■ Every commercial loan has a 10% deposit requirement, typically the primary operating account ■ C&D portfolio largely domiciled in major metro markets. All transactions greater than $2.5M require multiple site visits. ■ Single family mortgage loans are retained on the balance sheet Source: Company documents BS0 BS1
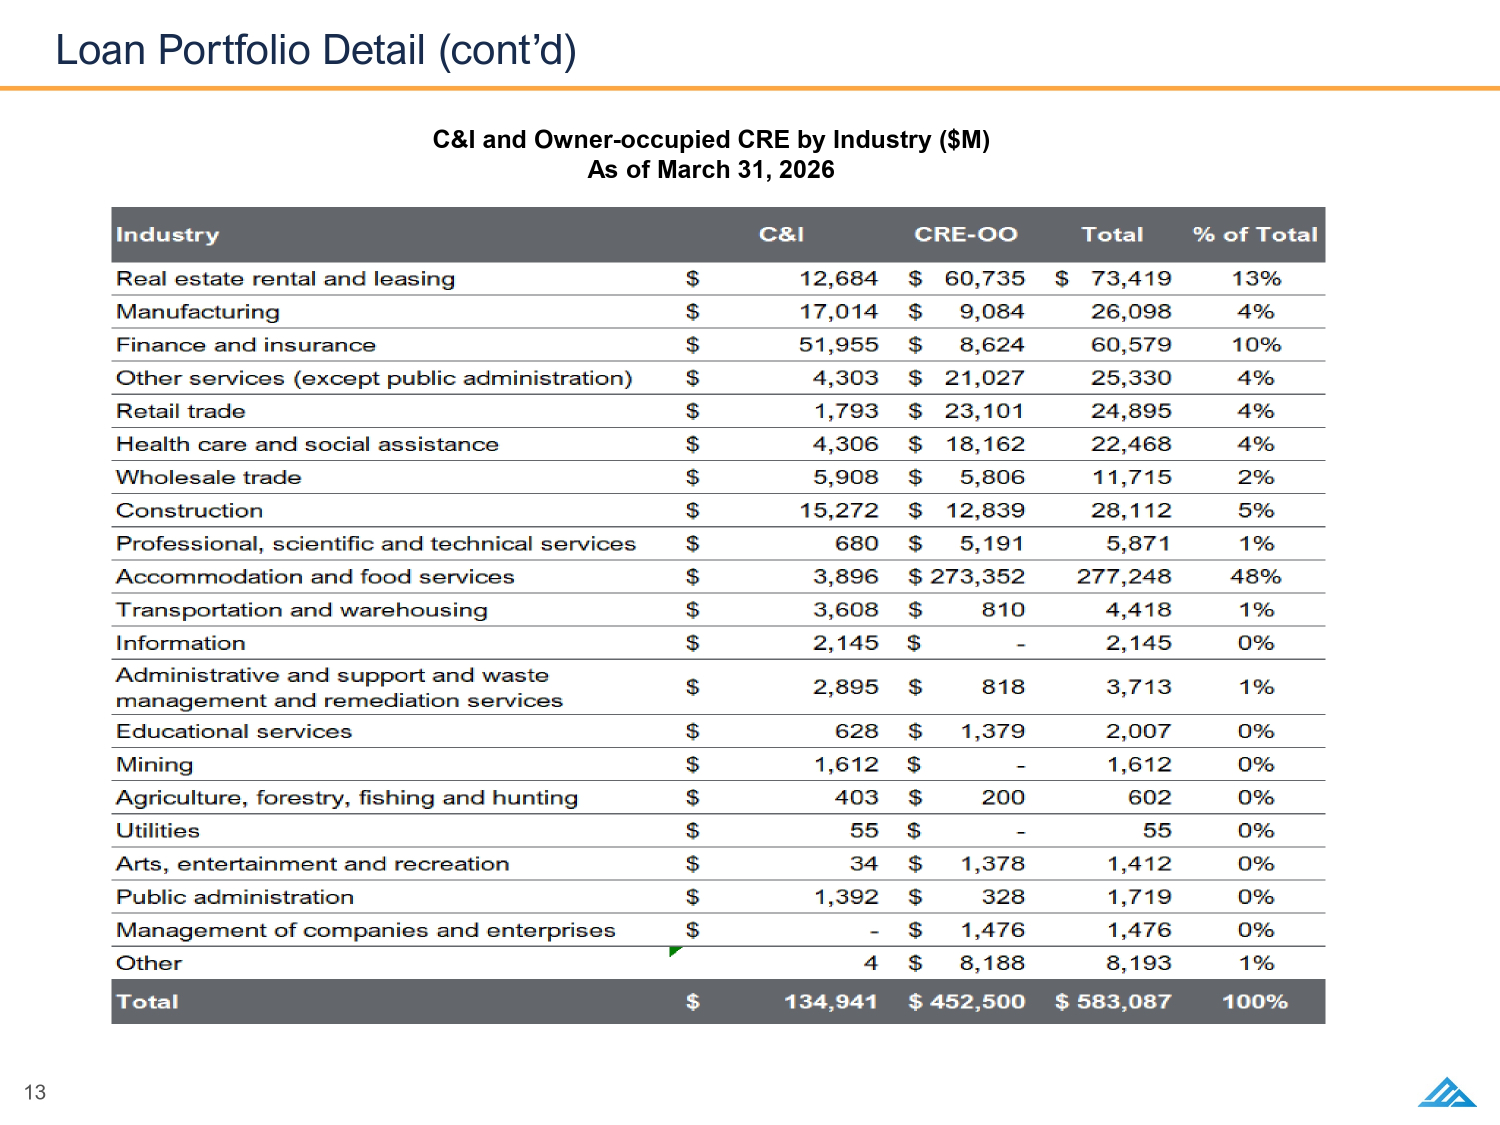
13 Loan Portfolio Detail (cont’d) C&I and Owner - occupied CRE by Industry ($M) As of March 31, 2026BS0BS1BS2BS3 BS4
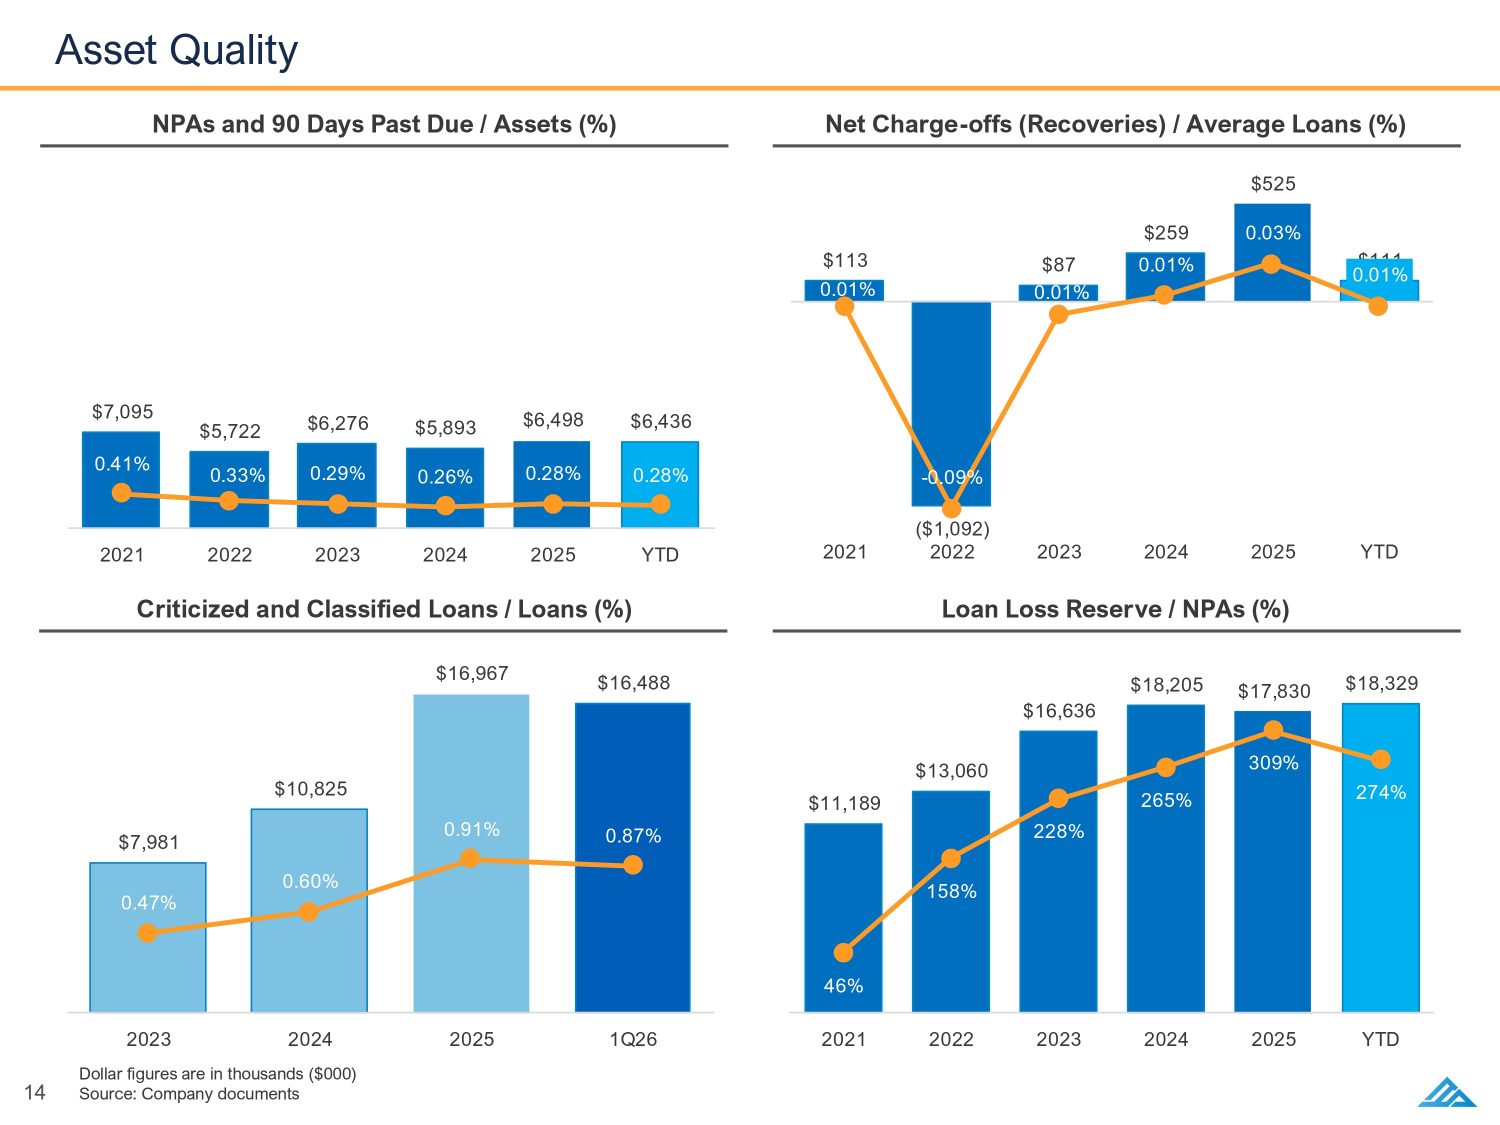
4 <7' 14 Asset Quality Loan Loss Reserve / NPAs (%) Criticized and Classified Loans / Loans (%) Net Charge - offs (Recoveries) / Average Loans (%) NPAs and 90 Days Past Due / Assets (%) <7' <7' Dollar figures are in thousands ($000) Source: Company documents
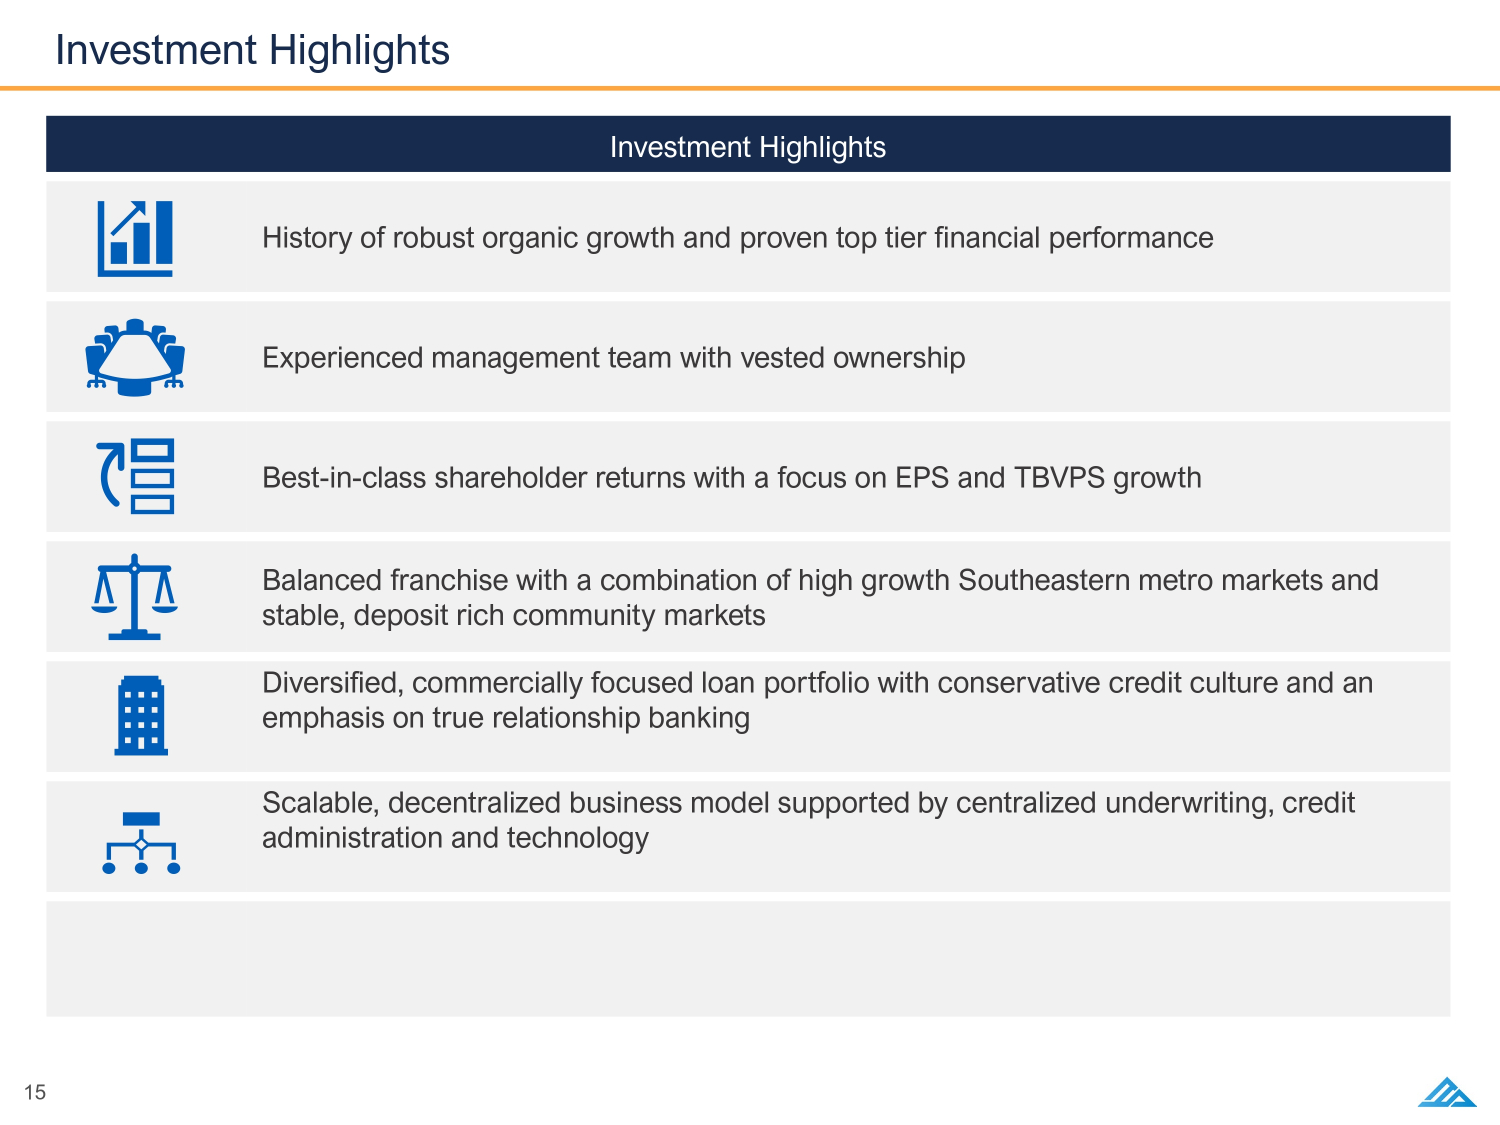
15 Investment Highlights 1 Investment Highlights History of robust organic growth and proven top tier financial performance Experienced management team with vested ownership Best - in - class shareholder returns with a focus on EPS and TBVPS growth Balanced franchise with a combination of high growth Southeastern metro markets and stable, deposit rich community markets Diversified, commercially focused loan portfolio with conservative credit culture and an emphasis on true relationship banking Scalable, decentralized business model supported by centralized underwriting, credit administration and technology
Appendix
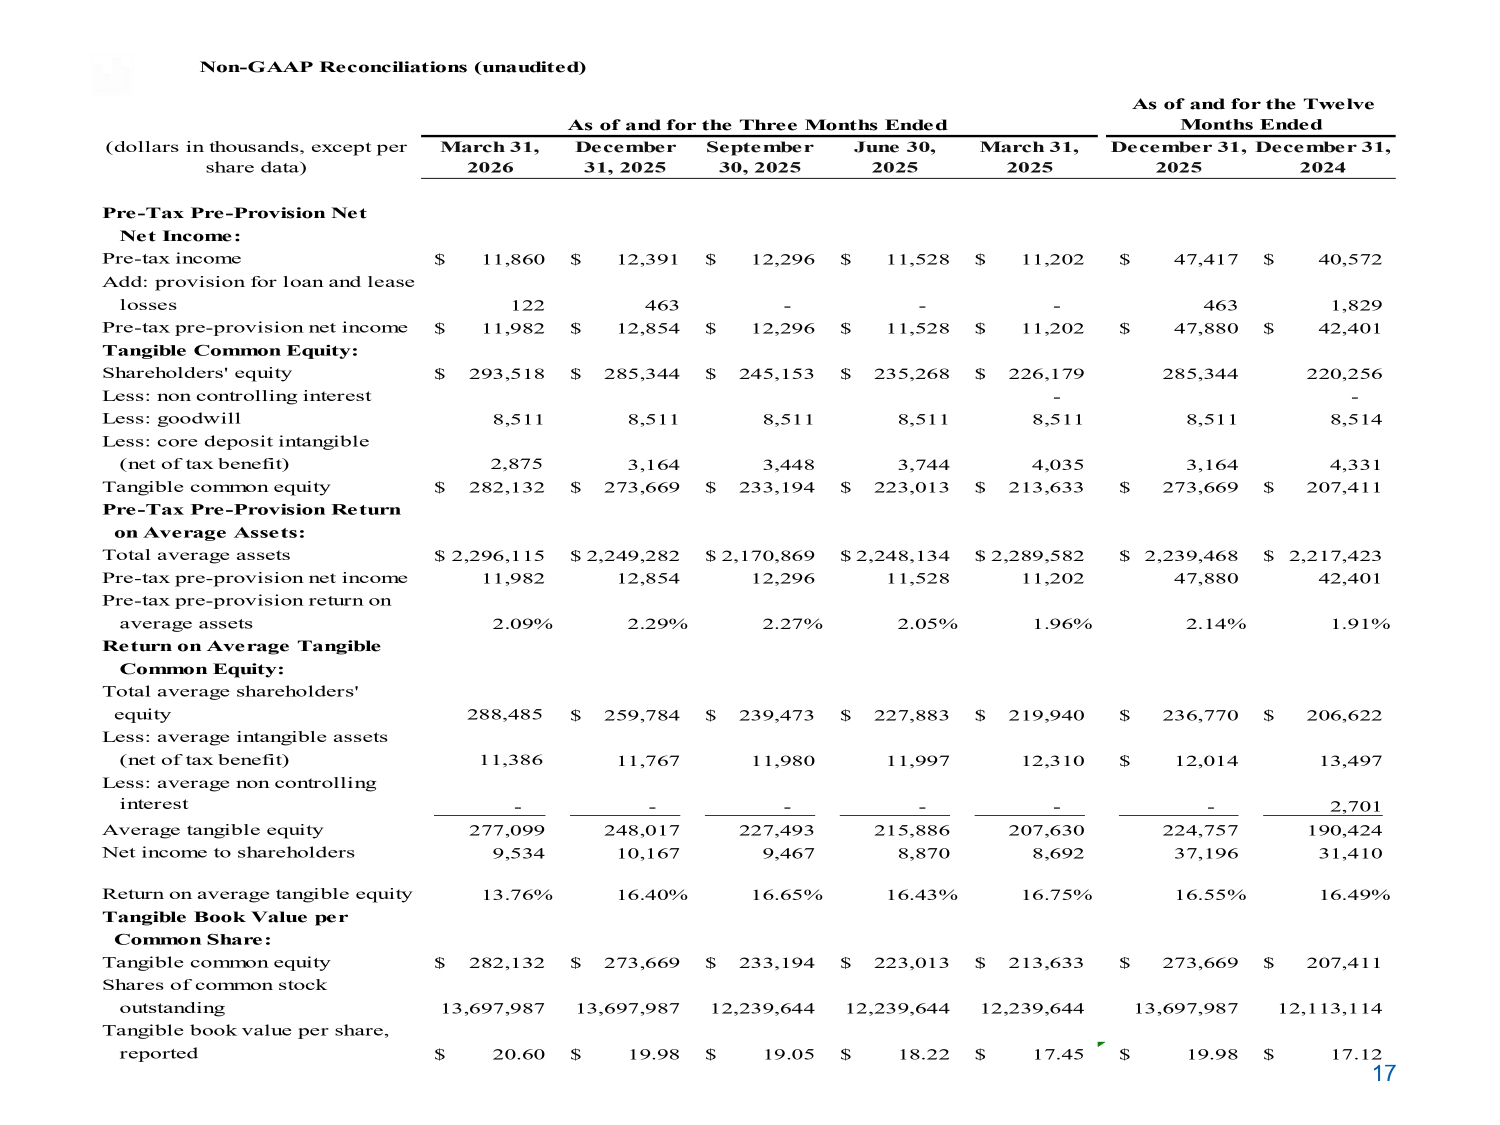
17 (dollars in thousands, except per share data) March 31, 2026 December 31, 2025 September 30, 2025 June 30, 2025 March 31, 2025 December 31, 2025 December 31, 2024 Pre-Tax Pre-Provision Net Net Income: Pre-tax income 11,860$ 12,391$ 12,296$ 11,528$ 11,202$ 47,417$ 40,572$ Add: provision for loan and lease losses 122 463 - - - 463 1,829 Pre-tax pre-provision net income 11,982$ 12,854$ 12,296$ 11,528$ 11,202$ 47,880$ 42,401$ Tangible Common Equity: Shareholders' equity 293,518$ 285,344$ 245,153$ 235,268$ 226,179$ 285,344 220,256 Less: non controlling interest - - Less: goodwill 8,511 8,511 8,511 8,511 8,511 8,511 8,514 Less: core deposit intangible (net of tax benefit) 2,875 3,164 3,448 3,744 4,035 3,164 4,331 Tangible common equity 282,132$ 273,669$ 233,194$ 223,013$ 213,633$ 273,669$ 207,411$ Pre-Tax Pre-Provision Return on Average Assets: Total average assets 2,296,115$ 2,249,282$ 2,170,869$ 2,248,134$ 2,289,582$ 2,239,468$ 2,217,423$ Pre-tax pre-provision net income 11,982 12,854 12,296 11,528 11,202 47,880 42,401 Pre-tax pre-provision return on average assets 2.09% 2.29% 2.27% 2.05% 1.96% 2.14% 1.91% Return on Average Tangible Common Equity: Total average shareholders' equity 288,485 259,784$ 239,473$ 227,883$ 219,940$ 236,770$ 206,622$ Less: average intangible assets (net of tax benefit) 11,386 11,767 11,980 11,997 12,310 12,014$ 13,497 Less: average non controlling interest - - - - - - 2,701 Average tangible equity 277,099 248,017 227,493 215,886 207,630 224,757 190,424 Net income to shareholders 9,534 10,167 9,467 8,870 8,692 37,196 31,410 Return on average tangible equity 13.76% 16.40% 16.65% 16.43% 16.75% 16.55% 16.49% Tangible Book Value per Common Share: Tangible common equity 282,132$ 273,669$ 233,194$ 223,013$ 213,633$ 273,669$ 207,411$ Shares of common stock outstanding 13,697,987 13,697,987 12,239,644 12,239,644 12,239,644 13,697,987 12,113,114 Tangible book value per share, reported 20.60$ 19.98$ 19.05$ 18.22$ 17.45$ 19.98$ 17.12$ As of and for the Twelve Months Ended Non-GAAP Reconciliations (unaudited) As of and for the Three Months Ended
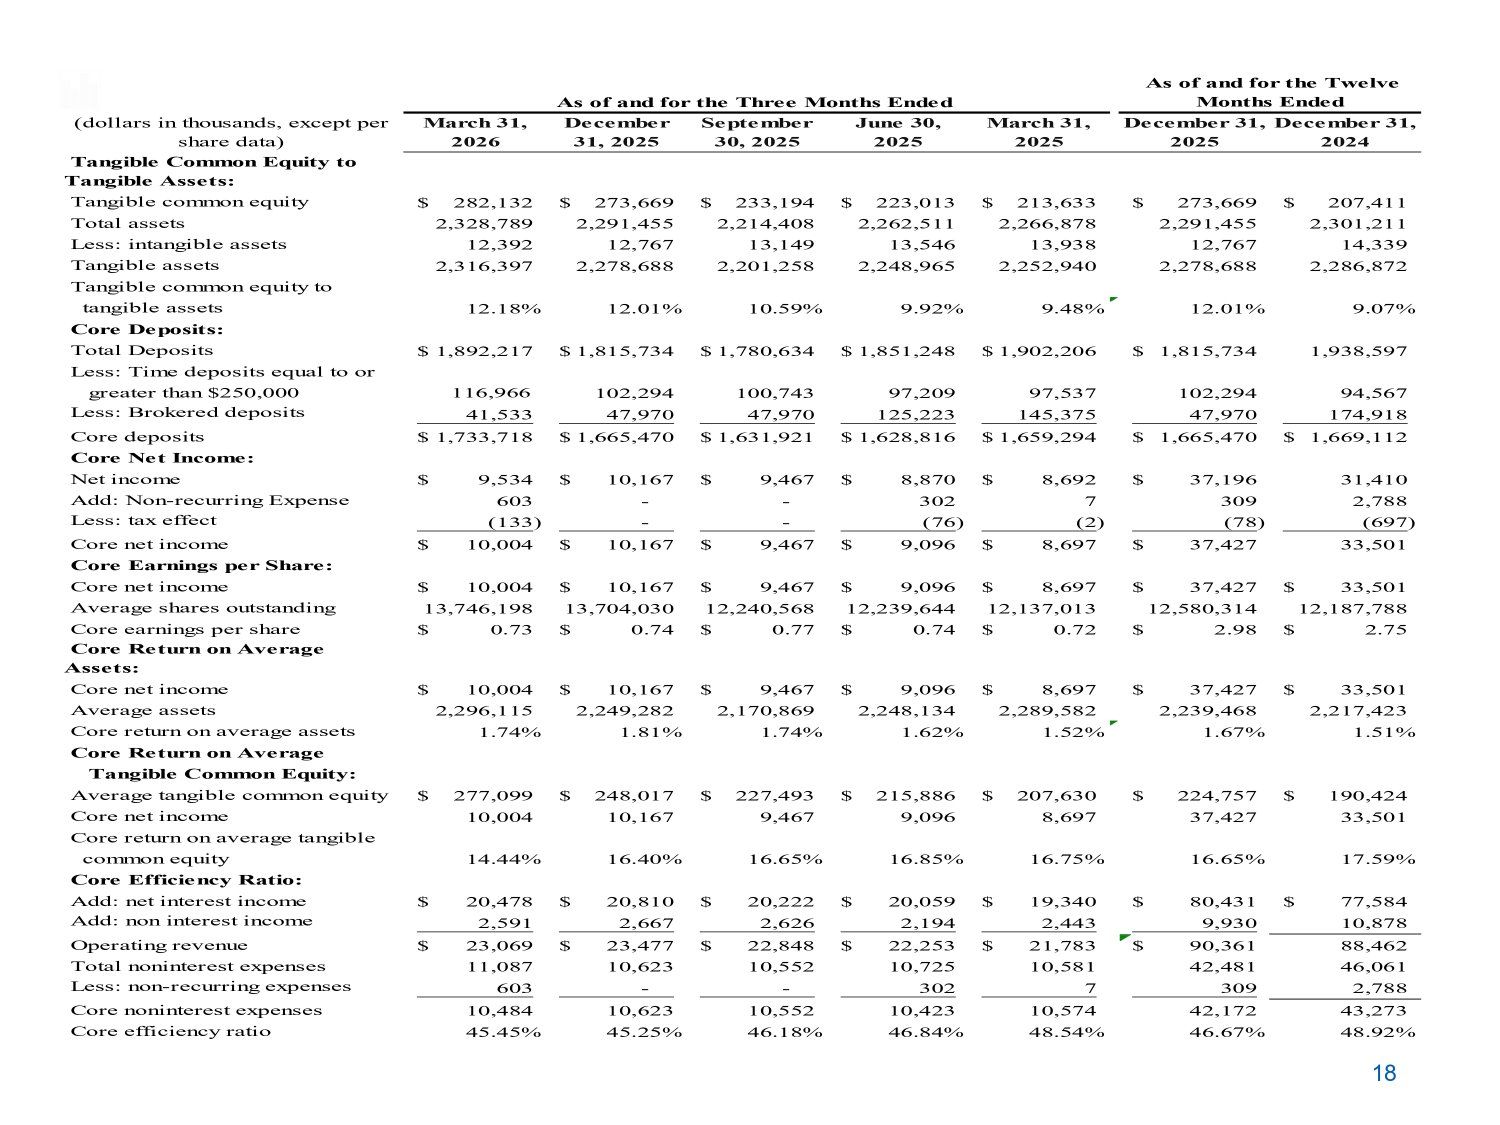
18 (dollars in thousands, except per share data) March 31, 2026 December 31, 2025 September 30, 2025 June 30, 2025 March 31, 2025 December 31, 2025 December 31, 2024 Tangible Common Equity to Tangible Assets: Tangible common equity 282,132$ 273,669$ 233,194$ 223,013$ 213,633$ 273,669$ 207,411$ Total assets 2,328,789 2,291,455 2,214,408 2,262,511 2,266,878 2,291,455 2,301,211 Less: intangible assets 12,392 12,767 13,149 13,546 13,938 12,767 14,339 Tangible assets 2,316,397 2,278,688 2,201,258 2,248,965 2,252,940 2,278,688 2,286,872 Tangible common equity to tangible assets 12.18% 12.01% 10.59% 9.92% 9.48% 12.01% 9.07% Core Deposits: Total Deposits 1,892,217$ 1,815,734$ 1,780,634$ 1,851,248$ 1,902,206$ 1,815,734$ 1,938,597 Less: Time deposits equal to or greater than $250,000 116,966 102,294 100,743 97,209 97,537 102,294 94,567 Less: Brokered deposits 41,533 47,970 47,970 125,223 145,375 47,970 174,918 Core deposits 1,733,718$ 1,665,470$ 1,631,921$ 1,628,816$ 1,659,294$ 1,665,470$ 1,669,112$ Core Net Income: Net income 9,534$ 10,167$ 9,467$ 8,870$ 8,692$ 37,196$ 31,410 Add: Non-recurring Expense 603 - - 302 7 309 2,788 Less: tax effect (133) - - (76) (2) (78) (697) Core net income 10,004$ 10,167$ 9,467$ 9,096$ 8,697$ 37,427$ 33,501 Core Earnings per Share: Core net income 10,004$ 10,167$ 9,467$ 9,096$ 8,697$ 37,427$ 33,501$ Average shares outstanding 13,746,198 13,704,030 12,240,568 12,239,644 12,137,013 12,580,314 12,187,788 Core earnings per share 0.73$ 0.74$ 0.77$ 0.74$ 0.72$ 2.98$ 2.75$ Core Return on Average Assets: Core net income 10,004$ 10,167$ 9,467$ 9,096$ 8,697$ 37,427$ 33,501$ Average assets 2,296,115 2,249,282 2,170,869 2,248,134 2,289,582 2,239,468 2,217,423 Core return on average assets 1.74% 1.81% 1.74% 1.62% 1.52% 1.67% 1.51% Core Return on Average Tangible Common Equity: Average tangible common equity 277,099$ 248,017$ 227,493$ 215,886$ 207,630$ 224,757$ 190,424$ Core net income 10,004 10,167 9,467 9,096 8,697 37,427 33,501 Core return on average tangible common equity 14.44% 16.40% 16.65% 16.85% 16.75% 16.65% 17.59% Core Efficiency Ratio: Add: net interest income 20,478$ 20,810$ 20,222$ 20,059$ 19,340$ 80,431$ 77,584$ Add: non interest income 2,591 2,667 2,626 2,194 2,443 9,930 10,878 Operating revenue 23,069$ 23,477$ 22,848$ 22,253$ 21,783$ 90,361$ 88,462 Total noninterest expenses 11,087 10,623 10,552 10,725 10,581 42,481 46,061 Less: non-recurring expenses 603 - - 302 7 309 2,788 Core noninterest expenses 10,484 10,623 10,552 10,423 10,574 42,172 43,273 Core efficiency ratio 45.45% 45.25% 46.18% 46.84% 48.54% 46.67% 48.92% As of and for the Twelve Months Ended As of and for the Three Months Ended