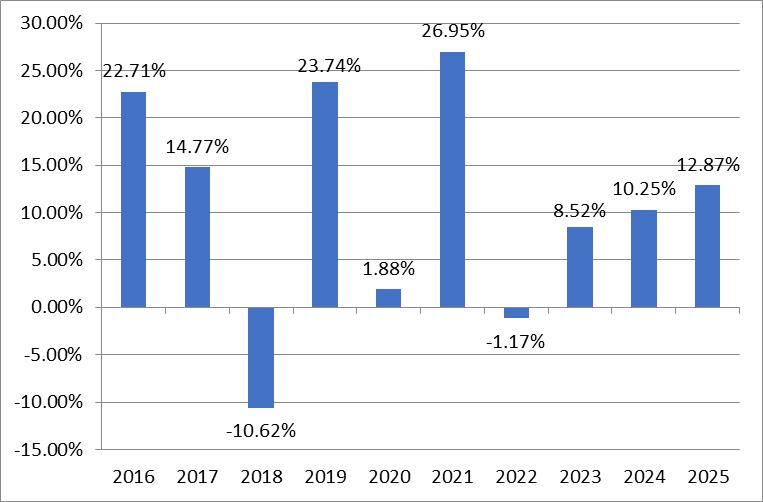
The bar chart and table that follow provide some indication of the risks of investing in the Fund by showing changes in the Fund’s performance from year to year and by showing how the Fund’s average annual total returns for the one, five, and ten year or, if shorter, since inception periods, as applicable, for the Fund’s shares compare with those of a broad-based securities market index. The bar chart and table do not reflect the impact of variable contract expenses. If they did, returns would be lower than those shown. How the Fund has performed in the past does not necessarily indicate how the Fund will perform in the future. Updated performance information, current through the most recent month end, is available by calling (833) 840-3937 or visiting the Fund’s website at www.naafunds.com.
The Fund was reorganized as of the close of business on October 25, 2024, from Series O (All Cap Value Series), a series of Guggenheim Variable Funds Trust (the “Predecessor Fund”). As a result of the reorganization, the Fund is the accounting successor of the Predecessor Fund. Performance results shown in the bar chart and the performance table below for periods prior to October 25, 2024 reflect the performance of the Predecessor Fund prior to the commencement of the Fund’s operations.
|
During the periods shown in the chart above: |
Quarter Ended | Return |
| Highest Quarter | December 31, 2020 | 20.29% |
| Lowest Quarter | March 31, 2020 | -29.95% |
| One Year | Five Years | 10 Years | |
| NAA All Cap Value Series | 12.87% | 11.12% | 10.40% |
| S&P Composite 1500 Value Index (reflects no deduction for fees, expenses, or taxes) |
12.72% | 12.76% | 11.63% |
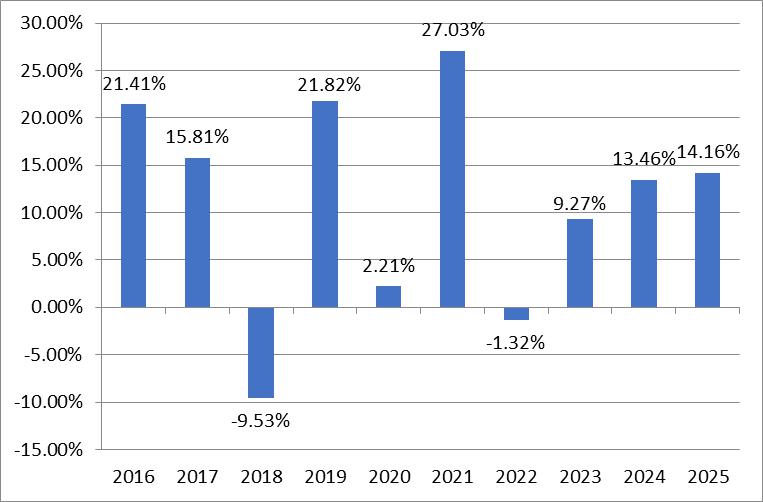
The bar chart and table that follow provide some indication of the risks of investing in the Fund by showing changes in the Fund’s performance from year to year and by showing how the Fund’s average annual total returns for the one, five, and ten year or, if shorter, since inception periods, as applicable, for the Fund’s shares compare with those of a broad-based securities market index. The bar chart and table do not reflect the impact of variable contract expenses. If they did, returns would be lower than those shown. How the Fund has performed in the past does not necessarily indicate how the Fund will perform in the future. Updated performance information, current through the most recent month end, is available by calling (833) 840-3937 or visiting the Fund’s website at www.naafunds.com.
The Fund was reorganized as of the close of business on October 25, 2024, from Series B (Large Cap Value Series), a series of Guggenheim Variable Funds Trust (the “Predecessor Fund”). As a result of the reorganization, the Fund is the accounting successor of the Predecessor Fund. Performance results shown in the bar chart and the performance table below for periods prior to October 25, 2024 reflect the performance of the Predecessor Fund prior to the commencement of the Fund’s operations.
|
During the periods shown in the chart above: |
Quarter Ended | Return |
| Highest Quarter | December 31, 2020 | 18.57% |
| Lowest Quarter | March 31, 2020 | -28.41% |
| One Year | Five Years | 10 Years | |
| NAA Large Cap Value Series | 14.16% | 12.15% | 10.88% |
| S&P 500® Value Index (reflects no deduction for fees, expenses, or taxes) |
13.19% | 12.96% | 11.73% |
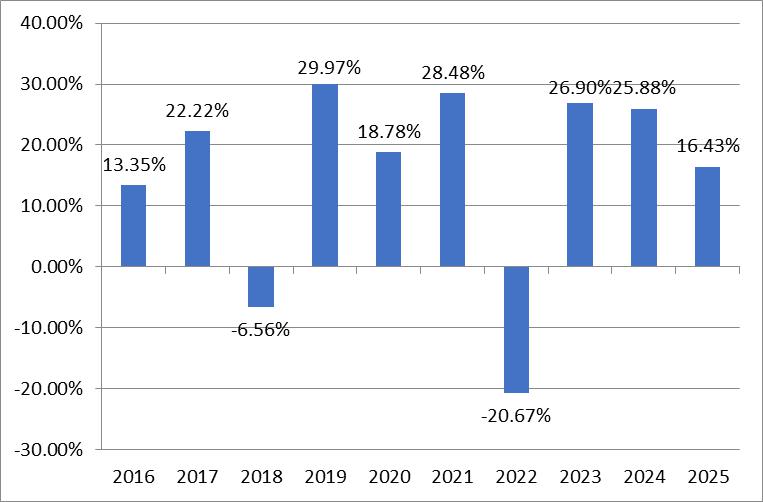
Class L shares of the Fund have not commenced operations as of the date of this Prospectus, and do not have a full calendar year of performance history. The bar chart and table that follow provide some indication of the risks of investing in shares of the Fund by showing changes in the Fund’s Class S shares performance from year to year and by showing how the Fund’s Class S share average annual total returns for the one, five, and ten year or, if shorter, since inception periods, as applicable, for the Fund’s shares compare with those of a broad-based securities market index. Class L shares would have had substantially similar annual returns to Class S shares because the shares are invested in the same portfolio of securities and the annual returns differ only to the extent that the share classes do not have the same expenses. The bar chart and table do not reflect the impact of variable contract expenses. If they did, returns would be lower than those shown. How the Fund has performed in the past does not necessarily indicate how the Fund will perform in the future. Updated performance information, current through the most recent month end, is available by calling (833) 840-3937 or visiting the Fund’s website at www.naafunds.com.
The Fund was reorganized as of the close of business on October 25, 2024, from Series A (StylePlus-Large Core Series), a series of Guggenheim Variable Funds Trust (the “Predecessor Fund”). As a result of the reorganization, the Fund is the accounting successor of the Predecessor Fund. Performance results shown in the bar chart and the performance table below for periods prior to October 25, 2024 reflect the performance of the Predecessor Fund prior to the commencement of the Fund’s operations.
|
During the periods shown in the chart above: |
Quarter Ended | Return |
| Highest Quarter | June 30, 2020 | 23.18% |
| Lowest Quarter | March 31, 2020 | -21.88% |
| One Year | Five Years | 10 Years | |
| NAA Large Core Series – Class S* | 16.43% | 13.65% | 14.25% |
| S&P 500® Index (reflects no deduction for fees, expenses, or taxes) |
17.88% | 14.42% | 14.82% |
| * | Returns are not presented for Class L shares. That share class has not commenced operations as of the date of this Prospectus. Performance information for Class L shares will be shown when that share class has a full calendar year of operations. |
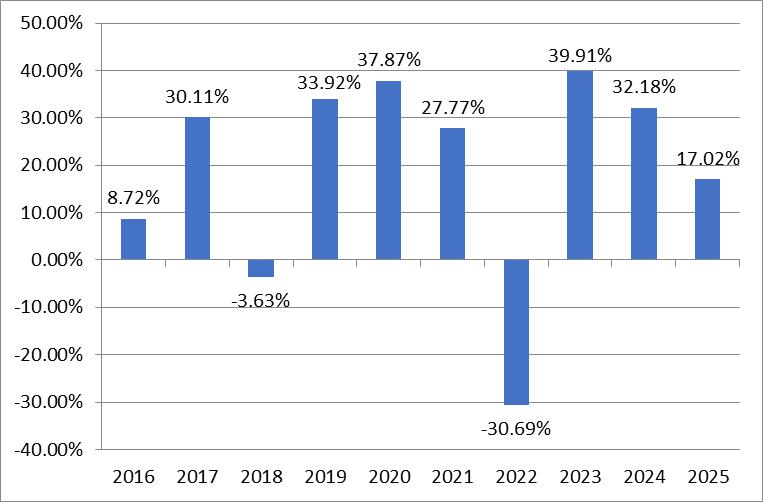
Class L shares of the Fund have not commenced operations as of the date of this Prospectus, and do not have a full calendar year of performance history. The bar chart and table that follow provide some indication of the risks of investing in shares of the Fund by showing changes in the Fund’s Class S shares performance from year to year and by showing how the Fund’s Class S share average annual total returns for the one, five, and ten year or, if shorter, since inception periods, as applicable, for the Fund’s shares compare with those of a broad-based securities market index. Class L shares would have had substantially similar annual returns to Class S shares because the shares are invested in the same portfolio of securities and the annual returns differ only to the extent that the share classes do not have the same expenses. The bar chart and table do not reflect the impact of variable contract expenses. If they did, returns would be lower than those shown. How the Fund has performed in the past does not necessarily indicate how the Fund will perform in the future. Updated performance information, current through the most recent month end, is available by calling (833) 840-3937 or visiting the Fund’s website at www.naafunds.com.
The Fund was reorganized as of the close of business on October 25, 2024, from Series Y (StylePlus-Large Growth Series), a series of Guggenheim Variable Funds Trust (the “Predecessor Fund”). As a result of the reorganization, the Fund is the accounting successor of the Predecessor Fund. Performance results shown in the bar chart and the performance table below for periods prior to October 25, 2024 reflect the performance of the Predecessor Fund prior to the commencement of the Fund’s operations.
|
During the periods shown in the chart above: |
Quarter Ended | Return |
| Highest Quarter | June 30, 2020 | 30.06% |
| Lowest Quarter | June 30, 2022 | -21.71% |
| One Year | Five Years | 10 Years | |
| NAA Large Growth Series – Class S* | 17.02% | 13.89% | 17.04% |
| S&P 500® Growth Index (reflects no deduction for fees, expenses, or taxes) |
22.23% | 15.03% | 16.99% |
| * | Returns are not presented for Class L shares. That share class has not commenced operations as of the date of this Prospectus. Performance information for Class L shares will be shown when that share class has a full calendar year of operations. |
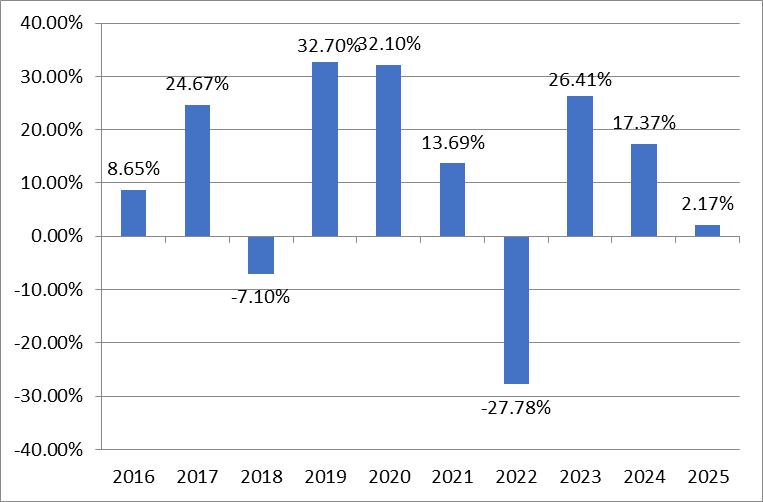
The bar chart and table that follow provide some indication of the risks of investing in the Fund by showing changes in the Fund’s performance from year to year and by showing how the Fund’s average annual total returns for the one, five, and ten year or, if shorter, since inception periods, as applicable, for the Fund’s shares compare with those of a broad-based securities market index. The bar chart and table do not reflect the impact of variable contract expenses. If they did, returns would be lower than those shown. How the Fund has performed in the past does not necessarily indicate how the Fund will perform in the future. Updated performance information, current through the most recent month end, is available by calling (833) 840-3937 or visiting the Fund’s website at www.naafunds.com.
The Fund was reorganized as of the close of business on October 25, 2024, from Series J (StylePlus-Mid Cap Growth Series), a series of Guggenheim Variable Funds Trust (the “Predecessor Fund”). As a result of the reorganization, the Fund is the accounting successor of the Predecessor Fund. Performance results shown in the bar chart and the performance table below for periods prior to October 25, 2024 reflect the performance of the Predecessor Fund prior to the commencement of the Fund’s operations.
|
During the periods shown in the chart above: |
Quarter Ended | Return |
| Highest Quarter | June 30, 2020 | 32.11% |
| Lowest Quarter | March 31, 2020 | -23.91% |
| One Year | Five Years | 10 Years | |
| NAA Mid Growth Series | 2.17% | 4.48% | 10.63% |
| S&P MidCap 400® Growth Index (reflects no deduction for fees, expenses or taxes) |
7.46% | 7.12% | 10.44% |
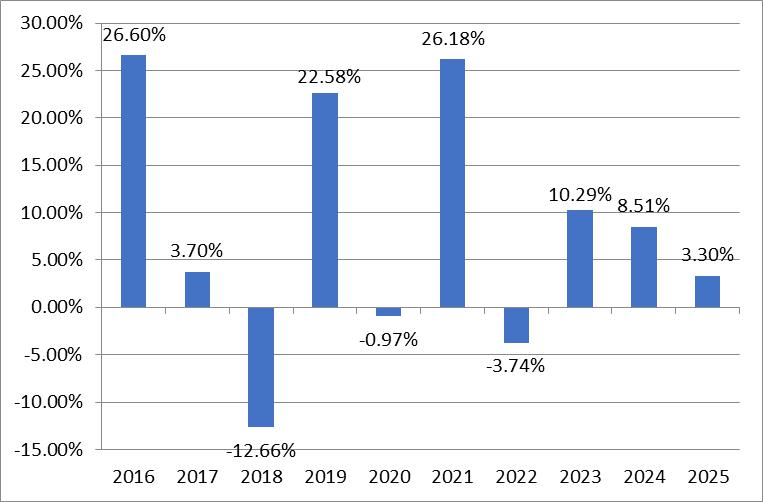
The bar chart and table that follow provide some indication of the risks of investing in the Fund by showing changes in the Fund’s performance from year to year and by showing how the Fund’s average annual total returns for the one, five, and ten year or, if shorter, since inception periods, as applicable, for the Fund’s shares compare with those of a broad-based securities market index. The bar chart and table do not reflect the impact of variable contract expenses. If they did, returns would be lower than those shown. How the Fund has performed in the past does not necessarily indicate how the Fund will perform in the future. Updated performance information, current through the most recent month end, is available by calling (833) 840-3937 or visiting the Fund’s website at www.naafunds.com.
The Fund was reorganized as of the close of business on October 25, 2024, from Series Q (Small Cap Value Series), a series of Guggenheim Variable Funds Trust (the “Predecessor Fund”). As a result of the reorganization, the Fund is the accounting successor of the Predecessor Fund. Performance results shown in the bar chart and the performance table below for periods prior to October 25, 2024 reflect the performance of the Predecessor Fund prior to the commencement of the Fund’s operations.
|
During the periods shown in the chart above: |
Quarter Ended | Return |
| Highest Quarter | December 31, 2020 | 26.75% |
| Lowest Quarter | March 31, 2020 | -33.97% |
| One Year | Five Years | 10 Years | |
| NAA Small Cap Value Series | 3.30% | 8.47% | 7.65% |
| S&P Small Cap 600 Value Index (reflects no deduction for fees, expenses, or taxes) |
6.71% | 8.96% | 9.63% |
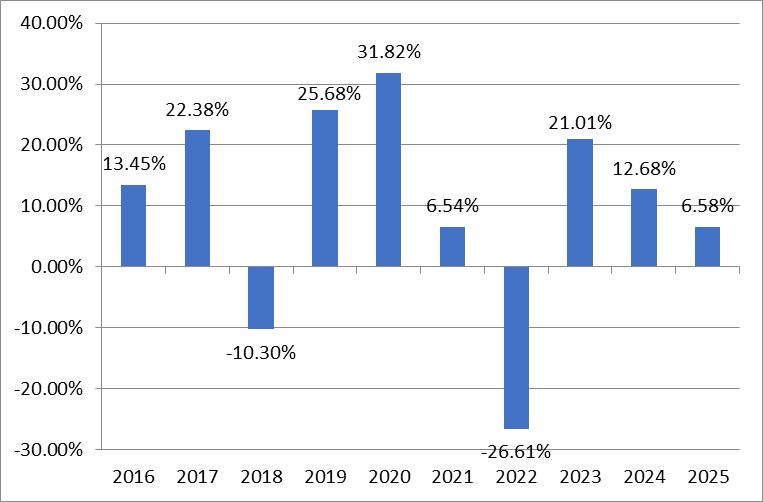
The bar chart and table that follow provide some indication of the risks of investing in the Fund by showing changes in the Fund’s performance from year to year and by showing how the Fund’s average annual total returns for the one, five, and ten year or, if shorter, since inception periods, as applicable, for the Fund’s shares compare with those of a broad-based securities market index. The bar chart and table do not reflect the impact of variable contract expenses. If they did, returns would be lower than those shown. How the Fund has performed in the past does not necessarily indicate how the Fund will perform in the future. Updated performance information, current through the most recent month end, is available by calling (833) 840-3937 or visiting the Fund’s website at www.naafunds.com.
The Fund was reorganized as of the close of business on October 25, 2024, from Series X (StylePlus-Small Growth Series), a series of Guggenheim Variable Funds Trust (the “Predecessor Fund”). As a result of the reorganization, the Fund is the accounting successor of the Predecessor Fund. Performance results shown in the bar chart and the performance table below for periods prior to October 25, 2024 reflect the performance of the Predecessor Fund prior to the commencement of the Fund’s operations.
|
During the periods shown in the chart above: |
Quarter Ended | Return |
| Highest Quarter | June 30, 2020 | 32.21% |
| Lowest Quarter | March 31, 2020 | -28.59% |
| One Year | Five Years | 10 Years | |
| NAA Small Growth Series | 6.58% | 2.59% | 8.89% |
| S&P Small Cap 600 Growth Index (reflects no deduction for fees, expenses, or taxes) |
5.38% | 5.54% | 9.82% |
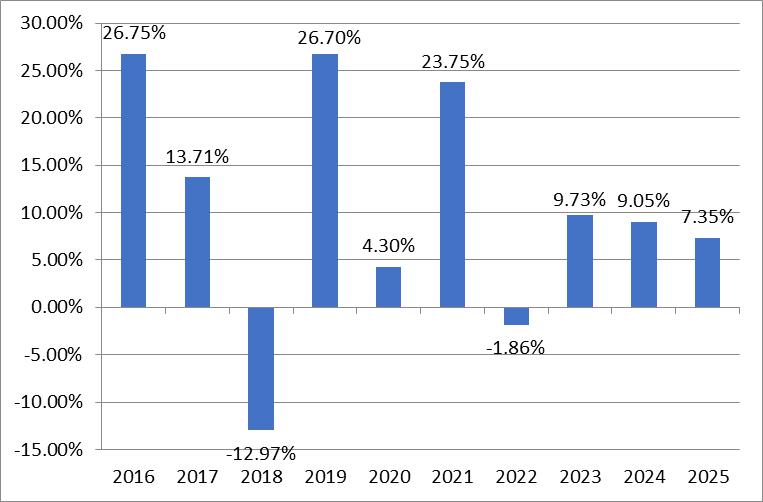
The bar chart and table that follow provide some indication of the risks of investing in the Fund by showing changes in the Fund’s performance from year to year and by showing how the Fund’s average annual total returns for the one, five, and ten year or, if shorter, since inception periods, as applicable, for the Fund’s shares compare with those of a broad-based securities market index. The bar chart and table do not reflect the impact of variable contract expenses. If they did, returns would be lower than those shown. How the Fund has performed in the past does not necessarily indicate how the Fund will perform in the future. Updated performance information, current through the most recent month end, is available by calling (833) 840-3937 or visiting the Fund’s website at .
The Fund was reorganized as of the close of business on October 25, 2024, from Series V (Smid Cap Value Series), a series of Guggenheim Variable Funds Trust (the “Predecessor Fund”). As a result of the reorganization, the Fund is the accounting successor of the Predecessor Fund. Performance results shown in the bar chart and the performance table below for periods prior to October 25, 2024 reflect the performance of the Predecessor Fund prior to the commencement of the Fund’s operations.
|
During the periods shown in the chart above: |
Quarter Ended | Return |
| Highest Quarter | December 31, 2020 | 23.86% |
| Lowest Quarter | March 31, 2020 | -30.99% |
| One Year | Five Years | 10 Years | |
| NAA SMid-Cap Value Series | 7.35% | 9.30% | 9.97% |
| S&P 1000 Value Index (reflects no deduction for fees, expenses, or taxes) |
7.37% | 10.41% | 10.37% |
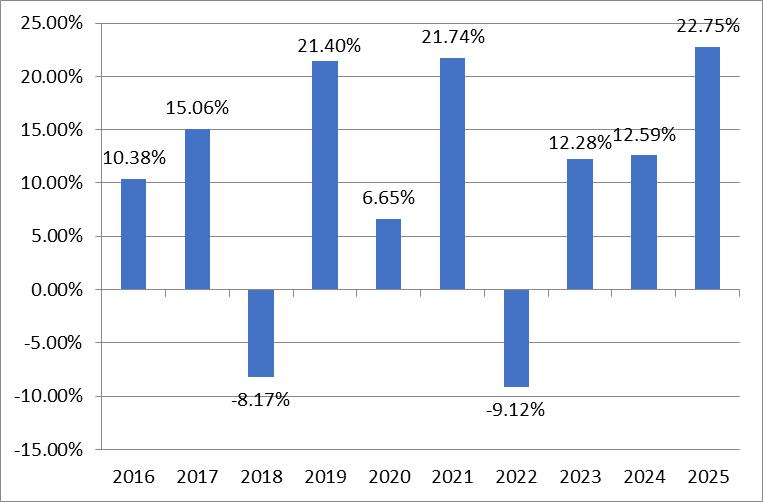
Class L shares of the Fund have not commenced operations as of the date of this Prospectus, and do not have a full calendar year of performance history. The bar chart and table that follow provide some indication of the risks of investing in shares of the Fund by showing changes in the Fund’s Class S shares performance from year to year and by showing how the Fund’s Class S share average annual total returns for the one, five, and ten year or, if shorter, since inception periods, as applicable, for the Fund’s shares compare with those of a broad-based securities market index. Class L shares would have had substantially similar annual returns to Class S shares because the shares are invested in the same portfolio of securities and the annual returns differ only to the extent that the share classes do not have the same expenses. The bar chart and table do not reflect the impact of variable contract expenses. If they did, returns would be lower than those shown. How the Fund has performed in the past does not necessarily indicate how the Fund will perform in the future. Updated performance information, current through the most recent month end, is available by calling (833) 840-3937 or visiting the Fund’s website at www.naafunds.com.
The Fund was reorganized as of the close of business on October 25, 2024, from Series D (World Equity Income Series), a series of Guggenheim Variable Funds Trust (the “Predecessor Fund”). As a result of the reorganization, the Fund is the accounting successor of the Predecessor Fund. Performance results shown in the bar chart and the performance table below for periods prior to October 25, 2024 reflect the performance of the Predecessor Fund prior to the commencement of the Fund’s operations.
|
During the periods shown in the chart above: |
Quarter Ended | Return |
| Highest Quarter | June 30, 2020 | 16.77% |
| Lowest Quarter | March 31, 2020 | -23.25% |
| One Year | Five Years | 10 Years | |
| NAA World Equity Income Series – Class S* | 22.75% | 11.42% | 9.99% |
| S&P Developed BMI Index (reflects no deduction for fees, expenses, or taxes) |
22.26% | 11.73% | 12.21% |
| * | Returns are not presented for Class L shares. That share class has not commenced operations as of the date of this Prospectus. Performance information for Class L shares will be shown when that share class has a full calendar year of operations. |