Exhibit 99.1
An AI - Powered Marketplace Platform Helping SMBs Access Better Self - Funded Health Plans
Disclaimer & Safe Harbor This presentation has been prepared by the Health In Tech, Inc. (the “Company,” “Health In Tech,” “HIT,” “we,” “our,” or “us”) solely for informational purposes. The information included herein in this presentation has not been independently verified. No representations, warranties or undertakings, express or implied, are made by the Company or any of its affiliates, advisers or representatives as to, and no reliance should be placed upon, the accuracy, fairness, completeness or correctness of the information or opinions presented or contained in this presentation. By viewing or accessing the information contained in this presentation, you acknowledge and agree that to the fullest extent permitted by law, none of the Company or any of its affiliates, advisers or representatives accept any responsibility whatsoever (in negligence or otherwise) for any loss howsoever arising from any information presented or contained in this presentation or otherwise arising in connection with the presentation. Industry and market data used in this presentation have been obtained from third - party industry publications and sources as well as from research reports prepared for other purposes. The Company has not independently verified the data obtained from the sources and cannot assure you of the data's accuracy or completeness. The information presented or contained in this presentation is subject to change without notice and its accuracy is not guaranteed. None of the Company or any of its affiliates, advisers or representatives make any undertaking to update any such information subsequent to the date hereof. This presentation should not be construed as legal, tax, investment or other advice. This presentation does not constitute or form part of, and should not be construed as, an offer to sell or issue or the solicitation of an offer to buy or acquire securities of the Company, nor shall there be any sale of securities in any state or other jurisdiction to any person or entity to which it is unlawful to make such offer, solicitation or sale in such state or jurisdiction. No part of this presentation shall form the basis of or be relied upon in connection with any contract or commitment whatsoever. Specifically, these materials do not constitute a “prospectus” within the meaning of the U.S. Securities Act of 1933, as amended, and the regulations enacted thereunder. This presentation does not contain all relevant information relating to the Company or its securities, particularly with respect to the risks and special considerations involved with an investment in the securities of the Company. In evaluating its business, the Company uses certain non - GAAP measures as supplemental measures to review and assess its operating and financial performance. These non - GAAP financial measures have limitations as analytical tools, and when assessing the Company’s operating and financial performances, investors should not consider them in isolation, or as a substitute for any consolidated statement of operations data prepared in accordance with U.S. GAAP. Reconciliation of any non - GAAP financial measures to their closest corresponding GAAP measures is provided in the Appendix to this presentation. This presentation contains “forward - looking statements” within the meaning of the “safe harbor” provisions of the Private Securities Litigation Reform Act of 1995, including but not limited to, statements regarding possible or assumed operational results, financial condition and outlook, business strategies and plans, market trends and opportunities, competitive position, industry environment and potential growth opportunities of the Company. These forward - looking statements are based on current expectations, estimates, forecasts and projections. Words such as “expect,” “anticipate,” “should,” “believe,” “hope,” “target,” “project,” “goals,” “estimate,” “potential,” “predict,” “may,” “will,” “might,” “could,” “intend,” “shall” and variations of these terms and similar expressions that convey the uncertainty of future events or outcomes are intended to identify these forward - looking statements, although not all forward - looking statements contain these identifying words. Forward - looking statements are subject to a number of risks and uncertainties, many of which involve factors or circumstances that are beyond our control. Factors that could cause actual results to differ from those projected include, but are not limited to, the following: the Company's liquidity position and ability to access capital; the Company's ability to continue as a going concern; employee attrition and the Company's ability to retain senior management and other key personnel; the Company's ability to enhance its existing products and services; product and service quality issues; and market competition. Further information on these and other factors that could affect the Company's financial results is included in the reports on Form 10 - K, Quarterly Reports on Form 10 - Q and other periodic filings with the Securities and Exchange Commission from time to time. Because of the risks and uncertainties, the Company cautions you not to place undue reliance on these statements, which speak only as of the date of this presentation. There may be additional risks of which we are not presently aware or that we currently believe are immaterial which could have an adverse impact on our business. Except as expressly required by the federal securities laws, we undertake no obligation, and specifically disclaim any obligation, to release any revision to any forward - looking statements to reflect events or circumstances after the date of this presentation or to reflect the occurrence of unanticipated events. 2
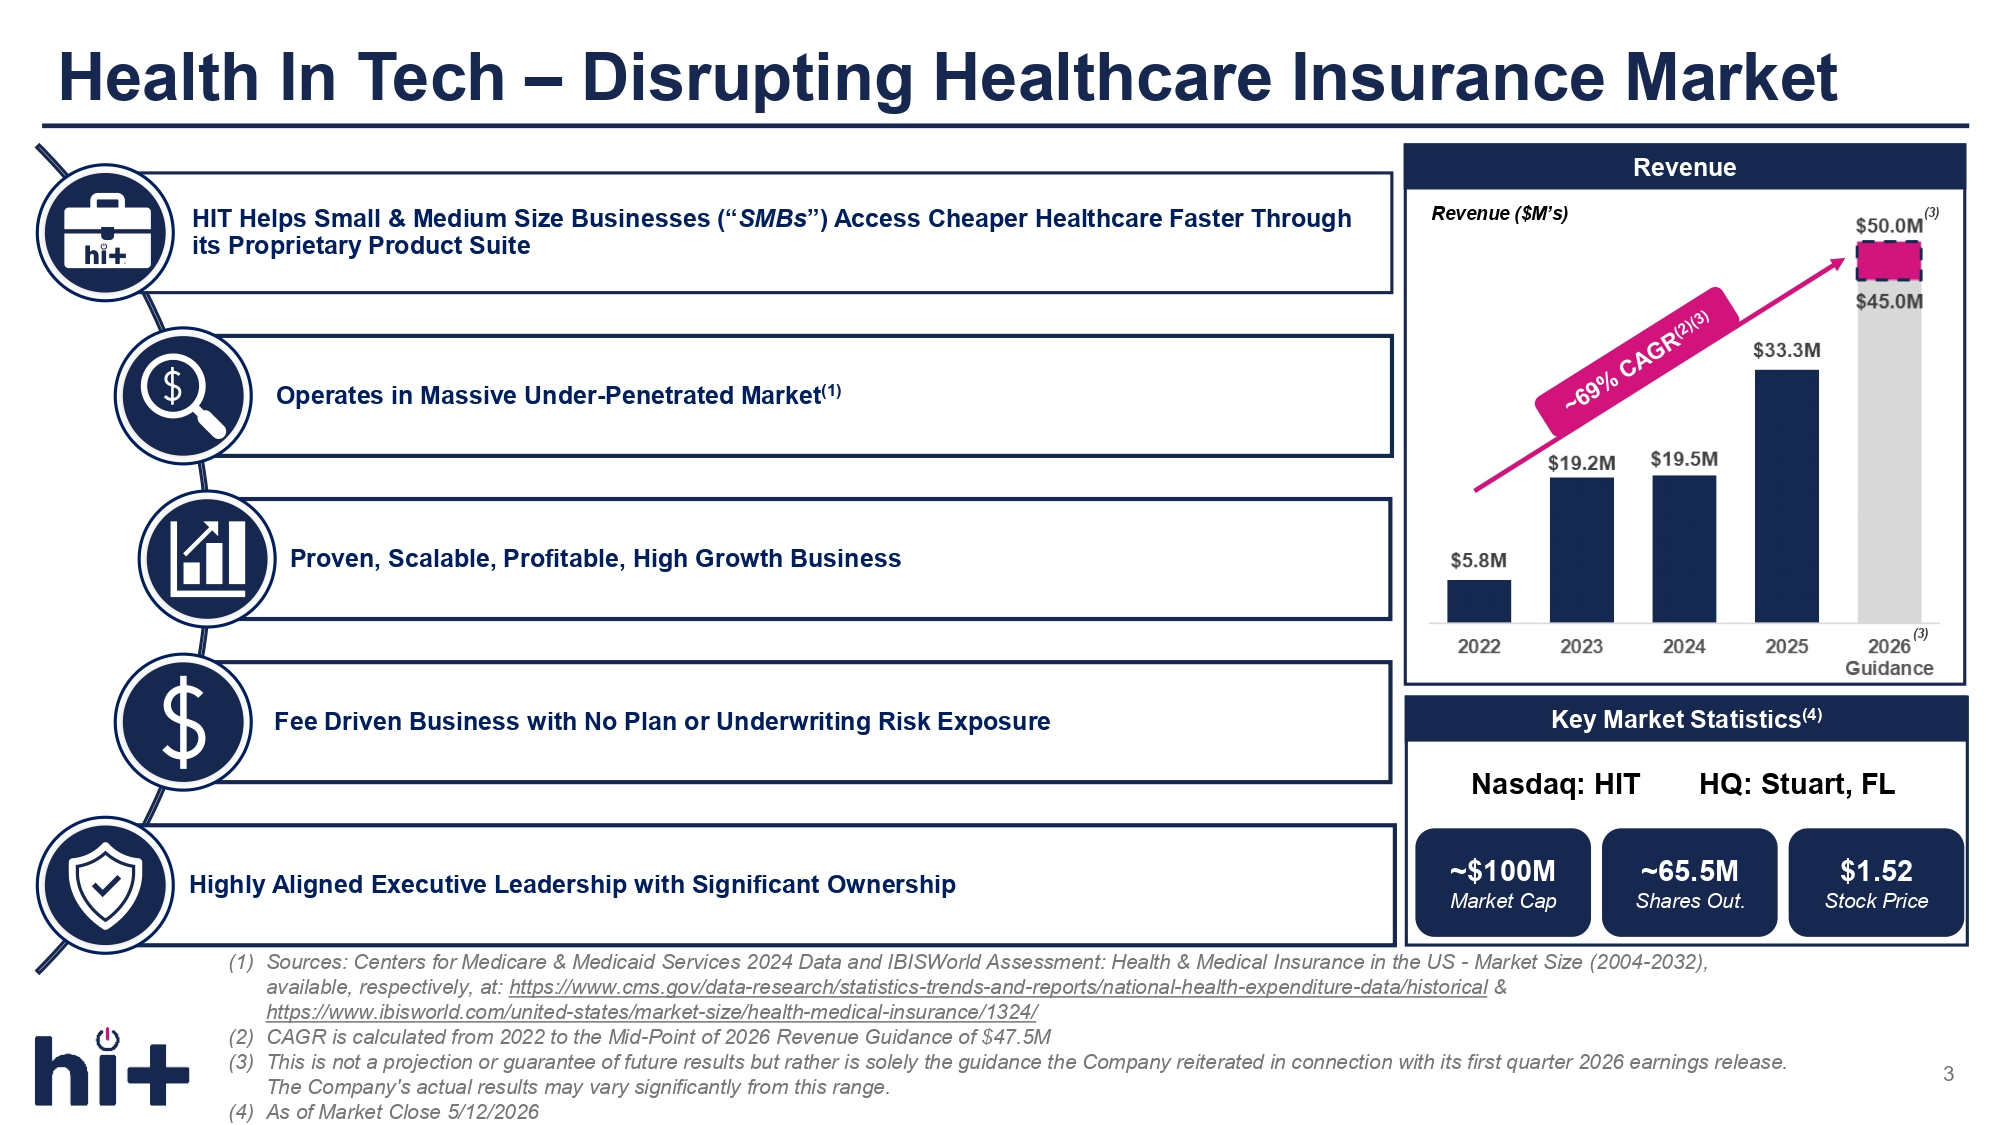
Health In Tech – Disrupting Healthcare Insurance Market (1) Sources: Centers for Medicare & Medicaid Services 2024 Data and IBISWorld Assessment: Health & Medical Insurance in the US - Market Size (2004 - 2032), available, respectively, at: https://www.cms.gov/data - research/statistics - trends - and - reports/national - health - expenditure - data/historical & https://www.ibisworld.com/united - states/market - size/health - medical - insurance/1324/ (2) CAGR is calculated from 2022 to the Mid - Point of 2026 Revenue Guidance of $47.5M (3) This is not a projection or guarantee of future results but rather is solely the guidance the Company reiterated in connection with its first quarter 2026 earnings release. The Company's actual results may vary significantly from this range. (4) As of Market Close 5/12/2026 HIT Helps Small & Medium Size Businesses (“ SMBs ”) Access Cheaper Healthcare Faster Through its Proprietary Product Suite Operates in Massive Under - Penetrated Market (1) Proven, Scalable, Profitable, High Growth Business Fee Driven Business with No Plan or Underwriting Risk Exposure Highly Aligned Executive Leadership with Significant Ownership Revenue Revenue ($M’s) Key Market Statistics (4) ~$100M Market Cap $1.52 Stock Price ~65.5M Shares Out. Nasdaq: HIT HQ: Stuart, FL 3 (3) (3)

I Business Overview
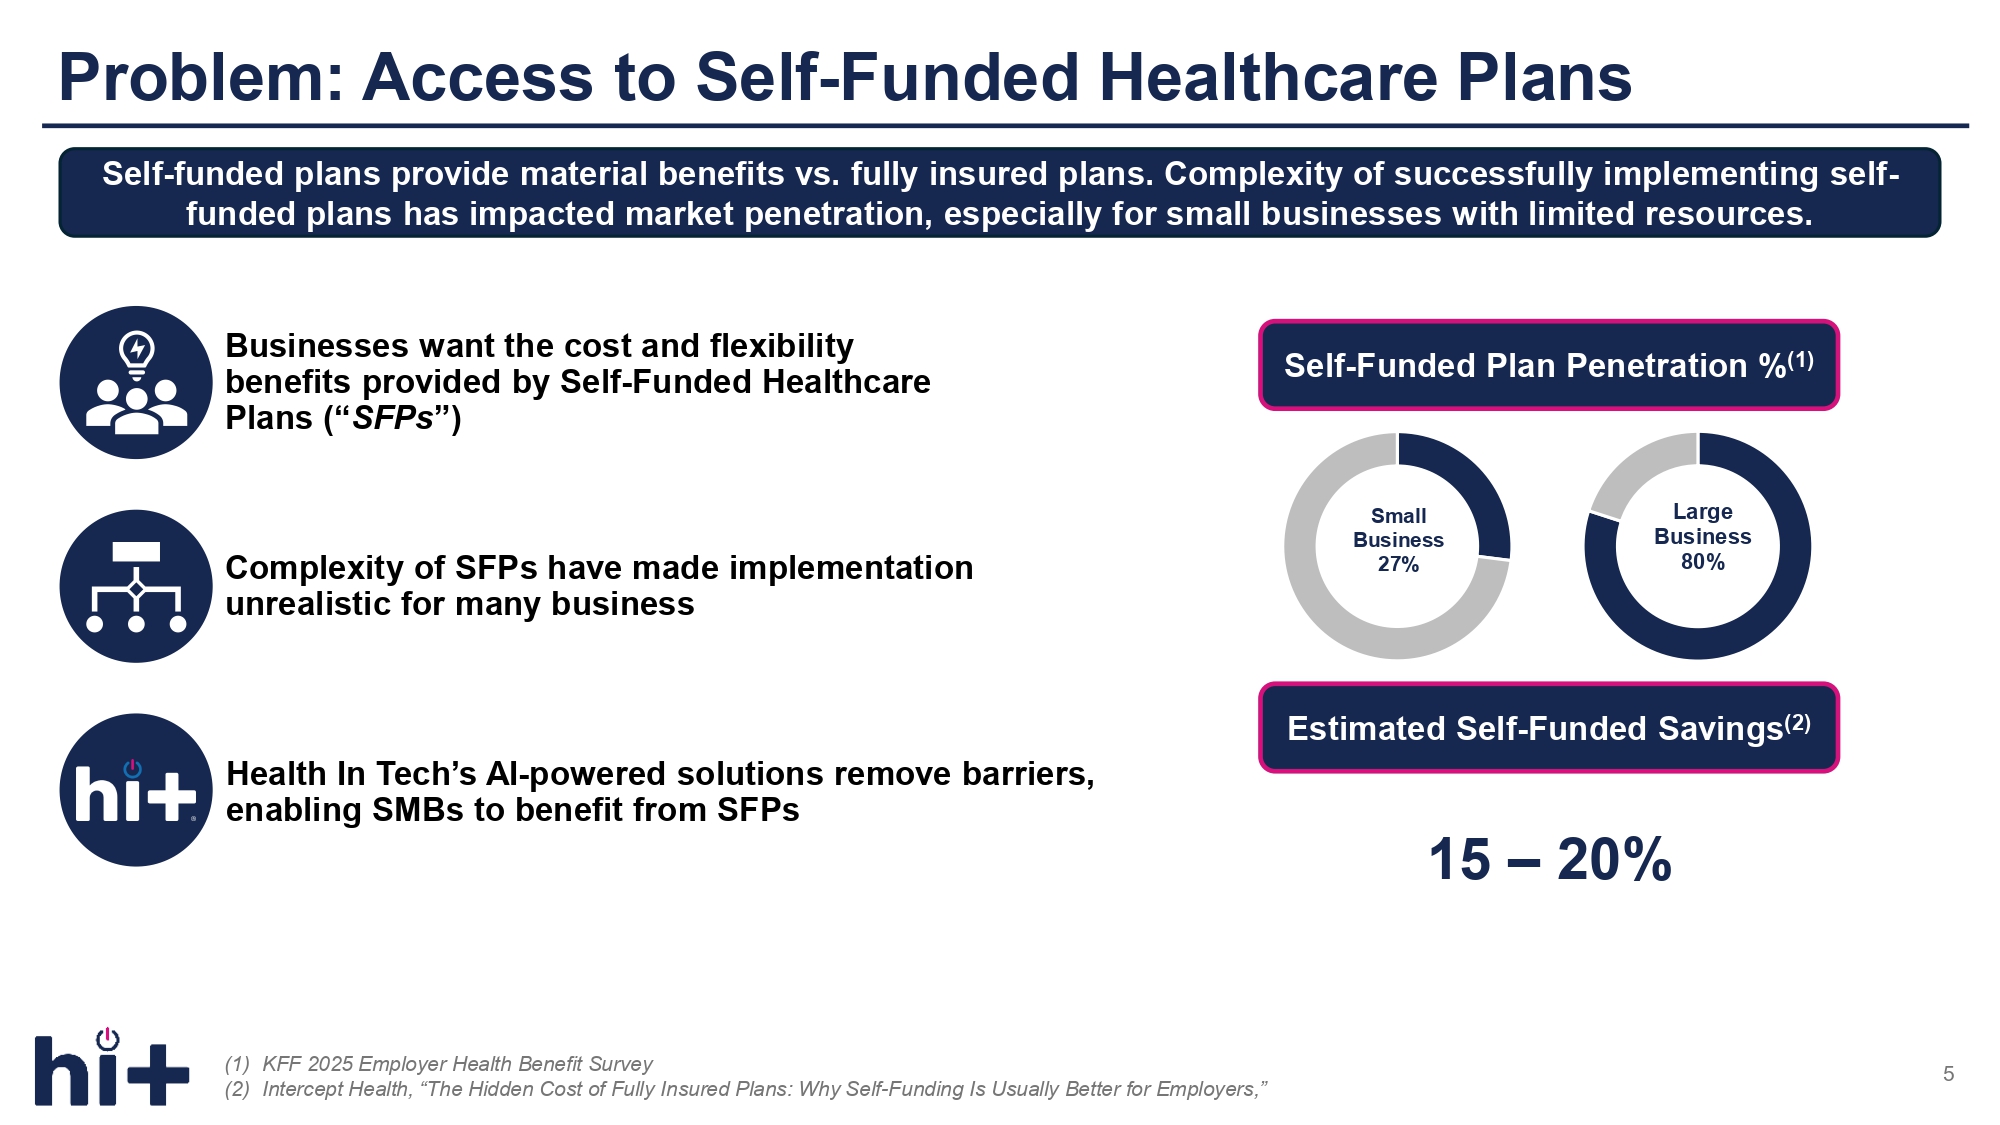
Problem: Access to Self - Funded Healthcare Plans (1) KFF 2025 Employer Health Benefit Survey (2) Intercept Health, “The Hidden Cost of Fully Insured Plans: Why Self - Funding Is Usually Better for Employers,” 5 Businesses want the cost and flexibility benefits provided by Self - Funded Healthcare Plans (“ SFPs ”) Health In Tech’s AI - powered solutions remove barriers, enabling SMBs to benefit from SFPs Self - funded plans provide material benefits vs. fully insured plans. Complexity of successfully implementing self - funded plans has impacted market penetration, especially for small businesses with limited resources. Complexity of SFPs have made implementation unrealistic for many business 15 – 20% Self - Funded Plan Penetration % (1) Small Business 27% Large Business 80% Estimated Self - Funded Savings (2)
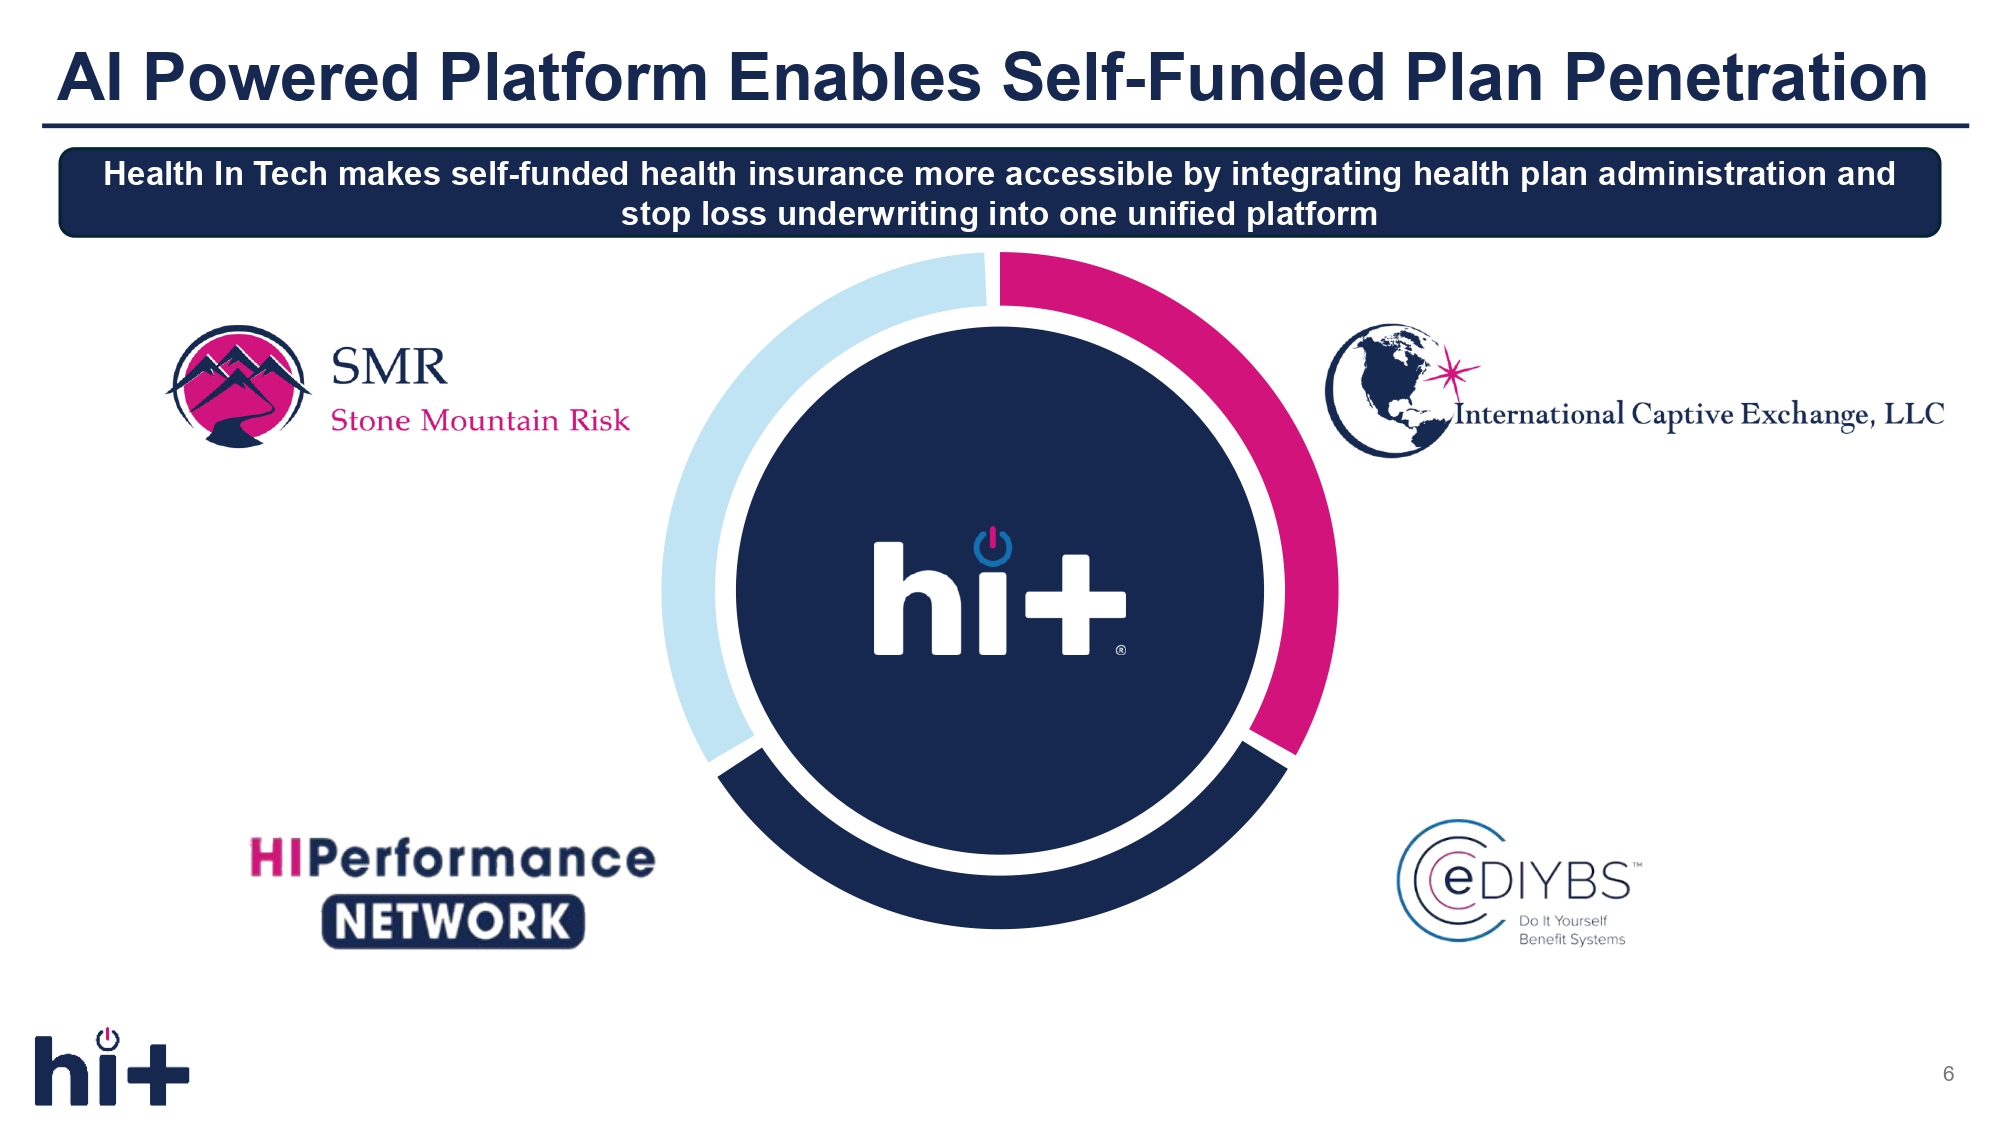
AI Powered Platform Enables Self - Funded Plan Penetration 6 Health In Tech makes self - funded health insurance more accessible by integrating health plan administration and stop loss underwriting into one unified platform
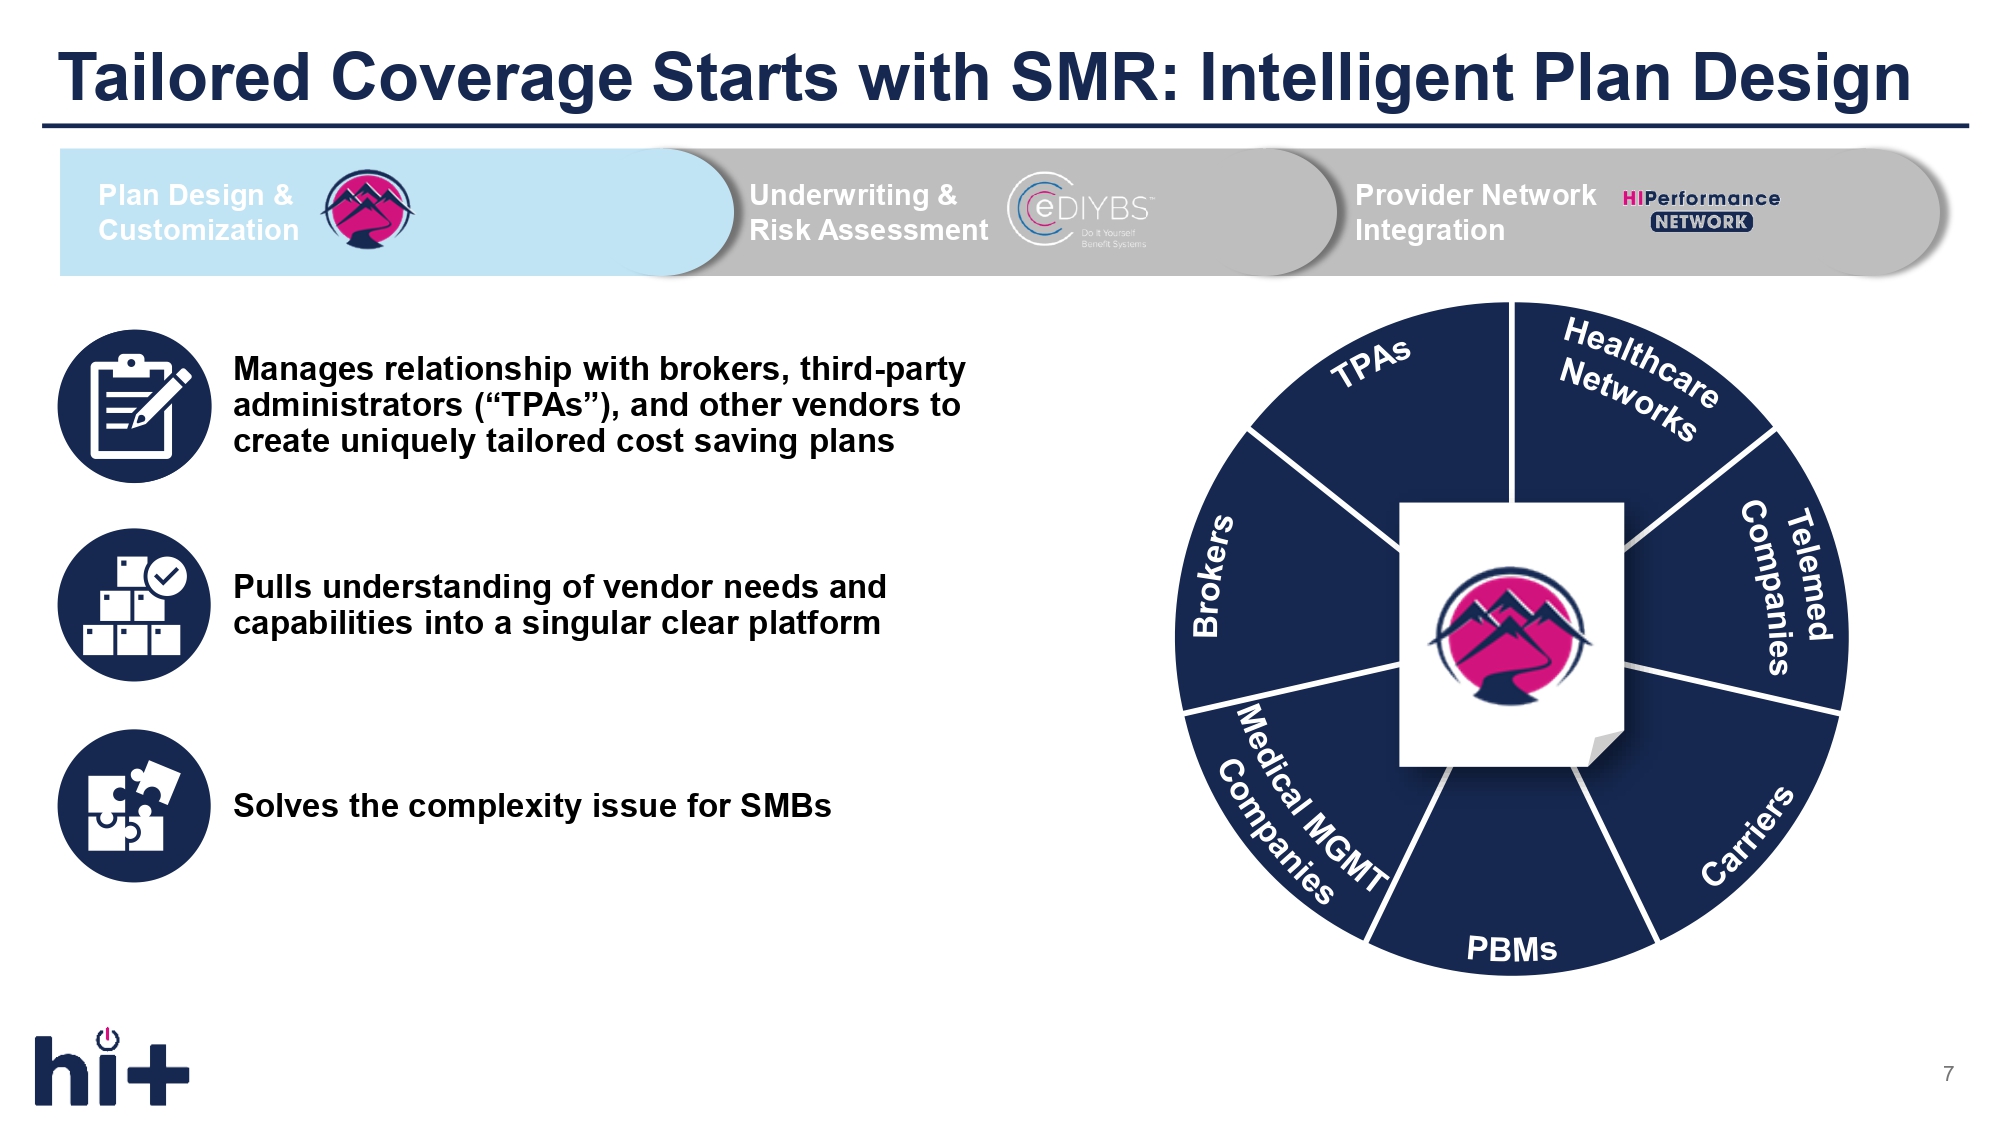
Tailored Coverage Starts with SMR: Intelligent Plan Design 7 Plan Design & Customization Underwriting & Risk Assessment Provider Network Integration Manages relationship with brokers, third - party administrators (“TPAs”), and other vendors to create uniquely tailored cost saving plans Solves the complexity issue for SMBs Pulls understanding of vendor needs and capabilities into a singular clear platform
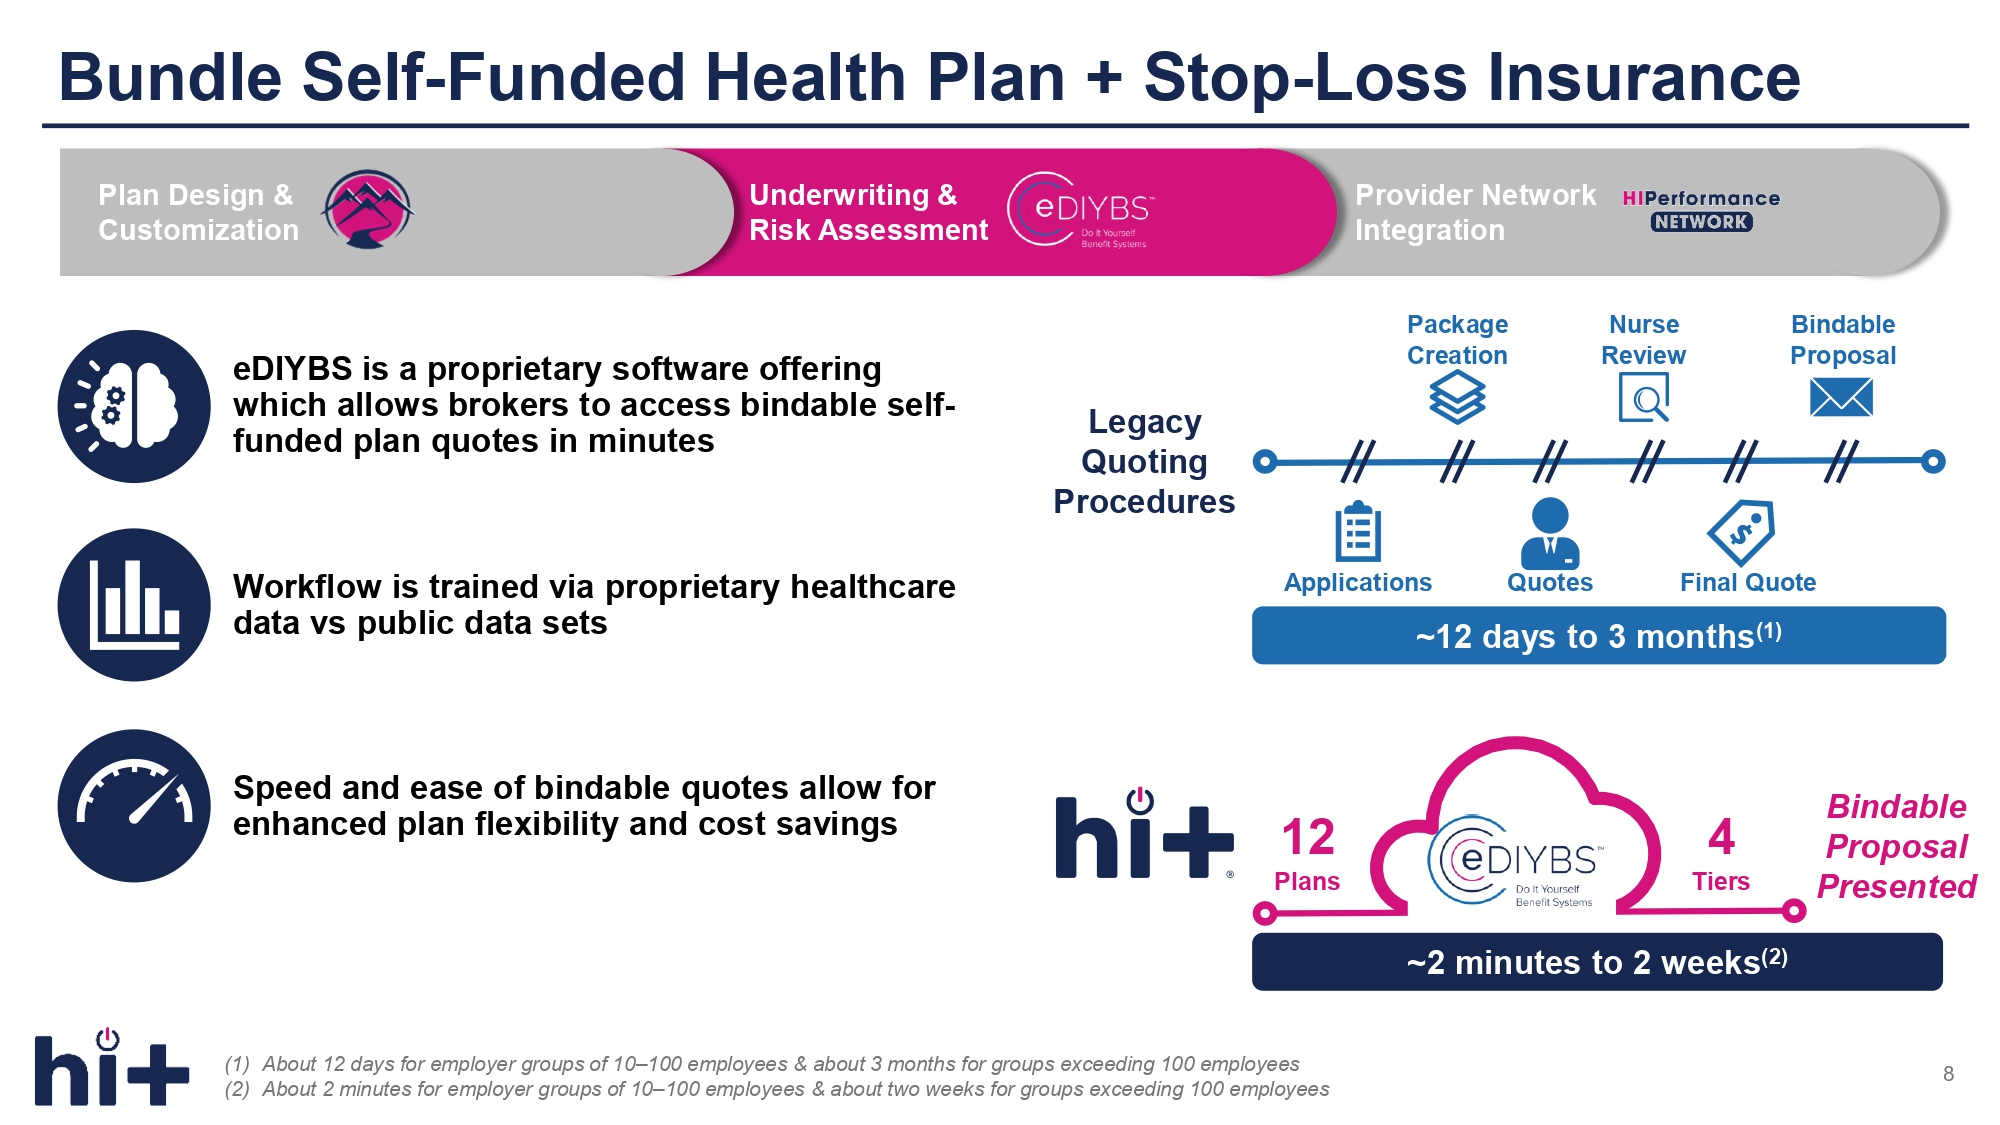
Bundle Self - Funded Health Plan + Stop - Loss Insurance (1) About 12 days for employer groups of 10 – 100 employees & about 3 months for groups exceeding 100 employees (2) About 2 minutes for employer groups of 10 – 100 employees & about two weeks for groups exceeding 100 employees 8 Legacy Quoting Procedures Bindable Proposal Presented 4 Tiers 12 Plans Plan Design & Customization Underwriting & Risk Assessment Provider Network Integration ~2 minutes to 2 weeks (2) Applications Quotes Final Quote ~12 days to 3 months (1) Package Creation Nurse Review Bindable Proposal eDIYBS is a proprietary software offering which allows brokers to access bindable self - funded plan quotes in minutes Speed and ease of bindable quotes allow for enhanced plan flexibility and cost savings Workflow is trained via proprietary healthcare data vs public data sets
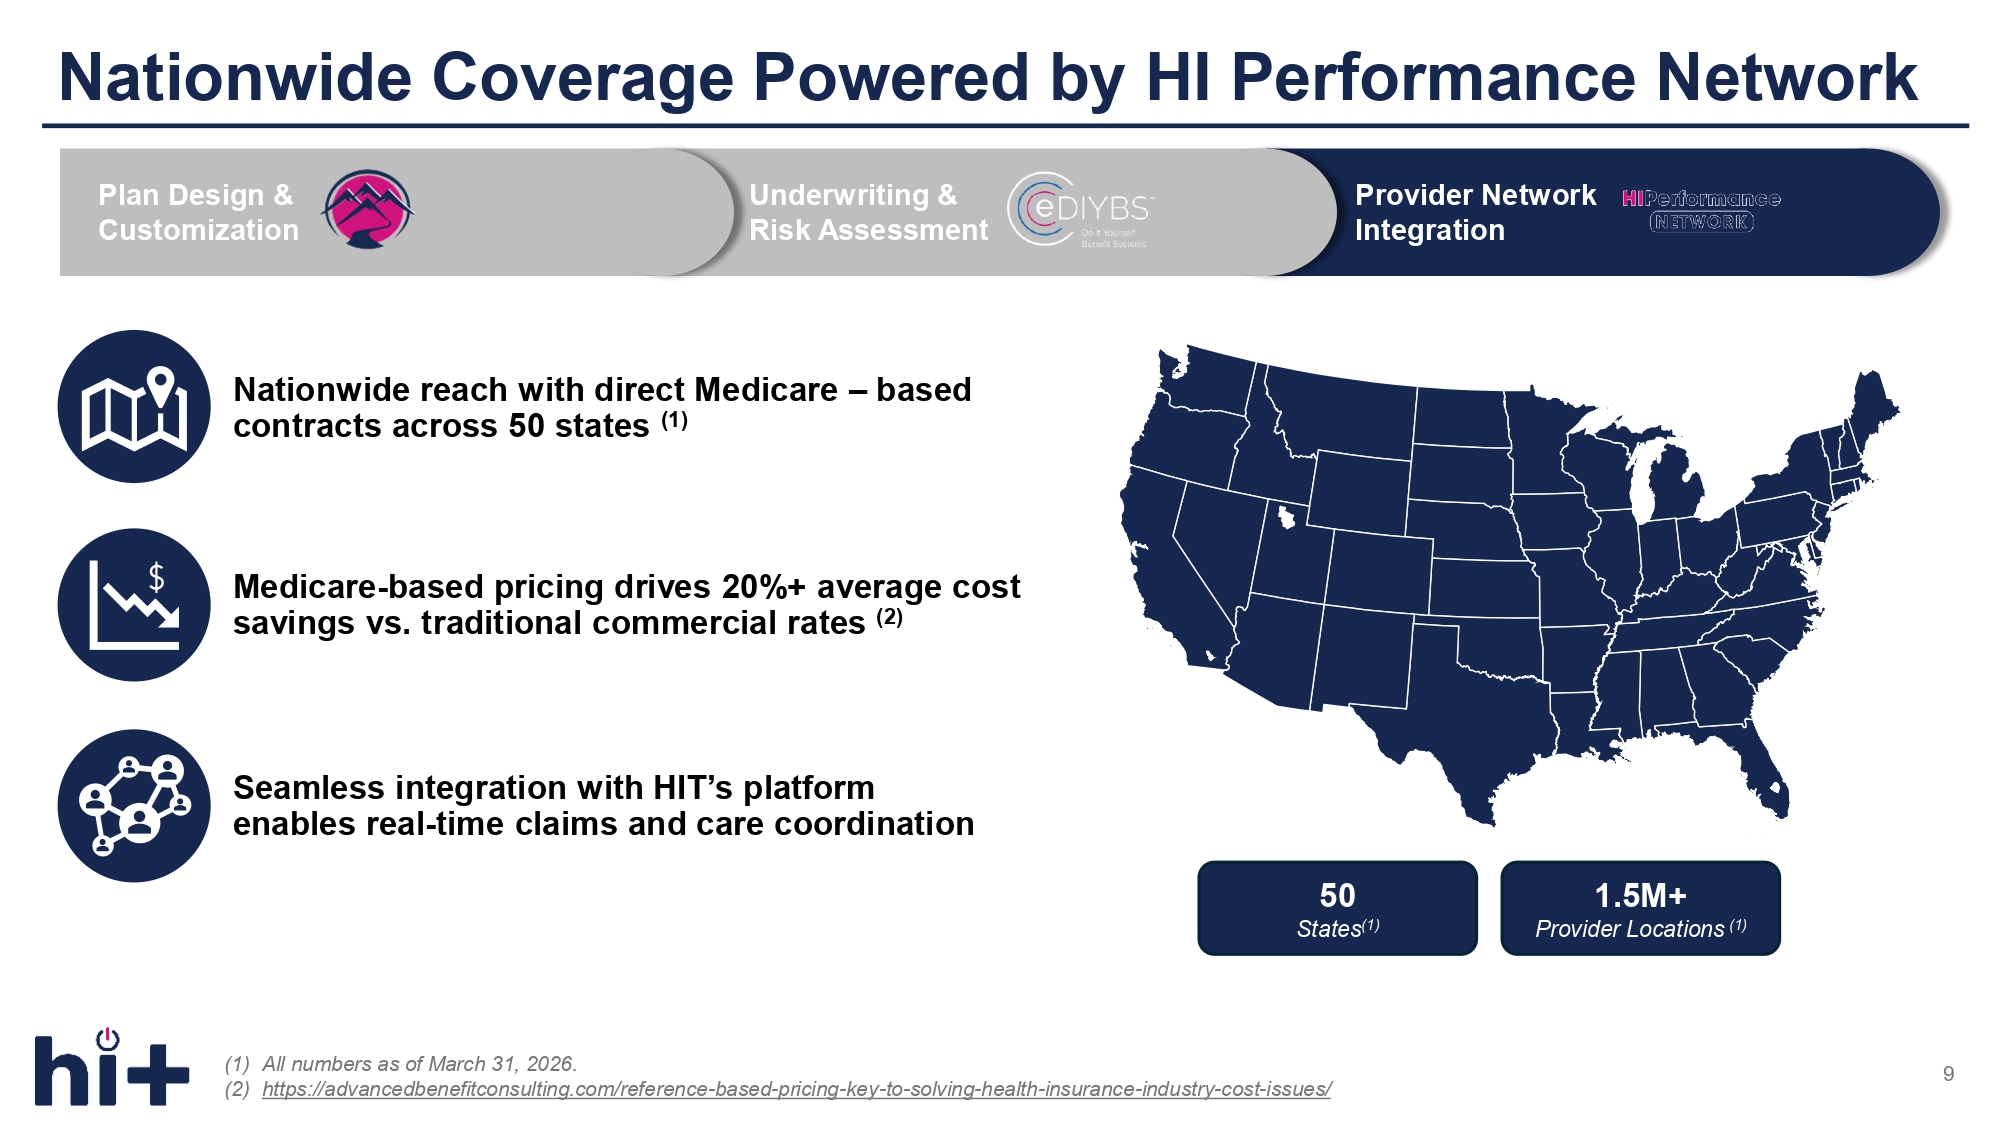
Nationwide Coverage Powered by HI Performance Network (1) All numbers as of March 31, 2026. (2) https://advancedbenefitconsulting.com/reference - based - pricing - key - to - solving - health - insurance - industry - cost - issues/ 50 States (1) 1.5M+ Provider Locations (1) 9 Nationwide reach with direct Medicare – based contracts across 50 states (1) Seamless integration with HIT’s platform enables real - time claims and care coordination Medicare - based pricing drives 20%+ average cost savings vs. traditional commercial rates (2) Plan Design & Customization Underwriting & Risk Assessment Provider Network Integration
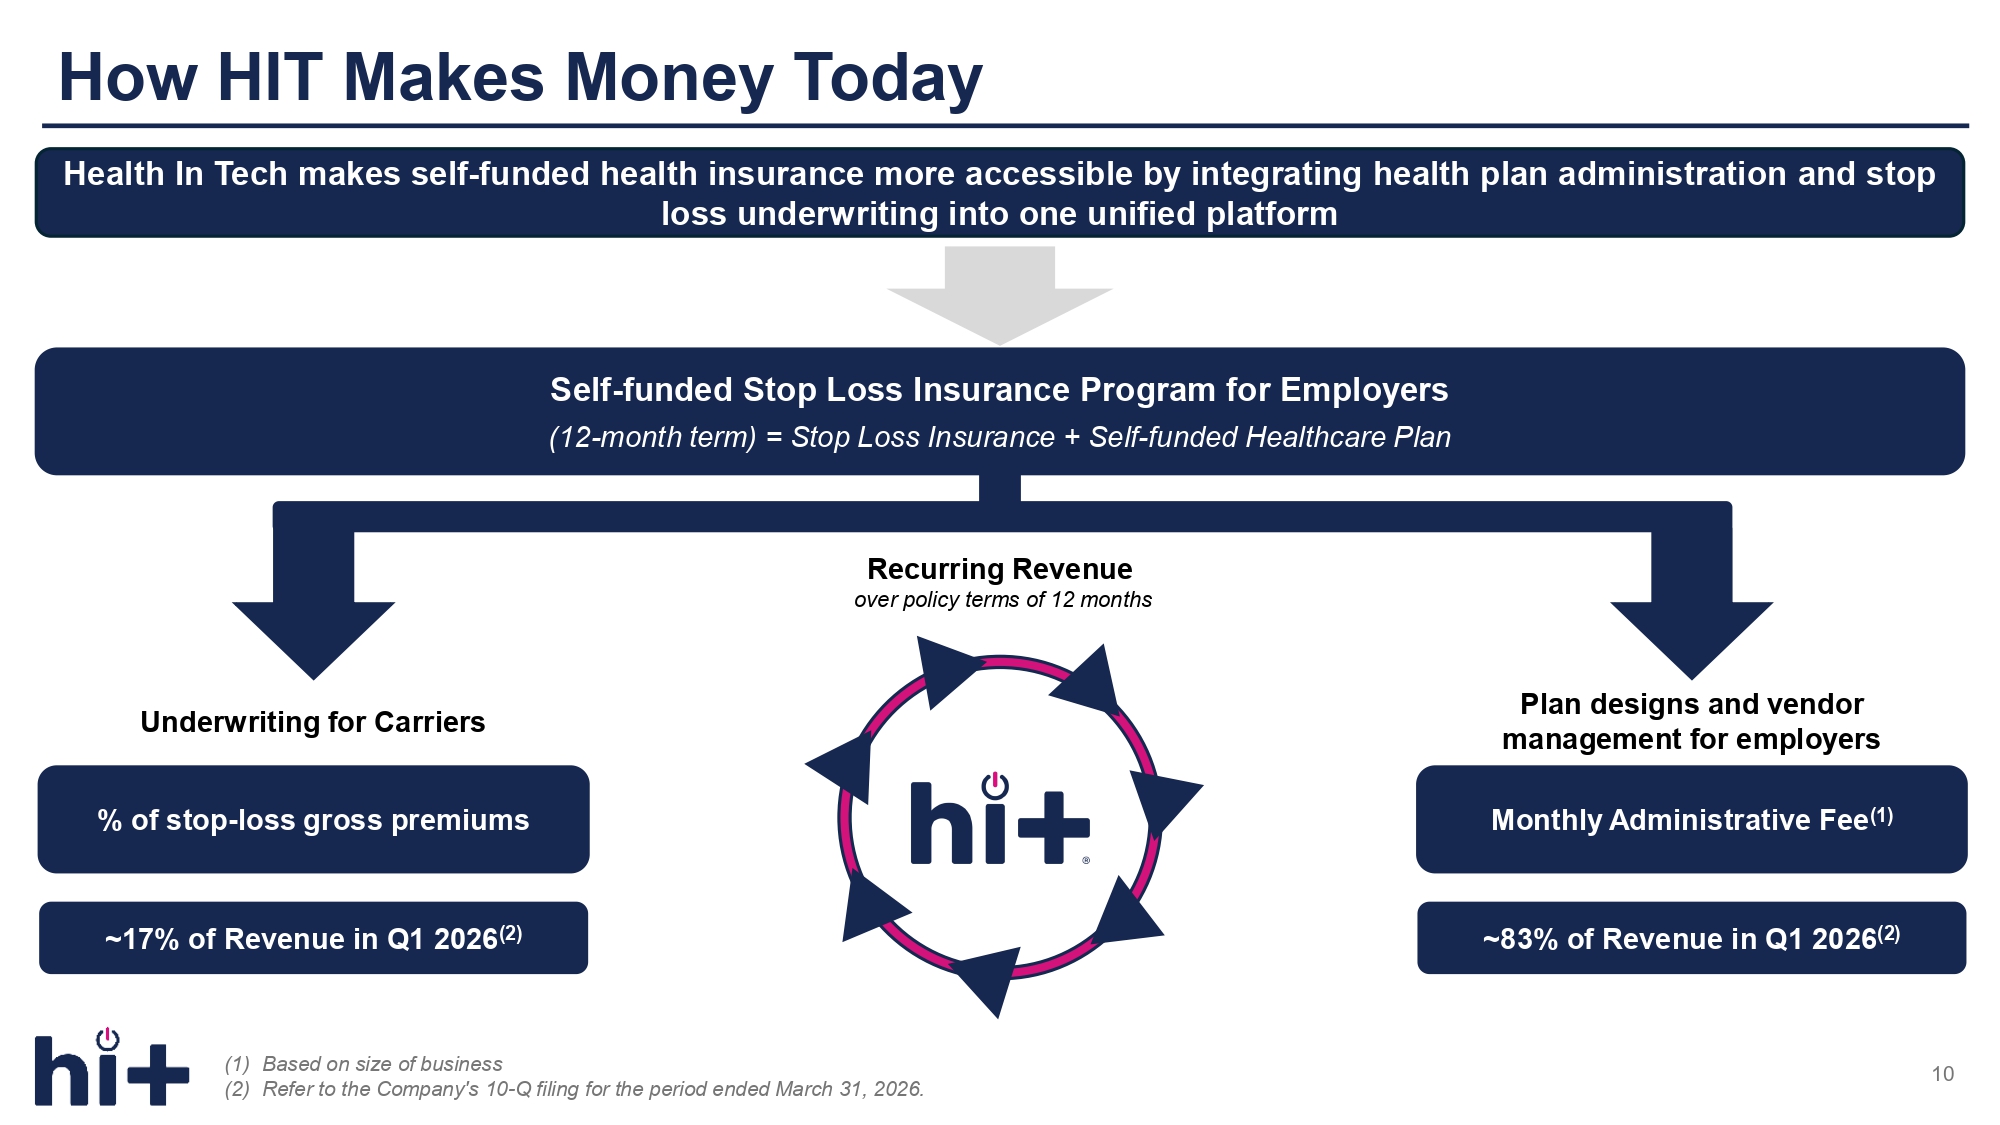
Health In Tech makes self - funded health insurance more accessible by integrating health plan administration and stop loss underwriting into one unified platform How HIT Makes Money Today (1) Based on size of business (2) Refer to the Company's 10 - Q filing for the period ended March 31, 2026. Self - funded Stop Loss Insurance Program for Employers (12 - month term) = Stop Loss Insurance + Self - funded Healthcare Plan Plan designs and vendor management for employers Monthly Administrative Fee (1) Recurring Revenue over policy terms of 12 months Underwriting for Carriers % of stop - loss gross premiums 10 ~17% of Revenue in Q1 2026 (2) ~83% of Revenue in Q1 2026 (2)

As of March 31, 2026 HIT By The Numbers (1) Platform Placed Plan Value represents the aggregate contractual value of self - funded health plans with stop - loss insurance (self - funded stop - loss plans) placed through the Company's platform, covering the duration of the plans' contractual terms. (2) Contracted Revenue represents the aggregate gross dollar value of contractually committed revenue under active policies as of the measurement date that is expected to be recognized in future periods. (3) Adjusted EBITDA represents our net income (loss) before net interest expense, taxes and amortization expense, adjusted to eliminate provision for credit losses on other receivables and stock - based compensation expense, including employer payroll taxes related to stock - based awards. Adjusted EBITDA is not a measure calculated in accordance with United States Generally Accepted Accounting Principles, or GAAP. Please refer to Appendix Slide 23 of this presentation for a reconciliation of Adjusted EBITDA to net income (loss), the most comparable GAAP measurement, for the three months ended March 31, 2026, and 2025 and twelve months ended December 31, 2025. We exclude certain non - recurring or non - cash items when calculating Adjusted EBITDA, and we believe this approach provides a more meaningful measure by offering a clearer view of our underlying operational performance. (4) This is not a projection or guarantee of future results but rather is solely the guidance the Company reiterated in connection with its first quarter 2026 earnings release. The Company's actual results may vary significantly from this range. States with Clients Business Clients 11 Platform Placed Plan Value (1) as of Q1 2026 Brokers, Agencies and TPAs Contracted Revenue (2) Remaining 3Q 2026 38 507 896 $ $82.0M $ $22.9M 2026 Revenue Guidance (4) Adj. EBITDA (3) Revenue $45M - $50M $(1.3)M N/A $8.8M +9% YoY Q1 2026 ~43% YoY Growth at the Midpoint $1.2M +163% YoY $8.0M +56% YoY Q1 2025 $4.1M $33.3M FY 2025 +81% YoY +71% YoY
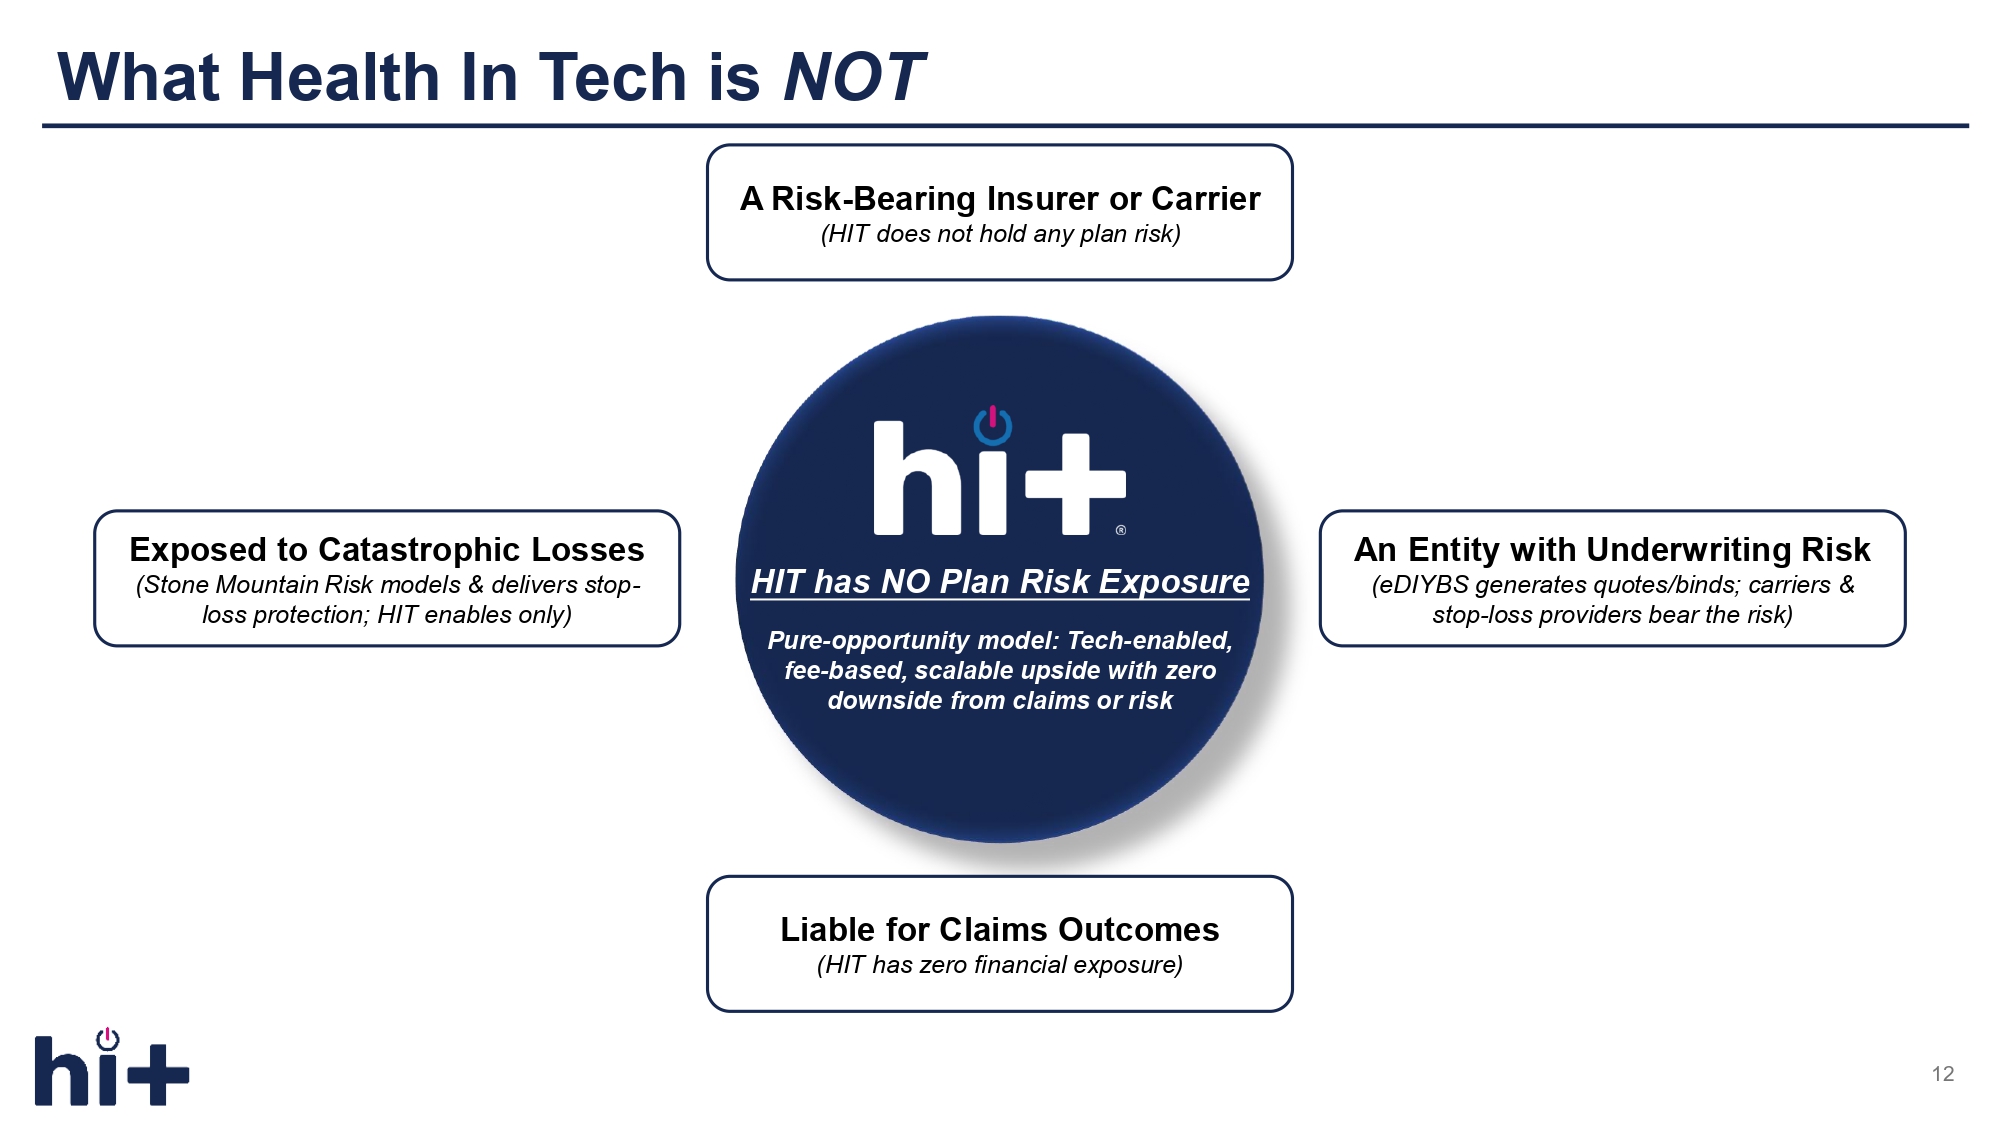
What Health In Tech is NOT A Risk - Bearing Insurer or Carrier (HIT does not hold any plan risk) An Entity with Underwriting Risk (eDIYBS generates quotes/binds; carriers & stop - loss providers bear the risk) Liable for Claims Outcomes (HIT has zero financial exposure) Exposed to Catastrophic Losses (Stone Mountain Risk models & delivers stop - loss protection; HIT enables only) HIT has NO Plan Risk Exposure Pure - opportunity model: Tech - enabled, fee - based, scalable upside with zero downside from claims or risk 12
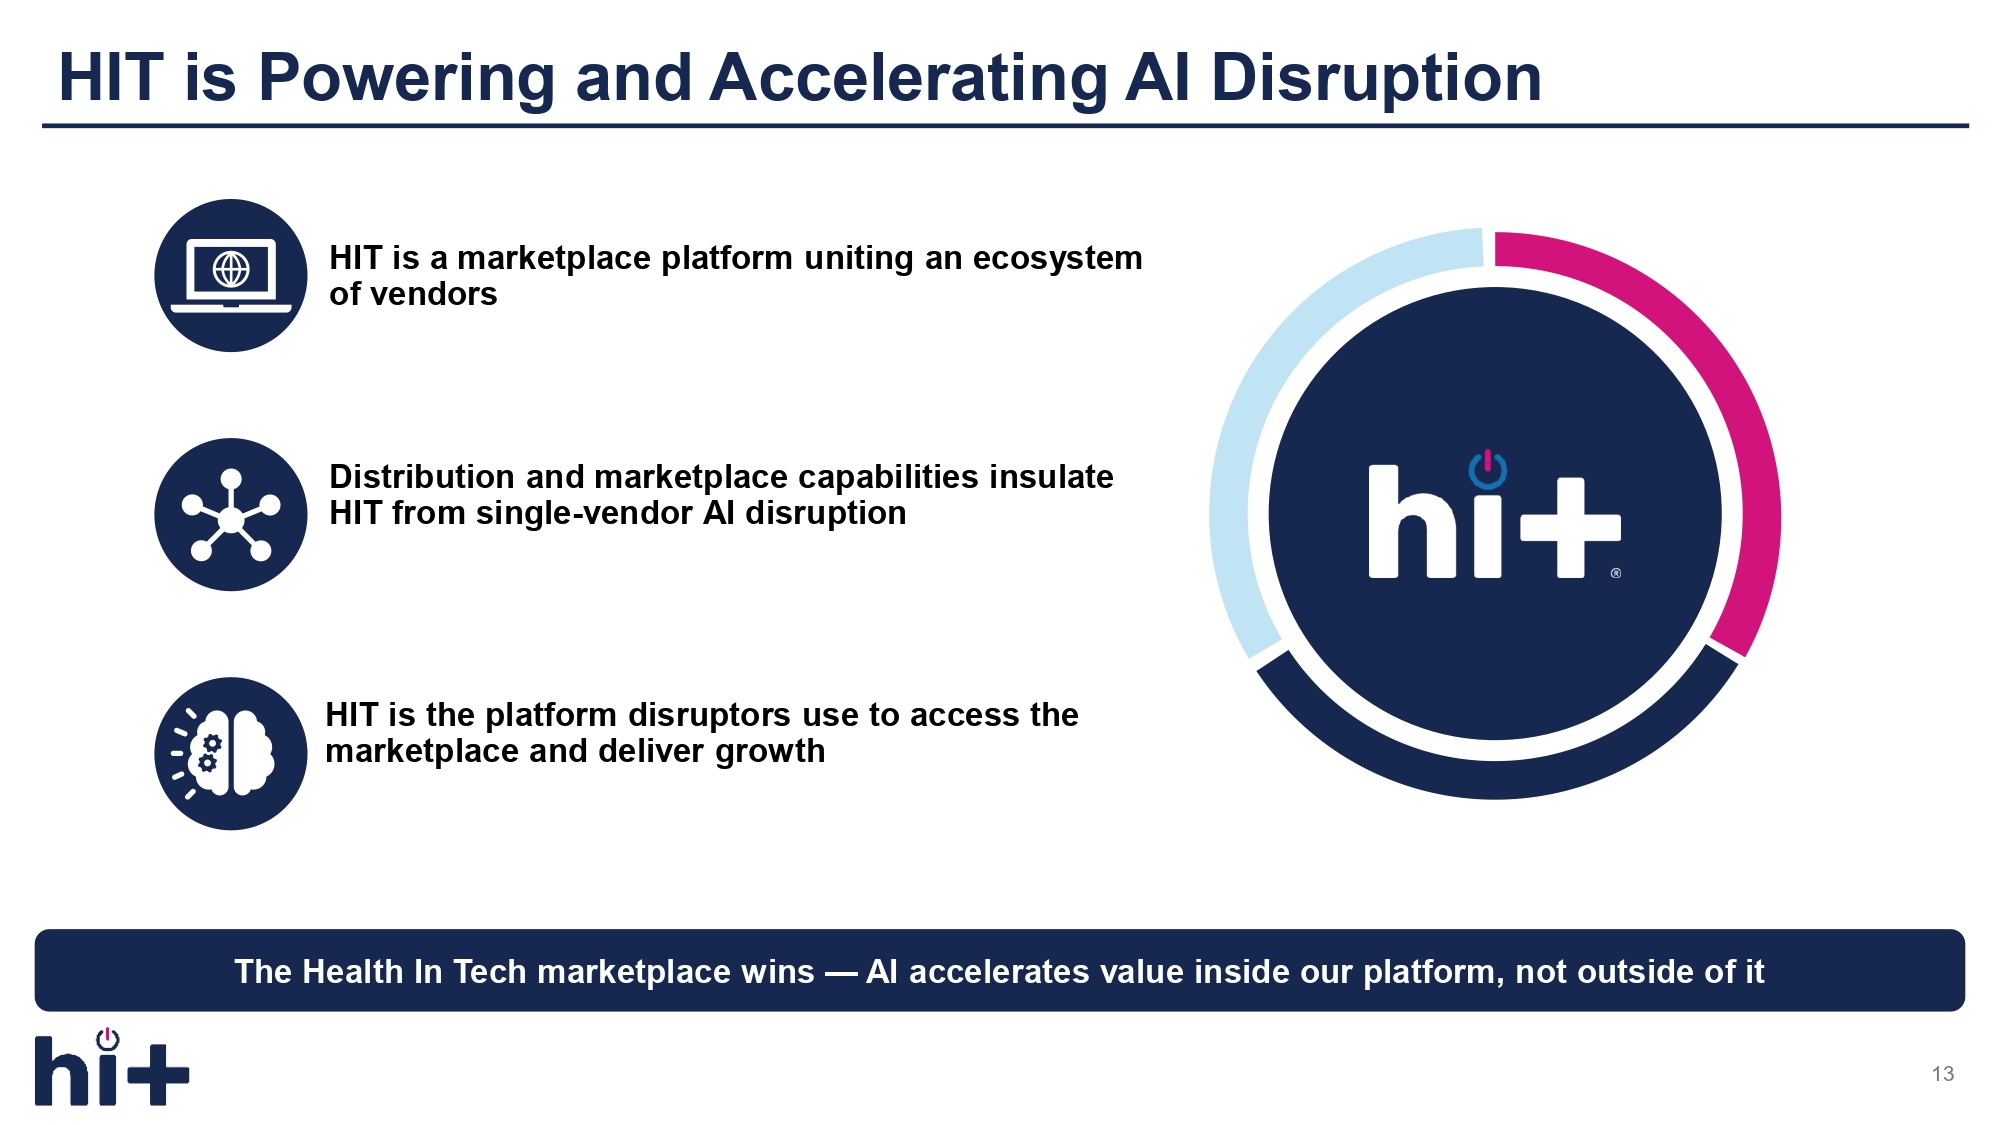
HIT is Powering and Accelerating AI Disruption 13 The Health In Tech marketplace wins — AI accelerates value inside our platform, not outside of it HIT is a marketplace platform uniting an ecosystem of vendors HIT is the platform disruptors use to access the marketplace and deliver growth Distribution and marketplace capabilities insulate HIT from single - vendor AI disruption
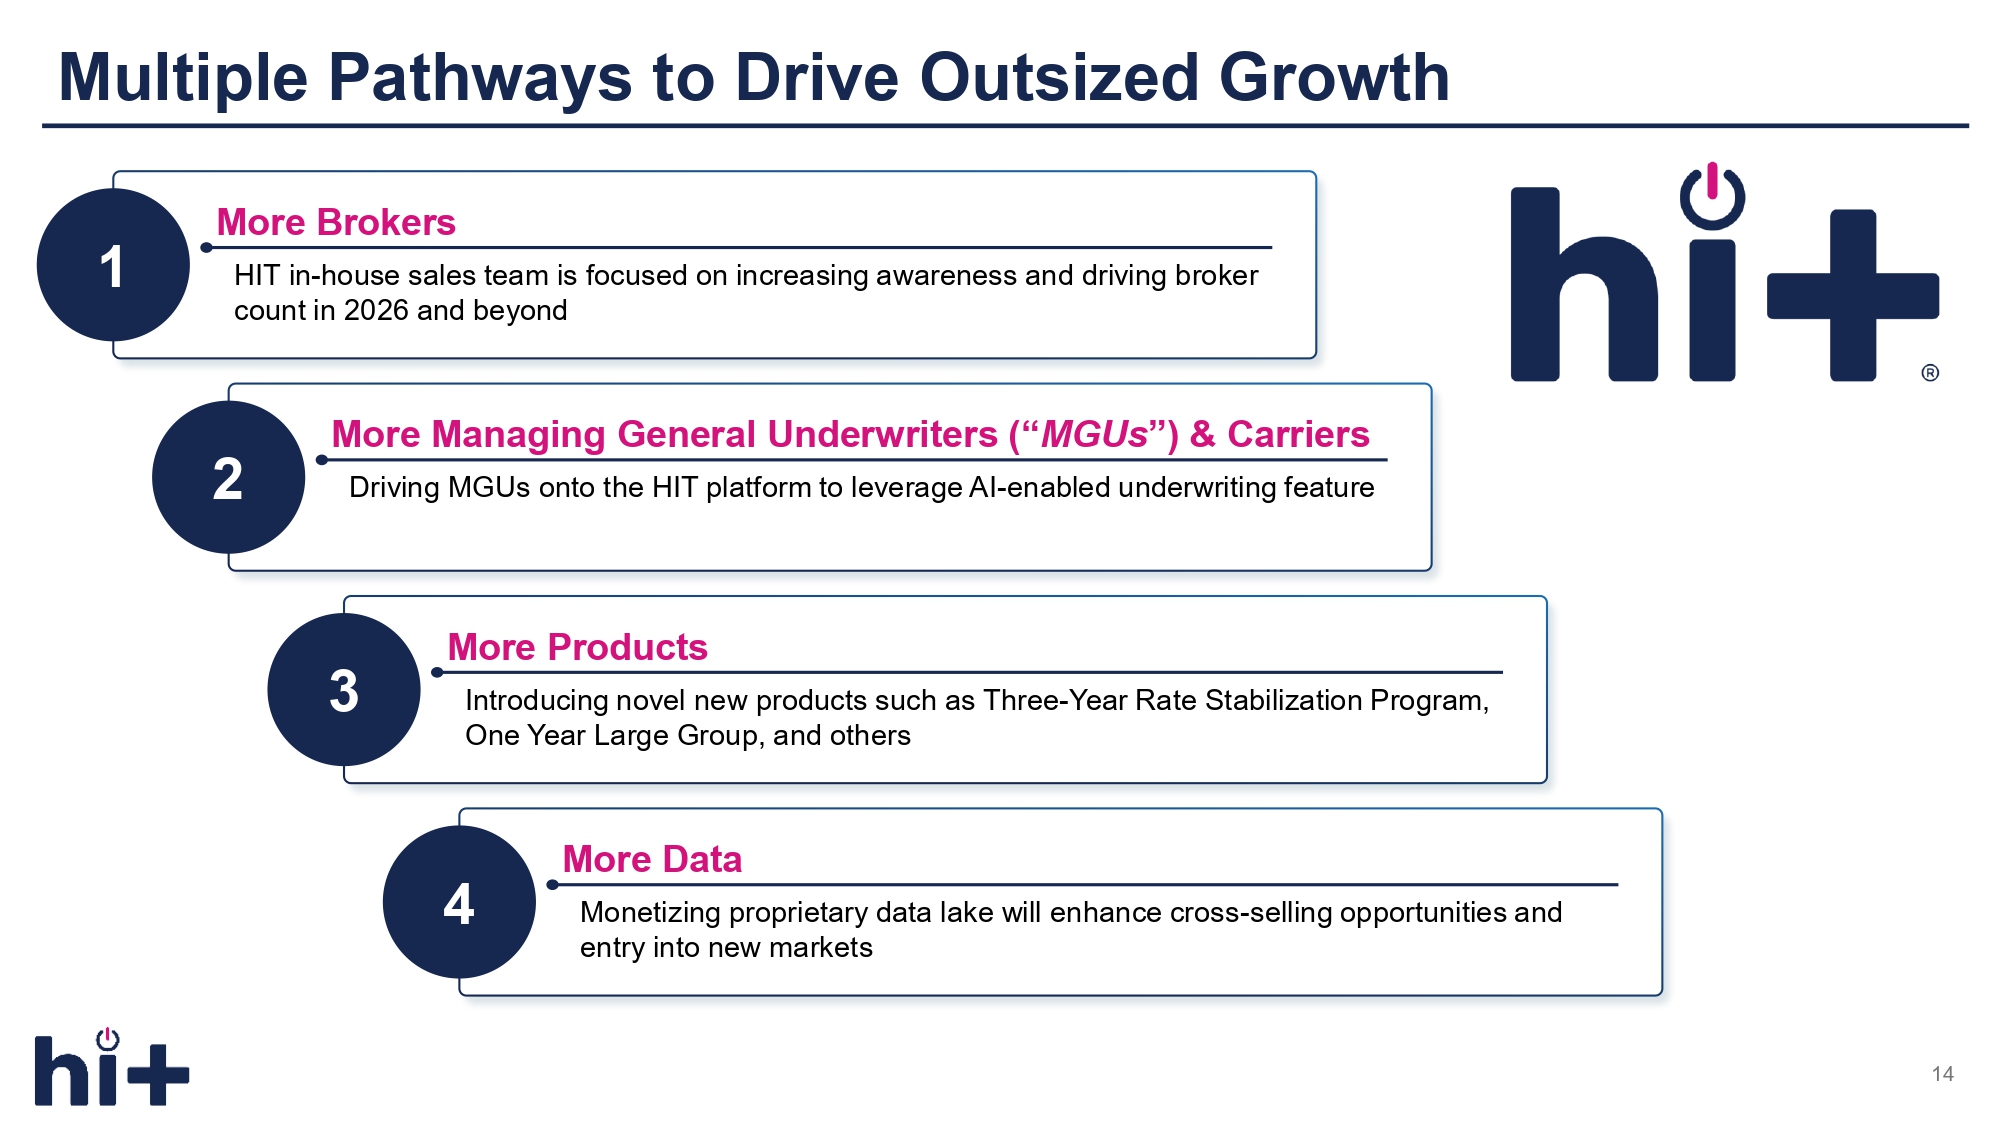
More Data Monetizing proprietary data lake will enhance cross - selling opportunities and entry into new markets More Products Introducing novel new products such as Three - Year Rate Stabilization Program, One Year Large Group, and others More Managing General Underwriters (“ MGUs ”) & Carriers Driving MGUs onto the HIT platform to leverage AI - enabled underwriting feature Multiple Pathways to Drive Outsized Growth 14 More Brokers 1 2 3 4 HIT in - house sales team is focused on increasing awareness and driving broker count in 2026 and beyond

II Financials & Conclusion
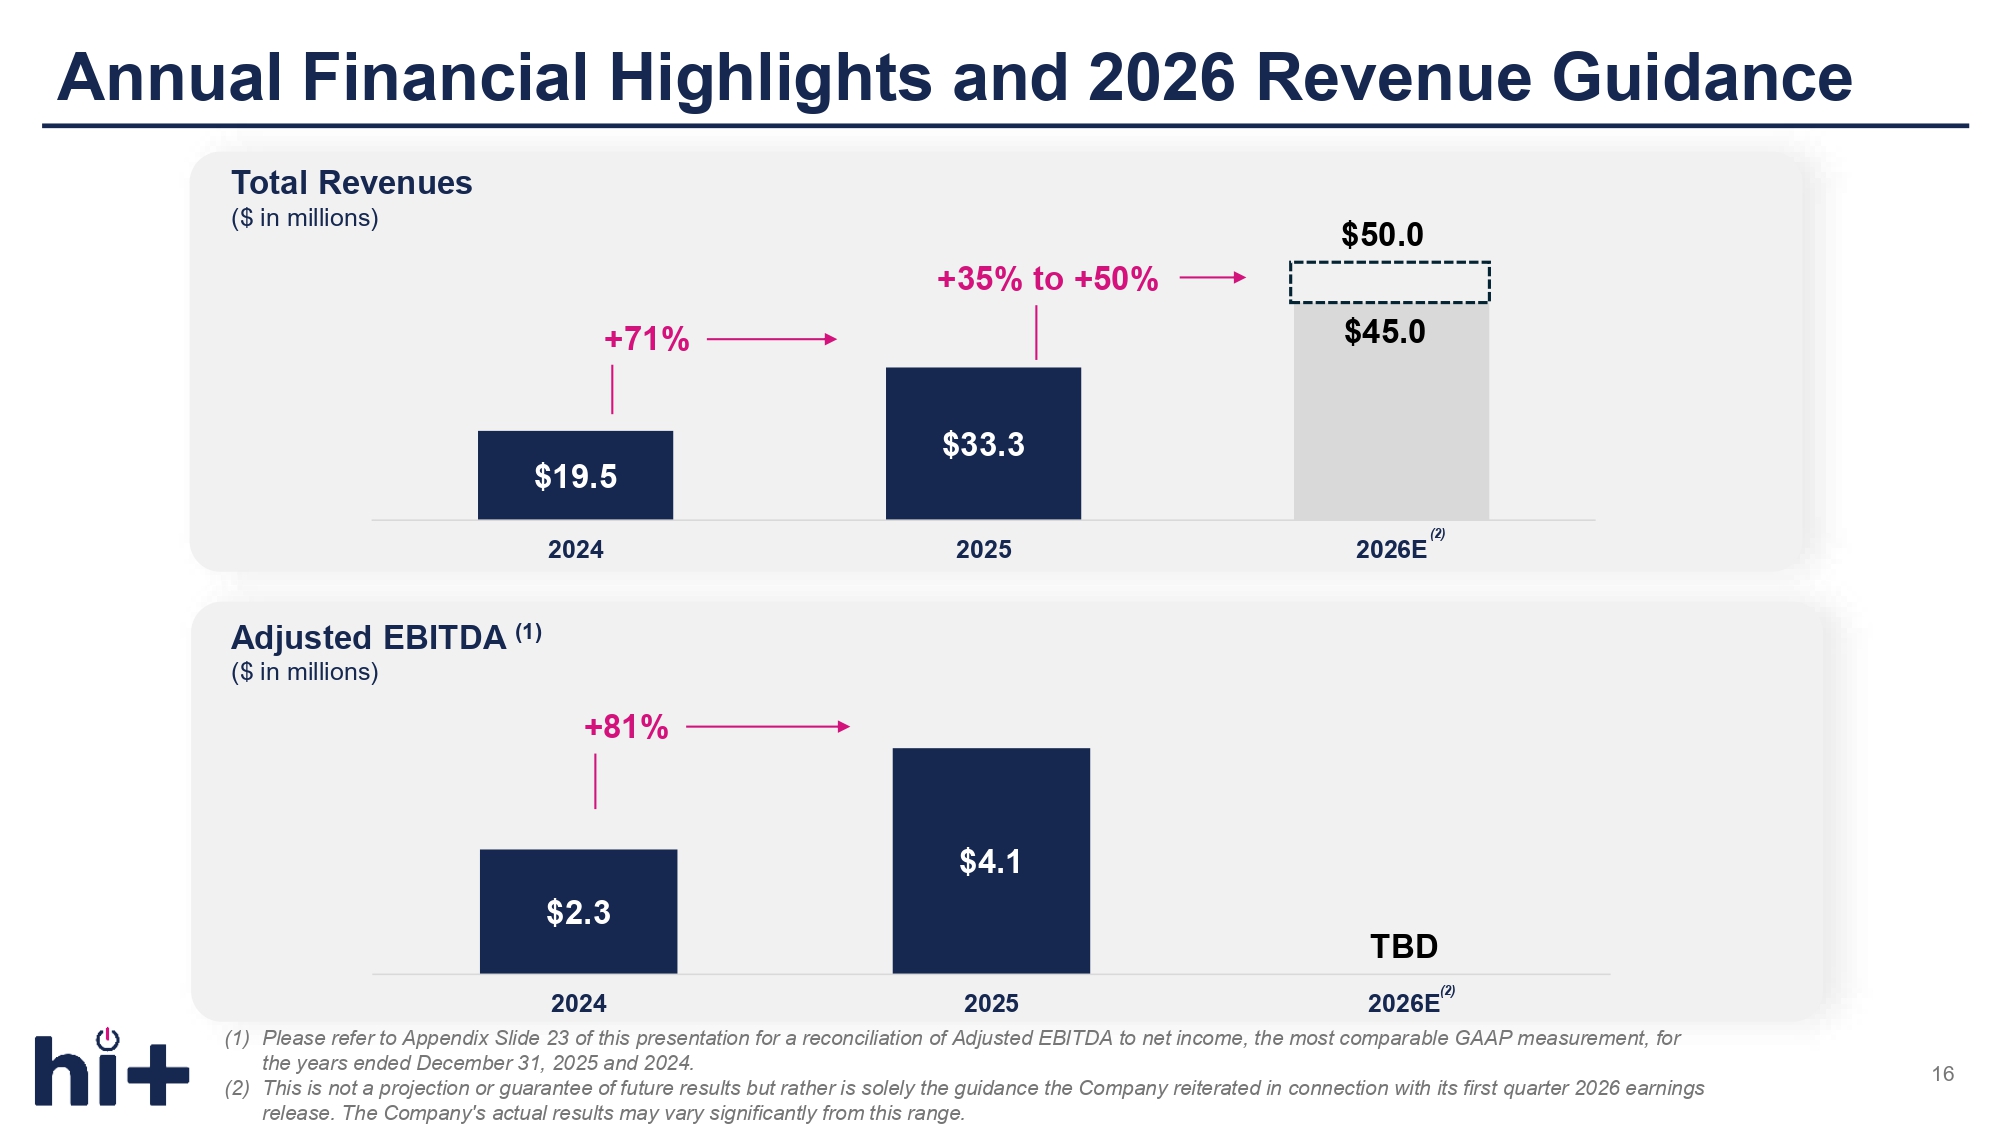
Annual Financial Highlights and 2026 Revenue Guidance 16 2024 2025 Total Revenues ($ in millions) $2.3 $4.1 TBD 2024 2025 Adjusted EBITDA (1) ($ in millions) +81% +35% to +50% $45.0 +71% $33.3 $19.5 $50.0 (1) Please refer to Appendix Slide 23 of this presentation for a reconciliation of Adjusted EBITDA to net income, the most comparable GAAP measurement, for the years ended December 31, 2025 and 2024. (2) This is not a projection or guarantee of future results but rather is solely the guidance the Company reiterated in connection with its first quarter 2026 earnings release. The Company's actual results may vary significantly from this range. (2) 2026E (2) 2026E
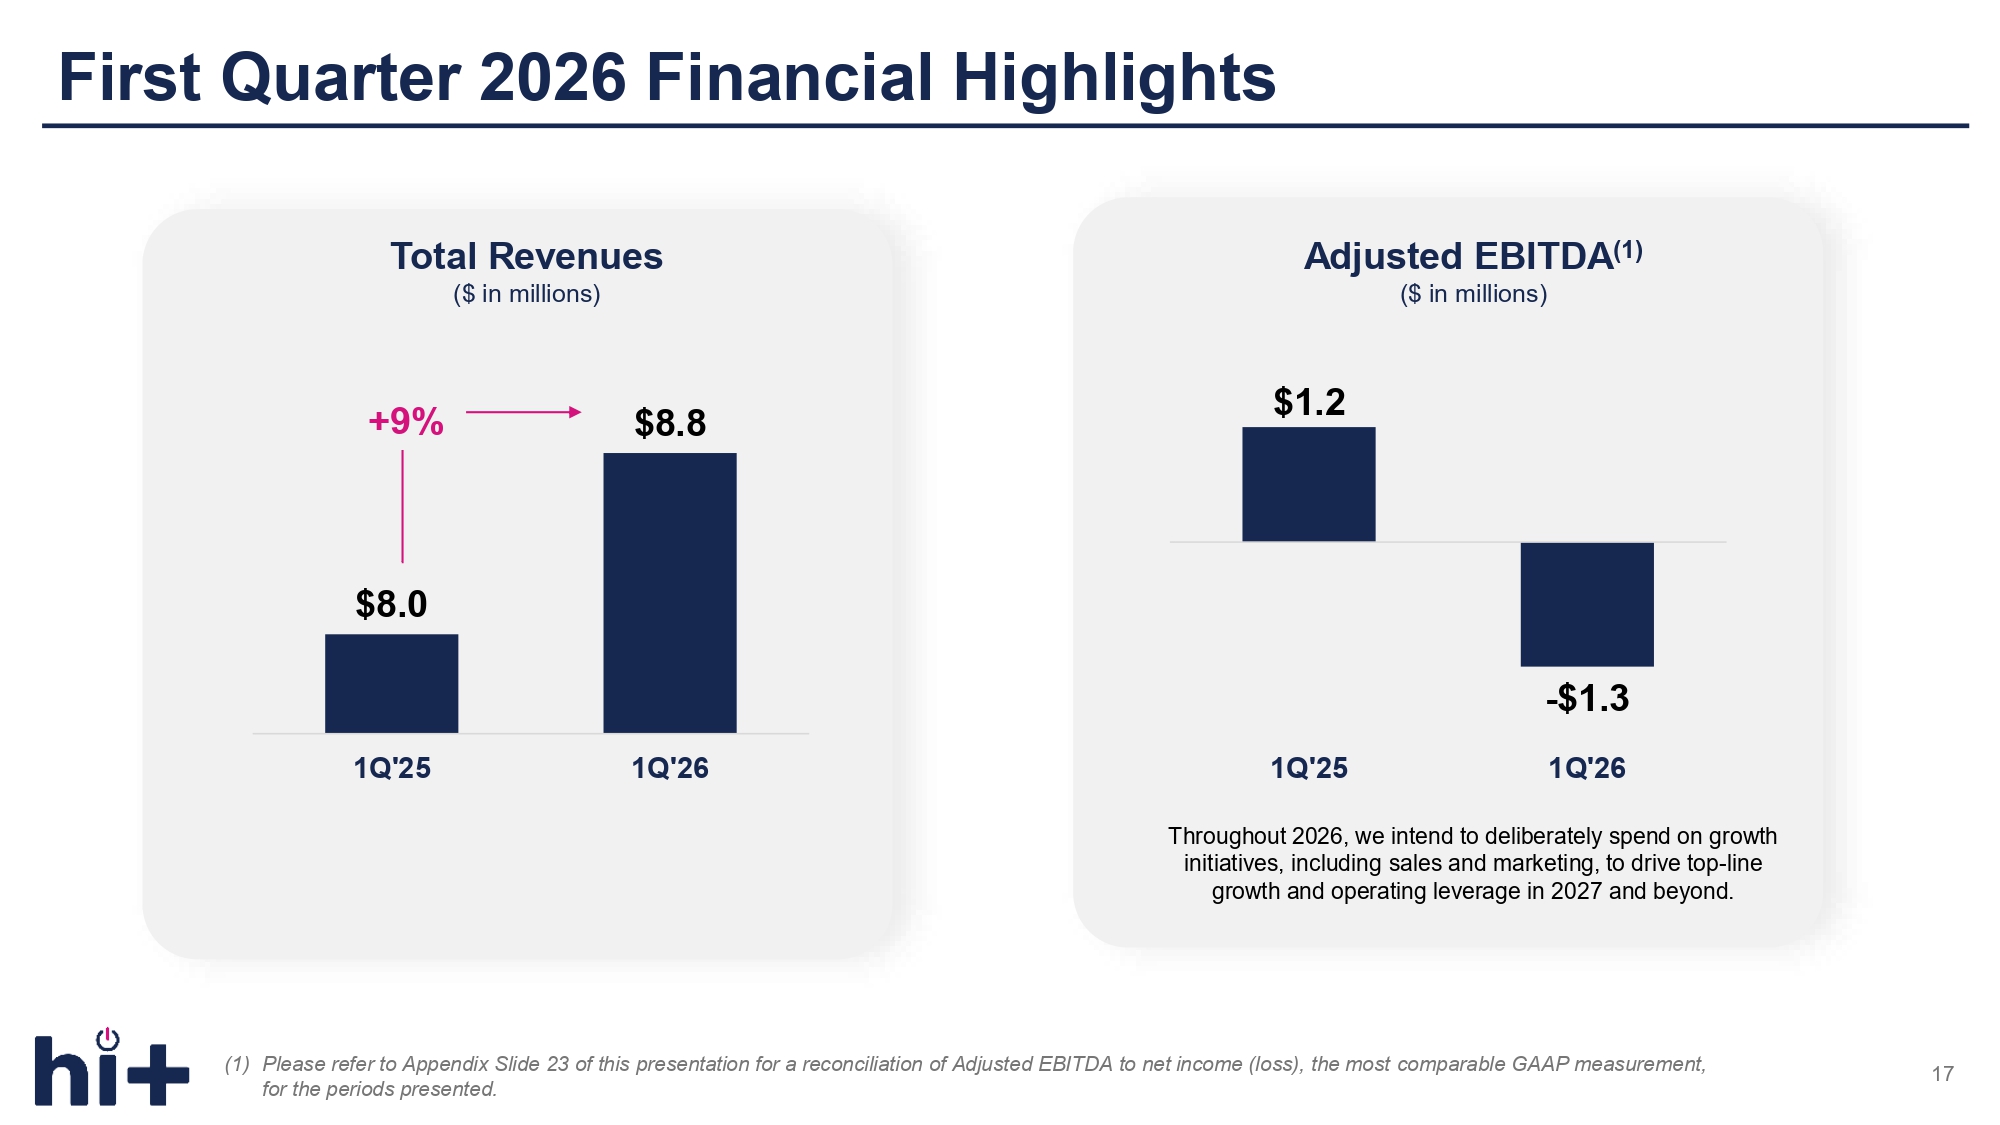
First Quarter 2026 Financial Highlights 17 $8.0 $8.8 1Q'25 1Q'26 Total Revenues ($ in millions) Adjusted EBITDA (1) ($ in millions) (1) Please refer to Appendix Slide 23 of this presentation for a reconciliation of Adjusted EBITDA to net income (loss), the most comparable GAAP measurement, for the periods presented. Throughout 2026, we intend to deliberately spend on growth initiatives, including sales and marketing, to drive top - line growth and operating leverage in 2027 and beyond. $1.2 1Q'25 - $1.3 1Q'26 +9%
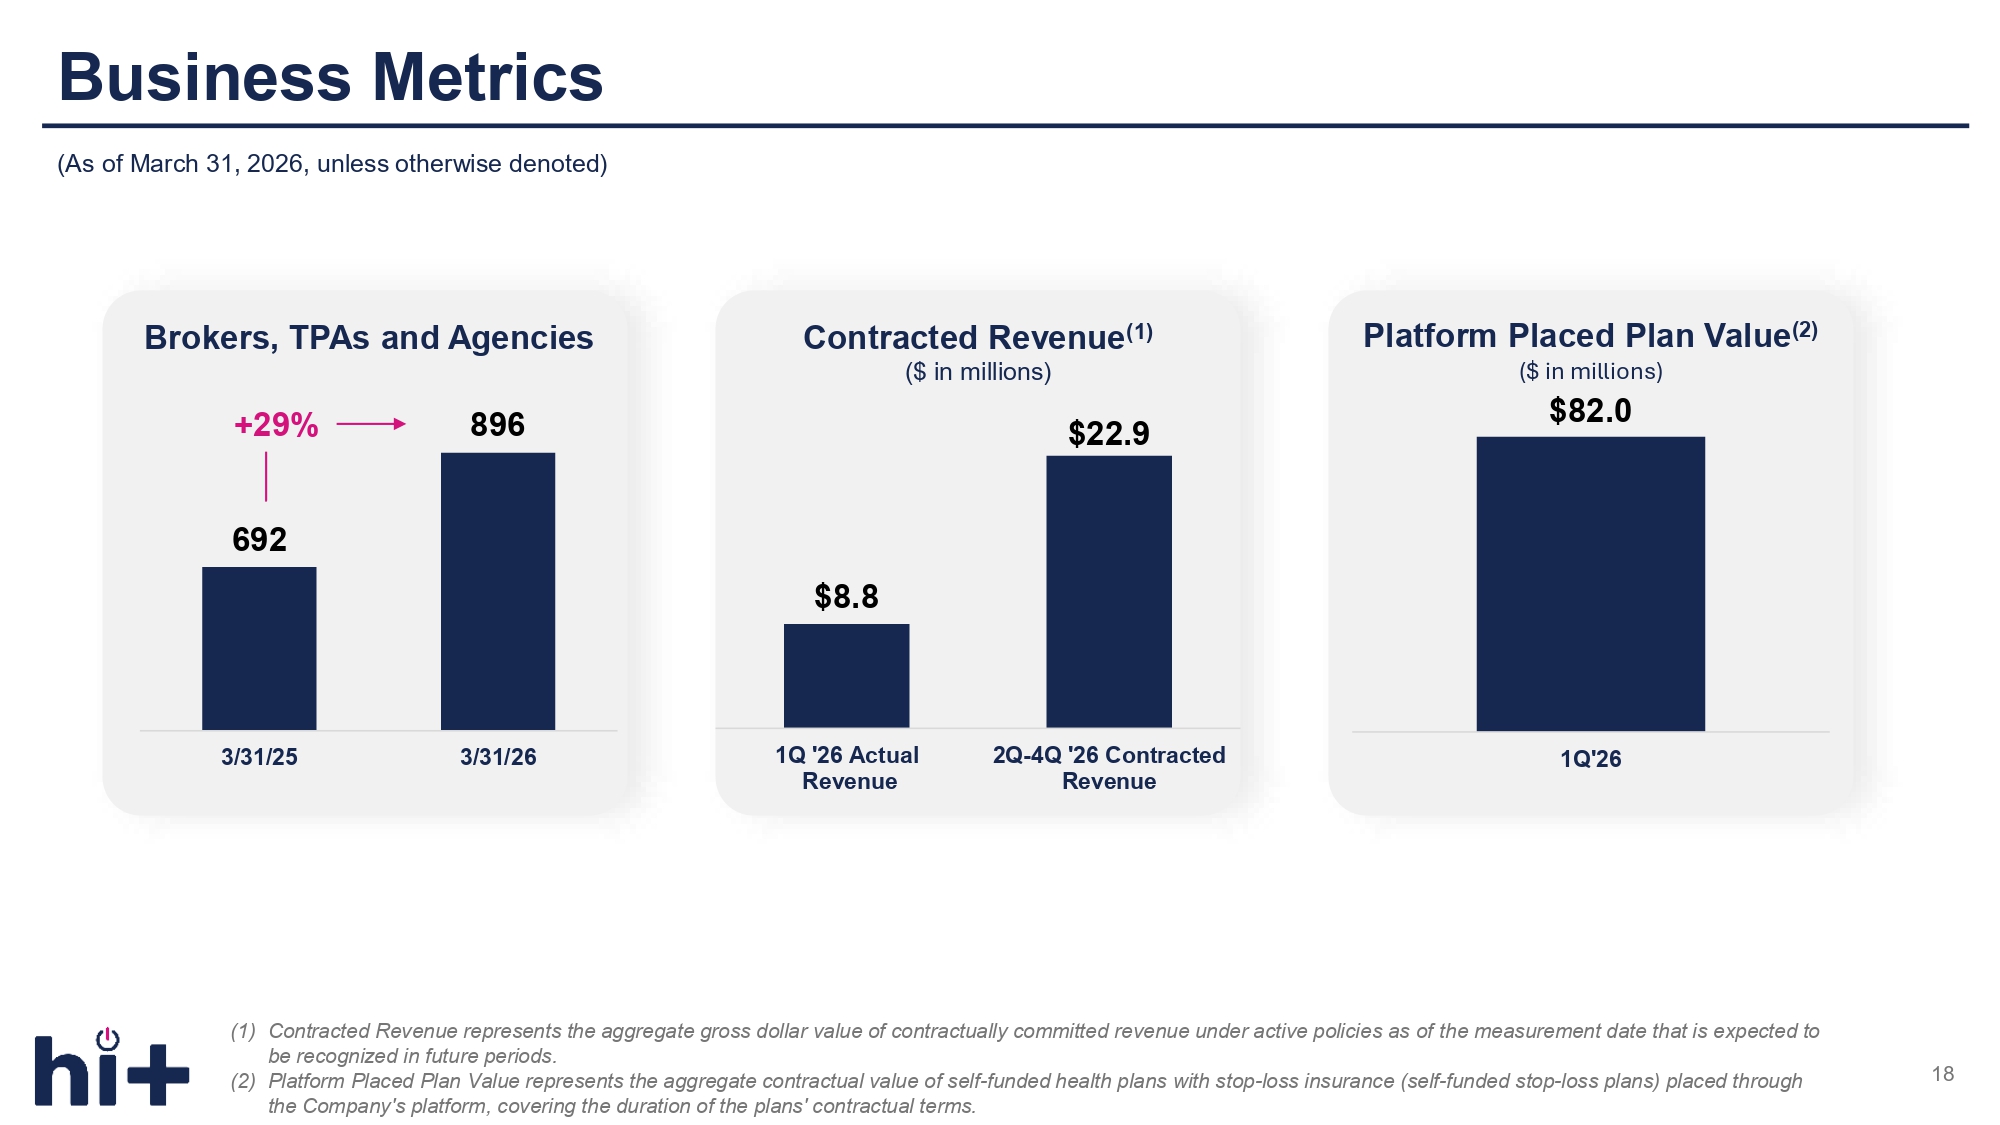
Business Metrics 18 (As of March 31, 2026, unless otherwise denoted) Contracted Revenue (1) ($ in millions) Platform Placed Plan Value (2) ($ in millions) $82.0 692 3/31/25 3/31/26 Brokers, TPAs and Agencies +29% 896 $8.8 $22.9 1Q '26 Actual Revenue 2Q - 4Q '26 Contracted Revenue (1) Contracted Revenue represents the aggregate gross dollar value of contractually committed revenue under active policies as of the measurement date that is expected to be recognized in future periods. (2) Platform Placed Plan Value represents the aggregate contractual value of self - funded health plans with stop - loss insurance (self - funded stop - loss plans) placed through the Company's platform, covering the duration of the plans' contractual terms. 1Q'26
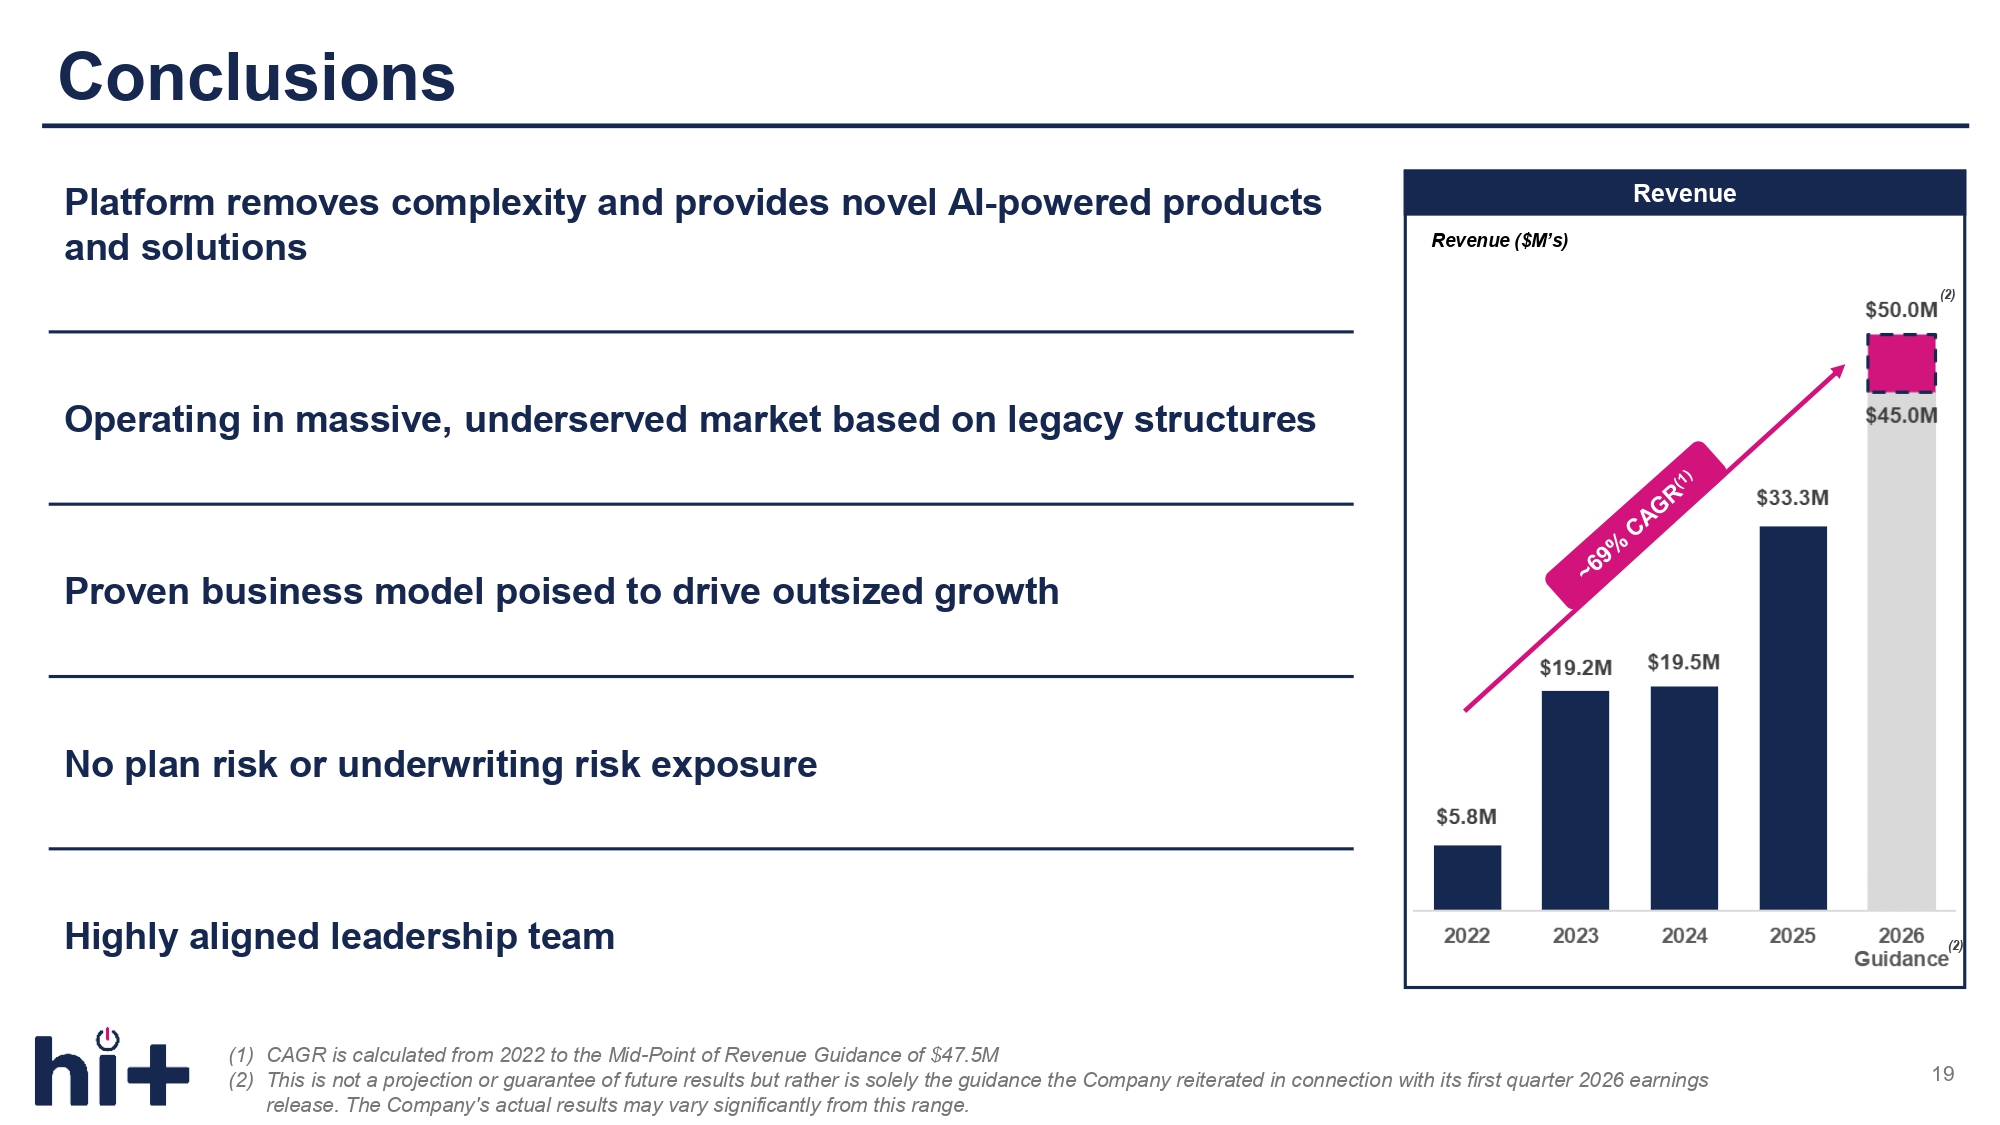
Conclusions Platform removes complexity and provides novel AI - powered products and solutions Operating in massive, underserved market based on legacy structures Proven business model poised to drive outsized growth No plan risk or underwriting risk exposure Highly aligned leadership team 19 Revenue Revenue ($M’s) (1) CAGR is calculated from 2022 to the Mid - Point of Revenue Guidance of $47.5M (2) This is not a projection or guarantee of future results but rather is solely the guidance the Company reiterated in connection with its first quarter 2026 earnings release. The Company's actual results may vary significantly from this range. (2) (2)

III Appendix
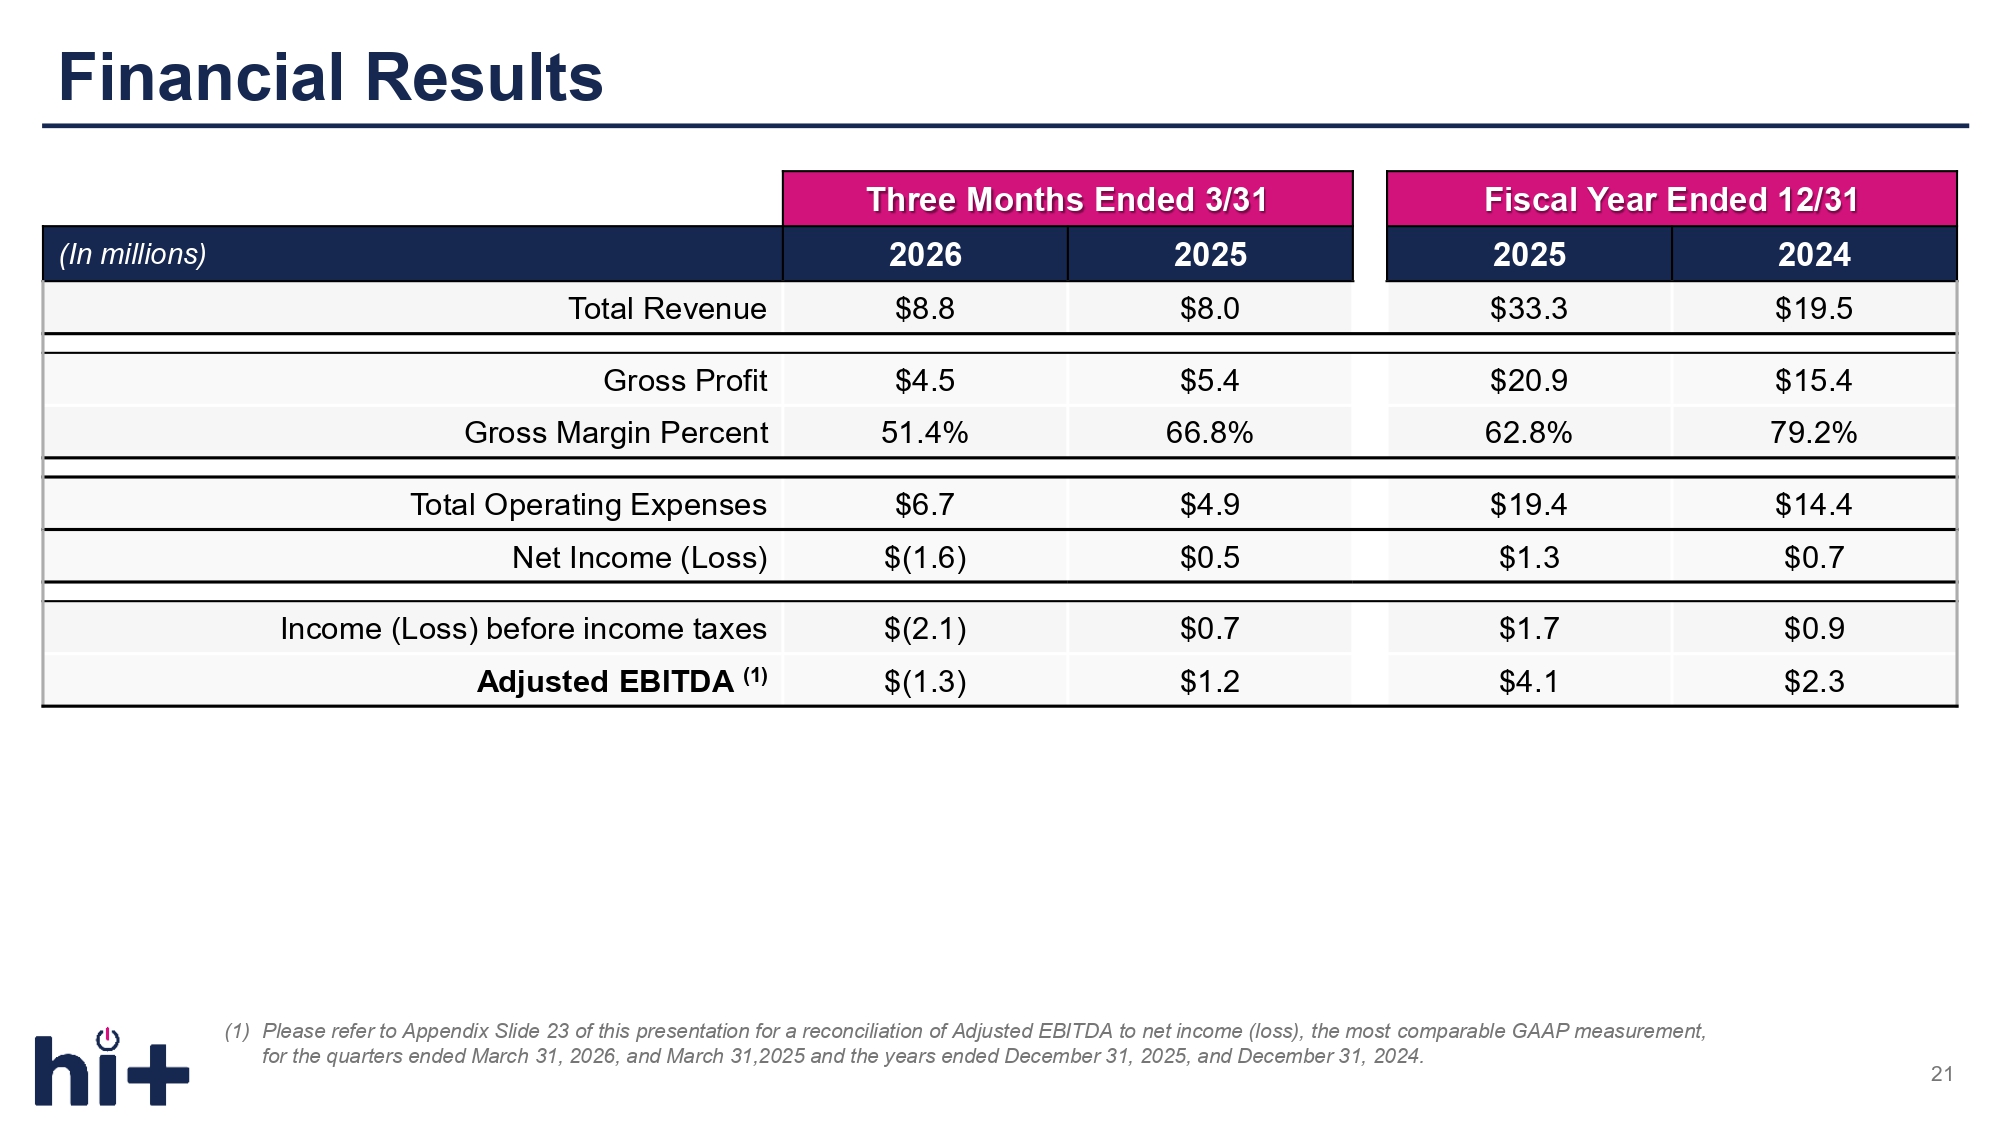
Financial Results (1) Please refer to Appendix Slide 23 of this presentation for a reconciliation of Adjusted EBITDA to net income (loss), the most comparable GAAP measurement, for the quarters ended March 31, 2026, and March 31,2025 and the years ended December 31, 2025, and December 31, 2024. 21 Fiscal Year Ended 12/31 Three Months Ended 3/31 2024 2025 2025 2026 (In millions) $19.5 $33.3 $8.0 $8.8 Total Revenue $15.4 $20.9 $5.4 $4.5 Gross Profit 79.2% 62.8% 66.8% 51.4% Gross Margin Percent $14.4 $19.4 $4.9 $6.7 Total Operating Expenses $0.7 $1.3 $0.5 $(1.6) Net Income (Loss) $0.9 $1.7 $0.7 $(2.1) Income (Loss) before income taxes $2.3 $4.1 $1.2 $(1.3) Adjusted EBITDA (1)
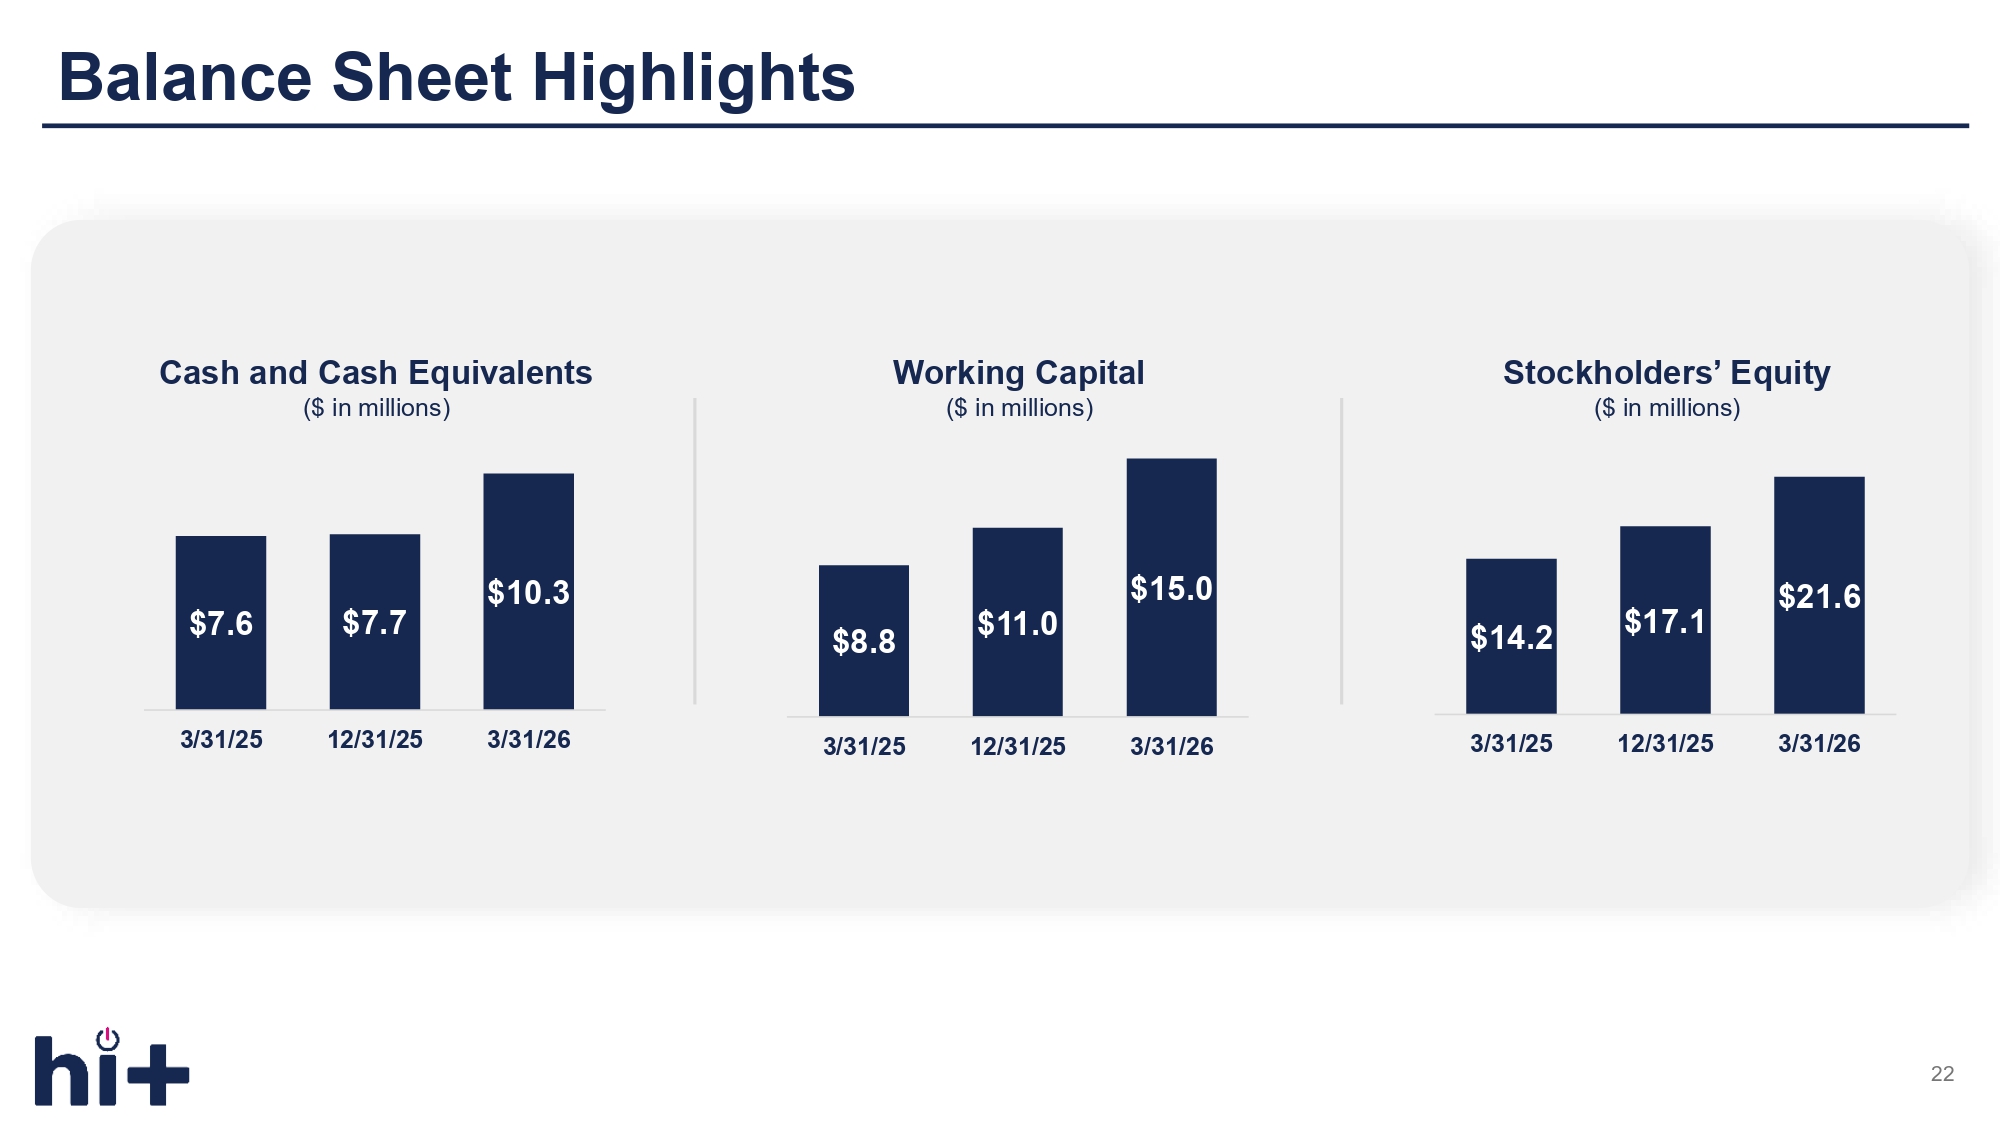
Balance Sheet Highlights 22 Cash and Cash Equivalents ($ in millions) Working Capital ($ in millions) Stockholders’ Equity ($ in millions) $7.6 $7.7 $10.3 3/31/25 12/31/25 3/31/26 $8.8 $11.0 $15.0 3/31/25 12/31/25 3/31/26 $14.2 $17.1 $21.6 3/31/25 12/31/25 3/31/26
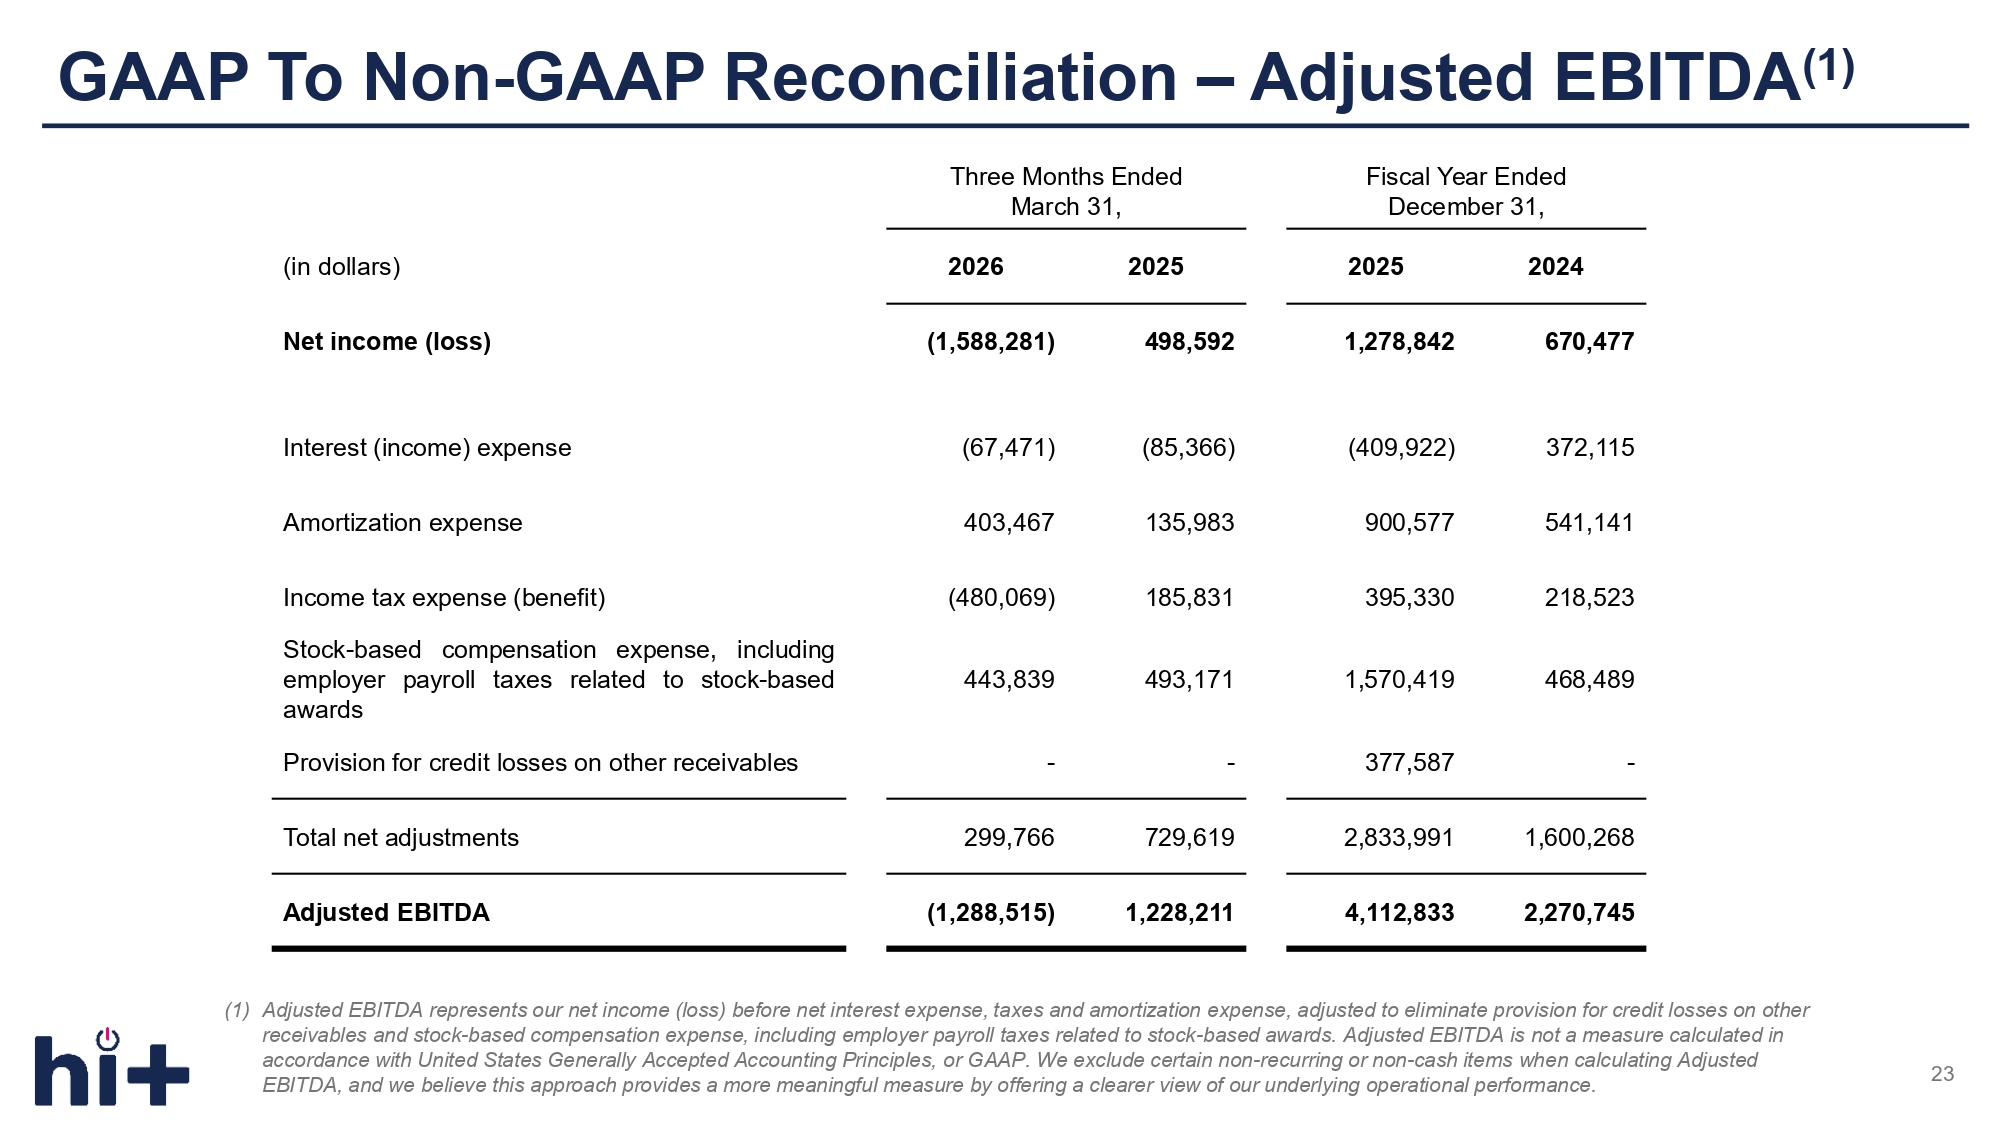
GAAP To Non - GAAP Reconciliation – Adjusted EBITDA (1) 23 Fiscal Year Ended December 31, Three Months Ended March 31, 2024 2025 2025 2026 (in dollars) 670,477 1,278,842 498,592 (1,588,281) Net income (loss) 372,115 (409,922) (85,366) (67,471) Interest (income) expense 541,141 900,577 135,983 403,467 Amortization expense 218,523 395,330 185,831 (480,069) Income tax expense (benefit) 468,489 1,570,419 493,171 443,839 Stock - based compensation expense, including employer payroll taxes related to stock - based awards - 377,587 - - Provision for credit losses on other receivables 1,600,268 2,833,991 729,619 299,766 Total net adjustments 2,270,745 4,112,833 1,228,211 (1,288,515) Adjusted EBITDA (1) Adjusted EBITDA represents our net income (loss) before net interest expense, taxes and amortization expense, adjusted to eliminate provision for credit losses on other receivables and stock - based compensation expense, including employer payroll taxes related to stock - based awards. Adjusted EBITDA is not a measure calculated in accordance with United States Generally Accepted Accounting Principles, or GAAP. We exclude certain non - recurring or non - cash items when calculating Adjusted EBITDA, and we believe this approach provides a more meaningful measure by offering a clearer view of our underlying operational performance.