Performance Management - Davis Series
Dec. 31, 2025
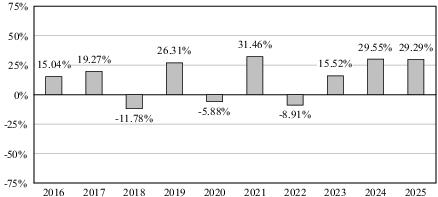
The bar chart below provides some indication of the risks of investing in the Fund by showing how the Fund’s investment results have varied from year to year. The following table shows how the Fund’s average annual total returns, for the periods indicated, compare with the S&P 500 Index, a broad-based securities market index, and the S&P 500 Financials Index. The S&P 500 Financials Index is a measure of the performance of the companies in the financial sector as a subset of the S&P 500 Index. The Fund’s past performance (before and after taxes) is not necessarily an indication of how the Fund will perform in the future. Updated information on the Fund’s results can be obtained by visiting www.davisfunds.com or by calling 1-800-279-0279.
After-tax returns are calculated using the historical highest individual federal marginal income tax rates and do not reflect the impact of state and local taxes. Actual after-tax returns depend on an investor’s tax situation and may differ from those shown, and after-tax returns shown are not relevant to investors who hold their Fund shares through tax-deferred arrangements, such as 401(k) plans or individual retirement accounts. After-tax returns are shown only for Class A shares; after-tax returns for other share classes will vary.
| | Returns | Period Ending |
| Highest Quarter | 26.98% | December 31, 2020 |
| Lowest Quarter | -34.71% | March 31, 2020 |
| Year-to-Date | -8.77% | March 31, 2026 |
| Average Annual Total Returns (For the periods ended December 31, 2025, with maximum sales charge) | Past 1 Year | Past 5 Years | Past 10 Years |
| Class A shares return before taxes | 23.15% | 17.16% | 12.25% |
| Class A shares return after taxes on distributions | 22.02% | 15.79% | 10.93% |
| Class A shares return after taxes on distributions and sale of Fund shares | 14.50% | 13.54% | 9.73% |
| Class C shares return before taxes | 27.26% | 17.36% | 12.08% |
| Class Y shares return before taxes | 29.61% | 18.56% | 13.04% |
| S&P 500 Index reflects no deduction for fees, expenses or taxes | 17.88% | 14.42% | 14.81% |
| S&P 500 Financials Index reflects no deduction for fees, expenses or taxes | 15.02% | 15.26% | 13.17% |
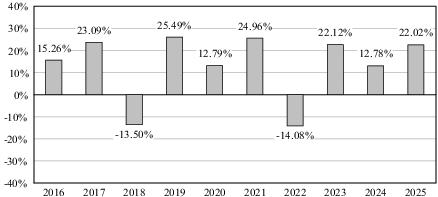
The bar chart below provides some indication of the risks of investing in the Fund by showing how the Fund’s investment results have varied from year to year. The following table shows how the Fund’s average annual total returns, for the periods indicated, compare with the S&P 1500 Index, a broad-based securities market index. The Fund’s past performance (before and after taxes) is not necessarily an indication of how the Fund will perform in the future. Updated information on the Fund’s results can be obtained by visiting www.davisfunds.com or by calling 1-800-279-0279.
After-tax returns are calculated using the historical highest individual federal marginal income tax rates and do not reflect the impact of state and local taxes. Actual after-tax returns depend on an investor’s tax situation and may differ from those shown, and after-tax returns shown are not relevant to investors who hold their Fund shares through tax-deferred arrangements, such as 401(k) plans or individual retirement accounts. After-tax returns are shown only for Class A shares; after-tax returns for other share classes will vary.
| | Returns | Period Ending |
| Highest Quarter | 19.47% | June 30, 2020 |
| Lowest Quarter | -24.05% | March 31, 2020 |
| Year-to-Date | -0.63% | March 31, 2026 |
| Average Annual Total Returns (For the periods ended December 31, 2025, with maximum sales charge) | Past 1 Year | Past 5 Years | Past 10 Years |
| Class A shares return before taxes | 16.22% | 11.44% | 11.56% |
| Class A shares return after taxes on distributions | 12.83% | 8.85% | 9.57% |
| Class A shares return after taxes on distributions and sale of Fund shares | 12.01% | 8.70% | 9.09% |
| Class C shares return before taxes | 20.04% | 11.60% | 11.37% |
| Class Y shares return before taxes | 22.35% | 12.80% | 12.37% |
| S&P 1500 Index reflects no deduction for fees, expenses or taxes | 17.02% | 13.95% | 14.45% |
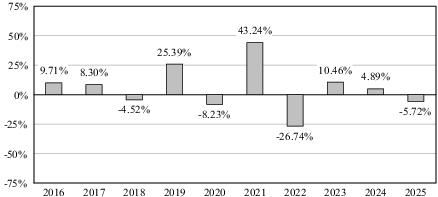
The bar chart below provides some indication of the risks of investing in the Fund by showing how the Fund’s investment results have varied from year to year. The following table shows how the Fund’s average annual total returns, for the periods indicated, compare with the S&P 500 Index, a broad-based securities market index, and of the Wilshire U.S. Real Estate Securities Index. The Wilshire U.S. Real Estate Securities Index is a measure of the performance of publicly traded real estate securities. The Fund’s past performance (before and after taxes) is not necessarily an indication of how the Fund will perform in the future. Updated information on the Fund’s results can be obtained by visiting www.davisfunds.com or by calling 1-800-279-0279.
After-tax returns are calculated using the historical highest individual federal marginal income tax rates and do not reflect the impact of state and local taxes. Actual after-tax returns depend on an investor’s tax situation and may differ from those shown, and after-tax returns shown are not relevant to investors who hold their Fund shares through tax-deferred arrangements, such as 401(k) plans or individual retirement accounts. After-tax returns are shown only for Class A shares; after-tax returns for other share classes will vary.
| | Returns | Period Ending |
| Highest Quarter | 16.64% | March 31, 2019 |
| Lowest Quarter | -26.34% | March 31, 2020 |
| Year-to-Date | -1.45% | March 31, 2026 |
| Average Annual Total Returns (For the periods ended December 31, 2025, with maximum sales charge) | Past 1 Year | Past 5 Years | Past 10 Years |
| Class A shares return before taxes | -10.20% | 1.77% | 3.61% |
| Class A shares return after taxes on distributions | -12.00% | 0.51% | 2.36% |
| Class A shares return after taxes on distributions and sale of Fund shares | -5.43% | 1.02% | 2.43% |
| Class C shares return before taxes | -7.33% | 1.96% | 3.42% |
| Class Y shares return before taxes | -5.47% | 3.03% | 4.35% |
| S&P 500 Index reflects no deduction for fees, expenses or taxes | 17.88% | 14.42% | 14.81% |
| Wilshire U.S. Real Estate Securities Index reflects no deduction for fees, expenses or taxes | 3.47% | 7.04% | 5.74% |
| Yield for Class A Shares (For the period ended December 31, 2025) | |
| 30-Day SEC Yield | 2.32% |
You can obtain the Fund’s most recent 30-day SEC Yield by calling Investor Services toll-free at 1-800-279-0279, Monday through Friday, from 9 a.m. to 6 p.m. Eastern Time.
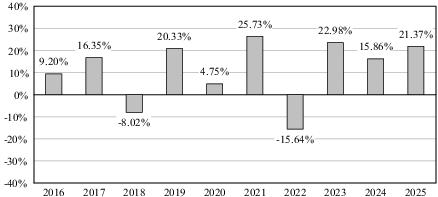
The bar chart below provides some indication of the risks of investing in the Fund by showing how the Fund’s investment results have varied from year to year. The following table shows how the Fund’s average annual total returns, for the periods indicated, compare with the S&P 500 Index, a broad-based securities market index, and the Bloomberg U.S. Aggregate Bond Index. The Bloomberg U.S. Aggregate Bond Index is a measure of the performance of the investment grade, US Dollar-denominated, fixed-rate taxable bond market. The Fund’s past performance (before and after taxes) is not necessarily an indication of how the Fund will perform in the future. Updated information on the Fund’s results can be obtained by visiting www.davisfunds.com or by calling 1-800-279-0279.
After-tax returns are calculated using the historical highest individual federal marginal income tax rates and do not reflect the impact of state and local taxes. Actual after-tax returns depend on an investor’s tax situation and may differ from those shown, and after-tax returns shown are not relevant to investors who hold their Fund shares through tax-deferred arrangements, such as 401(k) plans or individual retirement accounts. After-tax returns are shown only for Class A shares; after-tax returns for other share classes will vary.
| | Returns | Period Ending |
| Highest Quarter | 15.48% | December 31, 2020 |
| Lowest Quarter | -22.46% | March 31, 2020 |
| Year-to-Date | 0.68% | March 31, 2026 |
| Average Annual Total Returns (For the periods ended December 31, 2025, with maximum sales charge) | Past 1 Year | Past 5 Years | Past 10 Years |
| Class A shares return before taxes | 15.60% | 11.80% | 9.91% |
| Class A shares return after taxes on distributions | 13.84% | 10.75% | 9.23% |
| Class A shares return after taxes on distributions and sale of Fund shares | 10.36% | 9.23% | 8.01% |
| Class C shares return before taxes | 19.41% | 12.03% | 9.76% |
| Class Y shares return before taxes | 21.74% | 13.24% | 10.78% |
| S&P 500 Index reflects no deduction for fees, expenses or taxes | 17.88% | 14.42% | 14.81% |
| Bloomberg U.S. Aggregate Bond Index reflects no deduction for fees, expenses or taxes | 7.30% | -0.36% | 2.01% |
| Yield for Class A Shares (For the period ended December 31, 2025) | |
| 30-Day SEC Yield | 1.36% |
You can obtain the Fund’s most recent 30-day SEC Yield by calling Investor Services toll-free at 1-800-279-0279, Monday through Friday, from 9 a.m. to 6 p.m. Eastern Time.
The bar chart below provides some indication of the risks of investing in the Fund by showing how the Fund’s investment results have varied from year to year. The following table shows how the Fund’s average annual total returns, for the periods indicated, compare with the Bloomberg U.S. Government 1-3 Year Bond Index. The Fund’s past performance (before and after taxes) is not necessarily an indication of how the Fund will perform in the future. Updated information on the Fund’s results can be obtained by visiting www.davisfunds.com or by calling 1-800-279-0279.
After-tax returns are calculated using the historical highest individual federal marginal income tax rates and do not reflect the impact of state and local taxes. Actual after-tax returns depend on an investor’s tax situation and may differ from those shown, and after-tax returns shown are not relevant to investors who hold their Fund shares through tax-deferred arrangements, such as 401(k) plans or individual retirement accounts. After-tax returns are shown only for Class A shares; after-tax returns for other share classes will vary.
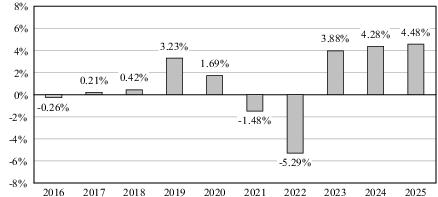
| | Returns | Period Ending |
| Highest Quarter | 2.05% | September 30, 2024 |
| Lowest Quarter | -2.96% | March 31, 2022 |
| Year-to-Date | 0.76% | March 31, 2026 |
| Average Annual Total Returns (For the periods ended December 31, 2025, with maximum sales charge) | Past 1 Year | Past 5 Years | Past 10 Years |
| Class A shares return before taxes | -0.49% | 0.12% | 0.58% |
| Class A shares return after taxes on distributions | -1.70% | -0.70% | -0.03% |
| Class A shares return after taxes on distributions and sale of Fund shares | -0.30% | -0.26% | 0.17% |
| Class C shares return before taxes | 2.69% | 0.36% | 0.46% |
| Class Y shares return before taxes | 4.73% | 1.35% | 1.32% |
| Bloomberg U.S. Government 1-3 Year Bond Index reflects no deduction for fees, expenses or taxes | 5.17% | 1.76% | 1.84% |
| Yield for Class A Shares (For the period ended December 31, 2025) | |
| 30-Day SEC Yield | 3.61% |
You can obtain the Fund’s most recent 30-day SEC Yield by calling Investor Services toll-free at 1-800-279-0279, Monday through Friday, from 9 a.m. to 6 p.m. Eastern Time.
The bar chart below provides some indication of the risks of investing in the Fund by showing how the Fund’s investment results have varied from year to year. The Fund’s past performance is not necessarily an indication of how the Fund will perform in the future. Updated information on the Fund’s results can be obtained by visiting www.davisfunds.com or by calling 1-800-279-0279.
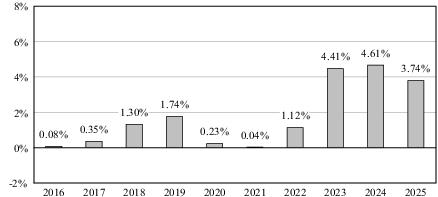
| | Returns | Period Ending |
| Highest Quarter | 1.17% | December 31, 2023 |
| Lowest Quarter | 0.00% | December 31, 2021 |
| Year-to-Date | 0.78% | March 31, 2026 |
| Average Annual Total Returns (For the periods ended December 31, 2025, with maximum sales charge) | Past 1 Year | Past 5 Years | Past 10 Years |
| All Share Classes | 3.74% | 2.77% | 1.75% |
| Yield for Class A Shares (For the period ended December 31, 2025) | |
| 7-Day Yield: | 3.21% |
You can obtain the Fund’s most recent 7-day Yield by calling Investor Services toll-free at 1-800-279-0279, Monday through Friday, from 9 a.m. to 6 p.m. Eastern Time.