No. 811-02679
UNITED STATES
SECURITIES AND EXCHANGE COMMISSION
WASHINGTON, D.C. 20549
SECURITIES AND EXCHANGE COMMISSION
WASHINGTON, D.C. 20549
FORM N-1A
REGISTRATION STATEMENT UNDER THE
SECURITIES ACT OF 1933
POST-EFFECTIVE AMENDMENT NO. 85
SECURITIES ACT OF 1933
POST-EFFECTIVE AMENDMENT NO. 85
and
REGISTRATION STATEMENT UNDER THE
INVESTMENT COMPANY ACT OF 1940
POST-EFFECTIVE AMENDMENT NO. 81
INVESTMENT COMPANY ACT OF 1940
POST-EFFECTIVE AMENDMENT NO. 81
DAVIS SERIES, INC.
2949 East Elvira Road, Suite 101
Tucson, Arizona 85756
(520) 806-7600
Tucson, Arizona 85756
(520) 806-7600
|
Agents For Service:
|
Lisa Cohen
Davis Selected Advisers, L.P.
2949 East Elvira Road, Suite 101
Tucson, AZ 85756
|
|
|
-or-
|
|
|
Richard Cutshall
Greenberg Traurig LLP
1144 15th Street
Suite 3300
Denver, CO 80202
|
|
It is proposed that this filing will become effective:
|
||
|
|
☐
|
Immediately upon filing pursuant to paragraph (b) of Rule 485
|
|
|
☒
|
On May 1, 2026, pursuant to paragraph (b) of Rule 485
|
|
|
☐
|
60 days after filing pursuant to paragraph (a) of Rule 485
|
|
|
☐
|
On [ ] pursuant to paragraph (a) of Rule 485
|
|
|
☐
|
75 days after filing pursuant to paragraph (a)(2) of Rule 485
|
|
|
☐
|
On [ ] pursuant to paragraph (a)(2) of Rule 485
|
|
|
☐
|
This post-effective amendment designates a new effective date for a previously filed
post-effective amendment
|
1
Title of Securities being Registered Common Stock of:
Davis Opportunity Fund, Class A, Class C, and Class Y shares
Davis Financial Fund, Class A, Class C, and Class Y shares
Davis Real Estate Fund, Class A, Class C, and Class Y shares
Davis Balanced Fund, Class A, Class C, and Class Y shares
Davis Government Bond Fund, Class A, Class C, and Class Y shares
Davis Government Money Market Fund, Class A, Class C, and Class Y shares
EXPLANATORY NOTE
This Post-Effective Amendment contains:
Davis Series Prospectus
Davis Series Statement of Additional Information
Part C
Signature Pages
Exhibits
Davis Series Statement of Additional Information
Part C
Signature Pages
Exhibits
2

Davis Series, Inc.
May 1, 2026
Prospectus
Portfolios of Davis Series, Inc.
Tickers:
Davis Financial Fund: Class A–RPFGX, Class C–DFFCX, Class Y–DVFYX
Davis Opportunity Fund: Class A–RPEAX, Class C, DGOCX, Class Y–DGOYX
Davis Real Estate Fund: Class A–RPFRX, Class C–DRECX, Class Y–DREYX
Davis Balanced Fund: Class A–RPFCX, Class C–DCSCX, Class Y–DCSYX
Davis Government Bond Fund: Class A–RFBAX, Class C–DGVCX, Class Y–DGVYX
Davis Government Money Market Fund: Class A–RPGXX, Class C–N/A, Class Y–N/A
The Securities and Exchange Commission has not approved or disapproved these securities or passed upon the adequacy of this prospectus. Any representation to the contrary is a criminal offense.
Over 50 Years of Reliable InvestingSM
Contents
| 3 | |
| 7 | |
| 11 | |
| 15 | |
| 20 | |
| 23 | |
| 26 | |
| 36 | |
| 37 | |
| 39 | |
| 41 | |
| 41 | |
| 42 | |
| 42 | |
| 43 | |
| 43 | |
| 44 | |
| 45 | |
| 50 | |
| 50 | |
| 50 | |
| 51 | |
| 51 | |
| 52 | |
| 55 | |
| 55 | |
| 56 | |
| 56 | |
| 56 | |
| 57 | |
| 57 | |
| 64 | |
| | |
This prospectus contains important information. Please read it carefully before investing and keep it for future reference.
No financial adviser, dealer, salesperson, or any other person has been authorized to give any information or to make any representations, other than those contained in this prospectus, in connection with the offer contained in this prospectus and, if given or made, such other information or representations must not be relied on as having been authorized by the Funds, the Funds' investment adviser or the Funds' distributor.
This prospectus does not constitute an offer by the Funds or by the Funds' distributor to sell or a solicitation of an offer to buy any of the securities offered hereby in any jurisdiction to any person to whom it is unlawful for the Funds to make such an offer.
Prospectus | Davis Funds | 2
The Fund seeks long-term growth of capital.
This table describes the fees and expenses that you may pay if you buy, hold, and sell shares of the Fund. You may pay other fees, such as brokerage commissions and other fees to financial intermediaries, which are not reflected in the tables and examples below. You may qualify for sales charge discounts with respect to Class A shares if you and your family invest, or agree to invest in the future, at least $100,000 in Davis Funds. More information about these and other discounts is available from your financial intermediary and in “How to Choose a Share Class” on page 45 of the Fund’s prospectus and “Selecting the Appropriate Class of Shares” on page 35 of the Fund’s statement of additional information. In addition, descriptions of the sales load waivers and/or discounts for Class A shares with respect to certain financial intermediaries are reproduced in “Appendix A: Intermediary-Specific Sales Charge Waivers and Discounts” to the prospectus based on information provided by the financial intermediary.
| Shareholder Fees (fees paid directly from your investment) | Class A shares | Class C shares | Class Y shares |
| Maximum Sales Charge (Load) Imposed on Purchases (as a percentage of offering price) | | | |
| Maximum Deferred Sales Charge (Load) (as a percentage of the lesser of the net asset value of the shares redeemed or the total cost of such shares) | | | |
| Redemption Fee (as a percentage of total redemption proceeds) | | | |
*
†
| Annual Fund Operating Expenses (expenses that you pay each year as a percentage of the value of your investment) | Class A shares | Class C shares | Class Y shares |
| Management Fees | | | |
| Distribution and/or Service (12b-1) Fees | | | |
| Other Expenses | | | |
| Total Annual Fund Operating Expenses | | | |
| Less Fee Waiver and/or Expense Reimbursement* | | | |
| Total Annual Fund Operating Expenses After Fee Waivers and/or Expense Reimbursement | | | |
*
The Adviser (as defined below) is contractually committed to waive fees and/or reimburse the Fund’s expenses to the extent necessary to cap total annual fund operating expenses (Class A shares, 1.00%; Class C shares, 1.75%; Class Y shares, 0.75%). For purposes of these expense caps, operating expenses do not include foreign tax reclaim filing expenses. The Adviser is obligated to continue the expense cap through May 1, 2027 . The expense cap cannot be terminated prior to this date without the consent of the Board of Directors. After that date, there is no assurance that the Adviser will continue to cap expenses. The Adviser may not recoup any of the operating expenses it has reimbursed to the Fund.
|
|
If you redeem your shares in:
|
If you did not redeem your shares in:
|
||||||
|
|
1 Year
|
3 Years
|
5 Years
|
10 Years
|
1 Year
|
3 Years
|
5 Years
|
10 Years
|
|
Class A shares
|
$ |
$ |
$ |
$ |
$ |
$ |
$ |
$ |
|
Class C shares
|
$ |
$ |
$ |
$ |
$ |
$ |
$ |
$ |
|
Class Y shares
|
$ |
$ |
$ |
$ |
$ |
$ |
$ |
$ |
The Fund pays transaction costs, such as commissions, when it buys and sells securities (or “turns over” its portfolio). A higher portfolio turnover rate may indicate higher transaction costs and may result in higher taxes when Fund shares are held in a taxable account. These costs, which are not reflected in annual fund operating expenses or in the example, affect the Fund’s performance. During the most recent fiscal year, the Fund’s portfolio turnover rate was 10 % of the average value of its portfolio.
Prospectus | Davis Funds | 3
Davis Selected Advisers, L.P. (“Davis Advisors” or the “Adviser”), the Fund’s investment adviser, uses the Davis Investment Discipline to invest, under normal market conditions, at least 80% of the Fund’s net assets, plus any borrowing for investment purposes, in securities issued by companies principally engaged in the financial services sector. The Fund invests principally in common stocks (including indirect holdings of common stock through Depositary Receipts (as defined below)). The Fund may invest in large, medium or small companies without regard to market capitalization and may invest in issuers in foreign countries, including countries with developed or emerging markets.
A company is principally engaged in financial services if it owns financial services-related
assets that constitute at least 50% of the value of all of its assets, or if it derives at least 50% of its revenues from
providing financial services. Companies are classified by GICS based on their principal business activity. Revenue is a key factor in determining a firm’s principal business activity. Financial services companies include those with their principal business
activity in one of the following areas: banks, financial services, consumer finance, capital markets, insurance, and mortgage REITs.
Davis Investment Discipline. Davis Advisors manages equity funds using the Davis Investment Discipline. Davis
Advisors conducts extensive research to try to identify businesses that possess characteristics
that Davis Advisors believes foster the creation of long-term value, such as proven management, a durable franchise and business
model, and sustainable competitive advantages. Davis Advisors aims to invest in such businesses when they are trading
at discounts to their intrinsic worth. Davis Advisors emphasizes individual stock selection and believes that the ability to evaluate
management is critical. Davis Advisors routinely visits managers at their places of business in order to gain insight into
the relative value of different businesses. Such research, however rigorous, involves predictions and forecasts that are inherently
uncertain. After determining which companies Davis Advisors believes the Fund should own, Davis Advisors then turns its
analysis to determining the intrinsic value of those companies’ equity securities. Davis Advisors seeks companies whose equity securities can be purchased at a discount from Davis Advisors’ estimate of the company’s intrinsic value based upon fundamental analysis of cash flows, assets and liabilities, and other criteria that Davis Advisors deems to be material on a company-by-company basis. Davis Advisors’ goal is to invest in companies for the long term (ideally, five years or longer, although
this goal may not be met). Davis Advisors considers selling a company’s equity securities if the securities’ market price exceeds Davis Advisors’ estimates of intrinsic value, if the ratio of the risks and rewards of continuing to own the company’s equity securities is no longer attractive, to raise cash to purchase a more attractive investment opportunity, to satisfy net
redemptions, or for other purposes.
Principal Risks of Investing in the Fund
The principal risks of investing in the Fund are:
Stock Market Risk. Stock markets tend to move in cycles, with periods of rising prices and periods of falling prices, including the possibility of sharp declines.
Common Stock Risk. Common stock represents an ownership position in a company. An adverse event may have a negative impact on a company and could result in a decline in the price of its common stock. Common stock is generally subordinate to an issuer’s other securities, including preferred, convertible, and debt securities.
Financial Services Risk. Risks of investing in the financial services sector include: (1) systemic risk: factors outside the control of a particular financial institution may adversely affect the ability of the financial institution to operate normally or may impair its financial condition; (2) regulatory actions: financial services companies may suffer setbacks if regulators change the rules under which they operate; (3) changes in interest rates: unstable and/or rising interest rates may have a disproportionate effect on companies in the financial services sector; (4) non-diversified loan portfolios: financial services companies may have concentrated portfolios that make them vulnerable to economic conditions that affect an industry; (5) credit: financial services companies may have exposure to investments or agreements that may lead to losses; and (6) competition: the financial services sector has become increasingly competitive.
Credit Risk. Financial institutions are often highly leveraged and may not be able to make timely payments of interest and principal.
Interest Rate Sensitivity Risk. Interest rates may have a powerful influence on the earnings of financial institutions.
Focused Portfolio Risk. Funds that invest in a limited number of companies may have more risk because changes in the value of a single security may have a more significant effect, either negative or positive, on the value of the Fund’s total portfolio.
Headline Risk. The Fund may invest in a company when the company becomes the center of controversy after receiving adverse media attention concerning its operations, long-term prospects, management, or for other reasons. While Davis Advisors researches companies subject to such contingencies, it cannot be correct every time, and the company’s stock may never recover or may become worthless.
Foreign Country Risk. Securities of foreign companies (including Depositary Receipts) may be subject to greater risk, as foreign economies may not be as strong or diversified, foreign political systems may not be as stable and foreign financial reporting standards may not be as rigorous as they are in the United States. There may also be less information publicly
Prospectus | Davis Funds | 4
available regarding the non-U.S. issuers and their securities. These securities may be less liquid (and, in some cases, may be illiquid) and could be harder to value than more liquid securities.
Large-Capitalization Companies Risk. Companies with $10 billion or more in market capitalization are considered by the Adviser to be large-capitalization companies. Large-capitalization companies generally experience slower rates of growth in earnings per share than do mid- and small-capitalization companies.
Manager Risk. Poor security selection or focus on securities in a particular sector, category, or group of companies may cause the Fund to underperform relevant benchmarks or other funds with a similar investment objective. Even if the Adviser implements the intended investment strategies, the implementation of the strategies may be unsuccessful in achieving the Fund’s investment objective.
Depositary Receipts Risk. Depositary Receipts, consisting of American Depositary Receipts, European Depositary Receipts, and Global Depositary Receipts, are certificates evidencing ownership of shares of a foreign issuer. Depositary Receipts are subject to many of the risks associated with investing directly in foreign securities. Depositary Receipts may trade at a discount, or a premium, to the underlying security and may be less liquid than the underlying securities listed on an exchange.
Fees and Expenses Risk. The Fund may not earn enough through income and capital appreciation to offset the operating expenses of the Fund. All mutual funds incur operating fees and expenses. Fees and expenses reduce the return that a shareholder may earn by investing in a fund, even when a fund has favorable performance. A low-return environment, or a bear market, increases the risk that a shareholder may lose money.
Foreign Currency Risk. The change in value of a foreign currency against the U.S. dollar will result in a change in the U.S. dollar value of securities denominated in that foreign currency. For example, when the Fund holds a security that is denominated in a foreign currency, a decline of that foreign currency against the U.S. dollar would generally cause the value of the Fund’s shares to decline.
Emerging Market Risk. Securities of issuers in emerging and developing markets may offer special investment opportunities, but present risks relating to political, economic, or regulatory conditions not found in more mature markets, such as government controls on foreign investments, government restrictions on the transfer of securities, and less developed trading markets, exchanges, reporting standards, and legal and accounting systems. These securities may be more volatile and less liquid, which may also make them more difficult to value than securities in countries with developed economies.
Mid- and Small-Capitalization Companies Risk. Companies with less than $10 billion in market capitalization are considered by the Adviser to be mid- or small-capitalization companies. Mid- and small-capitalization companies typically have more limited product lines, markets, and financial resources than larger companies and their securities may trade less frequently and in more limited volume than those of larger, more mature companies.
An investment in the Fund is not a deposit of the bank and is not insured or guaranteed by the Federal Deposit Insurance Corporation or any other government agency.
Prospectus | Davis Funds | 5
Calendar Year Total Returns for Class A Shares
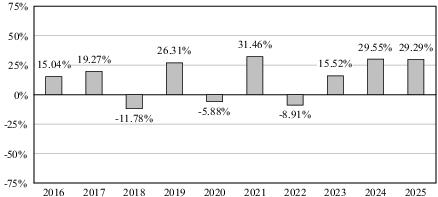
| | Returns | Period Ending |
| Quarter | | |
| Quarter | - | |
| | - | |
| Average Annual Total Returns (For the periods ended December 31, 2025, with maximum sales charge) | Past 1 Year | Past 5 Years | Past 10 Years |
| Class A shares return before taxes | | | |
| Class A shares return after taxes on distributions | | | |
| Class A shares return after taxes on distributions and sale of Fund shares | | | |
| Class C shares return before taxes | | | |
| Class Y shares return before taxes | | | |
| S&P 500 Index reflects no deduction for fees, expenses or taxes | | | |
| S&P 500 Financials Index reflects no deduction for fees, expenses or taxes | | | |
Management
Investment Adviser. Davis Selected Advisers, L.P. serves as the Fund’s investment adviser.
Sub-Adviser. Davis Selected Advisers–NY, Inc., a wholly owned subsidiary of the Adviser, serves as the Fund’s sub-adviser.
Portfolio Managers. As of the date of this prospectus, the Portfolio Managers listed below are jointly
and primarily responsible for the day-to-day management of the Fund’s portfolio.
|
Portfolio Managers
|
Experience with this Fund
|
Primary Title with Investment Adviser or Sub-Adviser
|
|
Christopher Davis
|
Since January 2014; and from
May 1991 until May 2007
|
Chairman, Davis Selected Advisers, L.P.
|
|
Pierce Crosbie
|
Since December 2018
|
Vice President, Davis Selected Advisers–NY, Inc.
|
Purchase and Sale of Fund Shares
|
|
Class A and C shares
|
Class Y shares
|
|
Minimum Initial Investment
|
$1,000
|
$5,000,000
|
|
Minimum Additional Investment
|
$25
|
$25
|
You may sell (redeem) shares each day the New York Stock Exchange is open. Your transaction
may be placed through your dealer or financial adviser, by writing to Davis Funds, P.O. Box 219197, Kansas City,
MO 64121-9197, telephoning 1-800-279-0279 or accessing the Fund’s website, www.davisfunds.com. Certain financial intermediaries may impose different restrictions than those shown above.
Tax Information
If the Fund earns income or realizes capital gains, it intends to make distributions
that may be taxed as ordinary income, qualified dividend income or capital gains by federal, state and local authorities.
Payments to Broker-Dealers and Other Financial Intermediaries
If you purchase the Fund through a broker-dealer or other financial intermediary (such
as a bank), the Fund and its related companies may pay the intermediary for the sale of Fund shares and related services.
These payments may create a conflict of interest by influencing the broker-dealer or other intermediary and your salesperson
to recommend the Fund over another investment. Ask your salesperson or visit your financial intermediary’s website for more information.
Prospectus | Davis Funds | 6
The Fund seeks long-term growth of capital.
This table describes the fees and expenses that you may pay if you buy, hold, and sell shares of the Fund. You may pay other fees, such as brokerage commissions and other fees to financial intermediaries, which are not reflected in the tables and examples below. You may qualify for sales charge discounts with respect to Class A shares if you and your family invest, or agree to invest in the future, at least $100,000 in Davis Funds. More information about these and other discounts is available from your financial intermediary and in “How to Choose a Share Class” on page 45 of the Fund’s prospectus and “Selecting the Appropriate Class of Shares” on page 35 of the Fund’s statement of additional information. In addition, descriptions of the sales load waivers and/or discounts for Class A shares with respect to certain financial intermediaries are reproduced in “Appendix A: Intermediary-Specific Sales Charge Waivers and Discounts” to the prospectus based on information provided by the financial intermediary.
| Shareholder Fees (fees paid directly from your investment) | Class A shares | Class C shares | Class Y shares |
| Maximum Sales Charge (Load) Imposed on Purchases (as a percentage of offering price) | | | |
| Maximum Deferred Sales Charge (Load) (as a percentage of the lesser of the net asset value of the shares redeemed or the total cost of such shares) | | | |
| Redemption Fee (as a percentage of total redemption proceeds) | | | |
*
†
| Annual Fund Operating Expenses (expenses that you pay each year as a percentage of the value of your investment) | Class A shares | Class C shares | Class Y shares |
| Management Fees | | | |
| Distribution and/or Service (12b-1) Fees | | | |
| Other Expenses | | | |
| Total Annual Fund Operating Expenses | | | |
| Less Fee Waiver and/or Expense Reimbursement* | | - | |
| Total Annual Fund Operating Expenses After Fee Waivers and/or Expense Reimbursement | | | |
*
The Adviser (as defined below) is contractually committed to waive fees and/or reimburse the Fund’s expenses to the extent necessary to cap total annual fund operating expenses (Class A shares, 1.00%; Class C shares, 1.75%; Class Y shares, 0.75%). For purposes of these expense caps, operating expenses do not include foreign tax reclaim filing expenses. The Adviser is obligated to continue the expense cap through May 1, 2027 . The expense cap cannot be terminated prior to this date without the consent of the Board of Directors. After that date, there is no assurance that the Adviser will continue to cap expenses. The Adviser may not recoup any of the operating expenses it has reimbursed to the Fund.
|
|
If you redeem your shares in:
|
If you did not redeem your shares in:
|
||||||
|
|
1 Year
|
3 Years
|
5 Years
|
10 Years
|
1 Year
|
3 Years
|
5 Years
|
10 Years
|
|
Class A shares
|
$ |
$ |
$ |
$ |
$ |
$ |
$ |
$ |
|
Class C shares
|
$ |
$ |
$ |
$ |
$ |
$ |
$ |
$ |
|
Class Y shares
|
$ |
$ |
$ |
$ |
$ |
$ |
$ |
$ |
The Fund pays transaction costs, such as commissions, when it buys and sells securities (or “turns over” its portfolio). A higher portfolio turnover rate may indicate higher transaction costs and may result in higher taxes when Fund shares are held in a taxable account. These costs, which are not reflected in annual fund operating expenses or in the example, affect the Fund’s performance. During the most recent fiscal year, the Fund’s portfolio turnover rate was 18 % of the average value of its portfolio.
Prospectus | Davis Funds | 7
Davis Selected Advisers, L.P. (“Davis Advisors” or the “Adviser”), the Fund’s investment adviser, uses the Davis Investment Discipline to invest the Fund’s portfolio principally in common stocks (including indirect holdings of common stock through Depositary Receipts (as defined below)). The Fund may invest in large, medium or small
companies without regard to market capitalization and may invest in issuers in foreign countries, including countries
with developed or emerging markets.
Davis Investment Discipline. Davis Advisors manages equity funds using the Davis Investment Discipline. Davis
Advisors conducts extensive research to try to identify businesses that possess characteristics
that Davis Advisors believes foster the creation of long-term value, such as proven management, a durable franchise and business
model, and sustainable competitive advantages. Davis Advisors aims to invest in such businesses when they are trading
at discounts to their intrinsic worth. Davis Advisors emphasizes individual stock selection and believes that the ability to evaluate
management is critical. Davis Advisors routinely visits managers at their places of business in order to gain insight into
the relative value of different businesses. Such research, however rigorous, involves predictions and forecasts that are inherently
uncertain. After determining which companies Davis Advisors believes the Fund should own, Davis Advisors then turns its
analysis to determining the intrinsic value of those companies’ equity securities. Davis Advisors seeks companies whose equity securities can be purchased at a discount from Davis Advisors’ estimate of the company’s intrinsic value based upon fundamental analysis of cash flows, assets and liabilities, and other criteria that Davis Advisors deems to be material on a company-by-company basis. Davis Advisors’ goal is to invest in companies for the long term (ideally, five years or longer, although
this goal may not be met). Davis Advisors considers selling a company’s equity securities if the securities’ market price exceeds Davis Advisors’ estimates of intrinsic value, if the ratio of the risks and rewards of continuing to own the company’s equity securities is no longer attractive, to raise cash to purchase a more attractive investment opportunity, to satisfy net
redemptions, or for other purposes.
Principal Risks of Investing in the Fund
The principal risks of investing in the Fund are:
Stock Market Risk. Stock markets tend to move in cycles, with periods of rising prices and periods of falling prices, including the possibility of sharp declines.
Common Stock Risk. Common stock represents an ownership position in a company. An adverse event may have a negative impact on a company and could result in a decline in the price of its common stock. Common stock is generally subordinate to an issuer’s other securities, including preferred, convertible, and debt securities.
Foreign Country Risk. Securities of foreign companies (including Depositary Receipts) may be subject to greater risk, as foreign economies may not be as strong or diversified, foreign political systems may not be as stable and foreign financial reporting standards may not be as rigorous as they are in the United States. There may also be less information publicly available regarding the non-U.S. issuers and their securities. These securities may be less liquid (and, in some cases, may be illiquid) and could be harder to value than more liquid securities.
Headline Risk. The Fund may invest in a company when the company becomes the center of controversy after receiving adverse media attention concerning its operations, long-term prospects, management, or for other reasons. While Davis Advisors researches companies subject to such contingencies, it cannot be correct every time, and the company’s stock may never recover or may become worthless.
Large-Capitalization Companies Risk. Companies with $10 billion or more in market capitalization are considered by the Adviser to be large-capitalization companies. Large-capitalization companies generally experience slower rates of growth in earnings per share than do mid- and small-capitalization companies.
Mid- and Small-Capitalization Companies Risk. Companies with less than $10 billion in market capitalization are considered by the Adviser to be mid- or small-capitalization companies. Mid- and small-capitalization companies typically have more limited product lines, markets, and financial resources than larger companies and their securities may trade less frequently and in more limited volume than those of larger, more mature companies.
Manager Risk. Poor security selection or focus on securities in a particular sector, category, or group of companies may cause the Fund to underperform relevant benchmarks or other funds with a similar investment objective. Even if the Adviser implements the intended investment strategies, the implementation of the strategies may be unsuccessful in achieving the Fund’s investment objective.
Depositary Receipts Risk. Depositary Receipts, consisting of American Depositary Receipts, European Depositary Receipts, and Global Depositary Receipts, are certificates evidencing ownership of shares of a foreign issuer. Depositary Receipts are subject to many of the risks associated with investing directly in foreign securities. Depositary Receipts may trade at a discount, or a premium, to the underlying security and may be less liquid than the underlying securities listed on an exchange.
Emerging Market Risk. Securities of issuers in emerging and developing markets may offer special investment opportunities, but present risks relating to political, economic, or regulatory conditions not found in more mature markets, such as government controls on foreign investments, government restrictions on the transfer of securities, and less developed trading
Prospectus | Davis Funds | 8
markets, exchanges, reporting standards, and legal and accounting systems. These securities may be more volatile and less liquid, which may also make them more difficult to value than securities in countries with developed economies.
Fees and Expenses Risk. The Fund may not earn enough through income and capital appreciation to offset the operating expenses of the Fund. All mutual funds incur operating fees and expenses. Fees and expenses reduce the return that a shareholder may earn by investing in a fund, even when a fund has favorable performance. A low-return environment, or a bear market, increases the risk that a shareholder may lose money.
Foreign Currency Risk. The change in value of a foreign currency against the U.S. dollar will result in a change in the U.S. dollar value of securities denominated in that foreign currency. For example, when the Fund holds a security that is denominated in a foreign currency, a decline of that foreign currency against the U.S. dollar would generally cause the value of the Fund’s shares to decline.
An investment in the Fund is not a deposit of the bank and is not insured or guaranteed by the Federal Deposit Insurance Corporation or any other government agency.
Calendar Year Total Returns for Class A Shares
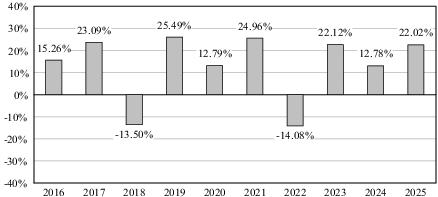
| | Returns | Period Ending |
| Quarter | | |
| Quarter | - | |
| | - | |
| Average Annual Total Returns (For the periods ended December 31, 2025, with maximum sales charge) | Past 1 Year | Past 5 Years | Past 10 Years |
| Class A shares return before taxes | | | |
| Class A shares return after taxes on distributions | | | |
| Class A shares return after taxes on distributions and sale of Fund shares | | | |
| Class C shares return before taxes | | | |
| Class Y shares return before taxes | | | |
| S&P 1500 Index reflects no deduction for fees, expenses or taxes | | | |
Management
Investment Adviser. Davis Selected Advisers, L.P. serves as the Fund’s investment adviser and uses a system of multiple Portfolio Managers to manage the Fund’s assets. The Portfolio Managers listed below are primarily responsible for the day-to-day management of the Fund’s assets.
Sub-Adviser. Davis Selected Advisers–NY, Inc., a wholly owned subsidiary of the Adviser, serves as the Fund’s sub-adviser.
Portfolio Managers. As of the date of this prospectus, the Portfolio Managers listed below managed the
five largest segments of the Fund’s assets. This list is subject to change for reasons including, but not limited to, market fluctuation.
Prospectus | Davis Funds | 9
|
Portfolio Managers
|
Experience with this Fund
|
Primary Title with Investment Adviser or Sub-Adviser
|
|
Dwight Blazin
|
Since December 2001
|
Vice President, Davis Selected Advisers–NY, Inc.
|
|
Christopher Davis
|
Since January 1999
|
Chairman, Davis Selected Advisers, L.P.
|
|
Danton Goei
|
Since December 2001
|
Vice President, Davis Selected Advisers–NY, Inc.
|
|
Darin Prozes
|
Since November 2013
|
Vice President, Davis Selected Advisers–NY, Inc.
|
|
Edward Yen
|
Since January 2022
|
Vice President, Davis Selected Advisers–NY, Inc.
|
Purchase and Sale of Fund Shares
|
|
Class A and C shares
|
Class Y shares
|
|
Minimum Initial Investment
|
$1,000
|
$5,000,000
|
|
Minimum Additional Investment
|
$25
|
$25
|
You may sell (redeem) shares each day the New York Stock Exchange is open. Your transaction
may be placed through your dealer or financial adviser, by writing to Davis Funds, P.O. Box 219197, Kansas City,
MO 64121-9197, telephoning 1-800-279-0279 or accessing the Fund’s website, www.davisfunds.com. Certain financial intermediaries may impose different restrictions than those shown above.
Tax Information
If the Fund earns income or realizes capital gains, it intends to make distributions
that may be taxed as ordinary income, qualified dividend income or capital gains by federal, state and local authorities.
Payments to Broker-Dealers and Other Financial Intermediaries
If you purchase the Fund through a broker-dealer or other financial intermediary (such
as a bank), the Fund and its related companies may pay the intermediary for the sale of Fund shares and related services.
These payments may create a conflict of interest by influencing the broker-dealer or other intermediary and your salesperson
to recommend the Fund over another investment. Ask your salesperson or visit your financial intermediary’s website for more information.
Prospectus | Davis Funds | 10
The Fund seeks total return through a combination of growth and income.
This table describes the fees and expenses that you may pay if you buy, hold, and sell shares of the Fund. You may pay other fees, such as brokerage commissions and other fees to financial intermediaries, which are not reflected in the tables and examples below. You may qualify for sales charge discounts with respect to Class A shares if you and your family invest, or agree to invest in the future, at least $100,000 in Davis Funds. More information about these and other discounts is available from your financial intermediary and in “How to Choose a Share Class” on page 45 of the Fund’s prospectus and “Selecting the Appropriate Class of Shares” on page 35 of the Fund’s statement of additional information. In addition, descriptions of the sales load waivers and/or discounts for Class A shares with respect to certain financial intermediaries are reproduced in “Appendix A: Intermediary-Specific Sales Charge Waivers and Discounts” to the prospectus based on information provided by the financial intermediary.
| Shareholder Fees (fees paid directly from your investment) | Class A shares | Class C shares | Class Y shares |
| Maximum Sales Charge (Load) Imposed on Purchases (as a percentage of offering price) | | | |
| Maximum Deferred Sales Charge (Load) (as a percentage of the lesser of the net asset value of the shares redeemed or the total cost of such shares) | | | |
| Redemption Fee (as a percentage of total redemption proceeds) | | | |
*
†
| Annual Fund Operating Expenses (expenses that you pay each year as a percentage of the value of your investment) | Class A shares | Class C shares | Class Y shares |
| Management Fees | | | |
| Distribution and/or Service (12b-1) Fees | | | |
| Other Expenses | | | |
| Total Annual Fund Operating Expenses | | | |
| Less Fee Waiver and/or Expense Reimbursement* | - | - | |
| Total Annual Fund Operating Expenses After Fee Waivers and/or Expense Reimbursement | | | |
*
The Adviser (as defined below) is contractually committed to waive fees and/or reimburse the Fund’s expenses to the extent necessary to cap total annual fund operating expenses (Class A shares, 1.00%; Class C shares, 1.75%; Class Y shares, 0.75%). For purposes of these expense caps, operating expenses do not include foreign tax reclaim filing expenses. The Adviser is obligated to continue the expense cap through May 1, 2027 . The expense cap cannot be terminated prior to this date without the consent of the Board of Directors. After that date, there is no assurance that the Adviser will continue to cap expenses. The Adviser may not recoup any of the operating expenses it has reimbursed to the Fund.
|
|
If you redeem your shares in:
|
If you did not redeem your shares in:
|
||||||
|
|
1 Year
|
3 Years
|
5 Years
|
10 Years
|
1 Year
|
3 Years
|
5 Years
|
10 Years
|
|
Class A shares
|
$ |
$ |
$ |
$ |
$ |
$ |
$ |
$ |
|
Class C shares
|
$ |
$ |
$ |
$ |
$ |
$ |
$ |
$ |
|
Class Y shares
|
$ |
$ |
$ |
$ |
$ |
$ |
$ |
$ |
The Fund pays transaction costs, such as commissions, when it buys and sells securities (or “turns over” its portfolio). A higher portfolio turnover rate may indicate higher transaction costs and may result in higher taxes when Fund shares are held in a taxable account. These costs, which are not reflected in annual fund operating expenses or in the example, affect the Fund’s performance. During the most recent fiscal year, the Fund’s portfolio turnover rate was 17 % of the average value of its portfolio.
Prospectus | Davis Funds | 11
Davis Selected Advisers, L.P. (“Davis Advisors” or the “Adviser”), the Fund’s investment adviser, uses the Davis Investment Discipline to invest, under normal market conditions, at least 80% of the Fund’s net assets, plus any borrowing for investment purposes, in securities issued by companies principally engaged in the real estate industry. The Fund invests principally in common stocks of domestic companies and may invest in foreign companies (including indirect holdings of a foreign issuer’s common stock through Depositary Receipts (as defined below)).
A company is principally engaged in the real estate industry if it owns real estate
or real estate-related assets that constitute at least 50% of the value of all of its assets, or if it derives at least 50% of its
revenues or net profits from owning, financing, developing, managing or selling real estate, or from offering products or services
that are related to real estate. Issuers of real estate securities include real estate investment trusts (“REITs”), brokers, developers, lenders and companies with substantial real estate holdings, such as paper, lumber, hotel and entertainment companies. Most of the Fund’s real estate securities are, and will likely continue to be, interests in publicly traded REITs. REITs pool investors’ funds to make real estate-related investments, such as buying interests in income-producing property or making loans
to real estate developers.
Davis Investment Discipline. Davis Advisors manages equity funds using the Davis Investment Discipline. Davis
Advisors conducts extensive research to try to identify businesses that possess characteristics
that Davis Advisors believes foster the creation of long-term value, such as proven management, a durable franchise and business
model, and sustainable competitive advantages. Davis Advisors aims to invest in such businesses when they are trading
at discounts to their intrinsic worth. Davis Advisors emphasizes individual stock selection and believes that the ability to evaluate
management is critical. Davis Advisors routinely visits managers at their places of business in order to gain insight into
the relative value of different businesses. Such research, however rigorous, involves predictions and forecasts that are inherently
uncertain. After determining which companies Davis Advisors believes the Fund should own, Davis Advisors then turns its
analysis to determining the intrinsic value of those companies’ equity securities. Davis Advisors seeks companies whose equity securities can be purchased at a discount from Davis Advisors’ estimate of the company’s intrinsic value based upon fundamental analysis of cash flows, assets and liabilities, and other criteria that Davis Advisors deems to be material on a company-by-company basis. Davis Advisors’ goal is to invest in companies for the long term (ideally, five years or longer, although
this goal may not be met). Davis Advisors considers selling a company’s equity securities if the securities’ market price exceeds Davis Advisors’ estimates of intrinsic value, if the ratio of the risks and rewards of continuing to own the company’s equity securities is no longer attractive, to raise cash to purchase a more attractive investment opportunity, to satisfy net
redemptions, or for other purposes.
Principal Risks of Investing in the Fund
The principal risks of investing in the Fund are:
Stock Market Risk. Stock markets tend to move in cycles, with periods of rising prices and periods of falling prices, including the possibility of sharp declines.
Common Stock Risk. Common stock represents an ownership position in a company. An adverse event may have a negative impact on a company and could result in a decline in the price of its common stock. Common stock is generally subordinate to an issuer’s other securities, including preferred, convertible, and debt securities.
Real Estate Risk. Real estate securities are susceptible to the many risks associated with the direct ownership of real estate, including declines in property values, increases in property taxes, operating expenses, interest rates or competition, overbuilding, changes in zoning laws, or losses from casualty or condemnation.
Headline Risk. The Fund may invest in a company when the company becomes the center of controversy after receiving adverse media attention concerning its operations, long-term prospects, management, or for other reasons. While Davis Advisors researches companies subject to such contingencies, it cannot be correct every time, and the company’s stock may never recover or may become worthless.
Large-Capitalization Companies Risk. Companies with $10 billion or more in market capitalization are considered by the Adviser to be large-capitalization companies. Large-capitalization companies generally experience slower rates of growth in earnings per share than do mid- and small-capitalization companies.
Manager Risk. Poor security selection or focus on securities in a particular sector, category, or group of companies may cause the Fund to underperform relevant benchmarks or other funds with a similar investment objective. Even if the Adviser implements the intended investment strategies, the implementation of the strategies may be unsuccessful in achieving the Fund’s investment objective.
Fees and Expenses Risk. The Fund may not earn enough through income and capital appreciation to offset the operating expenses of the Fund. All mutual funds incur operating fees and expenses. Fees and expenses reduce the return that a shareholder may earn by investing in a fund, even when a fund has favorable performance. A low-return environment, or a bear market, increases the risk that a shareholder may lose money.
Prospectus | Davis Funds | 12
Mid- and Small-Capitalization Companies Risk. Companies with less than $10 billion in market capitalization are considered by the Adviser to be mid- or small-capitalization companies. Mid- and small-capitalization companies typically have more limited product lines, markets, and financial resources than larger companies and their securities may trade less frequently and in more limited volume than those of larger, more mature companies.
Variable Current Income Risk. The income that the Fund pays to investors is not stable.
An investment in the Fund is not a deposit of the bank and is not insured or guaranteed by the Federal Deposit Insurance Corporation or any other government agency.
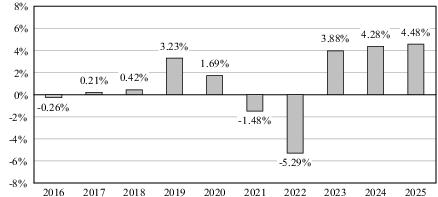
Calendar Year Total Returns for Class A Shares
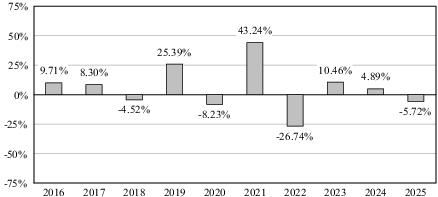
| | Returns | Period Ending |
| Quarter | | |
| Quarter | - | |
| | - | |
| Average Annual Total Returns (For the periods ended December 31, 2025, with maximum sales charge) | Past 1 Year | Past 5 Years | Past 10 Years |
| Class A shares return before taxes | - | | |
| Class A shares return after taxes on distributions | - | | |
| Class A shares return after taxes on distributions and sale of Fund shares | - | | |
| Class C shares return before taxes | - | | |
| Class Y shares return before taxes | - | | |
| S&P 500 Index | | | |
| Wilshire U.S. Real Estate Securities Index reflects no deduction for fees, expenses or taxes | | | |
| Yield for Class A Shares (For the period ended December 31, 2025) | |
| 30-Day SEC Yield | |
You can obtain the Fund’s most recent 30-day SEC Yield by calling Investor Services toll-free at 1-800-279-0279, Monday through Friday, from 9 a.m. to 6 p.m. Eastern Time.
Management
Investment Adviser. Davis Selected Advisers, L.P. serves as the Fund’s investment adviser.
Sub-Adviser. Davis Selected Advisers–NY, Inc., a wholly owned subsidiary of the Adviser, serves as the Fund’s sub-adviser.
Portfolio Managers. As of the date of this prospectus, the Portfolio Managers listed below are jointly
and primarily responsible for the day-to-day management of the Fund’s portfolio.
Prospectus | Davis Funds | 13
|
Portfolio Managers
|
Experience with this Fund
|
Primary Title with Investment Adviser or Sub-Adviser
|
|
Andrew Davis
|
Since January 1994
|
President, Davis Selected Advisers, L.P.
|
|
Chandler Spears
|
Since August 2002
|
Vice President, Davis Selected Advisers–NY, Inc.
|
Purchase and Sale of Fund Shares
|
|
Class A and C shares
|
Class Y shares
|
|
Minimum Initial Investment
|
$1,000
|
$5,000,000
|
|
Minimum Additional Investment
|
$25
|
$25
|
You may sell (redeem) shares each day the New York Stock Exchange is open. Your transaction
may be placed through your dealer or financial adviser, by writing to Davis Funds, P.O. Box 219197, Kansas City,
MO 64121-9197, telephoning 1-800-279-0279 or accessing the Fund’s website, www.davisfunds.com. Certain financial intermediaries may impose different restrictions than those shown above.
Tax Information
If the Fund earns income or realizes capital gains, it intends to make distributions
that may be taxed as ordinary income, qualified dividend income or capital gains by federal, state and local authorities.
Payments to Broker-Dealers and Other Financial Intermediaries
If you purchase the Fund through a broker-dealer or other financial intermediary (such
as a bank), the Fund and its related companies may pay the intermediary for the sale of Fund shares and related services.
These payments may create a conflict of interest by influencing the broker-dealer or other intermediary and your salesperson
to recommend the Fund over another investment. Ask your salesperson or visit your financial intermediary’s website for more information.
Prospectus | Davis Funds | 14
The Fund seeks total return through a combination of growth and income.
This table describes the fees and expenses that you may pay if you buy, hold, and sell shares of the Fund. You may pay other fees, such as brokerage commissions and other fees to financial intermediaries, which are not reflected in the tables and examples below. You may qualify for sales charge discounts with respect to Class A shares if you and your family invest, or agree to invest in the future, at least $100,000 in Davis Funds. More information about these and other discounts is available from your financial intermediary and in “How to Choose a Share Class” on page 45 of the Fund’s prospectus and “Selecting the Appropriate Class of Shares” on page 35 of the Fund’s statement of additional information. In addition, descriptions of the sales load waivers and/or discounts for Class A shares with respect to certain financial intermediaries are reproduced in “Appendix A: Intermediary-Specific Sales Charge Waivers and Discounts” to the prospectus based on information provided by the financial intermediary.
| Shareholder Fees (fees paid directly from your investment) | Class A shares | Class C shares | Class Y shares |
| Maximum Sales Charge (Load) Imposed on Purchases (as a percentage of offering price) | | | |
| Maximum Deferred Sales Charge (Load) (as a percentage of the lesser of the net asset value of the shares redeemed or the total cost of such shares) | | | |
| Redemption Fee (as a percentage of total redemption proceeds) | | | |
*
†
| Annual Fund Operating Expenses (expenses that you pay each year as a percentage of the value of your investment) | Class A shares | Class C shares | Class Y shares |
| Management Fees | | | |
| Distribution and/or Service (12b-1) Fees | | | |
| Other Expenses | | | |
| Total Annual Fund Operating Expenses | | | |
| Less Fee Waiver and/or Expense Reimbursement* | | - | |
| Total Annual Fund Operating Expenses After Fee Waivers and/or Expense Reimbursement | | | |
*
The Adviser (as defined below) is contractually committed to waive fees and/or reimburse the Fund’s expenses to the extent necessary to cap total annual fund operating expenses (Class A shares, 1.00%; Class C shares, 1.75%; Class Y shares, 0.75%). For purposes of these expense caps, operating expenses do not include foreign tax reclaim filing expenses. The Adviser is obligated to continue the expense cap through May 1, 2027 . The expense cap cannot be terminated prior to this date without the consent of the Board of Directors. After that date, there is no assurance that the Adviser will continue to cap expenses. The Adviser may not recoup any of the operating expenses it has reimbursed to the Fund.
|
|
If you redeem your shares in:
|
If you did not redeem your shares in:
|
||||||
|
|
1 Year
|
3 Years
|
5 Years
|
10 Years
|
1 Year
|
3 Years
|
5 Years
|
10 Years
|
|
Class A shares
|
$ |
$ |
$ |
$ |
$ |
$ |
$ |
$ |
|
Class C shares
|
$ |
$ |
$ |
$ |
$ |
$ |
$ |
$ |
|
Class Y shares
|
$ |
$ |
$ |
$ |
$ |
$ |
$ |
$ |
The Fund pays transaction costs, such as commissions, when it buys and sells securities (or “turns over” its portfolio). A higher portfolio turnover rate may indicate higher transaction costs and may result in higher taxes when Fund shares are held in a taxable account. These costs, which are not reflected in annual fund operating expenses or in the example, affect the Fund’s performance. During the most recent fiscal year, the Fund’s portfolio turnover rate was 12 % of the average value of its portfolio.
Prospectus | Davis Funds | 15
Davis Selected Advisers, L.P. (“Davis Advisors” or the “Adviser”), the Fund’s investment adviser, uses the Davis Investment Discipline to invest the Fund’s assets in a balanced portfolio of common stock, preferred stock and bonds. The Fund may also hold cash. The Fund may invest in large, medium or small companies without regard
to market capitalization and may invest in securities issued by either domestic or foreign companies.
The Fund’s investments in common stock issued by companies across the spectrum of market capitalizations are purchased primarily for their growth potential. Fixed income securities, consisting of both
investment grade and high-yield, high-risk debt securities (“junk bonds”), are purchased both for current income and to provide diversification.
Davis Investment Discipline. Davis Advisors manages equity funds using the Davis Investment Discipline. Davis
Advisors conducts extensive research to try to identify businesses that possess characteristics
that Davis Advisors believes foster the creation of long-term value, such as proven management, a durable franchise and business
model, and sustainable competitive advantages. Davis Advisors aims to invest in such businesses when they are trading
at discounts to their intrinsic worth. Davis Advisors emphasizes individual stock selection and believes that the ability to evaluate
management is critical. Davis Advisors routinely visits managers at their places of business in order to gain insight into
the relative value of different businesses. Such research, however rigorous, involves predictions and forecasts that are inherently
uncertain. After determining which companies Davis Advisors believes the Fund should own, Davis Advisors then turns its
analysis to determining the intrinsic value of those companies’ equity securities. Davis Advisors seeks companies whose equity securities can be purchased at a discount from Davis Advisors’ estimate of the company’s intrinsic value based upon fundamental analysis of cash flows, assets and liabilities, and other criteria that Davis Advisors deems to be material on a company-by-company basis. Davis Advisors’ goal is to invest in companies for the long term (ideally, five years or longer, although
this goal may not be met). Davis Advisors considers selling a company’s equity securities if the securities’ market price exceeds Davis Advisors’ estimates of intrinsic value, if the ratio of the risks and rewards of continuing to own the company’s equity securities is no longer attractive, to raise cash to purchase a more attractive investment opportunity, to satisfy net
redemptions, or for other purposes.
Principal Risks of Investing in the Fund
The principal risks of investing in the Fund are:
Stock Market Risk. Stock markets tend to move in cycles, with periods of rising prices and periods of falling prices, including the possibility of sharp declines.
Common Stock Risk. Common stock represents an ownership position in a company. An adverse event may have a negative impact on a company and could result in a decline in the price of its common stock. Common stock is generally subordinate to an issuer’s other securities, including preferred, convertible, and debt securities.
Headline Risk. The Fund may invest in a company when the company becomes the center of controversy after receiving adverse media attention concerning its operations, long-term prospects, management, or for other reasons. While Davis Advisors researches companies subject to such contingencies, it cannot be correct every time, and the company’s stock may never recover or may become worthless.
Large-Capitalization Companies Risk. Companies with $10 billion or more in market capitalization are considered by the Adviser to be large-capitalization companies. Large-capitalization companies generally experience slower rates of growth in earnings per share than do mid- and small-capitalization companies.
Manager Risk. Poor security selection or focus on securities in a particular sector, category, or group of companies may cause the Fund to underperform relevant benchmarks or other funds with a similar investment objective. Even if the Adviser implements the intended investment strategies, the implementation of the strategies may be unsuccessful in achieving the Fund’s investment objective.
Preferred Stock Risk. Preferred stock is a form of equity security and is generally ranked behind an issuer’s debt securities in claims for dividends and assets of an issuer in a liquidation or bankruptcy. An adverse event may have a negative impact on a company and could result in a decline in the price of its preferred stock.
Bonds and Other Debt Securities Risk. Corporations, governments and other issuers sell bonds and other debt securities to borrow money. Issuers pay investors interest and generally must repay the amount borrowed at maturity. Bonds and other debt securities generally are subject to credit risk and interest rate risk.
Interest Rate Risk. Interest rate increases can cause the price of a debt security to decrease.
Variable Current Income Risk. The income that the Fund pays to investors is not stable.
Credit Risk. The issuer of a fixed income security (potentially even the U.S. Government) may be unable to make timely payments of interest and principal.
Changes in Debt Rating Risk. If a rating agency gives a fixed income security or its issuer a low rating, the value of the security will decline because investors will demand a higher rate of return.
Prospectus | Davis Funds | 16
Extension and Prepayment Risk. Extension risk occurs when borrowers maintain their existing debt obligations until they come due instead of choosing to prepay them. Prepayment risk occurs when borrowers prepay their debt obligations more quickly than usual so that they can refinance at a lower rate. The pace at which borrowers prepay affects the yield and the cash flow to holders of securities and the market value of those securities.
Foreign Country Risk. Securities of foreign companies (including Depositary Receipts) may be subject to greater risk, as foreign economies may not be as strong or diversified, foreign political systems may not be as stable and foreign financial reporting standards may not be as rigorous as they are in the United States. There may also be less information publicly available regarding the non-U.S. issuers and their securities. These securities may be less liquid (and, in some cases, may be illiquid) and could be harder to value than more liquid securities.
Depositary Receipts Risk. Depositary Receipts, consisting of American Depositary Receipts, European Depositary Receipts, and Global Depositary Receipts, are certificates evidencing ownership of shares of a foreign issuer. Depositary Receipts are subject to many of the risks associated with investing directly in foreign securities. Depositary Receipts may trade at a discount, or a premium, to the underlying security and may be less liquid than the underlying securities listed on an exchange.
Fees and Expenses Risk. The Fund may not earn enough through income and capital appreciation to offset the operating expenses of the Fund. All mutual funds incur operating fees and expenses. Fees and expenses reduce the return that a shareholder may earn by investing in a fund, even when a fund has favorable performance. A low-return environment, or a bear market, increases the risk that a shareholder may lose money.
Mid- and Small-Capitalization Companies Risk. Companies with less than $10 billion in market capitalization are considered by the Adviser to be mid- or small-capitalization companies. Mid- and small-capitalization companies typically have more limited product lines, markets, and financial resources than larger companies and their securities may trade less frequently and in more limited volume than those of larger, more mature companies.
High-Yield, High-Risk Debt Securities Risk. Issuers of these debt securities are unlikely to have a cushion from which to make their payments when their earnings are poor or when the economy in general is in decline. These issuers are likely to have a substantial amount of other debt, which will be senior to the high-yield, high-risk debt securities. An issuer must be current on its senior obligations before it can pay bondholders.
Shareholder Concentration Risk. From time to time, a relatively large percentage (over 20%) of the Fund’s shares may be held by related shareholders. A large redemption by one or more of such shareholders may: (1) reduce the Fund’s liquidity, (2) increase the Fund’s transactions and transaction costs, (3) result in substantial capital gains distributions for shareholders, and (4) increase the Fund’s ongoing operating expenses, which could negatively impact the remaining shareholders of the Fund.
An investment in the Fund is not a deposit of the bank and is not insured or guaranteed by the Federal Deposit Insurance Corporation or any other government agency.
Prospectus | Davis Funds | 17
Calendar Year Total Returns for Class A Shares
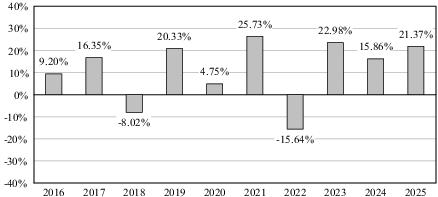
| | Returns | Period Ending |
| Quarter | | |
| Quarter | - | |
| | | |
| Average Annual Total Returns (For the periods ended December 31, 2025, with maximum sales charge) | Past 1 Year | Past 5 Years | Past 10 Years |
| Class A shares return before taxes | | | |
| Class A shares return after taxes on distributions | | | |
| Class A shares return after taxes on distributions and sale of Fund shares | | | |
| Class C shares return before taxes | | | |
| Class Y shares return before taxes | | | |
| S&P 500 Index reflects no deduction for fees, expenses or taxes | | | |
| Bloomberg U.S. Aggregate Bond Index reflects no deduction for fees, expenses or taxes | | - | |
| Yield for Class A Shares (For the period ended December 31, 2025) | |
| 30-Day SEC Yield | |
Management
Investment Adviser. Davis Selected Advisers, L.P. serves as the Fund’s investment adviser.
Sub-Adviser. Davis Selected Advisers–NY, Inc., a wholly owned subsidiary of the Adviser, serves as the Fund’s sub-adviser.
Portfolio Managers. As of the date of this prospectus, the Portfolio Managers listed below are jointly
and primarily responsible for the day-to-day management of the Fund’s portfolio.
|
Portfolio Managers
|
Experience with this Fund
|
Primary Title with Investment Adviser or Sub-Adviser
|
|
Christopher Davis
|
Since July 2016
|
Chairman, Davis Selected Advisers, L.P.
|
|
Erik Jones
|
Since March 2026
|
Portfolio Manager
|
|
Darin Prozes
|
Since October 2021
|
Vice President, Davis Selected Advisers–NY, Inc.
|
Purchase and Sale of Fund Shares
|
|
Class A and C shares
|
Class Y shares
|
|
Minimum Initial Investment
|
$1,000
|
$5,000,000
|
|
Minimum Additional Investment
|
$25
|
$25
|
You may sell (redeem) shares each day the New York Stock Exchange is open. Your transaction
may be placed through your dealer or financial adviser, by writing to Davis Funds, P.O. Box 219197, Kansas City,
MO 64121-9197, telephoning 1-800-279-0279 or accessing the Fund’s website, www.davisfunds.com. Certain financial intermediaries may impose different restrictions than those shown above.
Tax Information
If the Fund earns income or realizes capital gains, it intends to make distributions
that may be taxed as ordinary income, qualified dividend income or capital gains by federal, state and local authorities.
Prospectus | Davis Funds | 18
Payments to Broker-Dealers and Other Financial Intermediaries
If you purchase the Fund through a broker-dealer or other financial intermediary (such
as a bank), the Fund and its related companies may pay the intermediary for the sale of Fund shares and related services.
These payments may create a conflict of interest by influencing the broker-dealer or other intermediary and your salesperson
to recommend the Fund over another investment. Ask your salesperson or visit your financial intermediary’s website for more information.
Prospectus | Davis Funds | 19
The Fund seeks current income.
This table describes the fees and expenses that you may pay if you buy, hold, and sell shares of the Fund. You may pay other fees, such as brokerage commissions and other fees to financial intermediaries, which are not reflected in the tables and examples below. You may qualify for sales charge discounts with respect to Class A shares if you and your family invest, or agree to invest in the future, at least $100,000 in Davis Funds. More information about these and other discounts is available from your financial intermediary and in “How to Choose a Share Class” on page 45 of the Fund’s prospectus and “Selecting the Appropriate Class of Shares” on page 35 of the Fund’s statement of additional information. In addition, descriptions of the sales load waivers and/or discounts for Class A shares with respect to certain financial intermediaries are reproduced in “Appendix A: Intermediary-Specific Sales Charge Waivers and Discounts” to the prospectus based on information provided by the financial intermediary.
| Shareholder Fees (fees paid directly from your investment) | Class A shares | Class C shares | Class Y shares |
| Maximum Sales Charge (Load) Imposed on Purchases (as a percentage of offering price) | | | |
| Maximum Deferred Sales Charge (Load) (as a percentage of the lesser of the net asset value of the shares redeemed or the total cost of such shares) | | | |
| Redemption Fee (as a percentage of total redemption proceeds) | | | |
*
†
| Annual Fund Operating Expenses (expenses that you pay each year as a percentage of the value of your investment) | Class A shares | Class C shares | Class Y shares |
| Management Fees | | | |
| Distribution and/or Service (12b-1) Fees | | | |
| Other Expenses | | | |
| Total Annual Fund Operating Expenses | | | |
| Less Fee Waiver and/or Expense Reimbursement* | - | - | - |
| Total Annual Fund Operating Expenses After Fee Waivers and/or Expense Reimbursement | | | |
*
The Adviser (as defined below) is contractually committed to waive fees and/or reimburse the Fund’s expenses to the extent necessary to cap total annual fund operating expenses (Class A shares, 1.00%; Class C shares, 1.75%; Class Y shares, 0.75%). For purposes of these expense caps, operating expenses do not include foreign tax reclaim filing expenses. The Adviser is obligated to continue the expense cap through May 1, 2027 . The expense cap cannot be terminated prior to this date without the consent of the Board of Directors. After that date, there is no assurance that the Adviser will continue to cap expenses. The Adviser may not recoup any of the operating expenses it has reimbursed to the Fund.
|
|
If you redeem your shares in:
|
If you did not redeem your shares in:
|
||||||
|
|
1 Year
|
3 Years
|
5 Years
|
10 Years
|
1 Year
|
3 Years
|
5 Years
|
10 Years
|
|
Class A shares
|
$ |
$ |
$ |
$ |
$ |
$ |
$ |
$ |
|
Class C shares
|
$ |
$ |
$ |
$ |
$ |
$ |
$ |
$ |
|
Class Y shares
|
$ |
$ |
$ |
$ |
$ |
$ |
$ |
$ |
The Fund pays transaction costs, such as commissions, when it buys and sells securities (or “turns over” its portfolio). A higher portfolio turnover rate may indicate higher transaction costs and may result in higher taxes when Fund shares are held in a taxable account. These costs, which are not reflected in annual fund operating expenses or in the example, affect the Fund’s performance. During the most recent fiscal year, the Fund’s portfolio turnover rate was 10 % of the average value of its portfolio.
Prospectus | Davis Funds | 20
The Fund invests exclusively in U.S. Treasury securities, U.S. Government agency securities,
U.S. Government agency mortgage securities (collectively “U.S. Government Securities”) and repurchase agreements collateralized by U.S. Government Securities. Under normal circumstances, the Fund’s portfolio will maintain a weighted average maturity of three years or less.
Principal Risks of Investing in the Fund
The principal risks of investing in the Fund are:
U.S. Government Securities Risk. Generally, government securities, like other debt securities, are interest rate sensitive. During periods of falling interest rates, the values of debt securities held by the Fund generally rise. Conversely, during periods of rising interest rates, the values of such securities generally decline. Changes by recognized rating services in their ratings of debt securities and changes in the ability of an issuer to make payments of interest and principal also will affect the value of these investments.
Repurchase Agreement Risk. The repurchase obligation of the seller is, in effect, secured by the underlying securities. In the event of a bankruptcy or other default of a seller of a repurchase agreement, the Fund could experience both delays in liquidating the underlying securities and losses.
Credit Risk. The issuer of a fixed income security (potentially even the U.S. Government) may be unable to make timely payments of interest and principal.
Changes in Debt Rating Risk. If a rating agency gives a fixed income security or its issuer a low rating, the value of the security will decline because investors will demand a higher rate of return.
Fees and Expenses Risk. The Fund may not earn enough through income and capital appreciation to offset the operating expenses of the Fund. All mutual funds incur operating fees and expenses. Fees and expenses reduce the return that a shareholder may earn by investing in a fund, even when a fund has favorable performance. A low-return environment, or a bear market, increases the risk that a shareholder may lose money.
Inflation Risk. Also called purchasing power risk, this is the chance that the cash flows from an investment won’t be worth as much in the future because of changes in purchasing power due to inflation.
Interest Rate Risk. Interest rate increases can cause the price of a debt security to decrease.
Extension and Prepayment Risk. Extension risk occurs when borrowers maintain their existing debt obligations until they come due instead of choosing to prepay them. Prepayment risk occurs when borrowers prepay their debt obligations more quickly than usual so that they can refinance at a lower rate. The pace at which borrowers prepay affects the yield and the cash flow to holders of securities and the market value of those securities.
Variable Current Income Risk. The income that the Fund pays to investors is not stable.
An investment in the Fund is not a deposit of the bank and is not insured or guaranteed by the Federal Deposit Insurance Corporation or any other government agency.
Prospectus | Davis Funds | 21
Calendar Year Total Returns for Class A Shares
| | Returns | Period Ending |
| Quarter | | |
| Quarter | - | |
| | | |
| Average Annual Total Returns (For the periods ended December 31, 2025, with maximum sales charge) | Past 1 Year | Past 5 Years | Past 10 Years |
| Class A shares return before taxes | - | | |
| Class A shares return after taxes on distributions | - | - | - |
| Class A shares return after taxes on distributions and sale of Fund shares | - | - | |
| Class C shares return before taxes | | | |
| Class Y shares return before taxes | | | |
| Bloomberg U.S. Government 1-3 Year Bond Index expenses or taxes | | | |
| Yield for Class A Shares (For the period ended December 31, 2025) | |
| 30-Day SEC Yield | |
You can obtain the Fund’s most recent 30-day SEC Yield by calling Investor Services toll-free at 1-800-279-0279, Monday through Friday, from 9 a.m. to 6 p.m. Eastern Time.
Management
Investment Adviser. Davis Selected Advisers, L.P. serves as the Fund’s investment adviser.
Sub-Adviser. Davis Selected Advisers–NY, Inc., a wholly owned subsidiary of the Adviser, serves as the Fund’s sub-adviser.
|
Portfolio Manager
|
Experience with this Fund
|
Primary Title with Investment Adviser or Sub-Adviser
|
|
Erik Jones
|
Since March 2026
|
Portfolio Manager
|
Purchase and Sale of Fund Shares
|
|
Class A and C shares
|
Class Y shares
|
|
Minimum Initial Investment
|
$1,000
|
$5,000,000
|
|
Minimum Additional Investment
|
$25
|
$25
|
You may sell (redeem) shares each day the New York Stock Exchange is open. Your transaction
may be placed through your dealer or financial adviser, by writing to Davis Funds, P.O. Box 219197, Kansas City,
MO 64121-9197, telephoning 1-800-279-0279 or accessing the Fund’s website, www.davisfunds.com. Certain financial intermediaries may impose different restrictions than those shown above.
Tax Information
If the Fund earns income or realizes capital gains, it intends to make distributions
that may be taxed as ordinary income, qualified dividend income or capital gains by federal, state and local authorities.
Payments to Broker-Dealers and Other Financial Intermediaries
If you purchase the Fund through a broker-dealer or other financial intermediary (such
as a bank), the Fund and its related companies may pay the intermediary for the sale of Fund shares and related services.
These payments may create a conflict of interest by influencing the broker-dealer or other intermediary and your salesperson
to recommend the Fund over another investment. Ask your salesperson or visit your financial intermediary’s website for more information.
Prospectus | Davis Funds | 22
The Fund seeks as high a level of current income as is consistent with the principle
of preservation of capital and maintenance of liquidity.
This table describes the fees and expenses that you may pay if you buy, hold, and sell shares of the Fund.
| Shareholder Fees (fees paid directly from your investment) | Class A, C, and Y shares |
| Maximum Sales Charge (Load) Imposed on Purchases (as a percentage of offering price) | |
| Maximum Deferred Sales Charge (Load) (as a percentage of the lesser of the net asset value of the shares redeemed or the total cost of such shares) | |
| Redemption Fee (as a percentage of total redemption proceeds) | |
| Annual Fund Operating Expenses (expenses that you pay each year as a percentage of the value of your investment) | Class A, C, and Y shares |
| Management Fees | |
| Distribution and/or Service (12b-1) Fees | |
| Other Expenses | |
| Total Annual Fund Operating Expenses | |
| Less Fee Waiver and/or Expense Reimbursement* | |
| Total Annual Fund Operating Expenses After Fee Waivers and/or Expense Reimbursement | |
*
|
|
1 Year
|
3 Years
|
5 Years
|
10 Years
|
|
Class A, C, and Y shares
|
$ |
$ |
$ |
$ |
The Fund is a money market fund that seeks to preserve the value of your investment at $1.00 per share. There can be no guarantee that the Fund will be successful in maintaining a $1.00 share price.
The Fund invests exclusively in U.S. Treasury securities, U.S. Government agency securities, U.S. Government agency mortgage securities (collectively “U.S. Government Securities”) and repurchase agreements collateralized by U.S. Government Securities. As a government money market fund, the Fund normally invests at least 99.5% of its total assets in U. S. Government Securities, repurchase agreements collateralized by cash and/or U.S. Government Securities, and cash. The Fund seeks to maintain liquidity and preserve capital by carefully monitoring the maturity of its investments. The Fund’s portfolio maintains a dollar-weighted average maturity of sixty days or less.
Principal Risks of Investing in the Fund
The principal risks of investing in the Fund are:
Changes in Debt Rating Risk. If a rating agency gives a fixed income security or its issuer a low rating, the value of the security will decline because investors will demand a higher rate of return.
Credit Risk. The issuer of a fixed income security (potentially even the U.S. Government) may be unable to make timely payments of interest and principal.
Fees and Expenses Risk. The Fund may not earn enough through income to offset the operating expenses of the Fund. All mutual funds incur operating fees and expenses. Fees and expenses reduce the return that a shareholder may earn by investing in a fund, even when a fund has favorable performance. A low-return environment, or a bear market, increases the risk that a shareholder may lose money.
Prospectus | Davis Funds | 23
Inflation Risk. Also called purchasing power risk, this is the chance that the cash flows from an investment won’t be worth as much in the future because of changes in purchasing power due to inflation.
Interest Rate Risk. Interest rate increases can cause the price of a debt security to decrease.
Repurchase Agreement Risk. The repurchase obligation of the seller is, in effect, secured by the underlying securities. In the event of a bankruptcy or other default of a seller of a repurchase agreement, the Fund could experience both delays in liquidating the underlying securities and losses.
U.S. Government Securities Risk. Generally, government securities, like other debt securities, are interest rate sensitive. During periods of falling interest rates, the values of debt securities held by the Fund generally rise. Conversely, during periods of rising interest rates, the values of such securities generally decline. Changes by recognized rating services in their ratings of debt securities and changes in the ability of an issuer to make payments of interest and principal also will affect the value of these investments.
Variable Current Income Risk. The income that the Fund pays to investors is not stable.
Shareholder Concentration Risk. From time to time, a relatively large percentage (over 20%) of the Fund’s shares may be held by related shareholders. A large redemption by one or more of such shareholders may: (1) reduce the Fund’s liquidity, (2) increase the Fund’s transactions and transaction costs, (3) result in substantial capital gains distributions for shareholders, and (4) increase the Fund’s ongoing operating expenses, which could negatively impact the remaining shareholders of the Fund.
You could lose money by investing in the Fund. Although the Fund seeks to preserve the value of your investment at $1.00 per share, it cannot guarantee it will do so. An investment in the Fund is not insured or guaranteed by the Federal Deposit Insurance Corporation or any other government agency. The Fund’s sponsor has no legal obligation to provide financial support to the Fund, and you should not expect that the sponsor will provide financial support to the Fund at any time.
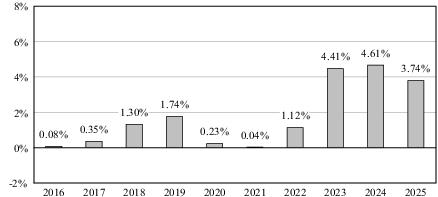
| | Returns | Period Ending |
| Quarter | | |
| Quarter | | |
| | | |
| Average Annual Total Returns (For the periods ended December 31, 2025, with maximum sales charge) | Past 1 Year | Past 5 Years | Past 10 Years |
| All Share Classes | 3.74% | 2.77% | 1.75% |
| Yield for Class A Shares (For the period ended December 31, 2025) | |
| 7-Day Yield: | |
You can obtain the Fund’s most recent 7-day Yield by calling Investor Services toll-free at 1-800-279-0279, Monday through Friday, from 9 a.m. to 6 p.m. Eastern Time.
Management
Investment Adviser. Davis Selected Advisers, L.P. serves as the Fund’s investment adviser.
Sub-Adviser. Davis Selected Advisers–NY, Inc., a wholly owned subsidiary of the Adviser, serves as the Fund’s sub-adviser.
|
Portfolio Manager
|
Experience with this Fund
|
Primary Title with Investment Adviser or Sub-Adviser
|
|
Erik Jones
|
Since March 2026
|
Portfolio Manager
|
Prospectus | Davis Funds | 24
Purchase and Sale of Fund Shares
|
|
Class A and C shares
|
Class Y shares
|
|
Minimum Initial Investment
|
$1,000
|
$5,000,000
|
|
Minimum Additional Investment
|
$25
|
$25
|
You may sell (redeem) shares each day the New York Stock Exchange is open. Your transaction
may be placed through your dealer or financial adviser, by writing to Davis Funds, P.O. Box 219197, Kansas City,
MO 64121-9197, telephoning 1-800-279-0279 or accessing the Fund’s website, www.davisfunds.com. Certain financial intermediaries may impose different restrictions than those shown above.
Tax Information
Distributions (if any) may be taxed as ordinary income or capital gains by federal,
state and local authorities. Generally, the Fund does not distribute capital gains. Redemptions, including exchanges, will not
normally result in a capital gain or loss for federal or state income tax purposes.
Payments to Broker-Dealers and Other Financial Intermediaries
If you purchase the Fund through a broker-dealer or other financial intermediary (such
as a bank), the Fund and its related companies may pay the intermediary for the sale of Fund shares and related services.
These payments may create a conflict of interest by influencing the broker-dealer or other intermediary and your salesperson
to recommend the Fund over another investment. Ask your salesperson or visit your financial intermediary’s website for more information.
Prospectus | Davis Funds | 25
Additional Information About Investment Objectives, Principal Strategies, and Principal Risks
This prospectus contains important information about investing in the Funds. Please
read this prospectus carefully before you make any investment decisions. Additional information regarding the Funds is available
at davisfunds.com/resources/regulatory-documents.
Investment Objective
|
|
DFF
|
DOF
|
DREF
|
DBF
|
DGBF
|
DGMMF
|
|
Long-term growth of capital:
|
*
|
*
|
|
|
|
|
|
Total return through a combination of growth and income:
|
|
|
*
|
*
|
|
|
|
Current income:
|
|
|
|
|
*
|
|
|
Current income along with preservation of capital and liquidity:
|
|
|
|
|
|
*
|
The investment objectives of the Funds are not fundamental policies and may be changed
by the Board of Directors without a vote of shareholders. The Funds’ prospectus would be amended prior to any change in investment objective and shareholders would be provided at least 30 days’ notice before the change in investment objective was implemented.
Principal Investment Strategies
The principal investment strategies and risks for the Funds are described in more
detail above and below. The prospectus and statement of additional information (“SAI”) contain a number of investment strategies and risks that may be important to consider even though they are not principal investment strategies or principal risks
for the Funds. The prospectus also contains disclosure that describes Davis Advisors’ process for determining when the Funds may pursue a non-principal investment strategy.
Davis Financial Fund. Davis Advisors uses the Davis Investment Discipline to invest at least 80% of the Fund’s net assets, plus any borrowing for investment purposes, in securities issued by companies principally
engaged in the financial services sector. The Fund invests principally in common stocks (including indirect holdings
of common stock through Depositary Receipts). The Fund may invest in large, medium, or small companies without regard
to market capitalization and may invest in issuers in foreign countries, including countries with developed or emerging markets.
A company is principally engaged in financial services if it owns financial services-related
assets that constitute at least 50% of the value of all of its assets or if it derives at least 50% of its revenues from
providing financial services. Companies are classified by GICS (the Global Industry Classification Standard as developed by Morgan
Stanley Capital International and S&P Global to determine industry classification) based on their principal business
activity. Revenue is a key factor in determining a firm’s principal business activity. Companies with their principal business activity in one of the following areas are considered financial services firms: banks, thrifts & mortgage, specialized finance,
consumer finance, asset management & custody banks, investment banking & brokerage, diversified capital markets, financial
exchanges & data, mortgage REITs and insurance.
Davis Opportunity Fund. Davis Advisors uses the Davis Investment Discipline to invest the Fund’s portfolio principally in common stock (including indirect holdings of common stock through Depositary Receipts).
The Fund may invest in large, medium, or small companies without regard to market capitalization and may invest
in issuers in foreign countries, including countries with developed or emerging markets.
Davis Real Estate Fund. Davis Advisors uses the Davis Investment Discipline to invest at least 80% of the Fund’s net assets, plus any borrowing for investment purposes, in securities issued by companies principally
engaged in the real estate industry. The Fund invests principally in common stocks of domestic and foreign companies (including
indirect holdings of common stock through Depositary Receipts).
A company is principally engaged in the real estate industry if it owns real estate
or real estate-related assets that constitute at least 50% of the value of all of its assets or if it derives at least 50% of its revenues
or net profits from owning, financing, developing, managing or selling real estate, or from offering products or services
that are related to real estate. Issuers of real estate securities include real estate investment trusts (REITs), brokers, developers,
lenders and companies with substantial real estate holdings, such as paper, lumber, hotel, and entertainment companies. Most of the Fund’s real estate securities are, and will likely continue to be, interests in publicly traded REITs. REITs pool investors’ funds to make real estate-related investments, such as buying interests in income-producing property or making loans
to real estate developers.
Davis Balanced Fund. Davis Advisors uses the Davis Investment Discipline to invest the Fund’s assets in a balanced portfolio of common stock, preferred stock, and bonds. The Fund may also hold cash. The Fund
may invest in large, medium, or small companies without regard to market capitalization and may invest in securities issued
by either domestic or foreign companies.
The Fund’s investments in common stock issued by companies across the spectrum of market capitalizations are purchased primarily for their growth potential. Fixed income securities, consisting of both
investment grade and high-yield, high-risk debt securities (“junk bonds”), are purchased both for current income and to provide diversification.
Prospectus | Davis Funds | 26
The Fund may invest in high-yield, high-risk debt securities rated BB or lower by Standard & Poor’s Corporation (“S&P”) or Ba or lower by Moody’s Investors Service (“Moody’s”) or unrated securities. Securities rated BB or lower by S&P and Ba or lower by Moody’s are referred to in the financial community as “junk bonds” and may include D-rated securities of issuers in default. The Fund will not purchase unrated debt securities or debt securities rated
BB or Ba or lower if the securities are in default at the time of purchase or if such purchase would then cause more than 20% of the Fund’s net assets to be invested in such lower-rated securities. The Fund may continue to retain a security whose rating
has changed, that becomes unrated, or if the security has defaulted.
Davis Government Bond Fund. The Fund invests exclusively in U.S. Treasury securities, U.S. Government agency
securities, U.S. Government agency mortgage securities (collectively “U.S. Government Securities”), and repurchase agreements collateralized by U.S. Government Securities. Under normal circumstances, the Fund’s portfolio will maintain a weighted average maturity of three years or less.
The Fund does not attempt to maintain a fixed net asset value per share. Fluctuations
in portfolio values and therefore fluctuations in the net asset value of its shares are more likely to be greater when the Fund’s average portfolio maturity is longer. The portfolio is likely to be principally invested in securities with short-term
maturities in periods when the Adviser deems a more defensive position is advisable. The Fund may invest a substantial portion
of its assets in short-term money market instruments, including repurchase agreements.
Davis Government Money Market Fund. The Fund is a money market fund that seeks to preserve the value of your investment at $1.00 per share. There can be no guarantee that the Fund will be successful
in maintaining a $1.00 share price.
The Fund invests exclusively in U.S. Treasury securities, U.S. Government agency securities,
U.S. Government agency mortgage securities (collectively “U.S. Government Securities”), and repurchase agreements collateralized by U.S. Government Securities. As a government money market fund, the Fund normally invests
at least 99.5% of its total assets in U.S. Government Securities, repurchase agreements collateralized by cash and/or
U.S. Government Securities, and cash. The Fund seeks to maintain liquidity and preserve capital by carefully monitoring the maturity of its investments. The Fund’s portfolio maintains a dollar-weighted average maturity of sixty days or less.
Principal Risks of Investing in the Funds
If you buy shares of the Funds, you may lose some or all of the money that you invest.
The investment return and principal value of an investment in the Funds will fluctuate so that an investor’s shares, when redeemed, may be worth more or less than their original cost. The likelihood of loss may be greater if you invest for a shorter
period of time. This section describes the principal risks (but not the only risks) that could cause the value of your investment
in the Funds to decline and which could prevent them from achieving their stated investment objectives.
The principal risks of investing in the Funds, listed alphabetically, include:
|
|
DFF
|
DOF
|
DREF
|
DBF
|
DGBF
|
DGMMF
|
|
Equity Risks
|
|
|
|
|
|
|
|
Common Stock Risk
|
*
|
*
|
*
|
*
|
|
|
|
Depositary Receipts Risk
|
*
|
*
|
|
*
|
|
|
|
Emerging Market Risk
|
*
|
*
|
|
|
|
|
|
Financial Services Risk
|
*
|
|
|
|
|
|
|
Focused Portfolio Risk
|
*
|
|
|
|
|
|
|
Foreign Country Risk
|
*
|
*
|
|
*
|
|
|
|
Foreign Currency Risk
|
*
|
*
|
|
|
|
|
|
Headline Risk
|
*
|
*
|
*
|
*
|
|
|
|
Interest Rate Sensitivity Risk
|
*
|
|
|
|
|
|
|
Large-Capitalization Companies Risk
|
*
|
*
|
*
|
*
|
|
|
|
Manager Risk
|
*
|
*
|
*
|
*
|
|
|
|
Mid- and Small-Capitalization Companies Risk
|
*
|
*
|
*
|
*
|
|
|
|
Preferred Stock Risk
|
|
|
|
*
|
|
|
|
Real Estate Risk
|
|
|
*
|
|
|
|
|
Stock Market Risk
|
*
|
*
|
*
|
*
|
|
|
|
Shareholder Concentration Risk
|
|
|
|
*
|
|
*
|
|
Debt Risks
|
|
|
|
|
|
|
|
Bonds and Other Debt Securities Risk
|
|
|
|
*
|
|
|
|
Changes in Debt Rating Risk
|
|
|
|
*
|
*
|
*
|
|
Credit Risk
|
*
|
|
|
*
|
*
|
*
|
|
Extension and Prepayment Risk
|
|
|
|
*
|
*
|
|
|
High-Yield, High-Risk Debt Securities Risk
|
|
|
|
*
|
|
|
|
Inflation Risk
|
|
|
|
|
*
|
*
|
|
Interest Rate Risk
|
|
|
|
*
|
*
|
*
|
|
Repurchase Agreements Risk
|
|
|
|
|
*
|
*
|
|
U.S. Government Securities Risk
|
|
|
|
|
*
|
*
|
|
Variable Current Income Risk
|
|
|
*
|
*
|
*
|
*
|
Prospectus | Davis Funds | 27
|
|
DFF
|
DOF
|
DREF
|
DBF
|
DGBF
|
DGMMF
|
|
Other Risks
|
|
|
|
|
|
|
|
Fees and Expenses Risk
|
*
|
*
|
*
|
*
|
*
|
*
|
Equity Risks
Common Stock Risk. Common stock represents ownership positions in companies. The prices of common stock
fluctuate based on changes in the financial condition of their issuers and on market and economic
conditions. Events that have a negative impact on a business probably will be reflected in a decline in the price
of its common stock. Furthermore, when the total value of the stock market declines, most common stocks, even those issued by
strong companies, likely will decline in value. Common stock is generally subordinate to an issuer’s other securities, including preferred, convertible, and debt securities.
Depositary Receipts Risk. Securities of a foreign company may involve investing in Depositary Receipts, which
include American Depositary Receipts, European Depositary Receipts, and Global Depositary
Receipts, which are certificates evidencing ownership of shares of a foreign issuer. These certificates, which may
be sponsored or unsponsored, are issued by depositary banks and, generally, trade on an established market in the United States
or elsewhere. The underlying shares are held in trust by a custodian bank or similar financial institution in the issuer’s home country. The depositary bank may not have physical custody of the underlying securities at all times and may charge fees for
various services, including forwarding dividends, interest, and corporate actions. Depositary Receipts are alternatives to
directly purchasing the underlying foreign securities in their national markets and currencies. However, Depositary Receipts
continue to be subject to many of the risks associated with investing directly in foreign securities. These risks include foreign
exchange risk as well as the political and economic risks of the underlying issuer’s country. Depositary Receipts may trade at a discount or a premium to the underlying security and may be less liquid than the underlying securities listed on an exchange.
Emerging Market Risk. Securities of issuers in emerging and developing markets may offer special investment
opportunities but present risks not found in more mature markets. Those securities may be more difficult
to sell at an acceptable price and their prices may be more volatile than securities of issuers in more developed markets.
For example, Chinese securities may be subject to increased volatility and pricing anomalies resulting from governmental
influence, a lack of publicly available information, and/or political and social instability. Settlements of trades may be
subject to greater delays so that the Funds might not receive the proceeds of a sale of a security on a timely basis. In unusual
situations, it may not be possible to repatriate sales proceeds in a timely fashion. These investments may be very speculative.
Emerging markets might have less developed trading markets and exchanges. These countries
may have less developed legal and accounting systems and investments may be subject to greater risks of government
restrictions on withdrawing the sale proceeds of securities from the country. Companies operating in emerging markets may
not be subject to U.S. prohibitions against doing business with countries that are state sponsors of terrorism. Economies
of developing countries may be more dependent on relatively few industries that may be highly vulnerable to local and
global changes. Governments may be more unstable and present greater risks of nationalization, expropriation, or restrictions
on foreign ownership of stocks of local companies.
As of March 31, 2026, the emerging market countries were: Bahrain, Bangladesh, Benin,
Bermuda, Brazil, Burkina Faso, Chile, China, Colombia, Croatia, Czech Republic, Egypt, Estonia, Greece, Guinea-Bissau,
Hungary, Iceland, India, Indonesia, Ivory Coast, Jordan, Kazakhstan, Kenya, Korea, Kuwait, Latvia, Lithuania, Malaysia,
Mali, Mauritius, Mexico, Morocco, Niger, Oman, Pakistan, Peru, Philippines, Poland, Qatar, Romania, Saudi Arabia, Senegal,
Serbia, Slovenia, South Africa, Sri Lanka, Taiwan, Thailand, Togo, Tunisia, Turkey, United Arab Emirates, and Vietnam.
Additionally, certain countries that are not on this list may be included at Davis Advisor’s discretion.
Financial Services Risk. A company is “principally engaged” in financial services if it owns financial services related assets constituting at least 50% of the total value of its assets, or if at least 50% of
its revenues are derived from its provision of financial services. The financial services sector consists of several different industries
that behave differently in different economic and market environments, including banking, insurance, and securities brokerage
houses. Companies in the financial services sector include commercial banks, industrial banks, savings institutions,
finance companies, diversified financial services companies, investment banking firms, securities brokerage houses,
investment advisory companies, leasing companies, insurance companies, and companies providing similar services. Due to the
wide variety of companies in the financial services sector, they may react in different ways to changes in economic
and market conditions.
Risks of investing in the financial services sector include: (1) systemic risk: factors
outside the control of a particular financial institution — like the failure of another, significant financial institution or material disruptions to the credit markets — may adversely affect the ability of the financial institution to operate normally or may
impair its financial condition; (2) regulatory actions: financial services companies may suffer setbacks if regulators change the
rules under which they operate; (3) changes in interest rates: unstable and/or rising interest rates may have a disproportionate
effect on companies in the financial services sector; (4) non-diversified loan portfolios: financial services companies, whose securities
a fund purchases, may themselves have concentrated portfolios, such as a high level of loans to real estate developers,
which makes them vulnerable to economic conditions that affect that industry; (5) credit: financial services companies may
have exposure to investments or agreements, which, under certain circumstances, may lead to losses, e.g., sub-prime loans; and
(6) competition: the financial services sector has become increasingly competitive.
Prospectus | Davis Funds | 28
Banking. Commercial banks (including “money center” regional and community banks), savings and loan associations, and holding companies of the foregoing are especially subject to adverse effects of volatile
interest rates, concentrations of loans in particular industries or classifications (such as real estate, energy, or sub-prime
mortgages), and significant competition. The profitability of these businesses is to a significant degree dependent on the
availability and cost of capital funds. Economic conditions in the real estate market may have a particularly strong effect
on certain banks and savings associations. Commercial banks and savings associations are subject to extensive federal and, in
many instances, state regulation. Neither such extensive regulation nor the federal insurance of deposits ensures the solvency
or profitability of companies in this industry and there is no assurance against losses in securities issued by such companies.
Insurance. Insurance companies are particularly subject to government regulation and rate setting,
potential anti-trust and tax law changes, and industry-wide pricing and competition cycles. Property and casualty
insurance companies also may be affected by weather, terrorism, long-term climate changes, and other catastrophes.
Life and health insurance companies may be affected by mortality and morbidity rates, including the effects of epidemics.
Individual insurance companies may be exposed to reserve inadequacies, problems in investment portfolios (e.g., real estate or “junk” bond holdings), and failures of reinsurance carriers.
Other Financial Services Companies. Many of the investment considerations discussed in connection with banks and insurance companies also apply to other financial services companies. These companies
are subject to extensive regulation, rapid business changes and volatile performance dependent on the availability and
cost of capital, and prevailing interest rates and significant competition. General economic conditions significantly affect these
companies. Credit and other losses resulting from the financial difficulty of borrowers or other third parties have a
potentially adverse effect on companies in this industry. Investment banking, securities brokerage, and investment advisory companies
are particularly subject to government regulation and the risks inherent in securities trading and underwriting activities.
Other Regulatory Limitations. Regulations of the Securities and Exchange Commission (“SEC”) impose limits on: (1) investments in the securities of companies that derive more than 15% of their gross
revenues from the securities or investment management business (although there are exceptions, the Fund is prohibited from investing
more than 5% of its total assets in a single company that derives more than 15% of its gross revenues from the securities
or investment management business); and (2) investments in insurance companies. The Fund, generally, is prohibited from
owning more than 10% of the outstanding voting securities of an insurance company.
Focused Portfolio Risk. Funds that invest in a limited number of companies may have more risk because changes
in the value of a single security may have a more significant effect, either negative or positive, on the value of the Fund’s total portfolio.
A Fund may be classified as a “non-diversified” fund under the 1940 Act, which means that it is permitted to invest its assets in a more limited number of issuers than “diversified” investment companies. A diversified investment company may not, with respect to 75% of its total assets, invest more than 5% of its total assets in the
securities of any one issuer (other than U.S. Government securities and securities of other investment companies) and may not
own more than 10% of the outstanding voting securities of any one issuer. While a Fund may be a non-diversified investment
company, and therefore not subject to the statutory diversification requirements discussed above, the Fund may still intend
to diversify its assets to the extent necessary to qualify for tax treatment as a regulated investment company under the
Internal Revenue Code of 1986, as amended (the “Internal Revenue Code”).
At any given point in time, a diversified fund may not meet the diversification test
outlined above due to appreciation in its portfolio holdings. In such case, the Fund is not required to sell portfolio holdings
to meet the diversification test.
The diversification standards under the Internal Revenue Code require that a fund
diversify its holdings so that, at the end of each fiscal quarter, (1) at least 50% of the market value of a fund’s assets are represented by cash, U.S. Government securities, securities of other regulated investment companies, and other securities limited with
respect to any one issuer to an amount not greater than 5% of a fund’s assets and 10% of the outstanding voting securities of such issuer, and (2) not more than 25% of the value of a fund’s assets is invested in the securities of any one issuer (other than U.S. Government securities and the securities of other regulated investment companies), or of two or more issuers which
a fund controls (i.e., owns, directly or indirectly, 20% of the voting stock) and which are determined to be engaged in the
same or similar trades or businesses or related trades or businesses.
Foreign Country Risk. Foreign companies may issue both equity and fixed income securities. A company may
be classified as either “domestic” or “foreign” depending upon which factors the Adviser considers most important for a given company. Factors that the Adviser considers in classifying a company as domestic or foreign
include: (1) whether the company is organized under the laws of the United States or a foreign country; (2) whether the company’s securities principally trade in securities markets outside of the United States; (3) the source of the majority of the company’s revenues or profits; and (4) the location of the majority of the company’s assets. The Adviser generally follows the country classification indicated by a third-party service provider but may use a different country classification if the Adviser’s analysis of the four factors provided above, or other factors that the Adviser deems relevant, indicate that a different
country classification is more appropriate. Foreign country risk can be more focused on factors concerning specific countries
or geographic areas when the Funds' holdings are more focused in these countries or geographic areas.
The Funds may invest a significant portion of their assets in securities issued by
companies operating, incorporated, or principally traded in foreign countries. Investing in foreign countries involves risks
that may cause the Funds' performance to
Prospectus | Davis Funds | 29
be more volatile than it would be if the Funds invested solely in the United States.
Foreign economies may not be as strong or as diversified, foreign political systems may not be as stable and foreign financial
reporting standards may not be as rigorous as they are in the United States. In addition, foreign capital markets may not be
as well developed, so securities may be less liquid, transaction costs may be higher, and investments may be subject to more government
regulation. When the Funds invest in foreign securities, their operating expenses are likely to be higher than those
of an investment company investing exclusively in U.S. securities, since the custodial and certain other expenses associated
with foreign investments are expected to be higher.
Foreign Currency Risk. Securities issued by foreign companies in foreign markets are frequently denominated
in foreign currencies. The change in value of a foreign currency against the U.S. dollar will
result in a change in the U.S. dollar value of securities denominated in that foreign currency. For example, when the Funds hold
a security that is denominated in a foreign currency, a decline of that foreign currency against the U.S. dollar would generally
cause the value of the Funds' shares to decline. The Funds may, but generally do not, hedge their currency risk.
Headline Risk. Davis Advisors seeks to acquire companies with durable business models that can be
purchased at attractive valuations relative to what Davis Advisors believes to be the companies’ intrinsic values. Davis Advisors may make such investments when a company becomes the center of controversy after receiving adverse
media attention. The company may be involved in litigation, the company’s financial reports or corporate governance may be challenged, the company’s public filings may disclose a weakness in internal controls, greater government regulation
may be contemplated, or other adverse events may threaten the company’s future. While Davis Advisors researches companies subject to such contingencies, it cannot be correct every time and the company’s stock may never recover or may become worthless.
Interest Rate Sensitivity Risk. Interest rates may have a powerful influence on the earnings of financial institutions.
Large-Capitalization Companies Risk. Companies with $10 billion or more in market capitalization are considered by the
Adviser to be large-capitalization companies. Large-capitalization companies generally
experience slower rates of growth in earnings per share than do mid- and small-capitalization companies.
Manager Risk. Poor security selection or focus on securities in a particular sector, category,
or group of companies may cause the Funds to underperform relevant benchmarks or other funds with a similar investment
objective. Even if the Adviser implements the intended investment strategies, the implementation of the strategies
may be unsuccessful in achieving the Funds' investment objectives.
Mid- and Small-Capitalization Companies Risk. Companies with less than $10 billion in market capitalization are considered by the Adviser to be mid- or small-capitalization companies. Investing in mid- and
small-capitalization companies may be more risky than investing in large-capitalization companies. Smaller companies typically
have more limited product lines, markets, and financial resources than larger companies and their securities may trade
less frequently and in more limited volume than those of larger, more mature companies. Securities of these companies
may be subject to volatility in their prices. They may have a limited trading market, which may adversely affect the Funds' ability
to dispose of them and can reduce the price the Funds might be able to obtain for them. Other investors that own a security
issued by a mid- or small-capitalization company for whom there is limited liquidity might trade the security when the Funds
are attempting to dispose of their holdings in that security. In that case, the Funds might receive a lower price for
their holdings than otherwise might be obtained. Mid- and small-capitalization companies also may be unseasoned. These include
companies that have been in operation for less than three years, including the operations of any predecessors.
Preferred Stock Risk. Preferred stock is a form of equity security and is generally ranked behind an issuer’s debt securities in claims for dividends and assets of an issuer in a liquidation or bankruptcy. An adverse
event may have a negative impact on a company and could result in a decline in the price of its preferred stock.
Real Estate Risk. Real estate securities are issued by companies that have at least 50% of the value
of their assets, gross income, or net profits attributable to ownership, financing, construction, management,
or sale of real estate, or to products or services that are related to real estate or the real estate industry. The Fund does
not invest directly in real estate. Real estate companies include real estate investment trusts (“REITs”) or other securitized real estate investments, brokers, developers, lenders, and companies with substantial real estate holdings such as paper, lumber,
hotel, and entertainment companies. REITs pool investors’ funds for investment primarily in income-producing real estate or real estate-related loans or interests. A REIT is not taxed on income distributed to shareholders if it complies with various requirements
relating to its organization, ownership, assets, and income, and with the requirement that it distribute to its
shareholders at least 90% of its taxable income (other than net capital gains) each taxable year. REITs generally can be classified
as equity REITs, mortgage REITs and hybrid REITs. Equity REITs invest the majority of their assets directly in real property
and derive their income primarily from rents. Equity REITs also can realize capital gains by selling property that has appreciated
in value. Mortgage REITs invest the majority of their assets in real estate mortgages and derive their income primarily
from interest payments. Hybrid REITs combine the characteristics of both equity REITs and mortgage REITs. To the extent
that the management fees paid to a REIT are for the same or similar services as the management fees paid by the Fund, there
will be a layering of fees, which would increase expenses and decrease returns. Securities issued by REITs may trade less
frequently and be less liquid than common stock issued by other companies.
Real estate securities, including REITs, are subject to risks associated with the
direct ownership of real estate including: (1) declines in property values because of changes in the economy or the surrounding area
or because a particular region has
Prospectus | Davis Funds | 30
become less appealing to tenants; (2) increases in property taxes, operating expenses,
interest rates, or competition; (3) overbuilding; (4) changes in zoning laws; (5) losses from casualty or condemnation;
(6) declines in the value of real estate and risks related to general and local economic conditions; (7) uninsured casualties or
condemnation losses; (8) fluctuations in rental income; (9) changes in neighborhood values; (10) the appeal of properties to
tenants; (11) increases in interest rates; and (12) access to the credit markets. The Fund also could be subject to such risks by
reason of direct ownership as a result of a default on a debt security it may own.
Equity REITs may be affected by changes in the value of the underlying property owned
by the trusts, while mortgage REITs may be affected by the quality of credit extended. Equity and mortgage REITs are dependent
on management skill, may not be diversified, and are subject to project financing risks. REITs also are subject to
heavy cash flow dependency, defaults by borrowers, self-liquidation, and the possibility of failing to qualify for the favorable
federal income tax treatment generally available to REITs under the Internal Revenue Code, and failing to maintain exemption
from registration under the 1940 Act. Changes in interest rates also may affect the value of the debt securities in the Fund’s portfolio. By investing in REITs indirectly through the Fund, a shareholder will bear not only his or her proportionate
share of the expense of the Fund but also, indirectly, similar expenses of the REITs, including compensation of management. Some
real estate securities may be rated less than investment grade by rating services. Such securities may be subject to the
risks of high-yield, high-risk securities discussed below.
Shareholder Concentration Risk. From time to time, a relatively large percentage (over 20%) of the Funds' shares may
be held by related shareholders. A large redemption by one or more of such shareholders
may: (1) reduce the Funds' liquidity, (2) increase the Funds' transactions and transaction costs, (3) result in substantial
capital gains distributions for shareholders, and (4) increase the Funds' ongoing operating expenses, which could negatively impact
the remaining shareholders of the Funds.
Stock Market Risk. Stock markets tend to move in cycles, with periods of rising prices and periods of
falling prices, including the possibility of sharp declines. As an example, U.S. and international markets have
experienced volatility in recent months and years due to a number of economic, political, and global macro factors including
the impact of the coronavirus (COVID-19) as a global pandemic, uncertainties regarding interest rates, rising inflation, trade
tensions, and the threat of tariffs and/or retaliatory tariffs imposed by the U.S. and other countries. While COVID-19 is no
longer a global pandemic as of 2023, the recovery from COVID-19 may last for a prolonged period of time. In addition, as a
result of continuing political tensions and armed conflicts, including the war between Ukraine and Russia, the U.S. and the European
Union imposed sanctions on certain Russian individuals and companies, including certain financial institutions,
and have limited certain exports and imports to and from Russia. The war may continue to contribute to market volatility.
Further, the conflicts in the Middle East may lead to overall economic uncertainty and negative impacts on the global economy
and major financial markets. These developments as well as other events could result in further market volatility and
negatively affect financial asset prices, the liquidity of certain securities, and the normal operations of securities exchanges
and other markets. Continuing market volatility as a result of recent market conditions, U.S. political developments, or
other events may have an adverse effect on the performance of the Funds.
Debt Risks
Bonds and Other Debt Securities Risk. Bonds and other debt securities may be purchased by a Fund if the Adviser believes
that such investments are consistent with the Fund’s investment strategies, may contribute to the achievement of the Fund’s investment objective, and will not violate any of the Fund’s investment restrictions. The U.S. Government, corporations, and other issuers sell bonds and other debt securities to borrow money. Issuers pay investors
interest and generally must repay the amount borrowed at maturity. Some debt securities, such as zero-coupon bonds, do not
pay current interest but are purchased at discounts from their face values. The prices of debt securities fluctuate depending
on such factors as interest rates, credit quality, and maturity.
Bonds and other debt securities, generally, are subject to credit risk and interest
rate risk. While debt securities issued by the U.S. Treasury are generally considered free of credit risk, debt issued by agencies
and corporations all entail some level of credit risk. Investment grade debt securities have less credit risk than do high-yield,
high-risk debt securities. Credit risk is described more fully in the section titled “High-Yield, High-Risk Debt Securities.”
Bonds and other debt securities, generally, are interest rate sensitive. During periods
of falling interest rates, the values of debt securities held by a Fund generally rise. Conversely, during periods of rising interest
rates, the values of such securities generally decline. Changes by recognized rating services in their ratings of debt
securities and changes in the ability of an issuer to make payments of interest and principal also will affect the value of these
investments.
Changes in Debt Rating Risk. If a rating agency gives a fixed income security a low rating, the value of the security
will decline because investors will demand a higher rate of return.
Credit Risk. Like any borrower, the issuer of a fixed income security may be unable to make timely
payments of interest and principal. If the issuer is unable to make payments in a timely fashion, the value
of the security will decline and may become worthless. Financial institutions are often highly leveraged and may not be able to
make timely payments of interest and principal. Even U.S. Government Securities are subject to credit risk.
Extension and Prepayment Risk. Market prices of the mortgage-backed securities and collateralized mortgage obligations
that a Fund owns are affected by how quickly borrowers elect to prepay the mortgages
underlying the securities. Changes in
Prospectus | Davis Funds | 31
market interest rates affect borrowers’ decisions about whether to prepay their mortgages. Rising interest rates lead to extension risk, which occurs when borrowers maintain their existing mortgages until
they come due instead of choosing to prepay them. Falling interest rates lead to prepayment risk which occurs when borrowers
prepay their mortgages more quickly than usual so that they can refinance at a lower rate. A government agency that has
the right to call (prepay) a fixed-rate security may respond the same way. The pace at which borrowers prepay affects the
yield and the cash flow to holders of securities and the market value of those securities.
High-Yield, High-Risk Debt Securities Risk. The real estate securities, convertible securities, bonds, and other debt securities
in which a Fund may invest may include high-yield, high-risk debt securities rated BB or lower by Standard & Poor’s Corporation (“S&P”) or Ba or lower by Moody’s Investors Service (“Moody’s”) or unrated securities. Securities rated BB or lower by S&P and Ba or lower by Moody’s are referred to in the financial community as “junk bonds” and may include D-rated securities of issuers in default. See Appendix A for a more detailed description
of the rating system. Ratings assigned by credit agencies do not evaluate market risks. The Adviser considers the ratings assigned by S&P or Moody’s as one of several factors in its independent credit analysis of issuers. A description of each debt
security quality category is set forth in Appendix A titled “Quality Ratings of Debt Securities.” The ratings of S&P and Moody’s represent their opinions as to the quality of the securities that they undertake to rate. It should be emphasized, however,
that ratings are relative and subjective and are not absolute standards of quality. There is no assurance that any rating will
not change.
A Fund will not purchase unrated debt securities or debt securities rated BB or Ba or lower (“Junk Bonds”) if the securities are in default at the time of purchase or if such purchase would then cause more than 20% of the Fund’s net assets to be invested in such lower-rated securities. A Fund may continue to retain a security whose rating
has changed, become unrated, or if the security has defaulted.
High-yield, high-risk debt securities, whether or not convertible into common stock,
usually involve increased risk as to payment of principal and interest. Issuers of such securities may be highly leveraged
and may not have traditional methods of financing available to them. Therefore, the risks associated with acquiring the securities
of such issuers generally are greater than is the case with higher-rated securities. For example, during an economic downturn
or a sustained period of rising interest rates, issuers of high-yield, high-risk debt securities may be more likely to experience
financial stress, especially if such issuers are highly leveraged. During such periods, such issuers may not have sufficient
revenues to meet their principal and interest payment obligations. The issuer’s ability to service its debt obligations also may be adversely affected by specific issuer developments, or the issuer’s inability to meet specific projected business forecasts or the unavailability of additional financing. The risk of loss due to default by the issuer is significantly greater
for the holders of high-yield, high-risk debt securities because such securities may be unsecured and may be subordinated to other
creditors of the issuer.
High-yield, high-risk debt securities are subject to greater price volatility than
higher-rated securities, tend to decline in price more steeply than higher-rated securities in periods of economic difficulty or accelerating
interest rates, and are subject to greater risk of non-payment in adverse economic times. There may be a thin trading
market for such securities which may have an adverse impact on market price and the ability of the Fund to dispose of particular
issues and may cause the Fund to incur special securities’ registration responsibilities, liabilities and costs, and liquidity and valuation difficulties. Unexpected net redemptions may force the Fund to sell high-yield, high-risk debt securities without
regard to investment merit, thereby possibly reducing return rates. Such securities may be subject to redemptions or call
provisions, which, if exercised when investment rates are declining, could result in the replacement of such securities
with lower-yielding securities, resulting in a decreased return. To the extent that the Fund invests in debt securities that are
original issue discount, zero-coupon, pay-in-kind, or deferred interest bonds, the Fund may have taxable interest income greater than
the cash actually received on these issues. In order to avoid taxation at the Fund level, the Fund may have to sell portfolio
securities to meet distribution requirements.
The market values of high-yield, high-risk debt securities tend to reflect individual
corporate developments to a greater extent than higher-rated securities, which react primarily to fluctuations in the general
level of interest rates. Lower-rated securities also tend to be more sensitive to economic and industry conditions than higher-rated
securities. Adverse publicity and investor perceptions, whether or not based on fundamental analysis regarding individual lower-rated
debt securities, may result in reduced prices for such securities. If the negative factors such as these adversely
impact the market value of high-yield, high-risk debt securities and the Fund holds such securities, the Fund’s net asset value will be adversely affected.
A Fund may have difficulty disposing of certain high-yield, high-risk debt securities
because there may be a thin trading market for such debt securities. Because not all dealers maintain markets in all high-yield,
high-risk debt securities, the Fund anticipates that such debt securities could be sold only to a limited number of dealers
or institutional investors. The lack of a liquid secondary market may have an adverse impact on market price and the ability
to dispose of particular issues and also may make it more difficult to obtain accurate market quotations or valuations for purposes of valuing the Fund’s assets. Market quotations generally are available on many high-yield, high-risk debt securities
only from a limited number of dealers and may not necessarily represent firm bid prices of such dealers or prices for actual
sales. In addition, adverse publicity and investor perceptions may decrease the values and liquidity of high-yield, high-risk
debt securities regardless of a fundamental analysis of the investment merits of such debt securities. To the extent that the
Fund purchases illiquid or restricted debt securities, it may incur special securities’ registration responsibilities, liabilities and costs, and liquidity and valuation difficulties relating to such debt securities.
Prospectus | Davis Funds | 32
Debt securities may be subject to redemption or call provisions. If an issuer exercises
these provisions when investment rates are declining, the Fund will be likely to replace such debt securities with lower-yielding
debt securities, resulting in decreased returns. Zero-coupon, pay-in-kind, and deferred interest bonds involve additional
special considerations. Zero-coupon bonds are debt obligations that do not entitle the holder to any periodic payments of interest
prior to maturity or a specified cash payment date when the securities begin paying current interest (the “cash payment date”) and therefore are issued and traded at discounts from their face amounts or par value. The market prices of zero-coupon
securities generally are more volatile than the market prices of securities that pay interest periodically and are likely to respond
to changes in interest rates to a greater degree than securities paying interest currently with similar maturities and credit
quality. Pay-in-kind bonds pay interest in the form of other securities rather than cash. Deferred interest bonds defer the payment
of interest to a later date. Zero-coupon, pay-in-kind or deferred interest bonds carry additional risk in that, unlike debt
securities that pay interest in cash throughout the period to maturity, the Fund will realize no cash until the cash payment date
unless a portion of such securities are sold. There is no assurance of the value or the liquidity of securities received from pay-in-kind
bonds. If the issuer defaults, the Fund may obtain no return at all on its investment. To the extent that the Fund invests
in debt securities that are original issue discount, zero-coupon, pay-in-kind or deferred interest bonds, the Fund may have taxable
interest income greater than the cash actually received on these issues. In order to distribute such income to avoid taxation,
the Fund may have to sell portfolio securities to meet its distribution requirements under circumstances that could be
adverse.
Federal tax legislation limits the tax advantages of issuing certain high-yield, high-risk
debt securities. This could have a materially adverse effect on the market for high-yield, high-risk debt securities.
Inflation Risk. Also called purchasing power risk, this is the chance that the cash flows from an investment won’t be worth as much in the future because of changes in purchasing power due to inflation.
Interest Rate Risk. Interest rate increases can cause the price of a debt security to decrease. If a
security pays a fixed interest rate, and market rates increase, the value of the fixed-rate security usually decline.
Interest rates may also have a powerful influence on the earnings of financial institutions.
Repurchase Agreements Risk. The Funds may enter into repurchase agreements. A repurchase agreement is an agreement
to purchase a security and to sell that security back to the original owner at an agreed-on
price. The resale price reflects the purchase price plus an agreed-on incremental amount, which is unrelated to the coupon
rate or maturity of the purchased security. The repurchase obligation of the seller is, in effect, secured by the underlying
securities. In the event of a bankruptcy or other default of a seller of a repurchase agreement, the Funds could experience
both delays in liquidating the underlying securities and losses, including: (1) possible decline in the value of the collateral
during the period, while a Fund seeks to enforce its rights thereto; (2) possible loss of all or a part of the income during
this period; and (3) expenses of enforcing its rights. Repurchase agreements are transactions in which the Funds purchase government
securities and simultaneously commit to resell them to the same counterparty at a future time and at a price reflecting
a market rate of interest. Income from repurchase agreements may not be exempt from state and local taxation. Repurchase
agreements often offer a higher yield than investments directly in government securities.
The Funds will enter into repurchase agreements only when the seller agrees that the
value of the underlying securities, including accrued interest (if any), will at all times be equal to or exceed the value
of the repurchase agreement. The Funds may enter into tri-party repurchase agreements in which a third-party custodian bank
ensures the timely and accurate exchange of cash and collateral. The majority of these transactions run from day–to-day and delivery pursuant to the resale typically occurs within one to seven days of the purchase. The Funds normally will not enter
into repurchase agreements maturing in more than seven days.
U.S. Government Securities Risk. U.S. Government securities are debt securities that are obligations of or guaranteed
by the U.S. Government, its agencies, or instrumentalities. There are two basic types of
U.S. Government securities: (1) direct obligations of the U.S. Treasury; and (2) obligations issued or guaranteed by an agency
or instrumentality of the U.S. Government, which includes the Federal Farm Credit System (“FFCS”), Student Loan Marketing Association (“SLMA”), Federal Home Loan Mortgage Corporation (“FHLMC”), Federal Home Loan Banks (“FHLB”), Federal National Mortgage Association (“FNMA”), and Government National Mortgage Association (“GNMA”). Some obligations issued or guaranteed by agencies or instrumentalities, such as those issued by GNMA, are fully guaranteed
by the U.S. Government. Others, such as FNMA bonds, rely on the assets and credit of the instrumentality with limited rights
to borrow from the U.S. Treasury. Other securities, such as obligations of the FHLB, are supported by more extensive
rights to borrow from the U.S. Treasury.
U.S. Government securities include mortgage-related securities issued by an agency
or instrumentality of the U.S. Government. GNMA certificates are mortgage-backed securities representing part
ownership of a pool of mortgage loans. These loans issued by lenders such as mortgage bankers, commercial banks, and
savings and loan associations are either insured by the Federal Housing Administration or guaranteed by the Veterans Administration. A “pool” or group of such mortgages is assembled and, after being approved by GNMA, is offered to investors
through securities dealers. Once approved by GNMA, the timely payment of interest and principal on each mortgage is guaranteed
by GNMA and backed by the full faith and credit of the U.S. Government. GNMA certificates differ from bonds in that
principal is paid back monthly by the borrower over the term of the loan rather than returned in a lump sum at maturity.
GNMA certificates are characterized as “pass-through” securities because both interest and principal payments (including prepayments) are passed through to the holder of such certificates.
Prospectus | Davis Funds | 33
As of September 7, 2008, the Federal Housing Finance Agency (“FHFA”) was appointed as the conservator of FHLMC and FNMA for an indefinite period. In accordance with the Federal Housing Finance Regulatory
Reform Act of 2008 and the Federal Housing Enterprises Financial Safety and Soundness Act of 1992, as conservator,
the FHFA will control and oversee these entities until the FHFA deems them financially sound and solvent. During the conservatorship, each entity’s obligations are expected to be paid in the normal course of business. Although no express guarantee
exists for the debt or mortgage-backed securities issued by these entities, the U.S. Department of the Treasury, through
a securities lending credit facility and a senior preferred stock purchase agreement, has attempted to enhance the ability
of the entities to meet their obligations.
Pools of mortgages also are issued or guaranteed by other agencies of the U.S. Government.
The average life of pass-through pools varies with the maturities of the underlying mortgage instruments. In addition, a pool’s term may be shortened or lengthened by unscheduled or early payment or by slower than expected prepayment of
principal and interest on the underlying mortgages. The occurrence of mortgage prepayments is affected by the level of interest
rates, general economic conditions, the location and age of the mortgage, and other social and demographic conditions. As
prepayment rates of individual pools vary widely, it is not possible to accurately predict the average life of a particular
pool.
A collateralized mortgage obligation (“CMO”) is a debt security issued by a corporation, trust or custodian, or by a U.S. Government agency or instrumentality that is collateralized by a portfolio or
pool of mortgages, mortgage-backed securities, U.S. Government securities, or corporate debt obligations. The issuer’s obligation to make interest and principal payments is secured by the underlying pool or portfolio of securities. CMOs are most
often issued in two or more classes (each of which is a separate security) with varying maturities and stated rates of interest.
Interest and principal payments from the underlying collateral (generally a pool of mortgages) are not necessarily passed directly
through to the holders of the CMOs; these payments typically are used to pay interest on all CMO classes and to retire
successive class maturities in a sequence. Thus, the issuance of CMO classes with varying maturities and interest rates may result
in greater predictability of maturity with one class and less predictability of maturity with another class than a direct
investment in a mortgage-backed pass-through security (such as a GNMA certificate). Classes with shorter maturities, typically,
have lower volatility and yield while those with longer maturities, typically, have higher volatility and yield. Thus, investments
in CMOs provide greater or lesser control over the investment characteristics than mortgage pass-through securities
and offer more defensive or aggressive investment alternatives.
Investments in mortgage-related U.S. Government securities, such as GNMA certificates
and CMOs, also involve other risks. The yield on a pass-through security typically is quoted based on the maturity of
the underlying instruments and the associated average life assumption. Actual prepayment experience may cause the yield to differ
from the assumed average life yield. Accelerated prepayments adversely impact yields for pass-through securities purchased
at a premium; the opposite is true for pass-through securities purchased at a discount. During periods of declining interest
rates, prepayment of mortgages underlying pass-through certificates can be expected to accelerate. When the mortgage
obligations are prepaid, the Fund reinvests the prepaid amounts in securities, the yields of which reflect interest
rates prevailing at that time. Therefore, the Fund’s ability to maintain a portfolio of high-yielding, mortgage-backed securities will be adversely affected to the extent that prepayments of mortgages must be reinvested in securities that have lower yields than
the prepaid mortgages. Moreover, prepayments of mortgages that underlie securities purchased at a premium could result
in capital losses. Investment in such securities also could subject the Fund to “maturity extension risk,” which is the possibility that rising interest rates may cause prepayments to occur at a slower than expected rate. This particular risk may effectively
change a security that was considered a short- or intermediate-term security at the time of purchase into a long-term security.
Long-term securities generally fluctuate more widely in response to changes in interest rates than short or intermediate-term
securities.
If a Fund purchases mortgage-backed securities that are “subordinated” to other interests in the same mortgage pool, the Fund, as a holder of those securities, may only receive payments after the pool’s obligations to other investors have been satisfied. An unexpectedly high rate of defaults on the mortgages held by a mortgage pool may substantially limit the pool’s ability to make payments of principal or interest to the Fund as a holder of such subordinated
securities, reducing the values of those securities or in some cases rendering them worthless; the risk of such defaults is
generally higher in the case of mortgage pools that include so-called “subprime” mortgages. An unexpectedly high or low rate of prepayment on a pool’s underlying mortgages may have similar effects on subordinated securities. A mortgage pool may
issue securities subject to various levels of subordination; the risk of non-payment affects securities at each level, although
the risk is greatest in the case of more highly subordinate securities.
The guarantees of the U.S. Government, its agencies, and instrumentalities are guarantees
of the timely payment of principal and interest on the obligations purchased. The value of the shares issued by the Fund
is not guaranteed and will fluctuate with the value of the Fund’s portfolio. Generally, when the level of interest rates rise, the value of the Fund’s investment in U.S. Government securities is likely to decline and, when the level of interest rates decline, the value of the Fund’s investment in U.S. Government securities is likely to rise.
The Fund may engage in portfolio trading primarily to take advantage of yield disparities.
Such trading strategies may result in minor temporary increases or decreases in the Fund’s current income and in its holding of debt securities that sell at substantial premiums or discounts from face value. If expectations of changes in interest
rates or the price of the securities prove to be incorrect, the Fund’s potential income and capital gain will be reduced or its potential loss will be increased.
Prospectus | Davis Funds | 34
Variable Current Income Risk. The income that the Fund pays to investors is not stable. When interest rates increase,
the Fund’s income distributions are likely to increase. When interest rates decrease, the Fund’s income distributions are likely to decrease.
Other Risks
Fees and Expenses Risk. The Funds may not earn enough through income and capital appreciation to offset their
operating expenses. All mutual funds incur operating fees and expenses. Fees and expenses reduce
the return that a shareholder may earn by investing in a fund even when that fund has favorable performance. A low-return
environment, or a bear market, increases the risk that a shareholder may lose money.
An investment in the Funds is not a deposit of the bank and is not insured or guaranteed
by the Federal Deposit Insurance Corporation or any other government agency.
Prospectus | Davis Funds | 35
Additional Information About Expenses, Fees, Performance, and Indices
All Fund results in this prospectus reflect the reinvestment of dividends and capital
gain distributions, if any. Unless otherwise noted, Fund results reflect any fee waivers and/or expense reimbursements in effect
during the periods presented. The fees and expense information is provided using the fee cap and expense waiver agreement in
place through May 1, 2027.
Information Concerning the Example within the Fees and Expenses of the Fund
Class C shares’ expenses for the 10-year and life of Class periods include eight years of Class C shares’ expenses and Class A shares’ expenses thereafter since Class C shares automatically convert to Class A shares after eight years.
The Adviser is contractually committed to waive fees and/or reimburse the expenses
of Davis Financial Fund, Davis Opportunity Fund, Davis Balanced Fund, Davis Government Bond Fund, and Davis Real
Estate Fund to the extent necessary to cap total annual fund operating expenses for Class A shares at 1.00%, Class C shares
at 1.75%, and Class Y shares at 0.75%. For purposes of these expense caps, operating expenses do not include foreign
tax reclaim filing expenses. The Adviser is obligated to continue the expense cap through May 1, 2027. The expense
cap cannot be terminated prior to this date without the consent of the Board of Directors. After that date, there is no assurance
that the Adviser will continue to cap expenses. The Adviser may not recoup any of the operating expenses it has reimbursed
to a Fund.
The Adviser is contractually committed to waive fees and/or reimburse Davis Government Money Market Fund’s expenses such that net investment income will not be less than zero until May 1, 2027. After
that date, there is no assurance that Davis Advisors will continue to cap expenses. Davis Advisors may recapture from the Fund
any of the operating expenses it has reimbursed (but not any of the management fees which it has waived) until the end
of the third calendar year after the end of the calendar year in which such reimbursement occurs. Any potential recovery is limited to an amount such that (1) the Fund’s net investment income will not be less than zero for any class of shares; and (2)
may not exceed 0.10 percent of net assets (ten basis points) in any calendar year. This recapture could negatively affect the Fund’s future yield.
Information Concerning the Annual Total Returns for the Life of Class
Annual Total Returns for the Life of Class
(For the periods ended December 31, 2025, with maximum sales charge)
|
|
DFF
|
DOF
|
DREF
|
DBF
|
DGBF
|
|
Class A shares return before taxes
|
11.81%
|
10.81%
|
7.82%
|
8.47%
|
2.50%
|
|
Class C shares return before taxes
|
8.47%
|
8.61%
|
6.26%
|
6.65%
|
2.01%
|
|
Class Y shares return before taxes
|
9.40%
|
8.96%
|
7.49%
|
7.91%
|
2.28%
|
Davis Financial Fund. Average annual total returns for life are for the periods from the commencement of each class’s investment operations: Class A shares, 5/1/91; Class C shares, 8/12/97; and Class
Y shares, 3/10/97.
Davis Opportunity Fund. Average annual total returns for life are for the periods from the commencement of each class’s investment operations: Class A shares, 12/1/94; Class C shares, 8/15/97; and Class
Y shares, 9/18/97.
Davis Real Estate Fund. Average annual total returns for life are for the periods from the commencement of each class’s investment operations: Class A shares, 1/3/94; Class C shares, 8/13/97; and Class
Y shares, 11/8/96.
Davis Balanced Fund. Average annual total returns for life are for the periods from the commencement of each class’s investment operations: Class A shares, 5/1/92; Class C shares, 8/12/97; and Class
Y shares, 11/13/96. From inception (May 1, 1992) until July 1, 2003, the Fund was named Davis Convertible Securities Fund and
invested primarily in convertible securities. From July 1, 2003 until June 30, 2024, the Fund was named Davis Appreciation
& Income Fund.
Davis Government Bond Fund. Average annual total returns for life are for the periods from the commencement of
each class’s investment operations: Class A shares, 12/1/94; Class C shares, 8/19/97, Class Y shares, 9/1/98.
Class C shares automatically convert to Class A shares after eight years. Class C shares’ performance for the periods exceeding eight years include the first eight years of Class C share performance and
Class A share performance thereafter.
Information Concerning After-Tax Returns
As of the date of this prospectus, the tax rates are 37% for ordinary income, 20%
for qualified income, and 20% for long-term capital gains. An additional 3.8% tax imposed by the Affordable Care Act is included
on all investment income as part of the highest marginal rate used in all after-tax performance calculations.
Information Concerning the Bloomberg U.S. Government 1-3 Year Bond Index and Bloomberg
U.S. Aggregate Bond Index
“Bloomberg®” and the Bloomberg indices listed herein (the “Indices”) are service marks of Bloomberg Finance L.P. and its affiliates, including Bloomberg Index Services Limited (“BISL”), the administrator of the index (collectively, “Bloomberg”), and have been licensed for use for certain purposes by the distributor hereof (the “Licensee”).
Prospectus | Davis Funds | 36
The financial products named herein (the “Products”) are not sponsored, endorsed, sold or promoted by Bloomberg. Bloomberg does not make any representation or warranty, express or implied, to the
owners of or counterparties to the Products or any member of the public regarding the advisability of investing in securities
or commodities generally or in the Product particularly. The only relationship of Bloomberg to Licensee is the licensing
of certain trademarks, trade names and service marks and of the Indices, which are determined, composed and calculated by
BISL without regard to Licensee or the Products. Bloomberg has no obligation to take the needs of Licensee or the owners
of the Products into consideration in determining, composing or calculating the Indices. Bloomberg is not responsible for
and has not participated in the determination of the timing, price, or quantities of the Products to be issued. Bloomberg
shall not have any obligation or liability, including, without limitation, to customers of the Products, in connection
with the administration, marketing or trading of the Products.
BLOOMBERG DOES NOT GUARANTEE THE ACCURACY AND/OR THE COMPLETENESS OF THE INDICES OR
ANY DATA RELATED THERETO AND SHALL HAVE NO LIABILITY FOR ANY ERRORS, OMISSIONS OR
INTERRUPTIONS THEREIN. BLOOMBERG DOES NOT MAKE ANY WARRANTY, EXPRESS OR IMPLIED, AS
TO RESULTS TO BE OBTAINED BY LICENSEE, OWNERS OF THE PRODUCT OR ANY OTHER PERSON OR ENTITY
FROM THE USE OF THE INDICES OR ANY DATA RELATED THERETO. BLOOMBERG DOES NOT MAKE ANY
EXPRESS OR IMPLIED WARRANTIES AND EXPRESSLY DISCLAIMS ALL WARRANTIES OF MERCHANTABILITY OR FITNESS FOR A PARTICULAR PURPOSE OR USE WITH RESPECT TO THE INDICES
OR ANY DATA RELATED THERETO. WITHOUT LIMITING ANY OF THE FOREGOING, TO THE MAXIMUM EXTENT
ALLOWED BY LAW, BLOOMBERG, ITS LICENSORS, AND ITS AND THEIR RESPECTIVE EMPLOYEES,
CONTRACTORS, AGENTS, SUPPLIERS, AND VENDORS SHALL HAVE NO LIABILITY OR RESPONSIBILITY
WHATSOEVER FOR ANY INJURY OR DAMAGES-WHETHER DIRECT, INDIRECT, CONSEQUENTIAL, INCIDENTAL, PUNITIVE OR OTHERWISE-ARISING IN CONNECTION WITH THE PRODUCT OR INDICES
OR ANY DATA OR VALUES RELATING THERETO—WHETHER ARISING FROM THEIR NEGLIGENCE OR OTHERWISE, EVEN IF NOTIFIED OF THE POSSIBILITY THEREOF.
Non-Principal Investment Strategies and Risks
Davis Funds may implement investment strategies that are not principal investment strategies if, in the Adviser’s professional judgment, the strategies are appropriate. A strategy includes any policy, practice,
or technique used by the Funds to achieve their investment objectives. Whether a particular strategy, including a strategy to
invest in a particular type of security, is a principal investment strategy depends on the strategy’s anticipated importance in achieving the Funds' investment objectives and how the strategy affects the Funds' potential risks and returns. In determining
what is a principal investment strategy, the Adviser considers, among other things, the amount of the Funds' assets expected to
be committed to the strategy, the amount of the Funds' assets expected to be placed at risk by the strategy, and the likelihood
of the Funds losing some or all of those assets from implementing the strategy. Non-principal investment strategies are generally
those investments that constitute less than 5% to 10% of the Funds' assets, depending upon their potential impact on the
investment performance of the Funds.
While the Adviser expects to pursue the Funds' investment objectives by implementing
the principal investment strategies described in this prospectus, the Adviser may employ non-principal investment strategies or securities if, in Davis Advisors’ professional judgment, the securities, trading, or investment strategies are appropriate.
Factors that Davis Advisors considers in pursuing these other strategies include whether the strategy: (1) is likely to be consistent with shareholders’ reasonable expectations; (2) is likely to assist the Adviser in pursuing the Funds' investment
objectives; (3) is consistent with the Funds' investment objectives; (4) will not cause the Funds to violate any of their fundamental
or non-fundamental investment restrictions; and (5) will not materially change the Funds' risk profile from the
risk profile that results from following the principal investment strategies as described in this prospectus and further explained
in the SAI, as amended from time to time.
Liquidity Risk Management. While it is not anticipated to be an issue, the Funds' Portfolios are managed with
the restrictions and requirements of the Liquidity Rule’s limitations in mind, by the implementation of a Liquidity Risk Management Program (the “LRMP”). The Adviser monitors the adequacy and effectiveness of the implementation of the LRMP on an ongoing basis. This monitoring includes a review of the Funds' liquidity risk based on a variety
of factors including the Funds': (1) investment strategy, (2) portfolio liquidity and cash flow projections during normal
and reasonably foreseeable stressed conditions, (3) shareholder redemptions, and (4) borrowing arrangements and other
funding sources. The Liquidity Rule places a 15% limit on the Funds' illiquid investments and requires a fund that does
not primarily hold assets that are highly liquid investments to determine and maintain a minimum percentage of that fund’s net assets in highly liquid investments (highly liquid investment minimum or HLIM). The LRMP includes provisions and safeguards
that are reasonably designed to comply with the 15% limit on illiquid investments and the Funds are currently classified
as a fund that primarily hold highly liquid investments. The LRMP includes the classification, no less than monthly, of
the Davis Funds' investments into one of four liquidity classifications as provided for in the Liquidity Rule.
At a recent meeting of the Funds' Board of Directors, the Adviser provided a written
report to the Board pertaining to the operation, adequacy, and effectiveness of implementation of the LRMP from April 1,
2024, through March 31, 2025. The report concluded that the LRMP is operating effectively and is reasonably designed
to assess and manage the Funds' liquidity risk. There can be no guarantee that the LRMP will achieve its objectives in the future.
Prospectus | Davis Funds | 37
Repurchase Agreements. The Funds may enter into repurchase agreements. Repurchase agreements are transactions
in which the Funds purchase government securities and simultaneously commits to resell them
to the same counterparty at a future time and at a price reflecting a market rate of interest. Income from repurchase agreements
may not be exempt from state and local taxation. Repurchase agreements often offer a higher yield than investments directly
in government securities. The resale price reflects the purchase price plus an agreed-on incremental amount, which is unrelated
to the coupon rate or maturity of the purchased security. The repurchase obligation of the seller is, in effect, secured
by the underlying securities. In the event of a bankruptcy or other default of a seller of a repurchase agreement, the Funds could
experience both delays in liquidating the underlying securities and losses, including (1) possible decline in the value of the
collateral during the period, while the Funds seek to enforce their rights thereto; (2) possible loss of all or a part of the income
during this period; and (3) expenses of enforcing its rights.
The Funds will enter into repurchase agreements only when the seller agrees that the
value of the underlying securities, including accrued interest (if any), will at all times be equal to or exceed the value
of the repurchase agreement. The Funds may enter into tri-party repurchase agreements in which a third-party custodian bank
ensures the timely and accurate exchange of cash and collateral. The majority of these transactions run from day-to-day and
delivery pursuant to the resale typically occurs within one to seven days of the purchase. The Funds normally will not enter
into repurchase agreements maturing in more than seven days.
Restricted and Illiquid Securities. The Funds may invest in restricted securities that are subject to contractual restrictions
on resale. The Funds are prohibited from purchasing or holding illiquid securities (which
may include restricted securities) if more than 15% of the Funds' net assets would then be illiquid. If illiquid securities
were to exceed 15% of the value of the Funds' net assets, the Adviser would attempt to reduce the Funds' investment in illiquid
securities in an orderly fashion. Companies whose securities are not publicly traded may not be subject to the disclosure
or other investor protection requirements that would be applicable if their securities were publicly traded.
The restricted securities that the Funds may purchase include securities that have
not been registered under the Securities Act of 1933, as amended (the “1933 Act”), but are eligible for purchase and sale pursuant to Rule 144A (“Rule 144A Securities”). This Rule permits certain qualified institutional buyers, such as the Funds, to trade
in privately placed securities even though such securities are not registered under the 1933 Act. The Adviser, under criteria
established by the Funds' Board of Directors, will consider whether Rule 144A Securities being purchased or held by the Funds are
illiquid and thus subject to the Funds' policy limiting investments in illiquid securities. In making this determination,
the Adviser will consider the frequency of trades and quotations, the number of dealers and potential purchasers, dealer undertakings
to make a market, and the nature of the security and the marketplace trades (for example, the time needed to dispose of
the security, the method of soliciting offers, and the mechanics of transfer). The liquidity of Rule 144A Securities also will be
monitored by the Adviser and if, as a result of changed conditions, it is determined that a Rule 144A Security is no longer liquid,
the Funds' holding of illiquid securities will be reviewed to determine what, if any, action is required in light of the policy
limiting investments in such securities. Investing in Rule 144A Securities could have the effect of increasing the amount of
investments in illiquid securities if qualified institutional buyers are unwilling to purchase such securities.
The Funds may also invest in securities of U.S. and non-U.S. issuers that are issued
through private offerings pursuant to Regulation S of the 1933 Act, as amended. Regulation S securities are subject to legal
or contractual restrictions on resale. These securities may be considered illiquid, as described above. Although Regulation
S securities may be resold in privately negotiated transactions, the price realized from these sales could be less than the
price paid by the Funds. Companies whose securities are not publicly traded may not be subject to the disclosure and other
investor protection requirements that would be applicable if their securities were publicly traded.
See the Funds' SAI for additional information regarding restricted and illiquid securities.
Short-Term Investments. A Fund may use short-term investments, such as treasury bills and repurchase agreements,
to maintain flexibility while evaluating long-term opportunities. Davis Government Money
Market Fund routinely uses short-term investments.
Temporary Defensive Investments. The Funds may, but are not required to, use short-term investments for temporary
defensive purposes. In the event that Davis Advisors’ Portfolio Managers anticipate a decline in the values of the companies in which the Funds invest (due to economic, political, or other factors), the Funds may
reduce their risk by investing in short-term securities until market conditions improve. While the Funds are invested in short-term
investments, they will not be pursuing their stated investment objective. Unlike equity securities, these investments will
not appreciate in value when the market advances and will not contribute to long-term growth of capital.
ReFlow Liquidity Program. Davis Financial Fund, Davis Opportunity Fund, and Davis Balanced Fund may participate
in the ReFlow Fund, LLC (“ReFlow”) liquidity program, which is designed to provide an alternative liquidity source for mutual funds experiencing net redemptions of their shares. Pursuant to the program, ReFlow
provides participating mutual funds with a source of cash to meet net shareholder redemptions by standing ready each business
day to purchase Fund shares up to the value of the net shares redeemed by other shareholders that are expected to settle
that business day. Following purchases of Fund shares, ReFlow then generally redeems those shares when the Fund experiences
net sales, at the end of a maximum holding period determined by ReFlow (currently 8 days), or at other times at ReFlow’s or the Adviser’s discretion. While ReFlow holds Fund shares, it will have the same rights and privileges with respect
to those shares as any other shareholder. In
Prospectus | Davis Funds | 38
the event the Fund uses the ReFlow service, the Fund will pay a fee to ReFlow each
time ReFlow purchases Fund shares, calculated by applying to the purchase amount a fee rate determined through an automated
daily auction among participating mutual funds. The current minimum fee rate is 0.14%, although the Fund may submit
a bid at a higher rate if it determines that doing so is in the best interest of Fund shareholders. ReFlow’s purchases of Fund shares through the liquidity program are made on an investment-blind basis without regard to the Fund’s objective, policies, or anticipated performance. In accordance with federal securities laws, ReFlow is prohibited from acquiring more than 3% of
the outstanding voting securities of the Fund. ReFlow will periodically redeem its entire share position in the Fund and may
request that such redemption be met in-kind in accordance with the Fund’s policy on purchases and redemptions in-kind. The Board of Directors has approved the Funds' participation in the ReFlow program.
The Adviser believes that participation in the ReFlow liquidity program may assist
in stabilizing the Funds' net assets, to the benefit of the Fund and its shareholders, although there is no guarantee that the
program will do so. To the extent the Funds' net assets do not decline, the Adviser typically will also benefit.
For more details concerning current investments and market outlook, please see the
Funds' most recent shareholder report.
Management and Organization
Davis Selected Advisers, L.P. (“Davis Advisors”) serves as the investment adviser for each of the Davis Funds. Davis Advisors’ offices are located at 2949 East Elvira Road, Suite 101, Tucson, Arizona 85756. Davis Advisors provides investment advice for Davis Funds, manages their business affairs and provides day-to-day administrative
services. Davis Advisors also serves as investment adviser for other mutual funds, exchange-traded funds and institutional
and individual clients. For the fiscal year-ended December 31, 2025, Davis Advisors’ net management fee paid by the Funds for its services (based on average net assets) was: Davis Financial Fund, 0.55%; Davis Opportunity Fund, 0.55%;
Davis Real Estate Fund, 0.55%; Davis Balanced Fund, 0.55%; Davis Government Bond Fund, 0.00%; and Davis Government Money
Market Fund, 0.30%. A discussion regarding the basis for the approval of the Funds’ investment advisory and service agreement by the Funds’ Board of Directors is contained in the Funds’ most recent semi-annual Form N-CSR financial statements.
Davis Selected Advisers–NY, Inc. serves as the sub-adviser for the Davis Funds. Davis Selected Advisers–NY, Inc.’s offices are located at 620 Fifth Avenue, 3rd Floor, New York, New York 10020. Davis Selected Advisers–NY, Inc. provides investment management and research services for the Davis Funds and other institutional clients,
and is a wholly owned subsidiary of Davis Advisors. Davis Selected Advisers–NY, Inc.’s fee is paid by Davis Advisors, not Davis Funds.
Execution of Portfolio Transactions. Davis Advisors places orders with broker-dealers for the portfolio transactions of
Davis Funds. Davis Advisors seeks to place portfolio transactions with brokers or dealers
who will execute transactions as efficiently as possible and at the most favorable net price. In placing executions and paying
brokerage commissions or dealer markups, Davis Advisors considers price, commission, timing, competent block trading coverage,
capital strength and stability, research resources, and other factors. Subject to best price and execution, Davis Advisors
may place orders for Davis Funds' portfolio transactions with broker-dealers who have sold shares of the Funds. However, when
Davis Advisors places orders for the Funds' portfolio transactions, it does not give any consideration to whether a broker-dealer
has sold shares of the Funds. In placing orders for Davis Funds' portfolio transactions, the Adviser does not commit
to any specific amount of business with any particular broker-dealer.
Over the last three fiscal years, the Funds paid the following brokerage commissions:
|
Fiscal Year Ended December 31,
|
2025
|
2024
|
2023
|
|
Davis Financial Fund
|
|
|
|
|
Brokerage commissions paid
|
$86,803
|
$14,316
|
$81,262
|
|
Brokerage as a percentage of average net assets
|
0.01%
|
0.01%
|
0.01%
|
|
Davis Opportunity Fund
|
|
|
|
|
Brokerage commissions paid
|
$82,697
|
$151,205
|
$37,294
|
|
Brokerage as a percentage of average net assets
|
0.01%
|
0.03%
|
0.01%
|
|
Davis Balanced Fund
|
|
|
|
|
Brokerage commissions paid
|
$25,348
|
$16,200
|
$10,628
|
|
Brokerage as a percentage of average net assets
|
0.01%
|
0.01%
|
0.01%
|
|
Davis Real Estate Fund
|
|
|
|
|
Brokerage commissions paid
|
$33,697
|
$33,601
|
$44,607
|
|
Brokerage as a percentage of average net assets
|
0.02%
|
0.02%
|
0.03%
|
|
Davis Government Bond Fund
|
|
|
|
|
Brokerage commissions paid
|
None
|
None
|
None
|
|
Brokerage as a percentage of average net assets
|
None
|
None
|
None
|
|
Davis Government Money Market Fund
|
|
|
|
|
Brokerage commissions paid
|
None
|
None
|
None
|
|
Brokerage as a percentage of average net assets
|
None
|
None
|
None
|
Prospectus | Davis Funds | 39
Portfolio Managers
Davis Financial Fund
◼
Christopher Davis has served as Portfolio Manager of the Fund since January 2014 and from May 1991
until May 2007. Mr. Davis also manages other equity funds advised by Davis Advisors. Mr. Davis has
served as an analyst and Portfolio Manager for Davis Advisors since September 1989.
◼
Pierce Crosbie has managed a segment of the Fund since December 2018, manages other equity funds
advised by Davis Advisors, and also serves as a research analyst for Davis Advisors. Mr. Crosbie joined
Davis Advisors in November 2008.
Davis Opportunity Fund
Davis Advisors uses a system of multiple Portfolio Managers to manage the Fund. Under
this approach, the portfolio of the Fund is divided into segments managed by individual Portfolio Managers. Christopher
Davis serves as the Chair of Davis Advisors’ Portfolio Review Committee and, as part of this service, Mr. Davis has general oversight responsibilities for the Fund, which may include allocating segments of the Fund’s assets among the Portfolio Managers.
The other Portfolio Managers listed below are primarily responsible for the day-to-day
management of a substantial majority of the Fund’s assets. In addition, a limited portion of the Fund’s assets are managed by Davis Advisors’ research analysts, subject to review by the Portfolio Review Committee. Portfolio Managers decide how
their respective segments will be invested. All investment decisions are made within the parameters established by the Fund’s investment objectives, strategies, and restrictions.
◼
Dwight Blazin has managed a segment of the Fund since December 2001, manages other equity funds
advised by Davis Advisors, and also serves as a research analyst for Davis Advisors. Mr. Blazin joined
Davis Advisors in August 1997.
◼
Christopher Davis has served as the research adviser of the Fund since January 1999 and also manages
other equity funds advised by Davis Advisors. Mr. Davis has served as an analyst and Portfolio Manager
for Davis Advisors since September 1989. As research adviser, Mr. Davis oversees the research analysts of the Fund and
allocates segments of the Fund to each of them to invest.
◼
Danton Goei has managed a segment of the Fund since December 2001, manages other equity funds
advised by Davis Advisors, and also serves as a research analyst for Davis Advisors. Mr. Goei joined
Davis Advisors in November 1998.
◼
Darin Prozes has managed a segment of the Fund since November 2013, manages other equity funds
advised by Davis Advisors, and also serves as a research analyst for Davis Advisors. Mr. Prozes joined
Davis Advisors in September 2004.
◼
Edward Yen has managed a segment of the Fund since January 2022, manages other equity funds
advised by Davis Advisors, and also serves as a research analyst for Davis Advisors. Mr. Yen joined
Davis Advisors in 2013.
Davis Real Estate Fund
◼
Andrew Davis has served as a Portfolio Manager of the Fund since January 1994 and also manages
other equity funds advised by Davis Advisors. Mr. Davis has served as a Portfolio Manager for Davis Advisors
since February 1993.
◼
Chandler Spears has served as a Portfolio Manager of the Fund since August 2002 and also manages
other equity funds advised by Davis Advisors. Mr. Spears has served as a research analyst at Davis Advisors
since November 2000.
Davis Balanced Fund
Christopher Davis serves as the Chair of Davis Advisors’ Portfolio Review Committee. In this role, Mr. Davis has general oversight responsibilities for the Fund, which includes capital allocation of the Fund’s assets among the Portfolio Managers. The Portfolio Managers listed below are primarily responsible for the day-to-day management
of a substantial majority of the Fund’s assets. All investment decisions are made within the parameters established by the Fund’s investment objectives, strategies and restrictions.
◼
Christopher Davis has served as a Portfolio Manager of the Fund since July 2016 and also manages other
equity funds advised by Davis Advisors. Mr. Davis has served as an analyst and Portfolio Manager
for Davis Advisors since September 1989.
◼
Erik Jones has served as a Portfolio Manager of the Fund since March 2026 and also manages fixed
income and money market funds advised by Davis Advisors. Mr. Jones has served as a Portfolio Manager
for Davis Advisors since March 2026. Mr. Jones is responsible for the management of the fixed income segment of the
Fund.
◼
Darin Prozes has served as a Portfolio Manager of the Fund since October 2021, manages other equity
funds advised by Davis Advisors, and also serves as a research analyst for Davis Advisors. Mr. Prozes
joined Davis Advisors in September 2004.
Davis Government Bond Fund and Davis Government Money Market Fund
◼
Erik Jones has served as a Portfolio Manager of Davis Government Bond Fund and Davis Government
Money Market Fund since March 2026.
Prospectus | Davis Funds | 40
The SAI provides additional information about the Portfolio Managers’ compensation, other accounts managed by the Portfolio Managers, and the Portfolio Managers’ investments in the Funds.
Certain Portfolio Managers may serve on the board(s) of public companies where they,
from time to time, may have access to material, non-public information (“MNPI”). Davis Advisors has instituted policies and procedures to ensure that these Portfolio Managers will not be able to utilize MNPI for their own benefit or for any
of the accounts they manage.
Shareholder Information
Procedures and Shareholder Rights Are Described by Current Prospectus and Other Disclosure
Documents
Investors should look to the most recent prospectus and SAI, as amended or supplemented
from time to time, for information concerning the Funds, including information on how to purchase and redeem Fund shares
and how to contact the Funds. The most recent prospectus and SAI (including any supplements or amendments thereto) will
be on file with the Securities and Exchange Commission as part of the Funds' registration statement. Please also see
the back cover of this prospectus for information on other ways to obtain information about the Funds.
How Your Shares Are Valued
Once you open your Davis Funds account, you may purchase or sell shares at the net asset value (“NAV”) next determined after the Davis Funds' transfer agent or other “qualified financial intermediary” (a financial institution that has entered into a contract with Davis Advisors or its affiliates to offer, sell, and redeem shares of
the Funds) receives your request to purchase or sell shares in “good order.” A request is in good order when all documents which are required to constitute a legal purchase or sale of shares have been received by the Davis Funds' transfer agent or other qualified
financial intermediary (as defined above). The documents required to achieve good order vary depending upon a number
of factors (are shares held in a joint account or a corporate account, has the account had a recent address change, etc.).
Contact your broker or Davis Funds if you have questions about what documents will be required.
If your purchase or sale order is received in good order prior to the close of trading
on the New York Stock Exchange (“NYSE”), your transaction will be executed that day at that day’s NAV. If your purchase or sale order is received in good order after the close of the NYSE, your transaction will be processed the next business day at that next day’s NAV. The NAV is calculated by Davis Funds for each class of shares issued by the Funds as of the close
of trading on the NYSE, normally 4:00 p.m., Eastern time, on each day when the NYSE is open. NYSE holidays currently include New Year’s Day, Martin Luther King, Jr. Day, Washington’s Birthday, Good Friday, Memorial Day, Juneteenth National Independence Day, Independence Day, Labor Day, Thanksgiving Day, and Christmas Day.
The NAV of each class of shares is determined by taking the value of the class of shares’ total assets, subtracting the class of shares’ liabilities, and then dividing the result (net assets) by the number of outstanding shares of the class of shares. Since the equity funds invest in securities that may trade in foreign markets on days other
than when Davis Funds calculate their NAVs, the value of the Funds' portfolio may change on days that shareholders will not be
able to purchase or redeem shares in the Funds.
If you have access to the Internet, you can also check the NAV on the Davis Funds'
website, www.davisfunds.com.
Valuation of Portfolio Securities
The Board of Directors of the Davis Funds has delegated the determination of fair
value of securities to Davis Selected Advisers, L.P. The Adviser has implemented policies and procedures that govern the
pricing of securities for the Davis Funds, as discussed below.
The Adviser values securities for which market quotations are readily available at
current value. Short-term investments purchased within 60 days to maturity and of sufficient credit quality are valued at
amortized cost, which approximates fair value. Securities listed on the NYSE, NASDAQ, and other national exchanges are valued
at the last reported sales price on the day of valuation. Listed securities for which no sale was reported on that date are
valued at the last quoted bid price. Securities traded on foreign exchanges are valued based upon the last sales price on the principal
exchange on which the security is traded prior to the time when the Funds' assets are valued.
Securities, including illiquid or restricted securities, for which market quotations
are not readily available are valued at their fair value. Securities whose values have been materially affected by a significant
event occurring before the Funds' assets are valued but after the close of their respective exchanges will be fair valued. Fair
value is determined in good faith using consistently applied procedures. Fair valuation is based on subjective factors and,
as a result, the fair value price of a security may differ from the security’s market price and may not be the price at which the security may be sold. Fair valuation could result in a different NAV than an NAV determined by using market quotations. The Board
of Directors reviews and discusses with management a summary of fair valued securities in quarterly board meetings.
In general, foreign securities are more likely to require a fair value determination
than domestic securities because circumstances may arise between the close of the market on which the securities trade
and the time when the Funds value their portfolio securities, which may affect the value of such securities. Securities denominated
in foreign currencies and traded in foreign markets will have their values converted into U.S. dollar equivalents at the
prevailing exchange rates as computed by
Prospectus | Davis Funds | 41
State Street Bank and Trust Company. Fluctuation in the values of foreign currencies
in relation to the U.S. dollar may affect the net asset value of the Funds' shares even if there has not been any change in
the foreign currency prices of the Funds' investments.
Securities of smaller companies are also generally more likely to require a fair value
determination because they may be thinly traded and less liquid than traditional securities of larger companies.
The Funds may occasionally be entitled to receive award proceeds from litigation relating
to an investment security. The Funds generally do not recognize a gain on contingencies until such payment is certain,
which in most cases is when they receive payment.
To the extent that the Funds' portfolio investments trade in markets on days when
the Funds are not open for business, the Funds' NAV may vary on those days. In addition, trading in certain portfolio investments
may not occur on days the Funds are open for business because markets or exchanges other than the NYSE may be closed.
If the exchange or market on which the Funds' underlying investments are primarily traded closes early, the NAV may be calculated
prior to its normal market calculation time. For example, the primary trading markets for the Funds may close
early on the day before certain holidays and the day after Thanksgiving.
Fixed income securities may be valued at prices supplied by the Davis Funds' pricing
agent based on broker or dealer supplied valuations or matrix pricing, a method of valuing securities by reference to the value
of other securities with similar characteristics, such as rating, interest rate and maturity. Government bonds, corporate
bonds, asset-backed bonds, convertible securities, and high-yield or junk bonds are normally valued on the basis of prices
provided by independent pricing services. Prices provided by the pricing services may be determined without exclusive reliance
on quoted prices and may reflect appropriate factors such as institutional trading in similar groups of securities,
developments related to special securities, dividend rate, maturity, and other market data. Prices for fixed income securities
received from pricing services sometimes represent best estimates. In addition, if the prices provided by the pricing service
and independent quoted prices are unreliable, the Adviser will arrive at its own fair valuation using its fair value procedures.
Davis Government Money Market Fund typically values all of its securities at amortized
cost. Normally, the share price of the Fund does not fluctuate. However, if there are unusually rapid changes in interest rates that the Fund’s Board of Directors believes will cause a material deviation between the amortized cost of the Fund’s debt securities and the value of those securities, the Board will consider taking temporary action to maintain a fixed price
or to prevent material dilution or other unfavorable consequences to Fund shareholders. This temporary action could include
withholding dividends, paying dividends out of surplus, realizing gains or losses, or using market valuation to calculate
net asset value rather than amortized cost."
Portfolio Holdings
A description of Davis Funds' policies and procedures with respect to the disclosure
of the Funds' portfolio holdings is available in the SAI.
The Funds' complete schedules of investments are filed with the SEC on Form N-CSR
(as of the end of the second and fourth quarters) and on Form N-PORT Part F (as of the end of the first and third quarters).
The Funds' Forms N-CSR (Annual and Semi-Annual Reports) and N-PORT Part F are available, without charge, upon request,
by calling 1-800-279-0279, on the Davis Funds' website at davisfunds.com/resources/regulatory-documents, and on the SEC’s website at www.sec.gov. Lists of the Funds' month-end and quarter-end holdings are also available at www.davisfunds.com.
They become available on or about the 10th day following each respective time period and remain available on the website until
the list is updated for the subsequent period.
How Davis Funds Pay Earnings
There are two ways you can receive payments from the Funds:
◼
Dividends. Dividends are distributions to shareholders of net investment income and short-term
capital gains on investments.
◼
Capital Gains. Capital gains are profits received by the Funds from the sale of securities held
for the long term, which are then distributed to shareholders.
If you would like information about when the Funds pay dividends and distributes capital
gains, please call 1-800-279-0279. Unless you choose otherwise, Davis Funds will automatically reinvest your dividends
and capital gains in additional Fund shares.
You can request to have your dividends and capital gains paid to you by check or deposited
directly into your bank account. Dividends and capital gains of $50 or less will not be sent by check but will be reinvested
in additional Fund shares.
Davis Funds also offer a Dividend Diversification Program which allows you to have
your dividends and capital gains from one Davis Fund reinvested in shares of another Davis Fund.
You will receive a statement each year detailing the amount of all dividends and capital
gains paid to you during the previous year. To ensure that these distributions are reported properly to the U.S. Treasury,
you must certify on your Davis Funds Application Form or on IRS Form W-9 that your Taxpayer Identification Number is correct
and you are not subject to backup
Prospectus | Davis Funds | 42
withholding. If you are subject to backup withholding or if you did not certify your
Taxpayer Identification Number, the IRS requires Davis Funds to withhold a percentage of any dividends paid and redemption
or exchange proceeds received.
How to Put Your Dividends and Capital Gains to Work
You can have all of your dividends and capital gains automatically invested in the
same Fund or the same share class of any other Davis Fund. To be eligible for the Dividend Diversification Program, all accounts
involved must be registered under the same name and same class of shares and have a minimum initial value of $1,000 for
Class A and Class C shares. The minimum for Class Y shares varies. See “How to Open an Account” for details. Shares are purchased at the chosen Fund’s net asset value on the dividend payment date. You can make changes to your selection or withdraw from
the program at any time. To participate in this program, fill out the “Distribution Options” section of the Application Form. If you wish to establish this program after your account has been opened, call for more information.
Dividends and Distributions
◼
Davis New York Venture Fund ordinarily distributes its dividends and capital gains,
if any, in June and December.
◼
Other Davis long-term growth funds (i.e., Davis Opportunity Fund, Davis Financial
Fund, Davis Global Fund, and Davis International Fund) ordinarily distribute dividends and capital gains, if any, in
December.
◼
The Davis growth & income funds (i.e., Davis Real Estate Fund and Davis Balanced Fund)
ordinarily distribute dividends quarterly and capital gains, if any, in December.
◼
Davis Government Bond Fund and Davis Government Money Market Fund ordinarily distribute
dividends monthly. Davis Government Bond Fund ordinarily distributes capital gains, if any, in December. Davis
Government Money Market Fund does not ordinarily distribute capital gains.
◼
When a dividend or capital gain is distributed, the net asset value per share is reduced
by the amount of the payment. Davis Government Bond Fund’s and Davis Government Money Market Fund’s net asset values are not affected by dividend payments.
◼
You may elect to reinvest dividend and/or capital gain distributions to purchase additional
shares of any Davis Fund or you may elect to receive them in cash. Many shareholders do not elect to take capital
gain distributions in cash because these distributions reduce principal value.
◼
If a dividend or capital gain distribution is for an amount less than $50, the Fund
will not issue a check. Instead, the dividend or capital gain distribution will be automatically reinvested in additional
shares of the Fund.
◼
If a dividend or capital gain distribution check remains uncashed for four months
or is undeliverable by the United States Postal Service, the Fund may reinvest the dividend or capital gain distribution in
additional shares of the Fund promptly after making this determination and future dividends and capital gains distributions
will be automatically reinvested in additional shares of the Fund.
Federal Income Taxes
Taxes on Distributions
Distributions you receive from the Funds may be subject to income tax and may also
be subject to state or local taxes, unless you are exempt from taxation. Shareholders that are investing through a taxable account
should consider the embedded gains or losses of the Funds. For example, a new shareholder could be subject to taxes on
a distribution they receive from the Funds that was earned when they were not a shareholder. It is important to note that investors
are only taxed on their own economic income over the life of the investment. The embedded gains or losses for the Funds
are disclosed in the most recent annual and semi-annual report.
For federal tax purposes, any taxable dividends and distributions of short-term capital
gains are treated as ordinary income. The Funds' distributions of net long-term capital gains are taxable to you as long-term
capital gains. Any taxable distributions you receive from the Funds will normally be taxable to you when made, regardless of
whether you reinvest distributions or receive them in cash.
Davis Funds will send you a statement each year showing the tax status of your Fund
distributions.
Taxes on Transactions
Your redemptions, including exchanges, may result in a capital gain or loss for federal
tax purposes. A capital gain or loss on your investment is the difference between the cost of your shares, including any sales
charges, and the price you receive when you sell them.
More information concerning federal taxes is available in the SAI. Davis Advisors
recommends that you consult with a tax adviser about dividends and capital gains that you may receive from Davis Funds.
Fees and Expenses of the Funds
The Funds must pay operating fees and expenses.
Prospectus | Davis Funds | 43
Management Fee
The management fee covers the normal expenses of managing the Funds, including compensation,
research costs, corporate overhead expenses and related expenses. The difference in the fee structure between
the classes is primarily the result of their separate arrangements for shareholder and distribution services and is not the result
of any difference in the amounts charged by Davis Advisors for core investment advisory services. Accordingly, the core investment
advisory expenses do not vary by class. Different fees and expenses will affect performance.
12b-1 Fees
The Davis Funds have Plans of Distribution or “12b-1 Plans” under which the Funds may use their own assets to finance distribution activities. The 12b-1 Plans are used primarily to pay dealers and other
institutions for providing services to the Funds' shareholders. The 12b-1 Plans provide for annual distribution expenses of:
Class A shares, up to 0.25% of their average daily net asset value; and Class C shares, up to the lesser of 1.25% of their average
daily net asset value of the respective shares or the maximum amount provided by applicable rules or regulations of the Financial
Industry Regulatory Authority (“FINRA”), which is 1.00% at present.
For Class A and Class C shares, up to 0.25% of distribution expenses may be used to
pay service fees to qualified dealers providing certain shareholder services. These services may include, but are not limited to, assessing a client’s investment needs and recommending suitable investments on an ongoing basis. In lieu of a front-end
sales charge (as assessed upon the sale of Class A shares), up to an additional 1.00% of distribution expenses may be paid for
Class C shares. Because distribution expenses are paid out of the Funds' assets on an ongoing basis, these fees will increase
the cost of your investment over time and may cost you more than paying other types of sales charges. Thus, the higher fees
for Class C shares may cost you more over time than paying the initial sales charge for Class A shares.
The Class C contingent deferred sales charge and the Class C asset-based sales charges
have the same purpose as the front-end sales charge on sales of Class A shares, i.e., to compensate dealers and other financial
institutions for their services. The fees are paid by the Funds to dealers and financial institutions for providing services
to their clients.
Class Y shares do not have a Plan of Distribution.
Other Expenses
Other expenses include miscellaneous fees from affiliated and outside service providers.
These fees may include legal, audit, custodial fees, the costs of printing and mailing of reports and statements, automatic
reinvestment of distributions and other conveniences, and payments to third parties that provide recordkeeping services or
administrative services for investors in the Funds.
Total Fund Operating Expenses
The total cost of operating a mutual fund is reflected in its expense ratio. A shareholder
does not pay operating costs directly. Instead, operating costs are deducted before the Funds' NAV is calculated and are
expressed as a percentage of the Funds' average daily net assets. The effect of these fees is reflected in the performance
results for that class of shares. Investors should examine total operating expenses closely in the prospectus, especially when comparing
one fund with another fund in the same investment category.
Fees Paid to Dealers and Other Financial Intermediaries
Broker-dealers and other financial intermediaries (“Qualifying Dealers”) may charge Davis Distributors, LLC (the “Distributor”) or the Adviser substantial fees for selling the Funds' shares and providing continuing support to shareholders. The fees charged by Qualifying Dealers may include, but are not limited to: (1) sales
commissions from sales charges paid by purchasing shareholders; (2) distribution and service fees from the Funds' 12b-1 distribution
plans; (3) recordkeeping fees from the Funds for providing recordkeeping services to investors who hold the Funds'
shares through dealer-controlled omnibus accounts; and (4) other fees, described below, paid by Davis Advisors or the
Distributor from their own resources.
Qualifying Dealers may, as a condition to distributing shares of Davis Funds, request
that the Distributor, or the Adviser, pay or reimburse the Qualifying dealer for: (1) marketing support payments, including
business planning assistance, client servicing and data analytics, educating personnel about Davis Funds and shareholder
financial planning needs, placement on the Qualifying dealer’s list of offered funds, and access to sales meetings, sales representatives and management representatives of the Qualifying dealer; and (2) financial assistance charged to
allow the Distributor to participate in and/or present at conferences or seminars, sales or training programs for invited registered
representatives and other employees, client and investor events, and other dealer-sponsored events. These additional fees are sometimes referred to as “revenue sharing” payments. A number of factors are considered in determining fees paid to Qualifying Dealers, including the dealer’s sales and assets and the quality of the dealer’s relationship with the Distributor. Fees are generally based on the value of shares of the Funds held by the Qualifying dealer or financial institution for its customers or
based on sales of Fund shares by the dealer or financial institution, or a combination thereof. In some cases, the charges or fees
may be a negotiated lump sum payment. Davis Advisors may use its profits from the advisory fee it receives from the Funds
to pay some or all of these fees. Some Qualifying Dealers may also choose to pay additional compensation to their registered
representatives who sell the Funds. Such payments may be associated with the status of the Funds on a Qualifying dealer’s preferred list of funds or otherwise
Prospectus | Davis Funds | 44
associated with the Qualifying dealer’s marketing and other support activities. The foregoing arrangements may create an incentive for the Qualifying Dealers, brokers, or other financial institutions, as
well as their registered representatives, to sell Davis Funds rather than other funds.
In 2025, the Distributor, or the Adviser, was charged additional fees by the Qualifying
Dealers listed below. The Distributor or the Adviser paid these fees from its own resources. These Qualifying Dealers may provide
Davis Funds enhanced sales and marketing support and financial advisers employed by the Qualifying Dealers may recommend
Davis Funds rather than other funds. Qualifying Dealers may be added or deleted at any time.
ADP Broker Dealer, Inc.; Ameriprise Financial Services, Inc.; BMO Harris (fka Marshall
& Ilsley Trust Company); BNY Mellon N.A.; Charles Schwab & Co., Inc.; Edward D. Jones; Empower Financial Services;
Fidelity Brokerage Services LLC; Fidelity Investments Institutional Services Company Inc.; Genworth Life and Annuity
Insurance Company; Genworth Life Insurance Company of New York; John Hancock Trust Co., LLC; LPL Financial Corporation;
Matrix Settlement; Merrill Lynch Life Insurance Co.; Merrill Lynch, Pierce, Fenner & Smith, Inc.; Morgan Stanley
Smith Barney LLC; Nationwide Financial Services, Inc.; Pershing LLC; Principal Financial Group; Raymond James &
Associates, Inc.; RBC Capital Markets Corp; T. Rowe Price Retirement Plan Services, Inc.; Talcott Resolution Life Insurance;
Teachers Insurance and Annuity Association of America; Transamerica Advisors Life Insurance Company; Transamerica
Advisors Life Insurance Company of New York; Transamerica Retirement Solutions Corp.; UBS Financial Services, Inc.; The
Vanguard Group, Inc.; Vanguard Marketing Corporation; Voya Retirement; Voya Retirement Insurance & Annuity; and Wells
Fargo Advisors LLC.
In addition, the Distributor may, from time-to-time, pay additional cash compensation
or other promotional incentives to authorized dealers or agents who sell shares of Davis Funds. In some instances, such
cash compensation or other incentives may be offered only to certain dealers or agents who employ registered representatives
who have sold or may sell significant amounts of shares of Davis Funds during specified periods of time.
Although Davis Funds may use brokers who sell shares of the Funds to execute portfolio
transactions, the Funds do not consider the sale of Fund shares as a factor when selecting brokers to execute portfolio
transactions.
Investors should consult their financial intermediaries regarding the details of payments
they may receive in connection with the sale of Fund shares.
Due Diligence Meetings. The Distributor routinely sponsors due diligence meetings for registered representatives,
during which they receive updates on various Davis Funds and are afforded the opportunity
to speak with the Funds' Portfolio Managers. Invitation to these meetings is not conditioned on selling a specific number
of shares. Those who have shown an interest in Davis Funds, however, are more likely to be considered. To the extent permitted by their firm’s policies and procedures, registered representatives’ expenses in attending these meetings may be covered by the Distributor.
Seminars and Educational Meetings. The Distributor may defray certain expenses of Qualifying Dealers incurred in connection with seminars and other educational efforts subject to the Distributor’s policies and procedures governing payments for such seminars. The Distributor may share expenses with Qualifying Dealers
for costs incurred in conducting training and educational meetings about various aspects of the Davis Funds for the
employees of Qualifying Dealers. In addition, the Distributor may share expenses with Qualifying Dealers for costs incurred
in hosting client seminars at which the Funds are discussed.
Recordkeeping Fees. Certain Qualifying Dealers have chosen to maintain “omnibus accounts” with Davis Funds. In an omnibus account, the Funds maintain a single account in the name of the Qualifying
dealer and the dealer maintains all of its clients’ individual shareholder accounts. Likewise, for many retirement plans, a third-party administrator may open an omnibus account with Davis Funds and the administrator will then maintain all of the
participant accounts. Davis Advisors, on behalf of the Funds, enters into agreements whereby the Funds are charged by the Qualifying
dealer or administrator for such recordkeeping services.
Recordkeeping services typically include: (1) establishing and maintaining shareholder
accounts and records; (2) recording shareholder account balances and changes thereto; (3) arranging for the wiring of
funds; (4) providing statements to shareholders; (5) furnishing proxy materials, periodic Davis Funds reports, prospectuses,
and other communications to shareholders as required; (6) transmitting shareholder transaction information; and
(7) providing information in order to assist the Davis Funds in their compliance with state securities laws. Each Davis Fund, typically,
would be paying these shareholder servicing fees directly if a Qualifying dealer did not hold all customer accounts
in a single omnibus account with each Davis Fund.
Other Compensation. The Distributor may, from its own resources and not from the Funds', pay additional
fees to the extent not prohibited by state or federal laws, the Securities and Exchange Commission (SEC),
or any self-regulatory agency such as the Financial Industry Regulatory Authority (FINRA).
How to Choose a Share Class
Before you buy shares in any Davis Fund, you need to decide which Class of shares
best suits your needs. Davis Series offers three classes of shares for purchase: Class A, Class C, and Class Y. Each class
is subject to different expenses and sales charges. As described in “Appendix A: Intermediary-Specific Sales Charge Waivers and Discounts,” your sales charge may
Prospectus | Davis Funds | 45
vary depending on your financial intermediary. Class Y shares are generally available
only to qualified institutional investors. Each Class is essentially identical in legal rights and invests in the same portfolio
of securities.
The difference in the fee structure between the Classes is primarily the result of
their separate arrangements for shareholder and distribution services and is not the result of any difference in the amounts charged
by Davis Advisors for investment advisory services. Accordingly, the investment advisory expenses do not vary by class.
You may choose to buy one class of shares rather than another depending on the amount
of the purchase and the expected length of time of your investment. Long-term shareholders of Class C shares may pay
more than the maximum front-end sales charge allowed by FINRA.
Class A Shares
Class A shares may be best for you if you are a long-term investor who is willing
to pay the entire sales charge at the time of purchase. In return, you pay a lower distribution fee than Class C shares. In addition,
descriptions of the sales load waivers and/or discounts for Class A shares with respect to certain financial intermediaries are reproduced in “Appendix A: Intermediary-Specific Sales Charge Waivers and Discounts” to this prospectus based on information provided by the financial intermediary.
◼
For any investment below $100,000, you buy Class A shares at their net asset value
per share plus a sales charge, which is approximately 4.75% of the offering price (see table below). The term “offering price” includes the front-end sales charge.
◼
There is no limit to how much you can invest in this share class.
◼
Davis Funds (other than Davis Government Money Market Fund) pay a distribution fee
of up to 0.25% of the average daily net assets each year you hold the shares. This fee is lower than the fee you pay for
Class C shares. The lower expenses of Class A shares translate into higher annual returns on net asset value than Class
C shares.
Class A Shares Sales Charges
(For all Davis Funds, except Davis Government Money Market Fund)
|
Amount of
Purchase
|
Sales Charge
Approximate percentage of
offering price
|
Sales Charge
Approximate percentage of net
amount invested
|
Amount of Sales Charge
Retained by Dealer
Percentage of offering price
|
|
Under $100,000
|
4.75%
|
4.99%
|
4.00%
|
|
$100,000-$249,999
|
3.50%
|
3.63%
|
3.00%
|
|
$250,000-$499,999
|
2.50%
|
2.56%
|
2.00%
|
|
$500,000-$749,999
|
2.00%
|
2.04%
|
1.75%
|
|
$750,000-$999,999
|
1.00%
|
1.01%
|
0.75%
|
|
$1 million or more*
|
None
|
None
|
None
|
*
You pay no front-end sales charge on purchases of $1 million or more, but if you sell
those shares (in any Davis Fund other than Davis Government Money Market Fund) within the first year, a deferred sales charge of 0.50% may be
deducted from the redemption proceeds as a percentage of the lesser of the net asset value of the shares redeemed or the total cost of such shares.
Because of rounding, the front-end sales charge you pay, when expressed as a percentage
of the offering price, may be higher or lower than the amount stated in the above fee table. In addition, descriptions
of the sales load waivers and/or discounts for Class A shares with respect to certain financial intermediaries are reproduced in “Appendix A-Intermediary-Specific Sales Charge Waivers and Discounts.”
The Distributor may pay commissions to the dealer of record (on Davis Funds other
than Davis Government Money Market Fund) on purchases at the annual rate described in the table below. Commissions may
be paid on either: (1) Class A share purchases of $1 million or more; or (2) Class A share purchases (net of redemptions)
in retirement plans that qualify for sales at net asset value. The commission will be paid only on purchases that were not previously
subject to a front-end sales charge or dealer concession.
|
Amount of Purchase
|
Commission
|
|
First $5 million
|
0.50%
|
|
Amounts thereafter
|
0.25%
|
The Funds may reimburse the Distributor for these payments through their Plans of
Distribution. If distribution fee limits have already been reached for the year, the Distributor itself will pay the commissions.
Reduction of Class A Shares Initial Sales Charge
To receive a reduction in your Class A initial sales charge, you must let your financial
adviser or Davis Funds know at the time you purchase shares that you qualify for such a reduction. If you do not let
your adviser or Davis Funds know that you are eligible for a reduction, you may not receive a sales charge discount to which
you are otherwise entitled.
As the table above shows, the sales charge gets smaller as your purchase amount increases.
There are several ways you may combine purchases to qualify for a lower sales charge. To qualify for a reduction in Class A shares’ initial sales charge, you must provide records (generally, account statements are sufficient; your broker may
require additional documents) of all Davis Funds shares owned that you wish to count towards the sales charge reduction.
Prospectus | Davis Funds | 46
You Can Combine Purchases of Class A Shares
◼
With other “immediate family” members. To receive a reduced Class A sales charge, investments made by yourself, your spouse, and any children under the age of 21 may be aggregated if made for your own
account(s) and/or certain other accounts, such as:
−
Trust accounts established by the above individuals. However, if the person(s) who
established the trust is (are) deceased, then the trust account may only be aggregated with accounts of the primary
beneficiary of the trust;
−
Solely controlled business accounts; or
−
Single-participant retirement plans.
◼
Through Employee Benefit Plans. If you buy shares through trust or fiduciary accounts or Individual Retirement Accounts (IRAs) of a single employer, the purchases will be treated as a single purchase.
◼
Under a Statement of Intention. If you enter a Statement of Intention and agree to buy shares of $100,000 or more
over a thirteen-month period, all of the shares you buy during that period will be counted
as a single purchase, with the exception of purchases into Davis Government Money Market Fund. Before entering a Statement
of Intention, please read the terms and conditions in the SAI. Under a Statement of Intention, you agree to permit the
Funds' transfer agent, SS&C Global Investor & Distribution Solutions, Inc., to hold Fund shares in escrow to guarantee
payment of any sales charges that may be due if you ultimately invest less than you agreed to invest over the covered thirteen-month
period. Davis Government Money Market Fund purchases do not count toward a Statement of Intention, unless the
shares were exchanged from another Davis Fund and the shares were previously subject to a sales charge.
◼
Under Rights of Accumulation. If you notify your dealer or the Distributor you can include the Class A, Class C,
Class R, and Class Y shares in Davis Funds you already own (excluding shares in Davis Government
Money Market Fund) when calculating the price for your current purchase. These shares are valued at current
offering price to determine whether or not you qualify for a reduction in the sales charge. Davis Government Money Market
Fund purchases do not count toward Rights of Accumulation, unless the shares were exchanged from another Davis Fund and
the shares were previously subject to a sales charge.
◼
Combining Rights of Accumulation (ROA) with Statement of Intention. A shareholder can use a Statement of Intention and Rights of Accumulation in conjunction with one another; the Statement of Intention
will take precedence over the Rights of Accumulation. Once the Statement of Intention has been satisfied, any new
purchases into any of the linked Class A share accounts will receive the reduced sales charge.
For more information about how to reduce Class A shares’ initial sales charge, please visit Davis Funds’ website, free of charge, at www.davisfunds.com (which includes additional information in a clear and
prominent format that includes hyperlinks), consult your broker or financial intermediary, or refer to the Funds'
SAI, which is available through your financial intermediary or from the Funds by calling Investor Services at 1-800-279-0279.
Class A Shares Front-End Sales Charge Waivers
To receive a waiver of your Class A initial sales charge, you must let your financial
adviser or Davis Funds know at the time you purchase shares that you qualify for such a waiver. If you do not let your adviser
or Davis Funds know that you are eligible for a waiver, you may not receive a sales charge waiver to which you are otherwise
entitled.
The Davis Funds do not impose a sales charge on purchases of Class A shares for:
◼
Purchases by group omnibus retirement plans under section 401(a), 401(k), 403(b),
or 457 of the Internal Revenue Code;
◼
Rollover purchases in a Davis Funds IRA held directly with the transfer agent made
with the proceeds of a retirement plan distribution that was previously invested in a Davis Fund;
◼
Registered investment advisers, trust companies, and bank trust departments exercising
discretionary investment authority with respect to amounts to be invested in a Davis Fund;
◼
Purchases by dealers, brokers, banks, registered investment advisers, and other financial
intermediaries that have entered into an agreement with the Distributor to offer the Davis Funds on an advisory fee
or wrap fee-based platform;
◼
Financial intermediaries who have entered into an agreement with the Distributor and
have been approved by the Distributor to offer the Davis Funds to self-directed investment brokerage accounts
that may or may not charge a transaction fee;
◼
Certain state sponsored 529 college savings plans;
◼
Persons involuntarily liquidated from a Davis Fund, who, within 60 days of liquidation,
buy new shares of another Davis Fund (but only up to the amount that was liquidated);
◼
Insurance company separate accounts;
◼
Investments in Davis Government Money Market Fund;
◼
Shareholders making purchases with dividends or capital gains that are automatically
reinvested;
Prospectus | Davis Funds | 47
◼
Current and former directors, officers, and employees of any Davis Fund or Davis Advisors
(or its affiliates), and their extended family. The term “extended family” includes “immediate family,” which is one’s spouse and children under 21, and also one’s grandchildren, grandparents, parents, parents-in-law, brothers and sisters, sons- and daughters-in-law, a sibling’s spouse, a spouse’s sibling, aunts, uncles, and nieces and nephews; relatives by virtue of a remarriage (step-children, step-parents, etc.) are included. Extended family shall include any child
regardless of age;
◼
Davis Advisors or its affiliates;
◼
Registered representatives, principals, and employees (and any extended family member)
of securities dealers having a sales agreement with the Distributor;
◼
Financial institutions acting as fiduciaries making single purchases of $250,000 or
more;
◼
State and local governments purchasing directly from the Davis Funds. Please consult
your legal and investment advisers to determine if an investment in a Davis Fund is permissible and suitable for you;
◼
Shareholders making purchases in certain accounts offered by securities firms that
have entered into contracts with the Davis Funds and charge fees based on assets in the account;
◼
Shares of Davis International Fund purchased in accounts established due to the merger
on November 7, 2025;
◼
Shareholder accounts established prior to December 2014 as a result of a merger with
a Davis Fund; and
◼
Purchases by taxable accounts held directly with the transfer agent that are established
with the proceeds of Required Minimum Distributions from retirement plans and accounts.
Rollovers from Retirement Plans to IRAs
For qualifying rollovers, you must send the Davis Funds’ custodial agent, UMB Bank, a written request for the rollover.
Assets from retirement plans may be invested in Class A or Class C shares through
an IRA rollover. Rollovers invested in Class A shares from retirement plans will be subject to applicable sales charges.
Rollovers to Class A shares will be made without a sales charge if they meet the following requirements:
◼
The assets being rolled over were invested in Davis Funds at the time of distribution;
and
◼
The rolled over assets are contributed to a Davis Funds IRA with UMB Bank as the plan’s custodian.
IRA assets that rollover without a sales charge, as described above, will not be subject
to a contingent deferred sales charge.
IRA rollover assets invested in Class A shares that are not attributable to investments
in Davis Funds as well as future contributions to the IRA will be subject to sales charges and the terms and conditions
generally applicable to Class A share investments as described in the prospectus and SAI.
Class C Shares
Class C shares may be best for you if you are willing to pay a higher distribution
fee than Class A shares in order to avoid paying a front-end sales charge. The Class C contingent deferred sales charge and
asset-based sales charge have the same purpose as the front-end sales charge on sales of Class A shares, i.e., to compensate
the broker. Class C shares assess a higher distribution fee to pay fees and expenses charged by dealers and financial institutions
for services provided to clients.
Class C shares (including a proportionate number of shares acquired through reinvestment
of dividends and distributions) will automatically convert to Class A shares in the month of or the month following the
8-year anniversary of the purchase date. Time spent in Davis Government Money Market Fund does not count towards its 8-year
time period. A conversion between share classes in the same fund is a nontaxable event. The automatic conversion will
be based on the relative net asset values of the two share classes without the imposition of a sales charge or fee. As this is
a dollar for dollar conversion, you may receive more or fewer Class A shares due to the difference in the NAV of the two share classes.
◼
You buy the shares at net asset value (no initial sales charge).
◼
The maximum purchase per transaction for Class C shares is $500,000.
◼
If you have significant Davis Funds holdings, you may not be eligible to invest in
Class C shares. You may not purchase Class C shares if you are eligible to purchase Class A shares at the $1 million or
more sales charge discount rate (i.e., at net asset value). See “Class A Shares Sales Charges” and “Reduction of Class A Shares Initial Sales Charge” for more information regarding sales charge discounts.
◼
If you sell Class C shares in any of the Davis Funds (other than Davis Government
Money Market Fund) within one year of purchase, you must pay a deferred sales charge of one percent. At redemption, the
deferred sales charge for each purchase will be calculated from the date of purchase, excluding any time the shares
were held in the Davis Government Money Market Fund.
◼
Investors in Class C shares (other than Davis Government Money Market Fund) pay a
distribution fee of one percent of the average daily net asset value each year they hold the shares. Higher distribution
fees translate into lower annual return on net asset value.
Prospectus | Davis Funds | 48
Deferred Sales Charge
If you purchase shares subject to a contingent deferred sales charge and redeem any
of those shares during the applicable holding period for the class of shares you own, the contingent deferred sales charge
will be deducted from the redemption proceeds unless you are eligible for one of the waivers described below. At redemption,
the deferred sales charge will be calculated from the date of each purchase, excluding any time that shares were held
in the Davis Government Money Market Fund. You will pay a deferred sales charge in the following cases:
◼
As a Class A shareholder, only if you buy shares valued at $1 million or more without
a sales charge and sell the shares within one year of purchase.
◼
As a Class C shareholder, if you sell shares within one year of purchase.
To keep deferred sales charges as low as possible, the Davis Funds will first sell
shares in your account that are not subject to a deferred sales charge (if any). The Davis Funds do not impose a deferred sales charge
on the amount of your account value represented by an increase in net asset value over the initial purchase price, or
on shares acquired through dividend reinvestments or capital gains distributions. If the net asset value has decreased
the sales charge will be based on the current NAV. To determine whether the deferred sales charge applies to a redemption, shares
are redeemed in the following order:
◼
Shares in your account represented by an increase in NAV over the initial purchase
price (appreciation).
◼
Shares acquired by reinvestment of dividends and capital gain distributions.
◼
Shares that are no longer subject to the deferred sales charge.
◼
Shares held the longest, but which are still subject to the deferred sales charge.
Note: Investors who buy Class C shares of Davis Government Money Market Fund will not pay
a deferred sales charge unless the Fund shares were received in exchange for shares of another Davis Fund (see “Exchanging Shares” in this prospectus).
Deferred Sales Charge Waivers
The Davis Funds will waive the deferred sales charge on sales of Class A and Class
C shares of any Davis Fund if:
◼
You sell Class A shares that were not subject to a commission at the time of purchase
(the amount of purchase totaled $1 million or more) and the shares were held for more than a year.
◼
You die and were the sole owner of the account. Otherwise, shares can be redeemed
without a contingent deferred sales charge following the death or disability of the last surviving shareholder, including
a trustee of a grantor trust or revocable living trust for which the trustee is also the sole beneficiary. The death or disability
must have occurred after the account was established. If you claim a disability, you must provide evidence of a determination
of disability by the Social Security Administration.
◼
You sell shares under a qualified retirement plan or IRA that constitutes a tax-free
return of excess contributions to avoid a penalty.
◼
Your Fund redeems the remaining shares in your account under an Involuntary Redemption.
◼
You qualify for an exception related to defined contribution plans. These exceptions
are described in the SAI.
◼
You are a director, officer, or employee of Davis Advisors or one of its affiliates
(or an extended family member of a director, officer, or employee).
◼
You sell Class C shares under the Systematic Withdrawal Plan and the aggregate value
of the redeemed shares does not exceed twelve percent of the account’s value.*
If the net asset value of the shares that you sell has increased since you purchased
them, any deferred sales charge will be based on the original cost of the shares.
*
A Systematic Withdrawal Plan may be established as either a percentage or a fixed-dollar
amount. The shares that may be redeemed without a sales charge are recalculated as a percentage of the current value of the account as of
the date of each withdrawal. If established as a percentage, no sales charge will be incurred regardless of market fluctuations. If established as a fixed-dollar
amount, a sales charge may be incurred if the value of the account decreases. If you redeem shares in addition to those redeemed pursuant to
the Systematic Withdrawal Plan, a deferred sales charge may be imposed on those shares and on any subsequent redemptions within a twelve-month period,
regardless of whether such redemptions are pursuant to a Systematic Withdrawal Plan.
Class Y Shares
Class Y shares may be best for you if you qualify. Class Y shares are sold at net
asset value per share without a sales charge directly to institutional investors. Investors in Class Y shares do not pay a distribution
fee. For details on what types of institutions may purchase shares and what fund minimums apply see “How to Open an Account” in this prospectus.
If you have any additional questions about choosing a share class, please call the
Funds, toll free, at 1-800-279-0279, Monday through Friday, from 9 a.m. to 6 p.m. Eastern time. If you still are not sure about
which class is best for you, contact your financial adviser.
Prospectus | Davis Funds | 49
How to Open an Account
To open an account with Davis Funds you must meet the initial minimum investment for
each Fund you choose to invest in. For each Class A or Class C share account, you must invest at least $1,000. For Class
Y shares, the minimum investment amount is dependent on how you invest:
◼
At least $5 million for an institution (e.g., trust company, bank trust, endowment,
pension plan, or foundation) acting on behalf of its own account or one or more clients.
◼
At least $5 million for a government entity (e.g., a state, county, city, department,
authority, or similar government agency).
◼
With an account established under a “wrap account” or other fee-based program that is sponsored and maintained by a registered broker-dealer approved by the Distributor.
◼
At least $500,000 for a 401(k) plan, 457 plan, profit-sharing and money purchase pension
plan, defined benefit plan, or non-qualified deferred compensation plan where plan level or omnibus accounts are
held on the books of the Fund.
◼
Through a registered investment adviser (RIA) who initially invests for clients an
aggregate of at least $100,000 in Davis Funds through a fund “supermarket” or other mutual fund trading platform sponsored by a broker-dealer or trust company and has entered into an agreement with Davis Distributors, LLC.
At the Distributor’s discretion, the minimum may be waived for an account established under a “wrap account” or other fee-based program that is sponsored and maintained by a registered broker-dealer approved by
the Distributor. The Distributor reserves the right, at its discretion and without notice, to modify, waive, or increase
the minimum initial investment requirements for any investor, or category of investors, or financial intermediaries
that submit trades on behalf of underlying investors.
To Open an Account
|
Mail
|
Complete and sign the Application Form and mail it to the Davis Funds. Include a check
made payable to
Davis Funds. All purchases by check should be in U.S. dollars. Davis Funds will not accept third-party
checks, starter checks, traveler’s checks, or money orders.
|
|
Regular mail
Davis Funds
P.O. Box 219197
Kansas City,
MO64121-9197
|
Express shipping
Davis Funds
801 Pennsylvania Ave
Suite 219197
Kansas City, MO 64105-1307
|
|
Dealer
|
You may have your dealer order and pay for the shares. In this case, you must pay
your dealer directly. Your
dealer will then order the shares from the Distributor. Please note that your dealer
may charge a service fee
or commission for these transactions.
|
Anti-Money Laundering Compliance
Davis Funds and the Distributor are required to comply with various anti-money laundering
laws and regulations and have appointed an anti-money laundering compliance officer. Consequently, Davis Funds or
the Distributor may request additional information from you to verify your identity and the source of your funds. If you
do not provide the requested information, Davis Funds may not be able to open your account. If at any time the Davis Funds believe
an investor may be involved in suspicious activity or if certain account information matches information on government
lists of suspicious persons, Davis Funds and the Distributor may choose not to establish a new account or may be required to “freeze” a shareholder’s account. They may also be required to provide a government agency or another financial institution
with information about transactions that have occurred in a shareholder’s account or to transfer monies received to establish a new account, transfer an existing account or transfer the proceeds of an existing account to a governmental agency.
In some circumstances, the law may not permit the Davis Funds or the Distributor to inform the shareholder that it has taken
the actions described above.
Retirement Plan Accounts
You can invest in Davis Funds using any of these types of retirement plan accounts:
◼
IRAs
◼
Roth IRAs
◼
SIMPLE IRAs
◼
Simplified Employee Pension (SEP) IRAs
◼
Coverdell Education Savings Accounts
UMB Bank acts as custodian for these retirement plans and charges each participant
a $15 custodial fee each year per Social Security Number. This fee will be waived for accounts sharing the same Social Security
Number if the accounts total at least $50,000 at Davis Funds. This custodial fee is automatically deducted from each account
in December unless you elect to pay the fee directly. Checks for the custodial fee should be made payable to UMB Bank.
If an account is closed before this fee is
Prospectus | Davis Funds | 50
paid, it will be deducted from the proceeds at the time of the redemption. To open
a retirement plan account, you must fill out a Retirement Account Application Form. You can request this form by calling Investor
Services or by visiting Davis Funds' website, www.davisfunds.com. If you do not list a financial advisor and their brokerage
firm on the account application, the Distributor may be designated as the broker of record solely for purposes of acting
as your agent to purchase or redeem shares. The Distributor and its employees do not provide recommendations on these accounts
or any other account where the Distributor is listed as the broker of record.
Class Y shares cannot be purchased in an IRA.
How to Buy, Sell, and Exchange Shares
Once you have established an account with Davis Funds, you can add to or withdraw
from your investment. This prospectus describes the types of transactions you can perform as a Davis Funds shareholder including
how to initiate these transactions and the charges that you may incur (if any) when buying, selling or exchanging shares.
A transaction will not be executed until all required documents have been received in a form meeting all legal requirements.
Legal requirements vary depending upon the type of transaction and the type of account. Call Investor Services for instructions.
These procedures and charges may change over time and the prospectus in effect at the time a transaction is initiated
will describe the procedures and charges that will apply to the transaction.
Right to Reject or Restrict any Purchase or Exchange Order
Purchases and exchanges (other than for Davis Government Money Market Fund) should
be made for long-term investment purposes only. Davis Funds and the Distributor reserve the right to reject any purchase
or exchange order for any reason prior to the end of the first business day after the date that a purchase or exchange order
was processed. Davis Funds or the Distributor may “reject” a current purchase order or “restrict” an investor from placing future purchase orders. Davis Funds and the Distributor will not reject or restrict a redemption order without adequate
reason, including but not limited to allowing a purchase check to clear, a court order, etc. Exchanges involve both a redemption
and a purchase, only the purchase side of the exchange may be rejected or restricted. Davis Funds are not designed to serve
as a vehicle for frequent trading in response to short-term fluctuations in the securities markets. Accordingly, purchases or exchanges
that are part of activity that Davis Funds or the Distributor have determined may involve actual or potential harm to a
Fund may be rejected.
Ways to Buy, Sell, and Exchange Shares
|
Telephone
|
Call 1-800-279-0279. You can speak directly with an Investor Services Professional, Monday through Friday,
from 9 a.m. to 6 p.m. Eastern time or use the Fund’s automated telephone system at any time, day or night.
|
|
Online
|
You may initiate most account transactions through online account access on the Davis
Funds website,
www.davisfunds.com. Please note that certain account types, including all Class Y
and Class R share
accounts, may be restricted from online access.
|
|
Mail
|
Send the request to the Davis Funds at either address listed below.
|
|
Regular mail
Davis Funds
P.O. Box 219197
Kansas City, MO
64121-9197
|
Express shipping
Davis Funds
801 Pennsylvania Ave
Suite 219197
Kansas City, MO 64105-1307
|
|
Dealer
|
Contact a dealer who will execute the transaction through the Distributor. Please
note that your dealer may
charge service fees or commissions for these transactions.
|
|
Wire
|
You may wire federal funds directly to the Funds' service provider, State Street Bank
and Trust Company.
|
The Davis Funds do not issue certificates for any class of shares. Instead, shares
purchased are automatically credited to an account maintained for you on the books of Davis Funds by State Street Bank and Trust
Company. Transactions in the account, such as additional investments, will be reflected on regular confirmation statements
from Davis Funds. Dividend and capital gain distributions, purchases through automatic investment plans and certain retirement
plans, and automatic exchanges and withdrawals will be confirmed at least quarterly.
When Your Transactions Are Processed
Purchases, sales, and exchanges will be processed at 4 p.m. Eastern time after Davis Funds’ transfer agent or other qualified financial intermediary receives your request to purchase or sell shares in good order,
including all documents that are required to constitute a legal purchase, sale, or exchange of shares.
Buying More Shares
You may buy more shares at any time, by mail, through a dealer, by telephone, through
online account access, or by wire. The minimum additional purchase amount for all share classes is $25.
Mail. When you purchase shares by mail:
◼
Make the check payable to Davis Funds.
Prospectus | Davis Funds | 51
◼
If you have the investment slip from your most recent statement, include it with the
check. If you do not have an investment slip, include a letter with your check stating the name of the Fund, the class of
shares you wish to buy, and your account number.
Dealer. When you buy shares through a dealer, you may be charged service fees or commissions
for these transactions.
Telephone. If you have a bank account listed on your account you may purchase shares via ACH
(Automated Clearing House) and the funds will be pulled directly from your bank account to purchase shares. Call
1-800-279-0279 to use the Funds' automated phone system 24 hours a day or speak to an Investor Services Professional,
Monday through Friday, from 9 a.m. to 6 p.m. Eastern time.
Online Account Access. If you have a bank account listed on your account you may purchase shares via ACH
(Automated Clearing House) and the funds will be pulled directly from your bank account to purchase shares. See “Internet Transactions” in this prospectus for details on how to access your account through the internet.
Wire. You may wire federal funds directly to the Funds' service provider, State Street
Bank and Trust Company. To ensure that the purchase is credited properly, follow these wire instructions:
State Street Bank and Trust Company
Boston, MA 02210
Attn: Mutual Fund Services
[Name of Davis Fund and Class of shares that you are buying]
Shareholder Name
Shareholder Account Number
Federal Routing Number: 011000028
DDA Number: 9904-606-2
Boston, MA 02210
Attn: Mutual Fund Services
[Name of Davis Fund and Class of shares that you are buying]
Shareholder Name
Shareholder Account Number
Federal Routing Number: 011000028
DDA Number: 9904-606-2
Inactive Accounts
If shareholder-initiated contact does not occur on your account within the timeframe
specified by the law in your state of record or if Fund mailings are returned as undeliverable during that timeframe, the
assets of your account (shares and/or any uncashed checks) may be transferred to your last known recorded state of residence
as unclaimed property in accordance with specific state law. NOTE: If you fail to initiate such contact, your property will
be escheated to your last known state of residency after which you will need to claim the property from that state.
If a check remains uncashed for four months or is undeliverable by the United States
Postal Service, the Fund may reinvest the proceeds in additional shares of the Fund. In addition, your account options may be
updated to reinvest all subsequent distributions in shares of the Fund and systematic withdrawal options may be terminated.
Making Automatic Investments
An easy way to increase your investment in any Davis Fund is to sign up for the Automatic
Investment Plan. Under this plan, you arrange for a predetermined amount of money to be withdrawn from your bank account
and invested in Fund shares. The minimum amount you can invest under the plan each month is $25. The account minimum
of $1,000 must be met prior to establishing an automatic investment plan.
Purchases can be processed electronically on any day of the month if the institution
that services your bank account is a member of the Automated Clearing House (ACH) system. Each debit should be reflected
on your next bank statement.
To sign up for the Automatic Investment Plan, complete the appropriate section of
the Application Form or complete an Account Service Form. You can modify your Automatic Investment Plan at any time by
calling Investor Services.
Selling Shares
You may sell back all or part of your shares in any Davis Fund in which you invest
(also known as redeeming your shares) on any day that the Davis Funds are open at net asset value minus any sales charges that
may be due. You can sell the shares by mail, through a dealer, by telephone, or through online account access. The Davis
Funds typically expect to pay redemption proceeds one business day following receipt and acceptance of a proper redemption
request. However, in some cases, payment from the Davis Funds may take longer than one business day and may take up to seven
days as is generally permitted by the Investment Company Act of 1940, as amended. The Davis Funds may, under limited circumstances,
be permitted to pay redemption proceeds beyond seven days following receipt and acceptance of a proper
redemption request. You may redeem shares on any day that the Davis Funds are open. If you recently purchased shares
and subsequently request a redemption of those shares, redemption proceeds may be withheld until a sufficient period of time
has passed to reasonably ensure that all checks or drafts (including certified or cashier’s checks) have cleared, normally not exceeding fifteen calendar days from the purchase date.
Under normal conditions, the Davis Funds typically expect to meet shareholder redemption
requests by using available cash (or cash equivalents) or by selling portfolio securities. The Davis Funds may use
additional methods to meet shareholder redemption requests, if they become necessary. These methods may be used during both
normal and stressed market conditions. These methods may include, but are not limited to, the use of overdraft protection afforded by the Davis Funds’ custodian bank or borrowing from a line of credit.
Prospectus | Davis Funds | 52
In addition to paying redemption proceeds in cash, the Davis Funds reserve the right
to pay part or all of your redemption proceeds with Fund securities or other Fund assets instead of cash (in-kind redemption).
On the same redemption date, some shareholders may be paid in whole or in part in securities (which may differ among
those shareholders), while other shareholders may be paid entirely in cash. The disposal of the securities received
in-kind may be subject to brokerage costs and, until sold, such securities remain at market risk and liquidity risk, including
the risk that such securities are or become difficult to sell. If the Davis Funds pay your redemption with illiquid or less liquid
securities, you will bear the risk of not being able to sell such securities. A redemption in-kind is treated as a taxable transaction
and a sale of the redeemed shares, generally resulting in a capital gain or loss to you, subject to certain loss limitation
rules.
Mail. All registered shareholders must sign the request.
◼
A Medallion Signature Guarantee is required if the redemption request is:
−
For a check greater than $100,000;
−
Made payable to someone other than the registered shareholder(s);
−
Sent to an address other than to the address of record or to an address of record
that has been changed in the last 30 days; or
−
To a bank account not on record.
Dealer. When you sell shares through a dealer, you may be charged service fees or commissions
for these transactions.
Telephone. Call 1-800-279-0279 to use the Davis Funds' automated phone system 24 hours a day or speak to an Investor
Services Professional, Monday through Friday, from 9 a.m. to 6 p.m. Eastern time.
◼
Redemptions by check:
−
Are limited to $100,000;
−
Must be mailed to the address of record that has been on the account for at least
30 days; and
−
Must be made payable to the registered shareholder.
◼
Redemptions via wire or ACH can only be sent to an eligible bank currently on the
account.
Online Account Access. See “Internet Transactions” in this prospectus for details on how to access your account through the internet.
◼
Redemptions by check:
−
Are limited to $100,000;
−
Must be mailed to the address of record that has been on the account for at least
30 days; and
−
Must be made payable to the registered shareholder.
◼
There is a 15-day holding period following a bank maintenance event during which online
redemptions are restricted. Shareholders are still able to submit redemption requests via phone or written instruction.
◼
Redemptions via wire or ACH can only be sent to an eligible bank currently on the
account.
Unless you decide not to have telephone, fax, or internet services on your account(s),
you agree to hold the Davis Funds, any of its affiliates or mutual funds managed by such affiliates, and each of their respective
directors/trustees, officers, employees, and agents harmless from any losses, expenses, costs, or liabilities (including attorney’s fees) that may be incurred in connection with the exercise of these privileges when Davis Funds, acting in good
faith, has complied with instructions that are believed to be genuine. The Funds use certain procedures to confirm that your
instructions are genuine. If these procedures are not used, the Funds may be liable for any loss from unauthorized instructions.
Check Writing Privilege for Davis Government Money Market Fund
You can request check writing privileges on your Davis Government Money Market Fund
account if you hold Class A shares and are not investing through a retirement plan or an IRA. Davis Government Money
Market Fund investors with check writing privileges can write checks:
◼
For $250 or more from their accounts. Checks written for less than $250 will be honored
and a $25 service fee will be debited from the account;
◼
So long as the account balance is at least $1,000 after the check has been paid. If
a check is presented for payment which would bring the account balance to less than $1,000 a $25 service fee will be debited
from the account and check writing privileges will be suspended. Davis Funds and State Street Bank and Trust Company
reserve the right to modify these rules at any time.
Writing a check is a way of selling shares and directing the proceeds to a third party.
When a Davis Government Money Market Fund check is presented to State Street Bank and Trust Company for payment,
the bank will redeem a sufficient number of shares in your account to cover the amount of the check. If you have had
recent activity in your Davis Government Money Market Fund account, funds may not be available to cover your checks. For example:
(1) if you have redeemed or exchanged funds out of your Davis Government Money Market Fund account, there may
not be sufficient funds remaining to cover your check; (2) if you have recently purchased shares in your Davis Government
Money Market Fund account, the
Prospectus | Davis Funds | 53
Funds may still be within the fifteen-day uncollected status; or (3) if funds were
exchanged into your Davis Government Money Market Fund account from another Davis Fund, those funds may still be within
the fifteen-day uncollected status.
To qualify for Check Writing Privileges, fill out the appropriate section in your
Application Form. If you write a check on your Davis Government Money Market Fund account and you do not have sufficient shares in
your account to cover the check, or if your check is presented for payment before your purchase check has cleared, the check
will be returned and your account will be assessed an insufficient funds fee of $25. You can find more information about
check writing privileges in the SAI. Davis Funds and State Street Bank and Trust Company reserve the right to modify or terminate
the check writing service at any time.
What You Need to Know Before You Sell Your Shares
You will always receive cash for sales that total less than $250,000 or one percent of the Fund’s net asset value during any ninety-day period. Any sales above the cash limit may be paid in securities.
◼
In certain circumstances, such as the death of a shareholder or acting as power of
attorney, additional documentation may be required. Please contact Investor Services at 1-800-279-0279 to determine if your situation requires such documentation.
◼
In the past, Davis Funds issued certificates for its shares. If a certificate was
issued for the shares you wish to sell, the certificate must be sent by certified mail to Davis Funds, accompanied by a letter
of instruction signed by the owner(s).
◼
A sale may produce a gain or loss. Gains may be subject to tax.
◼
The SEC may suspend redemption of shares under certain emergency circumstances if
the New York Stock Exchange is closed for reasons other than customary closings and holidays.
Medallion Signature Guarantee
To protect you and Davis Funds against fraud, certain redemption requests must be
made in writing with your signature guaranteed. A Medallion Signature Guarantee is a written endorsement from an eligible
guarantor institution that the signature(s) on the written request is (are) valid. Certain commercial banks, trust
companies, savings associations, credit unions, and members of a United States stock exchange participate in the Medallion
Signature Guarantee Program. No other form of signature verification will be accepted.
Stock Power
This is a letter of instruction signed by the owner of Fund shares that gives State
Street Bank and Trust Company permission to transfer ownership of the shares to another person or group. Any transfer of ownership
requires that all shareholders have their signatures Medallion-guaranteed.
If You Decide to Buy Back Shares You Sold
If you sold Davis Funds Class A shares on which you have paid a sales charge (other
classes of shares are not entitled to this privilege) and decide to repurchase some or all shares within 60 days of sale, you
may notify the Davis Funds in writing of your intent to exercise the Subsequent Repurchase Privilege. This privilege can only
be exercised once. With this privilege you may purchase Class A shares at current net asset value without a sales charge. You
may purchase Class A shares of the same fund/account in an amount up to, but not exceeding, the dollar amount of Class A shares
which you previously redeemed. To exercise this privilege, you must send a letter to Davis Funds along with a check
for the repurchased shares.
Involuntary Redemption
If your fund/account balance declines to less than the minimum for your share class
in any fund as a result of a redemption, exchange or transfer, the Fund will redeem your remaining shares in the Fund at net
asset value. You will be notified before your account is involuntarily redeemed. Telephone redemptions will receive immediate
notice that the redemption will result in the entire account being redeemed upon execution of the transaction. All other
redemptions will receive a letter notifying account holders that their accounts will be involuntarily redeemed unless the account
balance is increased to the Fund minimum within 30 days. For Class A and Class C shares, this is typically $1,000.
Class Y share minimums vary. Please see “How to Open an Account” for details.
Systematic Withdrawal Plan
You can sell a predetermined dollar or percentage amount each month or quarter (for
retirement accounts or IRAs, withdrawals may be established on an annual basis). Because withdrawals are sales,
they may produce a gain or loss. If you purchase additional Fund shares at around the same time that you make a withdrawal,
you may have to pay taxes and a sales charge. When you participate in this plan, shares are sold so that you will receive
payment by one of three methods:
◼
You may receive a check at the address of record provided that this address has not
changed for a period of at least 30 days.
◼
You may also choose to receive funds by ACH by completing an Account Service Form.
If you wish to execute a Systematic Withdrawal Plan by ACH after your account has been established, please
complete an Account Service Form and have your signature Medallion-guaranteed.
◼
You may have funds sent by check to a third-party at an address other than the address
of record. In order to do so, you must complete the appropriate section of the Application Form. If you wish to designate
a third-party payee after your account has been established, you must submit a letter of instruction with a Medallion
Signature Guarantee.
Prospectus | Davis Funds | 54
You may stop systematic withdrawals at any time without charge or penalty by calling
Investor Services.
Wiring Sale Proceeds to Your Bank Account
You may be eligible to have your redemption proceeds electronically transferred to
a commercial bank account by federal funds wire. There is a $5 charge by State Street Bank and Trust Company for wire service
and receiving banks may also charge for this service. Proceeds of redemption by federal funds wire are usually credited
to your bank account on the next business day after the sale. Alternatively, redemption through ACH will usually arrive at your
bank two banking days after the sale. To have redemption proceeds sent by federal funds wire to your bank, you must first fill out the “Banking Instructions” section on the Account Application Form and attach a voided check or deposit slip. If the
account has already been established, an Account Service Form must be submitted with a Medallion Signature Guarantee and a
voided check.
Exchanging Shares
You can sell shares of any Davis Fund to buy shares in the same class of any other
Davis Fund without having to pay a sales charge. This is known as an exchange. You can only exchange shares from your account
within the same share class and under the same registration. You can exchange shares by telephone, by internet, by mail,
or through a dealer. The initial exchange must be for at least the minimum for your share class. For Class A and Class C shares,
this is typically $1,000. Class Y share minimums vary. Please see “How to Open an Account” for details. Exchanges are normally performed on the same day of the request if received in proper form (all necessary documents, signatures, etc.) by
4 p.m. Eastern time.
Shares in different Davis Funds may be exchanged at relative net asset value. However,
if any Davis Fund shares being exchanged are subject to a deferred sales charge, Statement of Intention, or other
limitation, the limitation will continue to apply to the shares received in the exchange. When you exchange shares in a Davis
Fund for shares in Davis Government Money Market Fund, the holding period for any deferred sales charge does not continue
during the time that you own Davis Government Money Market Fund shares. For example, Class C shares are subject to a
contingent deferred sales charge for one year. Any period that you are invested in shares of Davis Government Money Market
Fund will be added to the contingent deferred sales charge period.
You may exchange shares in any of the following ways:
Mail. All registered shareholders must sign the request.
Dealer. When you exchange shares through a dealer, you may be charged service fees or commissions
for these transactions.
Telephone. Call 1-800-279-0279 to use the Davis Funds' automated phone system 24 hours a day or speak to an Investor
Services Professional, Monday through Friday, from 9 a.m. to 6 p.m. Eastern time.
Online Account Access. See “Internet Transactions” in this prospectus for details on how to access your account through the internet.
In the past, Davis Funds issued certificates. If you wish to exchange shares for which
you hold share certificates, these certificates must be sent by certified mail to Davis Funds accompanied by a letter
of instruction signed by the owner(s). If your shares are being sold for cash, this is known as a redemption. Please see “What You Need to Know Before You Sell Your Shares” in this prospectus for restrictions that might apply to this type of transaction.
Before you decide to make an exchange, you must obtain the current prospectus of the
desired Fund. For federal income tax purposes, exchanges between Davis Funds are treated as a sale and a purchase. Therefore,
there will usually be a recognizable capital gain or loss due to an exchange.
Automatic Exchange Program
You can elect to make automatic monthly exchanges if all accounts involved are registered
under the same name and have a minimum initial value of at least the minimum for your share class. For Class A and
Class C shares this is typically $1,000. Class Y share minimums vary. Please see “How to Open an Account” for details. You must exchange at least $25 to participate in this program. To sign up for this program you may contact Investor Services.
Frequent Purchases and Redemptions of Fund Shares
Davis Funds discourage short-term or excessive trading, do not accommodate short-term
or excessive trading, and, if detected, intend to restrict or reject such trading or take other action if in the judgment
of Davis Advisors such trading may be detrimental to the interest of the Funds. Such strategies may dilute the value of
Fund shares held by long-term shareholders, interfere with the efficient management of the Funds' portfolio, and increase brokerage
and administrative costs.
The Davis Funds’ Board of Directors has adopted a 30-day restriction policy with respect to the frequent purchase and redemption of Fund shares. Under the 30-day restriction, any shareholder redeeming
shares from an equity fund will be precluded from investing in the same equity fund for 30 calendar days after the redemption
transaction. This policy also applies to redemptions and purchases that are part of an exchange transaction. Check
writing redemptions from the Davis Government Money Market Fund are excluded from this restriction, as are transactions
that are part of a systematic plan. Certain financial intermediaries, such as 401(k) plan administrators, may apply purchase
and exchange limitations that are different than the limitations discussed above. These limitations may be more or less
restrictive than the limitations imposed by Davis Funds but are designed to detect and prevent excessive trading. Shareholders
should consult their financial
Prospectus | Davis Funds | 55
intermediaries to determine what purchase and exchange limitations may be applicable
to their transactions in Davis Funds through those financial intermediaries. To the extent reasonably feasible, the Funds’ market timing procedures apply to all shareholder accounts and neither Davis Funds nor Davis Advisors have entered into
agreements to exempt any shareholder from application of either Davis Funds’ or a financial intermediary’s market-timing procedures, as applicable.
Davis Funds receive purchase, exchange, and redemption orders from many financial
intermediaries that maintain omnibus accounts with the Funds. Omnibus account arrangements permit financial intermediaries to aggregate their clients’ transactions and ownership positions. If Davis Funds or the Distributor discovers
evidence of material excessive trading in an omnibus account, they may seek the assistance of the financial intermediary to prevent
further excessive trading in the omnibus account. Shareholders seeking to engage in excessive trading practices may
employ a variety of strategies to avoid detection and there can be no assurance that Davis Funds will successfully prevent
all instances of market timing.
If Davis Funds, at their discretion, identify any activity that may constitute frequent
trading, they reserve the right to restrict further trading activity regardless of whether the activity exceeds the Funds' written
guidelines. In applying this policy, Davis Funds reserve the right to consider the trading of multiple accounts under common
ownership, control, or influence to be trading out of a single account.
This policy regarding frequent trading does not apply to the following: (1) purchases
and redemptions of Fund shares by ReFlow in connection with the Fund’s participation in the ReFlow Liquidity Program (see “Non-Principal Investment Strategies and Risks – ReFlow Liquidity Program”); and (2) purchase and sale activity by certain approved third parties who agree to accept redemptions in-kind in lieu of cash in liquidation of Fund shares,
subject to the determination by the Adviser that such purchase and sale activity is in the best interest of Fund shareholders.
Telephone Transactions
A benefit of investing through Davis Funds is that you can use the Funds' automated
telephone system to buy, sell, or exchange shares by calling 1-800-279-0279. IRA shares cannot be sold through the automated telephone system. If you do not
wish to have this option activated for your account, complete the appropriate section
of the Application Form or contact Investor Services.
When you call Davis Funds, you can perform a transaction in one of two ways:
◼
Speak directly with an Investor Services Professional during business hours (9 a.m.
to 6 p.m. Eastern time).
◼
You can use the automated telephone system, 24 hours a day, seven days a week. Class
Y share accounts do not have access to the automated telephone system.
When you buy, sell, or exchange shares by telephone instruction, you agree that Davis
Funds are not liable for following telephone instructions believed to be genuine (that is, believed to be directed by
the account holder, registered representative, or authorized trader whose name is on file). The Funds use certain procedures to confirm
that your instructions are genuine, including a request for personal identification and a tape recording of the conversation.
If these procedures are not used, the Funds may be liable for any loss from unauthorized instructions.
Be aware that during unusual market conditions, Davis Funds may not be able to accept
all requests by telephone.
Internet Transactions
You can use the Funds' website, www.davisfunds.com, to review your account balance
and recent transactions. Your account may qualify for the privilege to buy, sell, or exchange shares online. You may also
elect to receive the summary prospectus, account statements, and annual and semi-annual reports electronically, in lieu of
paper form, by enrolling in eConsent on the Funds' website. Please review the Funds' website for more complete information. Class
Y share accounts cannot be accessed through the Funds' website.
To access your account, you must establish a unique and confidential User ID and Password.
To create your User ID and Password, you will need: (1) the name of the Fund(s) in which you are invested, (2)
your account number, (3) the last four digits of your Social Security Number, and (4) either a cell phone or email for satisfying
the two-factor authentication. Your User ID and Password will be required each time you access your account online.
When you buy, sell, or exchange shares over the Internet, you agree that Davis Funds
are not liable for following instructions believed to be genuine (that is, believed to be directed by the account holder or
registered representative on file). The Funds use certain procedures to confirm that your instructions are genuine. If these procedures
are not used, the Funds may be liable for any loss from unauthorized instructions.
Householding
The Funds may, on occasion, mail notices, reports, prospectuses, or proxy material
to shareholders. To avoid sending duplicate copies of materials to households, the Funds will mail only one copy of these items
to shareholders having the same last name and address on the Funds' records. The consolidation of these mailings, called householding,
benefits the Funds through reduced mailing expense. If you have a direct account with the Funds and you do not
want the mailing of these documents to be combined with those to other members of your household, please contact Davis Funds
by phone at 1-800-279-0279. Your instructions will become effective within 30 days of your notice to the Funds.
Prospectus | Davis Funds | 56
Privacy Notice
While you generally will be dealing with a broker-dealer or other financial adviser,
we may collect information about you from your account application and other forms that you may deliver to us. We use this
information to process your requests and transactions; for example, to provide you with additional information about our
Funds, to open an account for you, or to process a transaction. In order to service your account and execute your transactions,
we may provide your personal information to firms that assist us in servicing your account, such as our transfer
agent. We may also provide your name and address to one of our agents for the purpose of mailing to you your account statement
and other information about our products and services. We may also gather information through the use of “cookies” when you visit our website. These files help us to recognize repeat visitors and allow easy access to and use of the website.
We require these outside firms and agents to protect the confidentiality of your information and to use the information only
for the purpose for which the disclosure is made. We do not provide customer names and addresses to outside firms, organizations,
or individuals except in furtherance of our business relationship with you or as otherwise allowed by law.
We restrict access to non-public personal information about you to those employees
who need to know that information to provide products or services to you. We maintain physical, electronic, and procedural
safeguards that comply with federal standards to guard your personal information.
Financial Highlights
The financial highlights table is intended to help you understand the Funds' financial
performance for the past 5 years ended December 31, 2025. Certain information reflects financial results for a single
Fund share. The total returns in the table represent the rate that an investor would have earned (or lost) on an investment
in the Funds (assuming reinvestment of all dividends and distributions). This information has been derived
from information audited by KPMG LLP, whose report, along with the Funds' financial statements, are included in
the Annual Financial Statements and Other Information, which is available upon request.
Prospectus | Davis Funds | 57
DAVIS SERIES, INC.
The following financial information represents selected data for each share of capital
stock outstanding throughout each period:
|
|
|
|
Income (Loss) from Investment Operations
|
||
|
|
|
Net Asset Value,
Beginning of
Period
|
Net Investment
Income (Loss)a
|
Net Realized
and
Unrealized
Gains
(Losses)
|
Total from
Investment
Operations
|
|
Davis Opportunity Fund Class A:
|
|||||
|
|
Year ended December 31, 2025
|
$36.93
|
$0.33
|
$7.79
|
$8.12
|
|
|
Year ended December 31, 2024
|
$38.11
|
$0.32
|
$4.81
|
$5.13
|
|
|
Year ended December 31, 2023
|
$33.23
|
$0.33
|
$6.90
|
$7.23
|
|
|
Year ended December 31, 2022
|
$41.91
|
$0.28
|
$(6.14)
|
$(5.86)
|
|
|
Year ended December 31, 2021
|
$36.67
|
$0.11
|
$9.00
|
$9.11
|
|
Davis Opportunity Fund Class C:
|
|||||
|
|
Year ended December 31, 2025
|
$24.10
|
$–e
|
$5.06
|
$5.06
|
|
|
Year ended December 31, 2024
|
$26.64
|
$(0.01)
|
$3.41
|
$3.40
|
|
|
Year ended December 31, 2023
|
$23.72
|
$0.03
|
$4.88
|
$4.91
|
|
|
Year ended December 31, 2022
|
$30.92
|
$(0.01)
|
$(4.52)
|
$(4.53)
|
|
|
Year ended December 31, 2021
|
$28.06
|
$(0.18)
|
$6.85
|
$6.67
|
|
Davis Opportunity Fund Class Y:
|
|||||
|
|
Year ended December 31, 2025
|
$40.19
|
$0.47
|
$8.50
|
$8.97
|
|
|
Year ended December 31, 2024
|
$41.02
|
$0.46
|
$5.16
|
$5.62
|
|
|
Year ended December 31, 2023
|
$35.65
|
$0.45
|
$7.41
|
$7.86
|
|
|
Year ended December 31, 2022
|
$44.73
|
$0.40
|
$(6.56)
|
$(6.16)
|
|
|
Year ended December 31, 2021
|
$38.93
|
$0.24
|
$9.54
|
$9.78
|
|
Davis Government Bond Fund Class A:
|
|||||
|
|
Year ended December 31, 2025
|
$5.10
|
$0.15
|
$0.08
|
$0.23
|
|
|
Year ended December 31, 2024
|
$5.05
|
$0.16
|
$0.05
|
$0.21
|
|
|
Year ended December 31, 2023
|
$4.98
|
$0.11
|
$0.08
|
$0.19
|
|
|
Year ended December 31, 2022
|
$5.30
|
$0.02
|
$(0.30)
|
$(0.28)
|
|
|
Year ended December 31, 2021
|
$5.41
|
$–e
|
$(0.08)
|
$(0.08)
|
|
Davis Government Bond Fund Class C:
|
|||||
|
|
Year ended December 31, 2025
|
$5.11
|
$0.11
|
$0.08
|
$0.19
|
|
|
Year ended December 31, 2024
|
$5.06
|
$0.12
|
$0.06
|
$0.18
|
|
|
Year ended December 31, 2023
|
$4.96
|
$0.07
|
$0.08
|
$0.15
|
|
|
Year ended December 31, 2022
|
$5.27
|
$(0.02)
|
$(0.29)
|
$(0.31)
|
|
|
Year ended December 31, 2021
|
$5.39
|
$(0.03)
|
$(0.09)
|
$(0.12)
|
|
Davis Government Bond Fund Class Y:
|
|||||
|
|
Year ended December 31, 2025
|
$5.14
|
$0.16
|
$0.08
|
$0.24
|
|
|
Year ended December 31, 2024
|
$5.09
|
$0.17
|
$0.06
|
$0.23
|
|
|
Year ended December 31, 2023
|
$5.02
|
$0.12
|
$0.08
|
$0.20
|
|
|
Year ended December 31, 2022
|
$5.34
|
$0.04
|
$(0.31)
|
$(0.27)
|
|
|
Year ended December 31, 2021
|
$5.45
|
$0.02
|
$(0.09)
|
$(0.07)
|
|
Davis Government Money Market Fund Class A, Class C and Class Y:
|
|||||
|
|
Year ended December 31, 2025
|
$1.000
|
$0.037
|
$–
|
$0.037
|
|
|
Year ended December 31, 2024
|
$1.000
|
$0.045
|
$–
|
$0.045
|
|
|
Year ended December 31, 2023
|
$1.000
|
$0.043
|
$–
|
$0.043
|
|
|
Year ended December 31, 2022
|
$1.000
|
$0.011
|
$–
|
$0.011
|
|
|
Year ended December 31, 2021
|
$1.000
|
$–h
|
$–
|
$–h
|
|
Davis Financial Fund Class A:
|
|||||
|
|
Year ended December 31, 2025
|
$63.85
|
$0.99
|
$17.69
|
$18.68
|
|
|
Year ended December 31, 2024
|
$51.30
|
$0.99
|
$14.24
|
$15.23
|
|
|
Year ended December 31, 2023
|
$47.71
|
$0.92
|
$6.24
|
$7.16
|
|
|
Year ended December 31, 2022
|
$54.17
|
$0.78
|
$(5.61)
|
$(4.83)
|
|
|
Year ended December 31, 2021
|
$43.93
|
$0.55
|
$13.27
|
$13.82
|
Prospectus | Davis Funds | 58
Financial Highlights
|
Dividends and Distributions
|
|
|
|
Ratios to Average Net Assets
|
|
|||||
|
Dividends
from Net
Investment
Income
|
Distributions
from Realized
Gains
|
Return of
Capital
|
Total
Distributions
|
Net Asset
Value, End
of Period
|
Total
Returnb
|
Net Assets,
End of Period
(in thousands)
|
Gross
Expense
Ratio
|
Net Expense
Ratioc
|
Net
Investment
Income (Loss)
Ratio
|
Portfolio
Turnoverd
|
|
$(0.34)
|
$(5.17)
|
$–
|
$(5.51)
|
$39.54
|
22.02%
|
$325,472
|
0.94%
|
0.94%
|
0.84%
|
18%
|
|
$(0.42)
|
$(5.89)
|
$–
|
$(6.31)
|
$36.93
|
12.78%
|
$298,814
|
0.93%
|
0.93%
|
0.78%
|
23%
|
|
$(0.56)
|
$(1.79)
|
$–
|
$(2.35)
|
$38.11
|
22.12%
|
$293,640
|
0.93%
|
0.93%
|
0.93%
|
9%
|
|
$(0.15)
|
$(2.67)
|
$–
|
$(2.82)
|
$33.23
|
(14.08)%
|
$265,763
|
0.94%
|
0.94%
|
0.78%
|
12%
|
|
$(0.06)
|
$(3.81)
|
$–
|
$(3.87)
|
$41.91
|
24.96%
|
$338,626
|
0.93%
|
0.93%
|
0.27%
|
24%
|
|
|
|
|
|
|
|
|
|
|
|
|
|
$(0.01)
|
$(5.17)
|
$–
|
$(5.18)
|
$23.98
|
21.04%
|
$7,394
|
1.79%
|
1.76%f
|
0.02%
|
18%
|
|
$(0.05)
|
$(5.89)
|
$–
|
$(5.94)
|
$24.10
|
11.85%
|
$8,442
|
1.76%
|
1.75%
|
(0.04)%
|
23%
|
|
$(0.20)
|
$(1.79)
|
$–
|
$(1.99)
|
$26.64
|
21.10%
|
$11,387
|
1.76%
|
1.75%
|
0.11%
|
9%
|
|
$–
|
$(2.67)
|
$–
|
$(2.67)
|
$23.72
|
(14.76)%
|
$12,419
|
1.76%
|
1.75%
|
(0.03)%
|
12%
|
|
$–
|
$(3.81)
|
$–
|
$(3.81)
|
$30.92
|
23.92%
|
$19,048
|
1.75%
|
1.75%
|
(0.55)%
|
24%
|
|
|
|
|
|
|
|
|
|
|
|
|
|
$(0.48)
|
$(5.17)
|
$–
|
$(5.65)
|
$43.51
|
22.35%
|
$267,056
|
0.69%
|
0.69%
|
1.09%
|
18%
|
|
$(0.56)
|
$(5.89)
|
$–
|
$(6.45)
|
$40.19
|
13.06%
|
$233,745
|
0.68%
|
0.68%
|
1.03%
|
23%
|
|
$(0.70)
|
$(1.79)
|
$–
|
$(2.49)
|
$41.02
|
22.41%
|
$225,783
|
0.68%
|
0.68%
|
1.18%
|
9%
|
|
$(0.25)
|
$(2.67)
|
$–
|
$(2.92)
|
$35.65
|
(13.85)%
|
$193,559
|
0.69%
|
0.69%
|
1.03%
|
12%
|
|
$(0.17)
|
$(3.81)
|
$–
|
$(3.98)
|
$44.73
|
25.23%
|
$245,602
|
0.70%
|
0.70%
|
0.50%
|
24%
|
|
|
|
|
|
|
|
|
|
|
|
|
|
$(0.16)
|
$–
|
$–
|
$(0.16)
|
$5.17
|
4.48%
|
$15,809
|
1.51%
|
1.00%
|
2.89%
|
10%
|
|
$(0.16)
|
$–
|
$–
|
$(0.16)
|
$5.10
|
4.28%
|
$15,542
|
1.48%
|
1.00%
|
3.10%
|
–%
|
|
$(0.12)
|
$–
|
$–
|
$(0.12)
|
$5.05
|
3.88%
|
$15,878
|
1.41%
|
1.00%
|
2.26%
|
13%
|
|
$(0.04)
|
$–
|
$–
|
$(0.04)
|
$4.98
|
(5.29)%
|
$17,818
|
1.26%
|
1.00%
|
0.43%
|
3%
|
|
$(0.03)
|
$–
|
$–
|
$(0.03)
|
$5.30
|
(1.48)%
|
$21,719
|
1.17%
|
1.00%
|
0.08%
|
26%
|
|
|
|
|
|
|
|
|
|
|
|
|
|
$(0.12)
|
$–
|
$–
|
$(0.12)
|
$5.18
|
3.69%
|
$313
|
3.21%
|
1.75%
|
2.14%
|
10%
|
|
$(0.13)
|
$–
|
$–
|
$(0.13)
|
$5.11
|
3.50%
|
$638
|
2.90%
|
1.75%
|
2.35%
|
–%
|
|
$(0.05)
|
$–
|
$–
|
$(0.05)
|
$5.06
|
3.12%
|
$439
|
2.81%
|
1.75%
|
1.51%
|
13%
|
|
$–
|
$–
|
$–
|
$–
|
$4.96
|
(5.88)%
|
$542
|
2.84%
|
1.75%
|
(0.32)%
|
3%
|
|
$–
|
$–
|
$–
|
$–
|
$5.27
|
(2.23)%
|
$594
|
2.35%
|
1.75%
|
(0.67)%
|
26%
|
|
|
|
|
|
|
|
|
|
|
|
|
|
$(0.17)
|
$–
|
$–
|
$(0.17)
|
$5.21
|
4.73%
|
$1,032
|
1.44%
|
0.75%
|
3.14%
|
10%
|
|
$(0.18)
|
$–
|
$–
|
$(0.18)
|
$5.14
|
4.54%
|
$1,081
|
1.35%
|
0.75%
|
3.35%
|
–%
|
|
$(0.13)
|
$–
|
$–
|
$(0.13)
|
$5.09
|
4.12%
|
$1,323
|
1.21%
|
0.75%
|
2.51%
|
13%
|
|
$(0.05)
|
$–
|
$–
|
$(0.05)
|
$5.02
|
(5.01)%
|
$3,100
|
0.95%
|
0.75%
|
0.68%
|
3%
|
|
$(0.04)
|
$–
|
$–
|
$(0.04)
|
$5.34
|
(1.22)%
|
$2,096
|
0.97%
|
0.75%
|
0.33%
|
26%
|
|
|
|
|
|
|
|
|
|
|
|
|
|
$(0.037)
|
$–
|
$–
|
$(0.037)
|
$1.000
|
3.74%
|
$99,282
|
0.62%g
|
0.62%g
|
3.67%
|
N/A
|
|
$(0.045)
|
$–
|
$–
|
$(0.045)
|
$1.000
|
4.61%
|
$120,002
|
0.68%g
|
0.68%g
|
4.50%
|
N/A
|
|
$(0.043)
|
$–
|
$–
|
$(0.043)
|
$1.000
|
4.41%
|
$97,869
|
0.69%g
|
0.69%g
|
4.32%
|
N/A
|
|
$(0.011)
|
$–
|
$–
|
$(0.011)
|
$1.000
|
1.12%
|
$123,436
|
0.60%g
|
0.45%g
|
1.04%
|
N/A
|
|
$–h
|
$–
|
$–
|
$–h
|
$1.000
|
0.04%
|
$146,416
|
0.52%
|
0.03%
|
0.04%
|
N/A
|
|
|
|
|
|
|
|
|
|
|
|
|
|
$(1.05)
|
$(2.11)
|
$–
|
$(3.16)
|
$79.37
|
29.29%
|
$606,801
|
0.94%
|
0.94%
|
1.39%
|
10%
|
|
$(1.01)
|
$(1.67)
|
$–
|
$(2.68)
|
$63.85
|
29.55%
|
$481,925
|
0.94%
|
0.94%
|
1.69%
|
2%
|
|
$(1.01)
|
$(2.56)
|
$–
|
$(3.57)
|
$51.30
|
15.52%
|
$393,011
|
0.95%
|
0.95%
|
1.90%
|
2%
|
|
$(0.81)
|
$(0.82)
|
$–
|
$(1.63)
|
$47.71
|
(8.91)%
|
$378,784
|
0.95%
|
0.95%
|
1.57%
|
10%
|
|
$(0.64)
|
$(2.94)
|
$–
|
$(3.58)
|
$54.17
|
31.46%
|
$450,121
|
0.94%
|
0.94%
|
1.00%
|
9%
|
Prospectus | Davis Funds | 59
DAVIS SERIES, INC.
The following financial information represents selected data for each share of capital
stock outstanding throughout each period:
|
|
|
|
Income (Loss) from Investment Operations
|
||
|
|
|
Net Asset Value,
Beginning of
Period
|
Net Investment
Income (Loss)a
|
Net Realized and
Unrealized Gains
(Losses)
|
Total from
Investment
Operations
|
|
Davis Financial Fund Class C:
|
|||||
|
|
Year ended December 31, 2025
|
$48.92
|
$0.34
|
$13.47
|
$13.81
|
|
|
Year ended December 31, 2024
|
$39.65
|
$0.41
|
$10.95
|
$11.36
|
|
|
Year ended December 31, 2023
|
$37.44
|
$0.43
|
$4.83
|
$5.26
|
|
|
Year ended December 31, 2022
|
$42.70
|
$0.31
|
$(4.42)
|
$(4.11)
|
|
|
Year ended December 31, 2021
|
$35.12
|
$0.10
|
$10.59
|
$10.69
|
|
Davis Financial Fund Class Y:
|
|||||
|
|
Year ended December 31, 2025
|
$66.55
|
$1.22
|
$18.46
|
$19.68
|
|
|
Year ended December 31, 2024
|
$53.41
|
$1.18
|
$14.82
|
$16.00
|
|
|
Year ended December 31, 2023
|
$49.56
|
$1.07
|
$6.50
|
$7.57
|
|
|
Year ended December 31, 2022
|
$56.24
|
$0.94
|
$(5.84)
|
$(4.90)
|
|
|
Year ended December 31, 2021
|
$45.52
|
$0.70
|
$13.75
|
$14.45
|
|
Davis Balanced Fund Class A:
|
|||||
|
|
Year ended December 31, 2025
|
$58.80
|
$1.10
|
$11.40
|
$12.50
|
|
|
Year ended December 31, 2024
|
$54.48
|
$0.95
|
$7.69
|
$8.64
|
|
|
Year ended December 31, 2023
|
$45.65
|
$0.77
|
$9.65
|
$10.42
|
|
|
Year ended December 31, 2022
|
$55.56
|
$0.43
|
$(9.14)
|
$(8.71)
|
|
|
Year ended December 31, 2021
|
$44.32
|
$0.22
|
$11.18
|
$11.40
|
|
Davis Balanced Fund Class C:
|
|||||
|
|
Year ended December 31, 2025
|
$58.60
|
$0.59
|
$11.35
|
$11.94
|
|
|
Year ended December 31, 2024
|
$54.30
|
$0.48
|
$7.67
|
$8.15
|
|
|
Year ended December 31, 2023
|
$45.51
|
$0.39
|
$9.61
|
$10.00
|
|
|
Year ended December 31, 2022
|
$55.46
|
$0.06
|
$(9.10)
|
$(9.04)
|
|
|
Year ended December 31, 2021
|
$44.45
|
$(0.17)
|
$11.18
|
$11.01
|
|
Davis Balanced Fund Class Y:
|
|||||
|
|
Year ended December 31, 2025
|
$59.08
|
$1.29
|
$11.47
|
$12.76
|
|
|
Year ended December 31, 2024
|
$54.72
|
$1.16
|
$7.71
|
$8.87
|
|
|
Year ended December 31, 2023
|
$45.85
|
$0.93
|
$9.69
|
$10.62
|
|
|
Year ended December 31, 2022
|
$55.80
|
$0.59
|
$(9.18)
|
$(8.59)
|
|
|
Year ended December 31, 2021
|
$44.51
|
$0.38
|
$11.23
|
$11.61
|
|
Davis Real Estate Fund Class A:
|
|||||
|
|
Year ended December 31, 2025
|
$42.03
|
$0.97
|
$(3.34)
|
$(2.37)
|
|
|
Year ended December 31, 2024
|
$41.67
|
$0.94
|
$1.07
|
$2.01
|
|
|
Year ended December 31, 2023
|
$38.64
|
$0.89
|
$3.08
|
$3.97
|
|
|
Year ended December 31, 2022
|
$55.53
|
$0.77
|
$(15.60)
|
$(14.83)
|
|
|
Year ended December 31, 2021
|
$39.23
|
$0.42
|
$16.46
|
$16.88
|
|
Davis Real Estate Fund Class C:
|
|||||
|
|
Year ended December 31, 2025
|
$42.01
|
$0.74
|
$(3.42)
|
$(2.68)
|
|
|
Year ended December 31, 2024
|
$41.67
|
$0.66
|
$1.02
|
$1.68
|
|
|
Year ended December 31, 2023
|
$38.64
|
$0.60
|
$3.08
|
$3.68
|
|
|
Year ended December 31, 2022
|
$55.51
|
$0.40
|
$(15.58)
|
$(15.18)
|
|
|
Year ended December 31, 2021
|
$39.23
|
$0.05
|
$16.43
|
$16.48
|
Prospectus | Davis Funds | 60
Financial Highlights - (Continued)
|
Dividends and Distributions
|
|
|
|
Ratios to Average Net Assets
|
|
|||||
|
Dividends
from Net
Investment
Income
|
Distributions
from Realized
Gains
|
Return of
Capital
|
Total
Distributions
|
Net Asset
Value, End
of Period
|
Total
Returnb
|
Net Assets,
End of
Period
(in thousands)
|
Gross
Expense
Ratio
|
Net Expense
Ratioc
|
Net
Investment
Income (Loss)
Ratio
|
Portfolio
Turnoverd
|
|
$(0.37)
|
$(2.11)
|
$–
|
$(2.48)
|
$60.25
|
28.26%
|
$34,097
|
1.74%
|
1.74%
|
0.59%
|
10%
|
|
$(0.42)
|
$(1.67)
|
$–
|
$(2.09)
|
$48.92
|
28.52%
|
$39,875
|
1.74%
|
1.74%
|
0.89%
|
2%
|
|
$(0.49)
|
$(2.56)
|
$–
|
$(3.05)
|
$39.65
|
14.61%
|
$44,784
|
1.74%
|
1.74%
|
1.11%
|
2%
|
|
$(0.33)
|
$(0.82)
|
$–
|
$(1.15)
|
$37.44
|
(9.61)%
|
$60,375
|
1.73%
|
1.73%
|
0.79%
|
10%
|
|
$(0.17)
|
$(2.94)
|
$–
|
$(3.11)
|
$42.70
|
30.44%
|
$79,368
|
1.71%
|
1.71%
|
0.23%
|
9%
|
|
|
|
|
|
|
|
|
|
|
|
|
|
$(1.27)
|
$(2.11)
|
$–
|
$(3.38)
|
$82.85
|
29.61%
|
$569,978
|
0.69%
|
0.69%
|
1.64%
|
10%
|
|
$(1.19)
|
$(1.67)
|
$–
|
$(2.86)
|
$66.55
|
29.83%
|
$490,580
|
0.71%
|
0.71%
|
1.92%
|
2%
|
|
$(1.16)
|
$(2.56)
|
$–
|
$(3.72)
|
$53.41
|
15.79%
|
$368,515
|
0.73%
|
0.73%
|
2.12%
|
2%
|
|
$(0.96)
|
$(0.82)
|
$–
|
$(1.78)
|
$49.56
|
(8.70)%
|
$404,375
|
0.72%
|
0.72%
|
1.80%
|
10%
|
|
$(0.79)
|
$(2.94)
|
$–
|
$(3.73)
|
$56.24
|
31.76%
|
$496,530
|
0.70%
|
0.70%
|
1.24%
|
9%
|
|
|
|
|
|
|
|
|
|
|
|
|
|
$(1.11)
|
$(3.20)
|
$–
|
$(4.31)
|
$66.99
|
21.37%
|
$146,795
|
0.98%
|
0.98%
|
1.72%
|
12%
|
|
$(0.95)
|
$(3.37)
|
$–
|
$(4.32)
|
$58.80
|
15.86%
|
$131,134
|
0.98%
|
0.98%
|
1.61%
|
20%
|
|
$(0.78)
|
$(0.81)
|
$–
|
$(1.59)
|
$54.48
|
22.98%
|
$119,934
|
1.00%
|
1.00%
|
1.55%
|
15%
|
|
$(0.50)
|
$(0.70)
|
$–
|
$(1.20)
|
$45.65
|
(15.64)%
|
$104,140
|
1.00%
|
1.00%
|
0.88%
|
9%
|
|
$(0.16)
|
$–
|
$–
|
$(0.16)
|
$55.56
|
25.73%
|
$128,558
|
0.98%
|
0.98%
|
0.41%
|
19%
|
|
|
|
|
|
|
|
|
|
|
|
|
|
$(0.61)
|
$(3.20)
|
$–
|
$(3.81)
|
$66.73
|
20.41%
|
$2,856
|
1.95%
|
1.75%
|
0.95%
|
12%
|
|
$(0.48)
|
$(3.37)
|
$–
|
$(3.85)
|
$58.60
|
15.00%
|
$2,784
|
1.97%
|
1.75%
|
0.84%
|
20%
|
|
$(0.40)
|
$(0.81)
|
$–
|
$(1.21)
|
$54.30
|
22.05%
|
$2,562
|
1.99%
|
1.75%
|
0.80%
|
15%
|
|
$(0.21)
|
$(0.70)
|
$–
|
$(0.91)
|
$45.51
|
(16.28)%
|
$2,179
|
1.97%
|
1.75%
|
0.13%
|
9%
|
|
$–
|
$–
|
$–
|
$–
|
$55.46
|
24.77%
|
$3,538
|
1.89%
|
1.75%
|
(0.36)%
|
19%
|
|
|
|
|
|
|
|
|
|
|
|
|
|
$(1.31)
|
$(3.20)
|
$–
|
$(4.51)
|
$67.33
|
21.74%
|
$147,627
|
0.67%
|
0.67%
|
2.03%
|
12%
|
|
$(1.14)
|
$(3.37)
|
$–
|
$(4.51)
|
$59.08
|
16.23%
|
$117,784
|
0.67%
|
0.67%
|
1.92%
|
20%
|
|
$(0.94)
|
$(0.81)
|
$–
|
$(1.75)
|
$54.72
|
23.35%
|
$97,842
|
0.68%
|
0.68%
|
1.87%
|
15%
|
|
$(0.66)
|
$(0.70)
|
$–
|
$(1.36)
|
$45.85
|
(15.37)%
|
$78,348
|
0.68%
|
0.68%
|
1.20%
|
9%
|
|
$(0.32)
|
$–
|
$–
|
$(0.32)
|
$55.80
|
26.13%
|
$96,889
|
0.66%
|
0.66%
|
0.73%
|
19%
|
|
|
|
|
|
|
|
|
|
|
|
|
|
$(1.05)
|
$(1.55)
|
$–
|
$(2.60)
|
$37.06
|
(5.72)%
|
$65,590
|
1.02%
|
1.00%
|
2.37%
|
17%
|
|
$(0.81)
|
$(0.84)
|
$–
|
$(1.65)
|
$42.03
|
4.89%
|
$80,499
|
1.02%
|
1.00%
|
2.23%
|
16%
|
|
$(0.94)
|
$–
|
$–
|
$(0.94)
|
$41.67
|
10.46%
|
$84,350
|
1.00%
|
1.00%
|
2.26%
|
14%
|
|
$(0.74)
|
$(1.32)
|
$–
|
$(2.06)
|
$38.64
|
(26.74)%
|
$99,332
|
0.95%
|
0.95%
|
1.65%
|
22%
|
|
$(0.58)
|
$–
|
$–
|
$(0.58)
|
$55.53
|
43.24%
|
$152,743
|
0.95%
|
0.95%
|
0.88%
|
25%
|
|
|
|
|
|
|
|
|
|
|
|
|
|
$(0.75)
|
$(1.55)
|
$–
|
$(2.30)
|
$37.03
|
(6.45)%
|
$420
|
2.39%
|
1.75%
|
1.62%
|
17%
|
|
$(0.50)
|
$(0.84)
|
$–
|
$(1.34)
|
$42.01
|
4.09%
|
$764
|
2.13%
|
1.75%
|
1.48%
|
16%
|
|
$(0.65)
|
$–
|
$–
|
$(0.65)
|
$41.67
|
9.60%
|
$1,711
|
2.00%
|
1.75%
|
1.51%
|
14%
|
|
$(0.37)
|
$(1.32)
|
$–
|
$(1.69)
|
$38.64
|
(27.32)%
|
$2,277
|
1.93%
|
1.75%
|
0.85%
|
22%
|
|
$(0.20)
|
$–
|
$–
|
$(0.20)
|
$55.51
|
42.10%
|
$4,000
|
1.87%
|
1.75%
|
0.08%
|
25%
|
Prospectus | Davis Funds | 61
DAVIS SERIES, INC.
The following financial information represents selected data for each share of capital
stock outstanding throughout each period:
|
|
|
|
Income (Loss) from Investment Operations
|
||
|
|
|
Net Asset Value,
Beginning of
Period
|
Net Investment
Income (Loss)a
|
Net Realized
and
Unrealized Gains
(Losses)
|
Total from
Investment
Operations
|
|
Davis Real Estate Fund Class Y:
|
|||||
|
|
Year ended December 31, 2025
|
$42.66
|
$1.08
|
$(3.37)
|
$(2.29)
|
|
|
Year ended December 31, 2024
|
$42.28
|
$1.06
|
$1.10
|
$2.16
|
|
|
Year ended December 31, 2023
|
$39.20
|
$0.97
|
$3.16
|
$4.13
|
|
|
Year ended December 31, 2022
|
$56.31
|
$0.88
|
$(15.81)
|
$(14.93)
|
|
|
Year ended December 31, 2021
|
$39.78
|
$0.52
|
$16.71
|
$17.23
|
a
Per share calculations were based on average shares outstanding for the period (other
than Davis Government Money Market Fund).
b
Assumes hypothetical initial investment on the business day before the first day of
the fiscal period, with all dividends and distributions reinvested in additional shares on the reinvestment date, and redemption at the net asset value
calculated on the last business day of the fiscal period. Sales charges are not reflected in the total returns.
c
The ratios in this column reflect the impact, if any, of certain reimbursements and/or
waivers from the Adviser.
d
The lesser of purchases or sales of portfolio securities for a period, divided by
the monthly average of the fair value of portfolio securities owned during the period. Securities with a maturity or expiration date at the time of acquisition
of one year or less are excluded from the calculation.
Prospectus | Davis Funds | 62
Financial Highlights - (Continued)
|
Dividends and Distributions
|
|
|
|
Ratios to Average Net Assets
|
|
|||||
|
Dividends
from Net
Investment
Income
|
Distributions
from Realized
Gains
|
Return of
Capital
|
Total
Distributions
|
Net Asset
Value, End
of Period
|
Total
Returnb
|
Net Assets,
End of
Period
(in thousands)
|
Gross
Expense
Ratio
|
Net
Expense
Ratioc
|
Net
Investment
Income (Loss)
Ratio
|
Portfolio
Turnoverd
|
|
$(1.18)
|
$(1.55)
|
$–
|
$(2.73)
|
$37.64
|
(5.47)%
|
$58,214
|
0.74%
|
0.74%
|
2.63%
|
17%
|
|
$(0.94)
|
$(0.84)
|
$–
|
$(1.78)
|
$42.66
|
5.17%
|
$69,294
|
0.74%
|
0.74%
|
2.49%
|
16%
|
|
$(1.05)
|
$–
|
$–
|
$(1.05)
|
$42.28
|
10.75%
|
$73,988
|
0.75%
|
0.75%
|
2.51%
|
14%
|
|
$(0.86)
|
$(1.32)
|
$–
|
$(2.18)
|
$39.20
|
(26.56)%
|
$79,048
|
0.72%
|
0.72%
|
1.88%
|
22%
|
|
$(0.70)
|
$–
|
$–
|
$(0.70)
|
$56.31
|
43.56%
|
$103,411
|
0.72%
|
0.72%
|
1.11%
|
25%
|
e
Less than $0.005 per share.
f
Includes tax service fees paid to third party providers that assist in the recovery
of foreign withholding tax refunds. Excluding the tax service fees, the net expense ratio for the year ended December 31, 2025 would have been 1.75%.
g
Includes the recapture of expenses reimbursed from prior fiscal years. Excluding the
recapture of prior reimbursed expenses, the gross and net expense ratios for the year ended December 31, 2025 would have both been 0.60%, for the year
ended December 31, 2024 would have both been 0.58%, for the year ended December 31, 2023 would have both been 0.59%, and for the year ended December
31, 2022 would have been 0.55% and 0.40%, respectively.
h
Less than $0.0005 per share.
Prospectus | Davis Funds | 63
Appendix A:
Intermediary-Specific Sales Charge Waivers and Discounts
Intermediary-Specific Sales Charge Waivers and Discounts
The availability of certain initial and contingent deferred sales charge waivers and
discounts may depend on the particular financial intermediary or type of account through which you purchase or hold Fund
shares. Financial intermediaries may have different policies and procedures regarding the availability of these waivers and
discounts. As one example, group retirement plan recordkeeping platforms of certain broker-dealer intermediaries that hold Class
C shares of a fund in an omnibus account may not track participant level share lot aging and, for this reason, those Class
C shares would not satisfy the conditions for the conversion discussed elsewhere in this prospectus. For waivers or discounts not
available through a particular intermediary, investors will have to purchase shares directly from the Distributor or through another
intermediary to receive such waivers or discounts to the extent such a waiver or discount is available. The following descriptions
of sales charge waivers and discounts for a particular financial intermediary and class(es) of shares are reproduced based
on information provided by the financial intermediary that the intermediary has represented is current with respect to sales
charge waivers or discounts in effect. These waivers or discounts, which may vary from those disclosed elsewhere in the prospectus
or SAI, are subject to change and this Appendix will be updated based on information provided by the financial intermediaries.
Neither the Fund, Davis Advisors, nor Davis Distributors, LLC supervises the implementation of these waivers or discounts or verifies the intermediaries’ administration of these waivers or discounts. An investor should speak with their
applicable intermediary to ensure that they understand the steps that must be taken in order to qualify for any available waiver
or discount.
The following financial intermediaries (or their affiliates) have entered into an
agreement with the Distributor and have been approved by the Distributor to offer Class A Shares without a sales charge to self-directed
brokerage accounts that may or may not charge a transaction fee.
In all instances, it is the purchaser’s responsibility to notify the financial intermediary of any facts that may qualify the purchaser for sales charge waivers or discounts. Please contact your financial intermediary
for more information.
Merrill
Purchases or sales of front-end (for example, Class A) or level-load (for example,
Class C) mutual fund shares through a Merrill platform or account will be eligible only for the following sales load waivers
(front-end, contingent deferred, or back-end waivers) and discounts, which differ from those disclosed elsewhere in this Fund’s prospectus. Purchasers will have to buy mutual fund shares directly from the mutual fund company or through another intermediary
to be eligible for waivers or discounts not listed below.
It is the client’s responsibility to notify Merrill at the time of purchase or sale of any relationship or other facts that qualify the transaction for a waiver or discount. A Merrill representative may ask for reasonable
documentation of such facts and Merrill may condition the granting of a waiver or discount on the timely receipt of such documentation.
Additional information on waivers, discounts, and share class exchanges is available
in the Merrill Sales Load Waiver and Discounts Supplement (the “Merrill SLWD Supplement”) and in the Mutual Fund Investing at Merrill pamphlet at ml.com/funds. Clients are encouraged to review these documents and speak with their financial advisor
to determine whether a transaction is eligible for a waiver or discount.
Front-end Load Waivers Available at Merrill
◼
Shares of mutual funds available for purchase by employer-sponsored retirement, deferred
compensation, and employee benefit plans (including health savings accounts) and trusts used to fund those plans
provided the shares are not held in a commission-based brokerage account and shares are held for the benefit of the plan.
For purposes of this provision, employer-sponsored retirement plans do not include SEP IRAs, Simple IRAs, SAR-SEPs
or Keogh plans
◼
Shares purchased through a Merrill investment advisory program
◼
Brokerage class shares exchanged from advisory class shares due to the holdings moving
from a Merrill investment advisory program to a Merrill brokerage account
◼
Shares purchased through the Merrill Edge Self-Directed platform
◼
Shares purchased through the systematic reinvestment of capital gains distributions
and dividend reinvestment when purchasing shares of the same mutual fund in the same account
◼
Shares exchanged from level-load shares to front-end load shares of the same mutual
fund in accordance with the description in the Merrill SLWD Supplement
◼
Shares purchased by eligible employees of Merrill or its affiliates and their family
members who purchase shares in accounts within the employee’s Merrill Household (as defined in the Merrill SLWD Supplement) Shares purchased by eligible persons associated with the fund as defined in this prospectus (e.g., the fund’s officers or trustees)
◼
Shares purchased from the proceeds of a mutual fund redemption in front-end load shares
provided (1) the repurchase is in a mutual fund within the same fund family; (2) the repurchase occurs within 90 calendar
days from the redemption trade
Prospectus | Davis Funds | 64
date, and (3) the redemption and purchase occur in the same account (known as Rights
of Reinstatement). Automated transactions (i.e., systematic purchases and withdrawals) and purchases made after
shares are automatically sold to pay Merrill’s account maintenance fees are not eligible for Rights of Reinstatement
Contingent Deferred Sales Charge (“CDSC”) Waivers on Front-end, Back-end, and Level Load Shares Available at Merrill
◼
Shares sold due to the client’s death or disability (as defined by Internal Revenue Code Section 22e(3))
◼
Shares sold pursuant to a systematic withdrawal program subject to Merrill’s maximum systematic withdrawal limits as described in the Merrill SLWD Supplement
◼
Shares sold due to return of excess contributions from an IRA account
◼
Shares sold as part of a required minimum distribution for IRA and retirement accounts
due to the investor reaching the qualified age based on applicable IRS regulation
◼
Front-end or level-load shares held in commission-based, non-taxable retirement brokerage
accounts (e.g., traditional, Roth, rollover, SEP IRAs, Simple IRAs, SAR-SEPs or Keogh plans) that are transferred
to fee-based accounts or platforms and exchanged for a lower cost share class of the same mutual fund
Front-end Load Discounts Available at Merrill: Breakpoints, Rights of Accumulation
& Letters of Intent
◼
Breakpoint discounts, as described in this prospectus, where the sales load is at
or below the maximum sales load that Merrill permits to be assessed to a front-end load purchase, as described in the Merrill
SLWD Supplement
◼
Rights of Accumulation (ROA), as described in the Merrill SLWD Supplement, which entitle
clients to breakpoint discounts based on the aggregated holdings of mutual fund family assets held in accounts
in their Merrill Household
◼
On or about May 1, 2026, assets not held at Merrill will no longer be included in
the ROA calculation. For more detail on the timing and calculation, please refer to the Merrill SLWD Supplement.
◼
Letters of Intent (LOI), which allow for breakpoint discounts on eligible new purchases
based on anticipated future eligible purchases within a fund family at Merrill, in accounts within your Merrill Household,
as further described in the Merrill SLWD Supplement
◼
On or about May 1, 2026, Merrill will no longer accept new LOIs. For more detail on
the timing, please refer to the Merrill SLWD Supplement.
Morgan Stanley Wealth Management
Shareholders purchasing Fund shares through a Morgan Stanley Wealth Management transactional
brokerage account will be eligible only for the following front-end sales charge waivers with respect to Class
A shares, which may differ from and may be more limited than those disclosed elsewhere in this Fund’s Prospectus or SAI.
◼
Employer-sponsored retirement plans (e.g., 401(k) plans, 457 plans, profit sharing
and money purchase pension plans and defined benefit plans). For purposes of this provision, employer-sponsored retirement
plans do not include SEP IRAs, SIMPLE IRAs, SAR-SEPs or Keogh plans
◼
Morgan Stanley employee and employee-related accounts according to Morgan Stanley’s account linking rules
◼
Shares purchased through reinvestment of dividends and capital gains distributions
when purchasing shares of the same fund
◼
Shares purchased through a Morgan Stanley self-directed brokerage account
◼
Class C (i.e., level-load) shares that are no longer subject to a contingent deferred
sales charge and are converted to Class A shares of the same fund pursuant to Morgan Stanley Wealth Management’s share class conversion program
◼
Shares purchased from the proceeds of redemptions within the same fund family, provided
(1) the repurchase occurs within 90 days following the redemption, (2) the redemption and purchase occur in the same
account, and (3) redeemed shares were subject to a front-end or deferred sales charge
Ameriprise Financial
Front-end sales charge reductions on Class A shares purchased through Ameriprise Financial
Shareholders purchasing Class A shares of the fund through an Ameriprise Financial
platform or account are eligible only for the following sales charge reductions, which may differ from those disclosed elsewhere
in this prospectus or the SAI. Such shareholders can reduce their initial sales charge on the purchase of Class A shares
as follows:
◼
Transaction size breakpoints, as described in this prospectus or the SAI.
◼
Rights of accumulation (ROA), as described in this prospectus or the SAI.
Prospectus | Davis Funds | 65
◼
Letter of intent, as described in this prospectus or the SAI.
Front-end sales charge waivers on Class A shares purchased through Ameriprise Financial
Shareholders purchasing Class A shares of the fund through an Ameriprise Financial
platform or account are eligible only for the following sales charge waivers, which may differ from those disclosed elsewhere
in this prospectus or the SAI. Such shareholders may purchase Class A shares at NAV without payment of a sales charge
as follows:
◼
shares purchased by employer-sponsored retirement plans (e.g., 401(k) plans, 457 plans,
employer-sponsored 403(b) plans, profit sharing and money purchase pension plans and defined benefit plans). For purposes
of this provision, employer-sponsored retirement plans do not include SEP IRAs, Simple IRAs or SAR-SEPs.
◼
shares purchased through reinvestment of capital gains and dividend reinvestment when
purchasing shares of the same fund (but not any other fund within the same fund family).
◼
shares exchanged from Class C shares of the same fund in the month of or following
the seven-year anniversary of the purchase date. To the extent that this prospectus elsewhere provides for a waiver
with respect to such shares following a shorter holding period, that waiver will apply to exchanges following such shorter
period. To the extent that this prospectus elsewhere provides for a waiver with respect to exchanges of Class C shares for load
waived shares, that waiver will also apply to such exchanges.
◼
shares purchased by employees and registered representatives of Ameriprise Financial
or its affiliates and their immediate family members.
◼
shares purchased by or through qualified accounts (including IRAs, Coverdell Education
Savings Accounts, 401(k)s, 403(b) TSCAs subject to ERISA and defined benefit plans) that are held by a covered
family member, defined as an Ameriprise Financial advisor and/or the advisor’s spouse, advisor’s lineal ascendant (mother, father, grandmother, grandfather, great grandmother, great grandfather), advisor’s lineal descendant (son, step-son, daughter, step-daughter, grandson, granddaughter, great grandson, great granddaughter) or any spouse of a covered
family member who is a lineal descendant.
◼
shares purchased from the proceeds of redemptions within the same fund family, provided
(1) the repurchase occurs within 90 days following the redemption, (2) the redemption and purchase occur in the same
account, and (3) redeemed shares were subject to a front-end or deferred sales load (i.e. Rights of Reinstatement).
CDSC waivers on Class A and C shares purchased through Ameriprise Financial
Fund shares purchased through an Ameriprise Financial platform or account are eligible
only for the following CDSC waivers, which may differ from those disclosed elsewhere in this prospectus or the SAI:
◼
redemptions due to death or disability of the shareholder
◼
shares sold as part of a systematic withdrawal plan as described in this prospectus
or the SAI
◼
redemptions made in connection with a return of excess contributions from an IRA account
◼
shares purchased through a Right of Reinstatement (as defined above)
◼
redemptions made as part of a required minimum distribution for IRA and retirement
accounts pursuant to the Internal Revenue Code
Raymond James
Intermediary-Defined Sales Charge Waiver Policies
The availability of certain initial or deferred sales charge waivers and discounts
may depend on the particular financial intermediary or type of account through which you purchase or hold Fund shares.
Intermediaries may have different policies and procedures regarding the availability
of front-end sales load waivers or contingent deferred (back-end) sales load (“CDSC”) waivers, which are discussed below. In all instances, it is the purchaser’s responsibility to notify the fund or the purchaser’s financial intermediary at the time of purchase of any relationship or other facts qualifying the purchaser for sales charge waivers or discounts. For waivers
and discounts not available through a particular intermediary, shareholders will have to purchase fund shares directly from
the fund or through another intermediary to receive these waivers or discounts.
Raymond James & Associates, Inc., Raymond James Financial Services, Inc. and each entity’s affiliates (“Raymond James”)
Shareholders purchasing fund shares through a Raymond James platform or account, or
through an introducing broker-dealer or independent registered investment adviser for which Raymond James provides trade
execution, clearance, and/or custody services, will be eligible only for the following load waivers (front-end sales charge
waivers and contingent deferred, or backend, sales charge waivers) and discounts, which may differ from those disclosed elsewhere in this fund’s prospectus or SAI.
Prospectus | Davis Funds | 66
Front-end sales load waivers on Class A shares available at Raymond James
◼
Shares purchased in an investment advisory program.
◼
Shares purchased within the same fund family through a systematic reinvestment of
capital gains and dividend distributions.
◼
Employees and registered representatives of Raymond James or its affiliates and their
family members as designated by Raymond James.
◼
Shares purchased from the proceeds of redemptions within the same fund family, provided
(1) the repurchase occurs within 90 days following the redemption, (2) the redemption and purchase occur in the same
account, and (3) redeemed shares were subject to a front-end or deferred sales load (known as Rights of Reinstatement).
◼
A shareholder in the Fund’s Class C shares will have their shares converted at net asset value to Class A shares (or the appropriate share class) of the Fund if the shares are no longer subject to a CDSC
and the conversion is in line with the policies and procedures of Raymond James.
CDSC Waivers on Classes A and C shares available at Raymond James
◼
Death or disability of the shareholder.
◼
Shares sold as part of a systematic withdrawal plan as described in the fund’s prospectus.
◼
Return of excess contributions from an IRA Account.
◼
Shares sold as part of a required minimum distribution for IRA and retirement accounts
due to the shareholder reaching the qualified age based on applicable IRS regulations.
◼
Shares sold to pay Raymond James fees but only if the transaction is initiated by
Raymond James.
◼
Shares acquired through a right of reinstatement.
Front-end load discounts available at Raymond James: breakpoints, rights of accumulation,
and/or letter of intent
◼
Breakpoints as described in this prospectus.
◼
Rights of accumulation which entitle shareholders to breakpoint discounts will be
automatically calculated based on the aggregated holding of fund family assets held by accounts within the purchaser’s household at Raymond James. Eligible fund family assets not held at Raymond James may be included in the calculation of
rights of accumulation only if the shareholder notifies his or her financial advisor about such assets.
◼
Letters of intent which allow for breakpoint discounts based on anticipated purchases
within a fund family, over a 13-month time period. Eligible fund family assets not held at Raymond James may be included
in the calculation of letters of intent only if the shareholder notifies his or her financial advisor about such assets.
UBS Financial Services Inc.
UBS may sell Class Y shares to its retail brokerage clients without a sales charge,
load, or 12b-1 distribution/service fee. UBS may charge commissions to its clients with respect to brokerage transactions in Class
Y shares. Minimum purchase amounts are waived in such accounts.
Janney Montgomery Scott LLC
If you purchase fund shares through a Janney Montgomery Scott LLC (“Janney”) brokerage account, you will be eligible for the following load waivers (front-end sales charge waivers and contingent deferred sales charge (“CDSC”), or back-end sales charge, waivers) and discounts, which may differ from those disclosed elsewhere in this fund’s Prospectus or SAI.
Front-end sales charge* waivers on Class A shares available at Janney
◼
Shares purchased through reinvestment of capital gains distributions and dividend
reinvestment when purchasing shares of the same fund (but not any other fund within the fund family).
◼
Shares purchased by employees and registered representatives of Janney or its affiliates
and their family members as designated by Janney.
◼
Shares purchased from the proceeds of redemptions within the same fund family, provided
(1) the repurchase occurs within ninety (90) days following the redemption, (2) the redemption and purchase occur in
the same account, and (3) redeemed shares were subject to a front-end or deferred sales load (i.e., right of reinstatement).
◼
Employer-sponsored retirement plans (e.g., 401(k) plans, 457 plans, employer-sponsored
403(b) plans, profit sharing and money purchase pension plans and defined benefit plans). For purposes of this provision,
employer-sponsored retirement plans do not include SEP IRAs, SIMPLE IRAs, SAR-SEPs or Keogh plans.
◼
Shares acquired through a right of reinstatement.
Prospectus | Davis Funds | 67
◼
Class C shares that are no longer subject to a contingent deferred sales charge and
are converted to Class A shares of the same fund pursuant to Janney’s policies and procedures.
CDSC waivers on Class A and C shares available at Janney
◼
Shares sold upon the death or disability of the shareholder.
◼
Shares sold as part of a systematic withdrawal plan as described in the fund’s Prospectus.
◼
Shares purchased in connection with a return of excess contributions from an IRA account.
◼
Shares sold as part of a required minimum distribution for IRA and retirement accounts
due to the shareholder reaching the qualified age based on applicable IRS regulations.
◼
Shares sold to pay Janney fees but only if the transaction is initiated by Janney.
◼
Shares acquired through a right of reinstatement.
◼
Shares exchanged into the same share class of a different fund.
Front-end sales charge* discounts available at Janney: breakpoints, rights of accumulation,
and/or letters of intent
◼
Breakpoints as described in the fund’s Prospectus.
◼
Rights of accumulation (“ROA”), which entitle shareholders to breakpoint discounts, will be automatically calculated based on the aggregated holding of fund family assets held by accounts within the purchaser’s household at Janney. Eligible fund family assets not held at Janney may be included in the ROA calculation
only if the shareholder notifies his or her financial advisor about such assets.
◼
Letters of intent which allow for breakpoint discounts based on anticipated purchases
within a fund family, over a 13-month time period. Eligible fund family assets not held at Janney Montgomery Scott
may be included in the calculation of letters of intent only if the shareholder notifies his or her financial advisor about
such assets.
*Also referred to as an “initial sales charge.”
Edward D. Jones & Co., L.P. (“Edward Jones”)
Policies Regarding Transactions Through Edward Jones
The following information has been provided by Edward Jones:
The following information supersedes prior information with respect to transactions
and positions held in fund shares through an Edward Jones system. Clients of Edward Jones (also referred to as “shareholders”) purchasing fund shares on the Edward Jones commission and fee-based platforms are eligible only for the following sales
charge discounts (also referred to as “breakpoints”) and waivers, which can differ from discounts and waivers described elsewhere in the mutual fund prospectus or statement of additional information (“SAI”) or through another broker-dealer. In all instances, it is the shareholder’s responsibility to inform Edward Jones at the time of purchase of any relationship,
holdings of Davis Funds, or other facts qualifying the purchaser for discounts or waivers. Edward Jones can ask for documentation
of such circumstance. Shareholders should contact Edward Jones if they have questions regarding their eligibility
for these discounts and waivers.
Breakpoints
◼
•Breakpoint pricing, otherwise known as volume pricing, at dollar thresholds as described
in the prospectus.
Rights of Accumulation (“ROA”)
◼
The applicable sales charge on a purchase of Class A shares is determined by taking
into account all share classes (except certain money market funds and any assets held in group retirement plans) of Davis
Funds held by the shareholder or in an account grouped by Edward Jones with other accounts for the purpose of providing certain pricing considerations (“pricing groups”). If grouping assets as a shareholder, this includes all share classes held on the Edward Jones platform and/or held on another platform. The inclusion of eligible fund family assets in the ROA calculation
is dependent on the shareholder notifying Edward Jones of such assets at the time of calculation. Money market funds
are included only if such shares were sold with a sales charge at the time of purchase or acquired in exchange for shares
purchased with a sales charge.
◼
The employer maintaining a SEP IRA plan and/or SIMPLE IRA plan may elect to establish
or change ROA for the IRA accounts associated with the plan to a plan-level grouping as opposed to including
all share classes at a shareholder or pricing group level.
◼
ROA is determined by calculating the higher of cost minus redemptions or market value
(current shares x NAV).
Letter of Intent (“LOI”)
◼
Through an LOI, shareholders can receive the sales charge and breakpoint discounts
for purchases shareholders intend to make over a 13-month period from the date Edward Jones receives the LOI. The LOI is
determined by calculating the higher of cost or market value of qualifying holdings at LOI initiation in combination
with the value that the shareholder
Prospectus | Davis Funds | 68
intends to buy over a 13-month period to calculate the front-end sales charge and
any breakpoint discounts. Each purchase the shareholder makes during that 13-month period will receive the sales charge and
breakpoint discount that applies to the total amount. The inclusion of eligible fund family assets in the LOI calculation
is dependent on the shareholder notifying Edward Jones of such assets at the time of calculation. Purchases made before the
LOI is received by Edward Jones are not adjusted under the LOI and will not reduce the sales charge previously paid. Sales
charges will be adjusted if LOI is not met.
◼
If the employer maintaining a SEP IRA plan and/or SIMPLE IRA plan has elected to establish
or change ROA for the IRA accounts associated with the plan to a plan-level grouping, LOIs will also be at the
plan-level and may only be established by the employer.
Sales Charge Waivers
Sales charges are waived for the following shareholders and in the following situations:
◼
Associates of Edward Jones and its affiliates and other accounts in the same pricing
group (as determined by Edward Jones under its policies and procedures) as the associate. This waiver will continue for the remainder of the associate’s life if the associate retires from Edward Jones in good-standing and remains in good standing pursuant to Edward Jones’ policies and procedures.
◼
Shares purchased in an Edward Jones fee-based program.
◼
Shares purchased through reinvestment of capital gains distributions and dividend
reinvestment.
◼
Shares purchased from the proceeds of redeemed shares of the same fund family so long
as the following conditions are met: the proceeds are from the sale of shares within 60 days of the purchase, the
sale and purchase are made from a share class that charges a front load and one of the following (“Right of Reinstatement”):
−
The redemption and repurchase occur in the same account.
−
The redemption proceeds are used to process an: IRA contribution, excess contributions,
conversion, recharacterizing of contributions, or distribution, and the repurchase is done in an account within
the same Edward Jones grouping for ROA.
−
The Right of Reinstatement excludes systematic or automatic transactions including,
but not limited to, purchases made through payroll deductions, liquidations to cover account fees, and reinvestments
from non-mutual fund products.
◼
Shares exchanged into Class A shares from another share class so long as the exchange
is into the same fund and was initiated at the discretion of Edward Jones. Edward Jones is responsible for any remaining
CDSC due to the fund company, if applicable. Any future purchases are subject to the applicable sales charge as
disclosed in the prospectus.
◼
Exchanges from Class C shares to Class A shares of the same fund, generally, in the
84th month following the anniversary of the purchase date or earlier at the discretion of Edward Jones.
◼
Purchases of Class 529-A shares through a rollover from either another education savings
plan or a security used for qualified distributions.
◼
Purchases of Class 529-A shares made for recontribution of refunded amounts.
Contingent Deferred Sales Charge (“CDSC”) Waivers
If the shareholder purchases shares that are subject to a CDSC and those shares are
redeemed before the CDSC is expired, the shareholder is responsible to pay the CDSC except in the following conditions:
◼
The death or disability of the shareholder.
◼
Systematic withdrawals with up to 10% per year of the account value.
◼
Return of excess contributions from an Individual Retirement Account (IRA).
◼
Shares redeemed as part of a required minimum distribution for IRA and retirement
accounts if the redemption is taken in or after the year the shareholder reaches qualified age based on applicable IRS regulations.
◼
Shares redeemed to pay Edward Jones fees or costs in such cases where the transaction
is initiated by Edward Jones.
◼
Shares exchanged in an Edward Jones fee-based program.
◼
Shares acquired through NAV reinstatement.
◼
Shares redeemed at the discretion of Edward Jones for Minimums Balances, as described
below.
Other Important Information Regarding Transactions Through Edward Jones
Minimum Purchase Amounts
◼
Initial purchase minimum: $250
◼
Subsequent purchase minimum: none
Prospectus | Davis Funds | 69
Minimum Balances
◼
Edward Jones has the right to redeem at its discretion fund holdings with a balance
of $250 or less. The following are examples of accounts that are not included in this policy:
−
A fee-based account held on an Edward Jones platform
−
A 529 account held on an Edward Jones platform
−
An account with an active systematic investment plan or LOI
Exchanging Share Classes
◼
At any time it deems necessary, Edward Jones has the authority to exchange at NAV a shareholder’s holdings in a fund to Class A shares of the same fund.
Oppenheimer (“OPCO”)
Shareholders purchasing Fund shares through an OPCO platform or account are eligible
only for the following load waivers (front-end sales charge waivers and contingent deferred, or back-end, sales charge
waivers) and discounts, which may differ from those disclosed elsewhere in this Fund’s prospectus or SAI.
Front-end Sales Load Waivers on Class A Shares available at OPCO
◼
Employer-sponsored retirement, deferred compensation and employee benefit plans (including
health savings accounts) and trusts used to fund those plans, provided that the shares are not held in a commission-based
brokerage account and shares are held for the benefit of the plan
◼
Shares purchased by or through a 529 Plan
◼
Shares purchased through a OPCO affiliated investment advisory program
◼
Shares purchased through reinvestment of capital gains distributions and dividend
reinvestment when purchasing shares of the same fund (but not any other fund within the fund family)
◼
Shares purchased form the proceeds of redemptions within the same fund family, provided
(1) the repurchase occurs within 90 days following the redemption, (2) the redemption and purchase occur in the same
amount, and (3) redeemed shares were subject to a front-end or deferred sales load (known as Rights of Restatement).
◼
A shareholder in the Fund’s Class C shares will have their shares converted at net asset value to Class A shares (or the appropriate share class) of the Fund if the shares are no longer subject to a CDSC
and the conversion is in line with the policies and procedures of OPCO
◼
Employees and registered representatives of OPCO or its affiliates and their family
members
◼
Directors or Trustees of the Fund, and employees of the Fund’s investment adviser or any of its affiliates, as described in this prospectus
CDSC Waivers on A and C Shares available at OPCO
◼
Death or disability of the shareholder
◼
Shares sold as part of a systematic withdrawal plan as described in the Fund’s prospectus
◼
Return of excess contributions from an IRA Account
◼
Shares sold as part of a required minimum distribution for IRA and retirement accounts
due to the shareholder reaching the qualified age based on applicable IRS regulations
◼
Shares sold to pay OPCO fees but only if the transaction is initiated by OPCO
◼
Shares acquired through a right of reinstatement
Front-end load Discounts Available at OPCO: Breakpoints, Rights of Accumulation &
Letters of Intent
◼
Breakpoints as described in this prospectus
◼
Rights of Accumulation (ROA) which entitle shareholders to breakpoint discounts will
be automatically calculated based on the aggregated holding of fund family assets held by accounts within the purchaser’s household at OPCO. Eligible fund family assets not held at OPCO may be included in the ROA calculation only if the
shareholder notifies his or her financial advisor about such assets
Baird
Shareholders purchasing fund shares through a Baird platform or account will only
be eligible for the following sales charge waivers (front-end sales charge waivers and CDSC waivers) and discounts, which may
differ from those disclosed elsewhere in this prospectus or the SAI
Prospectus | Davis Funds | 70
Front-End Sales Charge Waivers on Investor A-shares Available at Baird
◼
Shares purchased through reinvestment of capital gains distributions and dividend
reinvestment when purchasing shares of the same fund
◼
Shares purchased by employees and registered representatives of Baird or its affiliates
and their family members as designated by Baird
◼
Shares purchased within 90 days following a redemption from a Davis Fund, provided
(1) the redemption and purchase occur within the purchaser’s Baird household and (2) the redeemed shares were subject to a front-end or deferred sales charge (known as rights of reinstatement)
◼
A shareholder in the Fund’s Investor C Shares will have their share converted at net asset value to Investor A shares of the same fund if the shares are no longer subject to CDSC and the conversion is in line
with the policies and procedures of Baird
◼
Employer-sponsored retirement plans or charitable accounts in a transactional brokerage
account at Baird, including 401(k) plans, 457 plans, employer-sponsored 403(b) plans, profit sharing and money
purchase pension plans and defined benefit plans. For purposes of this provision, employer-sponsored retirement plans
do not include SEP IRAs, Simple IRAs or SAR-SEPs
CDSC Waivers on Investor A and C shares Available at Baird
◼
Shares sold due to death or disability of the shareholder
◼
Shares sold as part of a systematic withdrawal plan as described in the Fund’s Prospectus
◼
Shares sold due to returns of excess contributions from an IRA Account
◼
Shares sold as part of a required minimum distribution for IRA and retirement accounts
due to the shareholder reaching the qualified age based on applicable Internal Revenue Service regulations as described in the Fund’s prospectus
◼
Shares sold to pay Baird fees but only if the transaction is initiated by Baird
◼
Shares acquired through a right of reinstatement
Front-End Sales Charge Discounts Available at Baird: Breakpoints and/or Rights of
Accumulation
◼
Breakpoints as described in this prospectus
◼
Rights of accumulation which entitle shareholders to breakpoint discounts will be
automatically calculated based on the aggregated holdings of Davis Fund assets held by accounts within the purchaser’s household at Baird. Eligible Davis Fund assets not held at Baird may be included in the rights of accumulation calculations
only if the shareholder notifies his or her financial advisor about such assets
◼
Letters of Intent (LOI) allow for breakpoint discounts based on anticipated purchases
of Davis Fund shares through Baird over a 13-month period of time
J.P. Morgan Securities LLC
If you purchase or hold fund shares through an applicable J.P. Morgan Securities LLC
brokerage account, you will be eligible for the following sales charge waivers (front-end sales charge waivers and contingent deferred sales charge (“CDSC”), or backend sales charge, waivers), share class conversion policy and discounts, which
may differ from those disclosed elsewhere in this fund’s prospectus or Statement of Additional Information.
Front-end sales charge waivers on Class A shares available at J.P. Morgan Securities
LLC
◼
Shares exchanged from Class C (i.e., level-load) shares that are no longer subject
to a CDSC and are exchanged into Class A shares of the same fund pursuant to J.P. Morgan Securities LLC’s share class exchange policy.
◼
Qualified employer-sponsored defined contribution and defined benefit retirement plans,
nonqualified deferred compensation plans, other employee benefit plans and trusts used to fund those plans.
For purposes of this provision, such plans do not include SEP IRAs, SIMPLE IRAs, SAR-SEPs or 501(c)(3) accounts.
◼
Shares of funds purchased through J.P. Morgan Securities LLC Self-Directed Investing
accounts.
◼
Shares purchased through rights of reinstatement.
◼
Shares purchased through reinvestment of capital gains distributions and dividend
reinvestment when purchasing shares of the same fund (but not any other fund within the fund family).
◼
Shares purchased by employees and registered representatives of J.P. Morgan Securities
LLC or its affiliates and their spouse or financial dependent as defined by J.P. Morgan Securities LLC.
Prospectus | Davis Funds | 71
Class C to Class A share conversion
◼
A shareholder in the fund’s Class C shares will have their shares converted to Class A shares (or the appropriate share class) of the same fund if the shares are no longer subject to a CDSC and the conversion
is consistent with J.P. Morgan Securities LLC’s policies and procedures.
CDSC waivers on Class A and C shares available at J.P. Morgan Securities LLC
◼
Shares sold upon the death or disability of the shareholder.
◼
Shares sold as part of a systematic withdrawal plan as described in the fund’s prospectus.
◼
Shares purchased in connection with a return of excess contributions from an IRA account.
◼
Shares sold as part of a required minimum distribution for IRA and retirement accounts
pursuant to the Internal Revenue Code.
◼
Shares acquired through a right of reinstatement.
Front-end load discounts available at J.P. Morgan Securities LLC: breakpoints, rights
of accumulation & letters of intent
◼
Breakpoints as described in the prospectus.
◼
Rights of Accumulation (“ROA”) which entitle shareholders to breakpoint discounts as described in the fund’s prospectus will be automatically calculated based on the aggregated holding of fund family assets
held by accounts within the purchaser’s household at J.P. Morgan Securities LLC. Eligible fund family assets not held at J.P. Morgan Securities LLC (including 529 program holdings, where applicable) may be included in the ROA calculation
only if the shareholder notifies their financial advisor about such assets.
◼
Letters of Intent (“LOI”) which allow for breakpoint discounts based on anticipated purchases within a fund family, through J.P. Morgan Securities LLC, over a 13-month period of time (if applicable).
Stifel, Nicolaus & Company, Incorporated (“Stifel”) and its broker dealer affiliates
The following information has been provided by Stifel:
Shareholders purchasing or holding Davis Fund shares, including existing fund shareholders,
through a Stifel or affiliated platform that provides trade execution, clearance, and/or custody services, will be
eligible for the following sales charge load waivers (including front-end sales charge waivers and contingent deferred, or back-end, (“CDSC”) sales charge waivers) and discounts, which may differ from those disclosed elsewhere in this prospectus or the Fund’s SAI.
Class A Shares
As described elsewhere in this prospectus, Stifel may receive compensation out of
the front-end sales charge if you purchase Class A shares through Stifel.
Rights of accumulation
Rights of accumulation (ROA) that entitle shareholders to breakpoint discounts on
front-end sales charges will be calculated by Stifel based on the aggregated holding of eligible assets in the Davis Fund held by accounts within the purchaser’s household at Stifel. Ineligible assets include Class A Money Market Funds not assessed
a sales charge. Davis Fund Family assets not held at Stifel may be included in the calculation of ROA only if the shareholder
notifies his or her financial advisor about such assets.
The employer maintaining a SEP IRA plan and/or SIMPLE IRA plan may elect to establish
or change ROA for the IRA accounts associated with the plan to a plan-level grouping as opposed to including
all share classes at a shareholder or pricing group level.
Front-end sales charge waivers on Class A shares available at Stifel
◼
Class C shares that have been held for more than seven (7) years may be converted
to Class A shares or other front-end share class(es) of the same fund pursuant to Stifel’s policies and procedures. To the extent that this prospectus elsewhere provides for a waiver with respect to the exchange or conversion of such shares following
a shorter holding period, those provisions shall continue to apply.
◼
Shares purchased by employees and registered representatives of Stifel or its affiliates
and their family members as designated by Stifel.
◼
Shares purchased in a Stifel fee-based advisory program, often referred to as a “wrap” program. Shares purchased through reinvestment of capital gains distributions and dividend reinvestment when purchasing
shares of the same or other fund within the Davis Funds.
Prospectus | Davis Funds | 72
◼
Shares purchased from the proceeds of redeemed shares of Davis Funds so long as the
proceeds are from the sale of shares from an account with the same owner/beneficiary within 90 days of the purchase. For
the absence of doubt, automated transactions (i.e. systematic purchases, including salary deferral transactions and
withdrawals) and purchases made after shares are sold to cover Stifel Nicolaus’ account maintenance fees are not eligible for rights of reinstatement.
◼
Shares from rollovers into Stifel from retirement plans to IRAs.
◼
Shares exchanged into Class A shares from another share class so long as the exchange
is into the same fund and was initiated at the direction of Stifel. Stifel is responsible for any remaining CDSC
due to the fund company, if applicable. Any future purchases are subject to the applicable sales charge as disclosed in this prospectus.
◼
Purchases of Class 529-A shares through a rollover from another 529 plan.
◼
Purchases of Class 529-A shares made for reinvestment of refunded amounts.
◼
Employer-sponsored retirement plans (e.g., 401(k) plans, 457 plans, employer-sponsored
403(b) plans, profit sharing and money purchase pension plans and defined benefit plans). For purposes of this provision,
employer sponsored retirement plans do not include SEP IRAs, SIMPLE IRAs or SAR-SEPs.
Contingent Deferred Sales Charges Waivers on Class A and Class C Shares
◼
Death or disability of the shareholder or, in the case of 529 plans, the account beneficiary.
◼
Shares sold as part of a systematic withdrawal plan not to exceed 12% annually.
◼
Return of excess contributions from an IRA Account.
◼
Shares sold as part of a required minimum distribution for IRA and retirement accounts
due to the shareholder reaching the qualified age based on applicable IRS regulations.
◼
Shares acquired through a right of reinstatement.
◼
Shares sold to pay Stifel fees or costs in such cases where the transaction is initiated
by Stifel.
◼
Shares exchanged or sold in a Stifel fee-based program.
Share Class Conversions in Advisory Accounts
◼
Stifel continually looks to provide our clients with the lowest cost share class available
based on account type. Stifel reserves the right to convert shares to the lowest cost share class available at Stifel
upon transfer of shares into an advisory program.
Wells Fargo Clearing Services, LLC and Wells Fargo Advisors Financial Network, LLC (collectively, “Wells Fargo Advisors”)
Wells Fargo Clearing Services, LLC operates a First Clearing business, but these rules
are not intended to include First Clearing firms.
Effective April 1, 2026, Clients of Wells Fargo Advisors purchasing fund shares through
Wells Fargo Advisors are eligible for the following sales charge discounts (also referred to as “breakpoints”) and waivers, which can differ from discounts and waivers described elsewhere in the prospectus or statement of additional information (“SAI”). In all instances, it is the investor’s responsibility to inform Wells Fargo Advisors at the time of purchase of any relationship, holdings, or other facts qualifying the investor for discounts or waivers. Wells Fargo Advisors can ask for
documentation supporting the qualification.
Wells Fargo Advisors Class A share front-end sales charge waivers information.
Wells Fargo Advisors clients purchasing or converting to Class A shares of the fund
in a Wells Fargo Advisors brokerage account are entitled to a waiver of the front-end load in the following circumstances:
◼
Wells Fargo Advisors employee and employee-related accounts according to Wells Fargo Advisor’s employee account linking rules. Legacy accounts and positions receiving affiliate discounts prior to
the effective date will continue to receive discounts. Going forward employees of affiliate businesses will not be offered NAV.
◼
Shares purchased through reinvestment of dividends and capital gains distributions
when purchasing shares of the same fund.
WellsTrade, the firm’s online self-directed brokerage account, generally offers no-load share classes but there could be instances where a Class A share is offered without a front-end sales charge.
Wells Fargo Advisors Class 529-A share front-end sales charge waivers information.
Wells Fargo Advisors clients purchasing or converting to Class 529-A shares of the
fund through Wells Fargo Advisors transactional brokerage accounts are entitled to a waiver of the front-end load in
the following circumstances:
◼
Shares purchased through a rollover from another 529 plan.
Prospectus | Davis Funds | 73
◼
Recontribution(s) of distributed funds are only allowed during the NAV reinstatement period as dictated by the sponsor’s specifications outlined by the plan.
Wells Fargo Advisors is not able to apply the NAV Reinstatement privilege for 529
Plan account purchases placed directly at the fund company. Investors wishing to utilize this privilege outside of Wells Fargo
systems will need to do so directly with the Plan or a financial intermediary that supports this feature.
Unless specifically described above, other front-end load waivers are not available
on mutual fund purchases through Wells Fargo Advisors.
Wells Fargo Advisors Contingent Deferred Sales Charge information.
◼
Contingent deferred sales charges (CDSC) imposed on fund redemptions will not be rebated
based on future purchases.
Wells Fargo Advisors Class A front-end load discounts
Wells Fargo Advisors Clients purchasing Class A shares of the fund through Wells Fargo
Advisors brokerage accounts will follow the following aggregation rules for breakpoint discounts:
◼
Effective April 1, 2026, SEP or SIMPLE IRAs will not be aggregated as a group plan. They will aggregate with the client’s personal accounts based on Social Security Number. Previously established SEP and
SIMPLE IRAs may still be aggregated as a group plan.
◼
Effective April 1, 2026, Employer-sponsored retirement plan (e.g., 401(k) plans, 457
plans, employer-sponsored 403(b) plans, profit sharing and money purchase pension plans and defined benefit plans)
accounts will aggregate with other plan accounts under the same Tax ID and will not be aggregated with other retirement plan
accounts under a different Tax ID or personal accounts. For purposes of this provision, employer-sponsored retirement plans
do not include SEP IRAs, SIMPLE IRAs, SAR-SEPs or Keogh plans.
◼
Gift of shares will not be considered when determining breakpoint discounts
Prospectus | Davis Funds | 74
Investment Company Act File No. 811-2679

2949 East Elvira Road, Suite 101
Tucson, AZ 85756
1-800-279-0279
www.davisfunds.com
Tucson, AZ 85756
1-800-279-0279
www.davisfunds.com
Obtaining Additional Information
Additional information about the Funds' investments is available in the Funds' annual and semi-annual reports to shareholders and in Form N-CSR. In the Funds' annual report, you will find a discussion of the market conditions and investment strategies that significantly affected the Funds' performance during their last fiscal year. The SAI provides more detailed information about the Funds and their management and operations. In Form N-CSR, you will find the Funds' annual and semi-annual financial statements.
The Funds' SAI and annual report have been filed with the Securities and Exchange Commission, are incorporated into this prospectus by reference, and are legally a part of this prospectus.
The Funds' SAI, annual and semi-annual reports to shareholders, and other information such as Fund financial statements are available, without charge, upon request:
By Telephone: Call the Funds toll-free at 1-800-279-0279, Monday through Friday, from 9 a.m. to 6 p.m. Eastern time. You may also call this number for account inquiries.
By Mail: Write to Davis Funds, P.O. Box 219197, Kansas City, MO 64121-9197
On the Internet: davisfunds.com/resources/regulatory-documents
By email: dvsinvestor.services@dsaco.com
From the SEC: Reports and other information about the Funds are also available on the EDGAR database on the SEC website (www.sec.gov). Additional copies of the registration statement can be obtained, for a duplicating fee, by sending an electronic request to publicinfo@sec.gov.

Davis Series, Inc.
May 1, 2026
STATEMENT OF ADDITIONAL INFORMATION
Tickers:
Davis Financial Fund: Class A–RPFGX, Class C–DFFCX, Class Y–DVFYX
Davis Opportunity Fund: Class A–RPEAX, Class C–DGOCX, Class Y–DGOYX Davis Real Estate Fund: Class A–RPFRX, Class C–DRECX, Class Y–DREYX
Davis Balanced Fund: Class A–RPFCX, Class C–DCSCX, Class Y–DCSYX
Davis Government Bond Fund: Class A–RFBAX, Class C–DGVCX, Class Y–DGVYX
Davis Government Money Market Fund: Class A–RPGXX, Class C–N/A, Class Y–N/A This statement of additional information is not a prospectus and should be read in conjunction with the Funds' prospectus dated May 1, 2026. This statement of additional information incorporates the prospectus by reference. A copy of the Funds' prospectus may be obtained, without charge, by calling Investor Services at 1-800-279-0279 or by visiting our website, www.davisfunds.com/resources/regulatory-documents. The Funds' most recent annual report and semi-annual report to shareholders, and other information such as Fund financial statements, are separate documents that are available, without charge, upon request.
Over 50 Years of Reliable InvestingSM
Contents
|
3
|
|
|
3
|
|
|
3
|
|
|
9
|
|
|
13
|
|
|
13
|
|
|
17
|
|
|
17
|
|
|
17
|
|
|
18
|
|
|
19
|
|
|
19
|
|
|
20
|
|
|
21
|
|
|
21
|
|
|
22
|
|
|
22
|
|
|
26
|
|
|
28
|
|
|
31
|
|
|
32
|
|
|
34
|
|
|
34
|
|
|
35
|
|
|
35
|
|
|
38
|
|
|
38
|
|
|
39
|
|
|
39
|
|
|
41
|
|
|
41
|
|
|
41
|
|
|
41
|
|
|
42
|
|
|
42
|
|
|
42
|
|
|
44
|
|
|
45
|
|
|
46
|
Statement of Additional Information | Davis Funds | 2
Section I:
Investment Objectives, Strategies, Risks, and Restrictions
Investment Objectives, Strategies, Risks, and Restrictions
This statement of additional information (the “SAI”) supplements and should be read in conjunction with the prospectus of Davis Financial Fund (“DFF”), Davis Opportunity Fund (“DOF”), Davis Real Estate Fund (“DREF”), Davis Balanced Fund (“DBF”), Davis Government Bond Fund (“DGBF”), and Davis Government Money Market Fund (“DGMMF” and each a “Fund” and jointly the “Funds”).
The Adviser and Sub-Adviser. The Funds are managed by Davis Selected Advisers, L.P. (the “Adviser”) and Davis Selected Advisers–NY, Inc. (the “Sub-Adviser”).
Investment Objectives
The investment objectives, principal investment strategies, and the main risks of
investing in the Funds are described in the Funds' prospectus. There is no assurance that the Funds will achieve their investment
objectives. An investment in the Funds may not be appropriate for all investors and short-term investing is discouraged.
The Funds' investment objectives are not fundamental policies and may be changed by the Board of Directors without a vote of
shareholders. The Funds' prospectus would be amended prior to any change in investment objective and shareholders would be provided at least 30 days’ notice before the change in investment objective was implemented.
In the discussions that follow, “Fund” applies equally to Davis Opportunity Fund, Davis Financial Fund, Davis Real Estate Fund, Davis Balanced Fund, Davis Government Bond Fund and Davis Government Money Market
Fund, unless the context indicates otherwise.
Non-Principal Investment Strategies and Risks
The Adviser may implement investment strategies which are not principal investment
strategies if, in its professional judgment, the strategies are appropriate. A strategy includes any policy, practice,
or technique used by the Funds to achieve their investment objectives. Whether a particular strategy, including a strategy to
invest in a particular type of security, is a principal investment strategy depends on the strategy’s anticipated importance in achieving the Funds' investment objectives, and how the strategy affects the Funds' potential risks and returns. In determining
what is a principal investment strategy, the Adviser considers, among other things, the amount of the Funds' assets expected to
be committed to the strategy, the amount of the Funds' assets expected to be placed at risk by the strategy, and the likelihood
of the Funds losing some or all of those assets from implementing the strategy. Non-principal investment strategies are generally
those investments which constitute less than 5% to 10% of a Fund’s assets depending upon their potential impact upon the investment performance of the Funds.
While the Adviser expects to pursue the Funds' investment objectives by implementing
the principal investment strategies described in the Funds' prospectus, the Funds may employ non-principal investment
strategies or securities if, in Davis Advisors’ professional judgment, the securities, trading, or investment strategies are appropriate. Factors that Davis Advisors considers in pursuing these other strategies include whether the strategy: (1) is likely to be consistent with shareholders’ reasonable expectations; (2) is likely to assist the Adviser in pursuing the Funds'
investment objectives; (3) is consistent with the Funds' investment objectives; (4) will not cause the Funds to violate any of their
fundamental or non-fundamental investment restrictions; and (5) will not materially change the Funds' risk profile
from the risk profile that results from following the principal investment strategies as described in the Funds' prospectus
and further explained in this SAI, as amended from time to time.
The composition of the Funds' portfolios and the strategies that the Adviser may use
to try to achieve the Funds' investment objectives may vary depending on market conditions and available investment opportunities.
The Funds are not required to use any of the investment strategies described below in pursuing their investment objectives.
The Funds may use some of the investment strategies rarely or not at all. Whether the Funds use a given investment
strategy at a given time depends on the professional judgment of the Adviser.
The principal investment strategies and risks for the Funds are described in the Funds'
prospectus. An investment strategy that is a principal investment strategy for one Fund may be a non-principal investment
strategy for one of the other Funds, which, therefore, may only invest a limited portion of its assets in the non-principal investment
strategy, as described above. A number of investment strategies and risks, which are not principal investment strategies
or principal risks for the Funds (and, therefore, are not included in the Funds' prospectus), are described below.
Equity Strategies and Risks
Emphasizing Investments in Selected Market Sectors. A Fund may invest up to 25% of its net assets in the securities of issuers conducting their principal business activities in the same market sector.
Significant investments in selected market sectors render a portfolio particularly vulnerable to the risks of its target sectors.
Such exposure may cause that Fund to be more impacted by risks relating to and developments affecting that market sector.
For purposes of measuring concentration in a market sector, the Funds generally classify companies at the “industry group” or “industry” level. However, further analysis may lead the Adviser to classify companies at the sub-industry level. See the section
of this SAI on Investment Restrictions for further details.
Statement of Additional Information | Davis Funds | 3
Capital Goods Industry Risk. Companies in the capital goods group of industries include aerospace & defense, building
products, construction & engineering, and other manufacturers of capital intensive
products. Companies in a capital good industry may be affected by fluctuations in the business cycle and by other factors
affecting manufacturing demands. The capital goods industry depends heavily on corporate spending. Companies in the capital
goods industry may perform well during times of economic expansion but, as economic conditions worsen, the demand
for capital goods may decrease. Similarly, one sub-industry of the capital goods industry group can outperform another
sub-industry. Many capital goods are sold internationally and companies in this industry may be affected by market conditions
in other countries and regions.
China Risk – Generally (DOF only). Investments in Chinese securities may subject the Funds to risks that are specific
to China. China may be subject to significant amounts of instability including, but not
limited to, economic, political, and social instability. China’s economy may differ from the U.S. economy in certain respects including, but not limited to, general development, level of government involvement, wealth distribution, and structure.
The government of China has historically demonstrated its control over almost every sector of the Chinese economy through state
ownership and/or administrative regulation. As an example, the Chinese government has taken certain actions that have
influenced prices of goods, encouraged companies to invest in certain industries, has induced mergers, and may take such
actions or similar actions now or in the future. In addition, the Chinese government has taken actions which could materially
impact the business operations of certain industries which could impact underlying holdings. U.S. and Chinese regulators have,
and may in the future, impact the ability of Chinese companies to gain access to U.S. capital markets.
For purposes of raising capital offshore on exchanges outside of China, including
on U.S. exchanges, many Chinese-based operating companies are structured as VIEs. In this structure, the Chinese-based operating
company is the VIE and establishes a shell company in a foreign jurisdiction, such as the Cayman Islands. The shell company
lists on a foreign exchange and enters into contractual arrangements with the VIE. This structure allows Chinese companies
in which the government restricts foreign ownership to raise capital from foreign investors. While the shell company
has no equity ownership of the VIE, these contractual arrangements permit the shell company to consolidate the VIE’s financial statements with its own for accounting purposes and provide for economic exposure to the performance of the underlying Chinese
operating company. Therefore, an investor in the listed shell company, such as the Funds, will have exposure to the
Chinese-based operating company only through contractual arrangements and has no ownership in the Chinese-based operating
company. Furthermore, because the shell company only has specific rights provided for in these service agreements with
the VIE, its abilities to control the activities at the Chinese-based operating company are limited and the operating company
may engage in activities that negatively impact investment value.
While the VIE structure has been widely adopted, it is not formally recognized under
Chinese law and therefore there is a risk that the Chinese government could prohibit the existence of such structures or negatively impact the VIE’s contractual arrangements with the listed shell company by making them invalid. If these contracts
were found to be unenforceable under Chinese law, investors in the listed shell company, such as the Funds, may suffer
significant losses with little or no recourse available. If the Chinese government determines that the agreements establishing the
VIE structures do not comply with Chinese law and regulations, including those related to restrictions on foreign ownership,
it could subject a Chinese-based issuer to penalties, revocation of business and operating licenses, or forfeiture
of ownership interest. In addition, the listed shell company’s control over a VIE may also be jeopardized if a natural person who holds the equity interest in the VIE breaches the terms of the agreement, is subject to legal proceedings, or if any physical
instruments for authenticating documentation, such as chops and seals, are used without the Chinese-based issuer’s authorization to enter into contractual arrangements in China. Chops and seals, which are carved stamps used to sign documents,
represent a legally binding commitment by the company. Moreover, any future regulatory action may prohibit the
ability of the shell company to receive the economic benefits of the Chinese-based operating company, which may cause the
value of the Funds' investment in the listed shell company to suffer a significant loss. For example, in 2021, the Chinese
government prohibited use of the VIE structure for investment in after-school tutoring companies. There is no guarantee
that the government will not place similar restrictions on other industries.
Chinese law prohibits investments by foreign investors in certain companies in certain
industries. Certain industries that impact minors may be at a higher risk of regulatory action. The Chinese government
placed new regulations on the companies related to after-school tutoring and private educational services, one of which is
mandating that it must now be registered as a non-profit organization.
Consumer Discretionary Sector Risk. Companies engaged in the design, production, or distribution of products or services
for the consumer discretionary sector (e.g., retailing and consumer services) are
subject to the risk that their products or services may become obsolete quickly. The success of these companies can depend heavily
on disposable household income and consumer spending. During periods of an expanding economy, the consumer discretionary
sector may outperform the consumer staples sector, but may underperform when economic conditions worsen. Moreover,
the consumer discretionary sector can be significantly affected by several factors including, without limitation,
the performance of domestic and international economies, exchange rates, changing consumer preferences, demographics,
marketing campaigns, cyclical revenue generation, consumer confidence, commodity price volatility, labor relations,
interest rates, import and export controls, intense competition, technological developments, and government regulation.
Broadline Retail Risk. Retailers, especially those that operate via the internet or direct marketing (e.g.,
online consumer services, online retail, travel) are subject to fluctuating consumer demand. Unlike
traditional brick and mortar retailers, online
Statement of Additional Information | Davis Funds | 4
marketplaces and retailers must assume shipping costs or pass such costs to consumers.
Consumer access to price information for the same or similar products may cause companies that operate in the online marketplace,
retail, and travel segments to reduce profit margins in order to compete. Due to the nature of their business models,
companies that operate in the online marketplace, retail, and travel segments may also be subject to heightened cybersecurity
risk including the risk of theft or damage to vital hardware, software, and information systems. The loss or public dissemination
of sensitive customer information or other proprietary data may negatively affect the financial performance
of such companies to a greater extent than traditional brick and mortar retailers. As a result of such companies being web-based
and the fact that they process, store, and transmit large amounts of data, including personal information, for their customers,
failure to prevent or mitigate data loss or other security breaches, including breaches of vendors’ technology and systems, could expose companies that operate via the internet or direct marketing retail to a risk of loss or misuse of such information,
adversely affect their operating results, result in litigation or potential liability, and otherwise harm their businesses.
Health Care Sector Risk. Companies in the health care sector are subject to extensive government regulation
and their profitability can be significantly affected by restrictions on government reimbursement
for medical expenses, rising costs of medical products and services, pricing pressure (including price discounting), limited
product lines, and an increased emphasis on the delivery of healthcare through outpatient services. Companies in the
health care sector are heavily dependent on obtaining and defending patents which may be time consuming and costly and the
expiration of patents may also adversely affect the profitability of these companies. Health care companies are also subject
to extensive litigation based on product liability and similar claims. In addition, their products can become obsolete due
to industry innovation, changes in technologies, or other market developments. Many new products in the health care sector
require significant research and development and may be subject to regulatory approvals all of which may be time consuming
and costly with no guarantee that any product will come to market.
Industrials Sector Risk. The Industrials Sector includes manufacturers and distributors of capital goods such
as aerospace and defense, building projects, electrical components and equipment, construction machinery,
and companies that offer construction and engineering services. This sector also includes providers of commercial
and professional services including office services and supplies, security and alarm services, human resources/employment
services, and research and consulting services. Included in the industrials sector are also companies that provide transportation
services including air freight and logistics, airlines, railroads, and transportation infrastructure companies. A company
in this sector is subject to the risk that the securities of such issuer will underperform the market as a whole due to legislative
or regulatory changes, adverse market conditions, and/or increased competition affecting the industrials sector. The prices
of the securities of companies operating in the industrials sector may fluctuate due to the level and volatility of commodity
prices, the exchange value of the dollar, import controls, worldwide competition, liability for environmental damage, depletion of
resources, and mandated expenditures for safety and pollution control devices.
Information Technology Sector Risk. The Information Technology Sector includes companies that offer software and information technology services and manufacturers and distributors of technology hardware
and semiconductors. A company in this sector is subject to the risk that the securities of such issuer will underperform
the market as a whole due to legislative or regulatory changes, adverse market conditions, and/or increased competition affecting
the information technology sector. The prices of the securities of companies operating in the information technology
sector are closely tied to market competition, increased sensitivity to short product cycles and aggressive pricing,
and problems with bringing products to market.
Passive Foreign Investment Companies. Some securities of companies domiciled outside the U.S. in which the Funds may invest may be considered passive foreign investment companies (“PFICs”) under U.S. tax laws. PFICs are foreign corporations which generate primarily passive income. For federal tax purposes, a corporation is
deemed a PFIC if 75% or more of the foreign corporation’s gross income for its tax year is passive income or, in general, if 50% or more of its assets are assets that produce or are held to produce passive income. Passive income is further defined as
any income to be considered foreign personal holding company income within the subpart F provisions defined by Section
954 of the Internal Revenue Code.
Investing in PFICs involves the risks associated with investing in foreign securities,
as described above. There is also the risk that the Funds may not realize that a foreign corporation they invest in is a PFIC
for federal tax purposes. Federal tax laws impose severe tax penalties for failure to properly report investment income from
PFICs. The Funds make efforts to ensure compliance with federal tax reporting of these investments, however, there can be
no guarantee that the Funds' efforts will always be successful.
Government Securities Risk. A Fund may invest in various types of U.S. government securities. These securities
may have different levels of credit risk including the risk of default, depending on the nature
of the particular government support for that security. As an example, a U.S. government-sponsored entity, such as Federal National Mortgage Association (“Fannie Mae”) or Federal Home Loan Mortgage Corporation (“Freddie Mac”), although chartered or sponsored by an Act of Congress, may issue securities that are neither insured nor guaranteed by the U.S. Treasury
and therefore possess more risk than those securities that are insured or guaranteed by the U.S. Treasury.
Unsponsored Depositary Receipts. The Funds may invest in both sponsored and unsponsored arrangements. In a sponsored
arrangement, the foreign issuer assumes the obligation to pay some or all of the depositary’s transaction fees, whereas, in an unsponsored arrangement, the foreign issuer assumes no obligations and the depositary’s transaction fees are paid by the holders. Foreign issuers in respect of whose securities unsponsored depositary receipts
have been issued are not necessarily
Statement of Additional Information | Davis Funds | 5
obligated to disclose material information in the markets in which the unsponsored
depositary receipts are traded and, therefore, such information may not be reflected in the prices of such securities
in those markets. Shareholder benefits, voting rights, and other attached rights may not be extended to the holders of unsponsored
depositary receipts.
Investments in Other Investment Companies. The Funds can invest in securities issued by other investment companies, which can include open-end funds, closed-end funds, or exchange-traded funds (“ETFs” which are typically open-ended funds or unit investment trusts listed on a stock exchange). In some instances, an ETF or closed-end
fund may trade at market prices that are higher or lower than the NAV. The Funds may do so as a way of gaining exposure
to securities represented by the investment company’s portfolio at times when the Funds may not be able to buy those securities directly. As shareholders of an investment company, the Funds would be subject to their ratable share of that investment company’s expenses, including its advisory and administration expenses. At the same time, the Funds would bear their
own management fees and expenses. To the extent that the management fees paid to an investment company are for the same
or similar services as the management fees paid by the Funds, there would be a layering of fees that would increase expenses
and decrease returns. The Funds do not intend to invest in other investment companies unless the Portfolio Manager(s) believe
that the potential benefits of the investment justify the expenses. The Funds' investments in the securities of other
investment companies are subject to the limits that apply to those kinds of investments under the Investment Company Act of 1940, as revised (“1940 Act”).
Initial Public Offerings. An initial public offering (“IPO”) is the initial public offering of securities of a particular company. IPOs in which the Funds invest can have a dramatic impact on the Funds' performance
and assumptions about future performance based on that impact may not be warranted. Investing in IPOs involves
risks. Many, but not all, of the companies issuing IPOs are small, unseasoned companies. Many are companies that have only been
in operation for short periods of time. Small company securities, including IPOs, are subject to greater volatility in their
prices than are securities issued by more established companies. If the Funds do not intend to make a long-term investment in
an IPO (it is sometimes possible to immediately sell an IPO at a profit) the Adviser may not perform the same detailed
research on the company that it does for core holdings.
Rights and Warrants. Rights and warrants are forms of equity securities. Warrants, basically, are options
to purchase equity securities at specific prices valid for a specific period of time. Their prices do
not necessarily move parallel to the prices of the underlying securities. Rights are similar to warrants, but normally have shorter maturities
and are distributed directly by issuers to their shareholders. Rights and warrants have no voting rights, receive
no dividends, and have no rights with respect to the assets of the issuer.
Other Forms of Equity Securities. In addition to common stock, the Funds may invest in other forms of equity securities
including preferred stocks and securities with equity conversion or purchase rights.
The prices of equity securities fluctuate based on changes in the financial condition of their issuers and on market and economic
conditions. Events that have a negative impact on a business probably will be reflected in a decline in the price
of its equity securities. Furthermore, when the total value of the stock market declines, most equity securities, even those issued
by strong companies, likely will decline in value.
Cash Management. For defensive purposes or to accommodate inflows of cash awaiting more permanent investment,
the Funds may temporarily and without limitation hold high-grade, short-term money market
instruments, cash, and cash equivalents, including repurchase agreements. The Funds may also invest in registered
investment companies which are regulated as money market funds or companies exempted from registration under Sections
3(c)(1) or 3(c)(7) of the 1940 Act that themselves primarily invest in temporary defensive investments, including U.S.
Government securities and commercial paper. To the extent that the management fees paid to other investment companies are
for the same or similar services as the management fees paid by the Funds, there will be a layering of fees that would increase
expenses and decrease returns. Investments in other investment companies are limited by the 1940 Act and the rules
thereunder.
In certain instances, the Funds may engage in repurchase agreement transactions through
the Fixed Income Clearing Corporation (“FICC”). FICC sells U.S. Government or agency securities to the Funds under agreements to repurchase these securities at a stated repurchase price including interest for the term of the agreement.
The term of the agreement will typically be overnight or over the weekend. The Funds, through FICC, receive delivery of the
underlying U.S. Government or agency securities as collateral, whose value is required to be at least equal to the repurchase
price. If FICC were to become bankrupt, the Funds may be delayed or may incur costs or possible losses of principal and income
in disposing of the collateral.
Master Limited Partnerships Risk. The Funds may invest in securities of master limited partnerships (“MLPs”). Investments in MLPs involve risks that differ from investments in common stock, including risks
related to the following: (1) a common unit holder’s limited control and limited rights to vote on matters affecting the MLP; (2) potential conflicts of interest between the MLP and the MLP’s general partner; (3) cash flow; (4) dilution; and (5) the general partner’s right to require unit holders to sell their common units at an undesirable time or price. MLP common unit holders
may not elect the general partner or its directors and have limited ability to remove an MLP’s general partner. MLPs may issue additional common units without unit holder approval which could dilute the ownership interests of investors holding MLP
common units. MLP common units, like other equity securities, can be affected by macro-economic and other factors affecting
the stock market in general, expectations of interest rates, investor sentiment towards an issuer or certain market sector, changes in a particular issuer’s financial condition, or unfavorable or unanticipated poor performance of a particular
issuer. Prices of common units of individual MLPs, like prices of other equity securities, also can be affected by fundamentals
unique to the partnership or company, including earnings power and coverage ratios. A holder of MLP common units
typically would not be shielded to
Statement of Additional Information | Davis Funds | 6
the same extent that a shareholder of a corporation would be. In certain circumstances,
creditors of an MLP would have the right to seek return of capital distributed to a limited partner, which would continue
after an investor sold its investment in the MLP. The value of an MLP security may decline for reasons that directly relate to
the issuer such as management performance, financial leverage, and reduced demand for the issuer’s products or services.
Currently, MLPs do not pay U.S. federal income tax at the partnership level. A change
in current tax law, or a change in the underlying business mix of a given MLP, could result in an MLP being treated as a
corporation for U.S. federal income tax purposes, which could result in a requirement to pay federal income tax on its taxable
income and have the effect of reducing the amount of cash available for distribution by the MLP, resulting in a reduction of the value of the common unit holder’s investment. Changes in the laws, regulations, or related interpretations relating
to the Funds' investments in MLPs could increase the Funds' expenses, reduce their cash distributions, negatively impact the
value of an investment in an MLP, or otherwise impact their ability to implement their investment strategies. Due to the
heavy state and federal regulations that an MLP’s assets may be subject to, an MLP’s profitability could be adversely impacted by changes in the regulatory environment.
Generally, the securities markets may move down, sometimes rapidly and unpredictably,
based on overall economic conditions and other factors. The value of a security may decline due to general market conditions
that are not specifically related to a particular company, such as real or perceived adverse economic conditions, changes
in the outlook for corporate earnings, changes in interest or currency rates, or adverse investor sentiment generally. A security’s value also may decline because of factors that affect a particular industry or industries, such as labor shortages or
increased production costs and competitive conditions within an industry.
Derivatives. The Funds are prohibited from investing in derivatives, excluding certain currency
and interest rate hedging transactions. This restriction is not fundamental and may be changed by the Funds
without a shareholder vote. If the Funds do determine to invest in derivatives in the future, they will comply with Rule 18f-4
under the 1940 Act.
Additional Non-Principal Investment Strategies and Risks
Settlement Risk. Settlement systems in some markets (especially those of developing countries) are
generally less well organized than those of more developed markets. There may be risks that settlement
may be delayed and that cash or securities belonging to the Funds may be at risk because of failures or defects in the systems.
In particular, market practice may require that payment be made before receipt of the security being purchased or that delivery
of a security be made before payment is received. In such a situation, a default by a broker or bank that is processing the
transaction may cause the Funds to suffer a loss.
Distressed Companies. The Funds may invest in or continue to hold debt or securities issued by distressed
companies which are or are about to be involved in reorganizations, financial restructurings, or bankruptcy.
A bankruptcy, merger, or other restructuring or a tender or exchange offer, proposed or pending at the time the Funds
invest in the debt or securities may not be completed on the terms or within the time frame contemplated which may result in
losses to the Funds. Debt obligations of distressed companies typically are unrated, lower-rated, in default, or close to default
and are generally more likely to become worthless than the securities of more financially stable companies.
Borrowing. A Fund may purchase additional securities so long as borrowings do not exceed 5%
of its total assets. A Fund may obtain such short-term credit as may be necessary for the clearance of purchases and
sales of portfolio securities. A Fund may borrow from banks provided that, immediately after any such borrowing, there is an
asset coverage of at least 300% for all borrowings. In the event that such asset coverage at any time falls below 300%, the
Fund shall, within three business days thereafter, reduce the amount of its borrowings to an extent that the asset coverage
of such borrowings shall be at least 300%. A Fund is not required to dispose of portfolio holdings immediately if it would suffer
losses as a result. Borrowing money to meet redemptions or other purposes would have the effect of temporarily leveraging the Fund’s assets and potentially exposing the Fund to leveraged losses.
Lending Portfolio Securities. The equity Funds may lend their portfolio securities to certain types of eligible
borrowers approved by the Board of Directors. The Funds have engaged State Street Bank and Trust Company (“State Street”) as the Funds' lending agent pursuant to a written agreement. The Funds will retain a portion of the securities’ lending income and will remit the remaining portion to State Street as compensation for its services
as securities lending agent. As securities lending agent, State Street will screen and select borrowers, monitor the availability
of securities, negotiate rebates, daily mark to market the loans, monitor and maintain cash collateral levels, process securities
movements, and reinvest cash collateral as directed by the Adviser or as specific in the lending agent agreement.
The Funds may engage in securities lending to earn additional income or to raise cash
for liquidity purposes. The Funds must receive collateral for a loan. Under current applicable regulatory requirements (which
are subject to change), on each business day, the loan collateral must be at least equal to the value of the loaned securities.
The collateral must consist of cash, bank letters of credit, securities of the U.S. Government or its agencies or instrumentalities,
or other cash equivalents in which the Funds are permitted to invest.
Lending activities are strictly limited as described in the section titled “Investment Restrictions.” Lending money or securities involves the risk that the Funds may suffer a loss if a borrower does not repay a
loan when due. To manage this risk, the Funds deal only with counterparties they believe to be creditworthy and require that the
counterparty deposit collateral with the Funds.
Statement of Additional Information | Davis Funds | 7
When they loan securities, the Funds still own the securities, receive amounts equal
to the dividends or interest on loaned securities, and are subject to gains or losses on those securities. The Funds also
receive one or more of: (1) negotiated loan fees; (2) interest on securities used as collateral; and/or (3) interest on any short-term
debt instruments purchased with such loan collateral. Either type of interest may be shared with the borrower. The Funds may also pay reasonable finder’s, custodian, and administrative fees in connection with these loans. The terms of the Funds' loans
must meet applicable tests under the Internal Revenue Code and must permit the Funds to reacquire loaned securities on five days’ notice or in time to vote on any important matter.
For purposes of applying the limitation set forth below in the Investment Restrictions sub-section titled “Making Loans,” there are no limitations with respect to unsecured loans made by a Fund to an unaffiliated
party. However, if a Fund loans its portfolio securities, the obligation on the part of the Fund to return collateral
upon termination of the loan could be deemed to involve the issuance of a senior security within the meaning of Section 18(f) of the
1940 Act. In order to avoid violation of Section 18(f), a Fund may not make a loan of portfolio securities if, as a result,
more than one-third of its total asset value (at value computed at the time of making a loan) would be on loan.
Income from securities lending as of the most recent fiscal year end:
|
|
DFF
|
DOF
|
DREF
|
DBF
|
|
Gross income from securities lending activities (including income from cash collateral
reinvestment)
|
$-
|
$27,192
|
$-
|
$-
|
|
Fees and/or compensation for securities lending activities and related services
|
|
|
|
|
|
Fees paid to State Street from a revenue split for their services as securities lending
agent
|
$-
|
$747
|
$-
|
$-
|
|
Fees paid for any cash collateral management services (including fees deducted from
a pooled
cash collateral reinvestment vehicle) that are not included in the revenue split paid
to State Street
|
$-
|
$208
|
$-
|
$-
|
|
Administrative fees not included in revenue split
|
$-
|
$-
|
$-
|
$-
|
|
Indemnification fees not included in revenue split
|
$-
|
$-
|
$-
|
$-
|
|
Rebates (paid to borrowers)
|
$-
|
$23,997
|
$-
|
$-
|
|
Other fees not included in revenue split (specify)
|
$-
|
$-
|
$-
|
$-
|
|
Aggregate fees/compensation for securities lending activities
|
$-
|
$24,952
|
$-
|
$-
|
|
Net income from securities lending activities
|
$-
|
$2,240
|
$-
|
$-
|
Short Sales. When the Funds believe that a security is overvalued, they may sell the security
short and borrow the same security from a broker or other institution to complete the sale. If the price of
the security decreases in value, the Funds may make a profit and, conversely, if the security increases in value, the Funds will
incur a loss because they will have to replace the borrowed security by purchasing it at a higher price. There can be no assurance
that the Funds will be able to close out the short position at any particular time or at an acceptable price. Although the Funds'
gain is limited to the amount at which they sold a security short, their potential loss is not limited. A lender may request that
the borrowed securities be returned on short notice. If that occurs at a time when other short sellers of the subject security are receiving similar requests, a “short squeeze” can occur. This means that the Funds might be compelled, at the most disadvantageous
time, to replace borrowed securities previously sold short with purchases on the open market at prices significantly greater
than those at which the securities were sold short. Short selling also may produce higher than normal portfolio turnover and
result in increased transaction costs to the Funds. If the Funds sell a security short, they will either own an off-setting “long position” (an economically equivalent security which is owned) or establish a “Segregated Account” as described in this SAI.
The Funds may also make short sales “against-the-box,” in which they sell short securities they own. The Funds will incur transaction costs, including interest expenses, in connection with opening, maintaining,
and closing short sales against-the-box, which results in a “constructive sale,” requiring the Funds to recognize any taxable gain from the transaction.
The Funds have adopted a non-fundamental investment limitation that prevents them
from selling any security short if it would cause more than 5% of their total assets, taken at market value, to be sold short.
This limitation does not apply to selling short against the box.
When-Issued and Delayed-Delivery Transactions. The Funds can invest in securities on a “when-issued” basis and can purchase or sell securities on a “delayed-delivery” basis. When-issued and delayed-delivery are terms that refer to securities whose terms and indenture are available and for which a market exists but that are
not available for immediate delivery.
When such transactions are negotiated, the price (which generally is expressed in
yield terms) is fixed at the time the commitment is made. Delivery and payment for the securities take place at a later
date (generally within 45 days of the date the offer is accepted). The securities are subject to change in value from market
fluctuations during the period until settlement. The value at delivery may be less than the purchase price. For example, changes in
interest rates before settlement will affect the value of such securities and may cause a loss to the Funds. During the period
between purchase and settlement, no payment is made by the Funds to the issuer and no interest accrues to the Funds from the investment.
The Funds may engage in when-issued transactions to secure what the Adviser considers
to be an advantageous price and yield at the time of entering into the obligation. When the Funds enter into a when-issued
or delayed-delivery transaction, they rely on the other party to complete the transaction. Its failure to do so may cause the
Funds to lose the opportunity to obtain the security at a price and yield the Adviser considers to be advantageous. When the Funds
engage in when-issued and delayed-delivery transactions, they do so for the purpose of acquiring or selling securities consistent
with their investment objectives
Statement of Additional Information | Davis Funds | 8
and strategies, and not for the purpose of investment leverage. Although the Funds
will enter into delayed-delivery or when-issued purchase transactions to acquire securities, they can dispose of a commitment before
settlement. If the Funds choose to dispose of the right to acquire a when-issued security before its acquisition or to
dispose of its right to delivery or receive against a forward commitment, they may incur a gain or loss.
At the time the Funds make the commitment to purchase or sell a security on a when-issued
or delayed-delivery basis, they record the transaction on their books and reflect the value of the security purchased
in determining the Funds' net asset values. In a sale transaction, they record the proceeds to be received. The Funds will identify
on their books liquid securities of any type at least equal in value to the value of the Funds' purchase commitments until
the Funds pay for the investment.
When-issued and delayed-delivery transactions can be used by the Funds as defensive
techniques to hedge against anticipated changes in interest rates and prices. For instance, in periods of rising interest
rates and falling prices, the Funds might sell securities in their portfolios on a forward commitment basis to attempt to limit their
exposure to anticipated falling prices. In periods of falling interest rates and rising prices, the Funds might sell portfolio
securities and purchase the same or similar securities on a when-issued or delayed-delivery basis to obtain the benefit of currently
higher cash yields.
Cybersecurity Risk. With the increased use of technologies such as the Internet to conduct business,
the Funds have become potentially more susceptible to operational and information security risks through
breaches in cybersecurity. In general, a breach in cybersecurity can result from either a deliberate attack or an unintentional
event. Cybersecurity breaches may involve, among other things, infection by computer viruses or other malicious software
code, or unauthorized access to the Funds' digital information systems, networks, or devices through “hacking” or other means, in each case for the purpose of misappropriating assets or sensitive information (e.g., personal shareholder information),
corrupting data or causing operational disruption or failures in the physical infrastructure or operating systems
that support the Funds. Cybersecurity risks also include the risk of losses of service resulting from external attacks that
do not require unauthorized access to the Funds' systems, networks, or devices. For example, denial-of-service attacks on the Adviser’s or an affiliate’s website could effectively render the Funds' network services unavailable to their shareholders and
other intended end-users. Any such cybersecurity breaches or losses of service may cause the Funds to lose proprietary
information, suffer data corruption, or lose operational capacity, which, in turn, could cause the Funds to incur regulatory penalties,
reputational damage, additional compliance costs associated with corrective measures, and/or financial loss. While
the Funds and their investment adviser have established plans and procedures designed to prevent or reduce the impact of
a cybersecurity attack, there is no guarantee that these plans and procedures will be successful. There are inherent limitations
in these plans and procedures given the ever changing nature of technology and cybersecurity attack tactics and there is a possibility
that certain risks have not been adequately identified or prepared for.
In addition, cybersecurity failures by or breaches of the Funds' third-party service
providers (including, but not limited to, the Funds' investment adviser, transfer agent, custodian, and other financial intermediaries)
may disrupt the business operations of the service providers and of the Funds, potentially resulting in financial losses,
the inability of the Funds' shareholders to transact business with the Funds and of the Funds to process transactions, the inability
of the Funds to calculate their net asset values, violations of applicable privacy and other laws, rules and regulations, regulatory
fines and penalties, reputational damage, reimbursement or other compensatory costs, and/or additional compliance costs
associated with implementation of any corrective measures. The Funds and their shareholders could be negatively impacted
as a result of any such cybersecurity breaches and there can be no assurance that the Funds will not suffer losses relating
to cybersecurity attacks or other informational security breaches affecting the Funds' third-party service providers
in the future, particularly as the Funds cannot control cybersecurity plans or systems implemented by such service providers.
Securities the Funds invest in are subject to cybersecurity risks in similar ways
to the Funds. A cybersecurity risk or cybersecurity event may cause the Funds' investments in such issuers to lose value.
In extreme cases, a risk or event could cause the issuer to cease business.
Segregated Accounts. A number of the Funds' potential non-principal investment strategies may require
them to establish segregated accounts. When the Funds enter into an investment strategy that would result in a “senior security,” as that term is defined in the 1940 Act, the Funds will either: (1) own an off-setting position in
securities; or (2) set aside liquid securities in a segregated account with their custodian bank (or designated in the Funds' books
and records) in the amount prescribed. The Funds will maintain the value of such segregated accounts equal to the prescribed
amount by adding or removing additional liquid securities to account for fluctuations in the value of securities held in such
accounts. Securities held in a segregated account cannot be sold while the senior security is outstanding unless they are replaced
with qualifying securities and the value of the account is maintained.
A segregated account is not required when the Funds hold securities, options, or futures
positions whose value is expected to offset its obligations that would otherwise require a segregated account. The Funds
may also use other SEC approved methods to reduce or eliminate the leveraged aspects of senior securities.
Portfolio Transactions
The Adviser is responsible for the placement of portfolio transactions, subject to
the supervision of the Funds' Board of Directors. Following is a summary of the Adviser’s trading policies which are described in Part 2 of its Form ADV. The Adviser is primarily a discretionary investment adviser. Accordingly, the Adviser generally
determines the securities and quantities to be bought and sold for each client’s account.
Statement of Additional Information | Davis Funds | 9
Best Execution. The Adviser follows procedures intended to provide reasonable assurance of best execution.
However, there can be no assurance that best execution will in fact be achieved in any given transaction.
The Adviser seeks to place portfolio transactions with brokers or dealers who will execute transactions as efficiently
as possible and at the most favorable net price. In determining what constitutes best execution, the Adviser not only considers quantitative
factors (e.g., the possible transaction cost), but also whether the transaction represents the best qualitative
execution. In placing executions and paying brokerage commissions or dealer markups, the Adviser considers, among other factors,
price, commission, timing, aggregated trades, capable floor brokers or traders, competent block trading coverage, ability
to position, capital strength and stability, reliable and accurate communication and settlement processing, use of automation,
knowledge of other buyers or sellers, arbitrage skills, administrative ability, underwriting and provision of information
on the particular security or market in which the transaction is to occur, research, the range and quality of the services made
available to clients, and the payment of bona fide client expenses. To the extent that clients direct brokerage, the Adviser cannot
be responsible for achieving best execution. The Adviser may place orders for portfolio transactions with broker-dealers who have
sold shares of funds which the Adviser serves as adviser or sub-adviser. However, when the Adviser places orders for portfolio
transactions, it does not give any consideration to whether a broker-dealer has sold shares of the funds which the Adviser
serves as adviser or sub-adviser. The applicability of specific criteria will vary depending on the nature of the transaction,
the market in which it is executed and the extent to which it is possible to select from among multiple broker-dealers.
Cross Trades. When the Adviser deems it to be advantageous, the Funds may purchase or sell securities
directly from or to another client account which is managed by the Adviser. This may happen due to a variety
of circumstances, including situations when the Funds must purchase securities due to holding excess cash and,
at the same time, a different client of the Adviser must sell securities in order to increase its cash position. Cross trades
are only executed when deemed beneficial to the Funds and the other client and the Adviser has adopted written procedures to ensure
fairness to both parties.
Investment Allocations. The Adviser considers many factors when allocating securities among its clients, including
the Funds, including, but not limited to, the client’s investment style, applicable restrictions, availability of securities, available cash, anticipated liquidity, and existing holdings. The Adviser employs several Portfolio
Managers each of whom performs independent research and develops different levels of conviction concerning potential
investments. Clients managed by the Portfolio Manager performing the research may receive priority allocations of limited
investment opportunities that are in short supply, including IPOs.
Clients are not assured of participating equally or at all in any particular investment opportunity. The nature of a client’s investment style may exclude it from participating in many investment opportunities
even if the client is not strictly precluded from participation based on written investment restrictions. For example: (1) large-cap
value clients are unlikely to participate in IPOs of small-capitalization companies; (2) the Adviser may allocate short-term
trading opportunities to clients pursuing active trading strategies rather than clients pursuing long-term, buy-and-hold strategies;
(3) minimum block sizes may be optimal for liquidity which may limit the participation of smaller accounts; (4) it
is sometimes impractical for some custodians to deal with securities which are difficult to settle; and (5) private accounts and
managed money/wrap accounts generally do not participate in direct purchases of foreign securities, but may participate in
depositary receipts consisting of American Depositary Receipts (“ADRs”), European Depositary Receipts (“EDRs”), and Global Depositary Receipts (“GDRs”).
The Adviser attempts to allocate limited investment opportunities, including IPOs,
among clients in a manner that is fair and equitable when viewed over a considerable period of time and involving many allocations.
Generally, the Adviser allocates investments to clients utilizing a pro rata methodology. When the Adviser is limited
in the amount of a particular security it can purchase due to a limited supply, limited liquidity, or other reason, the Adviser
may allocate the limited investment opportunity to a subset of eligible clients.
The Adviser serves as investment adviser for a number of clients and may deal with
conflicts of interest when allocating investment opportunities among its various clients. For example: (1) the Adviser receives
different advisory fees from different clients; (2) the performance records of some clients are more public than the performance
records of other clients; and (3) the Adviser and its affiliates, owners, officers, and employees have invested substantial
amounts of their own capital in some client accounts (notably the Davis Funds, Selected Fund, Clipper Fund, and Davis ETFs),
but do not invest their own capital in every client’s account. The majority of the Adviser’s clients pursue specific investment strategies, many of which are similar. The Adviser expects that, over long periods of time, most clients pursuing similar
investment strategies should experience similar, but not identical, investment performance. Many factors affect investment
performance including but not limited to: (1) the timing of cash deposits and withdrawals to and from an account; (2) the
fact that the Adviser may not purchase or sell a given security on behalf of all clients pursuing similar strategies; (3) price
and timing differences when buying or selling securities; and (4) the clients’ own different investment restrictions. The Adviser’s trading policies are designed to minimize possible conflicts of interest in trading for its clients.
Limitations on Aggregate Investments in a Single Company. The Adviser’s policy is not to invest for the purpose of exercising control or management of other companies. In extraordinary circumstances,
the Adviser may seek to influence management. In such an event, appropriate government and regulatory filings would
be made.
Federal and state laws, as well as company documents (sometimes referred to as “poison pills”) may limit the percentage of a company’s outstanding shares which may be purchased or owned by the Adviser’s clients. This is especially true in heavily regulated industries such as insurance, banking, and real estate investment trusts.
Unless it can obtain an exception, the
Statement of Additional Information | Davis Funds | 10
Adviser will not make additional purchases of these companies for its clients if,
as a result of such purchase, shares in excess of the applicable investment limitation (for example, 9.9% of outstanding voting shares)
would be held by its clients in the aggregate.
Order Priority. The Adviser’s trading desk prioritizes incoming orders of similar purchases and sales of securities between institutional and managed money/wrap account orders. The Adviser’s trading desk typically executes orders for institutional clients, including investment companies, institutional private accounts, sub-advised
accounts, and others. Managed money/wrap account program sponsors typically execute orders for managed money/wrap accounts.
The Adviser’s trading desk attempts to coordinate the timing of orders with a trade rotation to prevent the Adviser from “bidding against itself” on orders. Generally, a block trade representing a portion of the total trade (approximately 1∕2 of an order given by the Portfolio Manager) is placed first for institutional and private
accounts. Once this trade is completed, the Adviser places orders for wrap accounts, one sponsor at a time. Sponsors of certain
model portfolios will execute trades for their clients. These model portfolio sponsors are included as a part of the wrap account
trade rotation. If the Adviser has not received a response from a model portfolio sponsor within a reasonable period of time,
the Adviser will resume through the trade rotation. If this occurs, it is possible that the model portfolio sponsor and
the Adviser will be executing similar trades for discretionary clients. The trading concludes with another block transaction for institutional
and private accounts. The trading desk follows procedures intended to provide reasonable assurance that no clients are
disadvantaged by this trade rotation and the compliance department monitors execution quality. However, there can be no assurance
that best execution will in fact be achieved in any given transaction.
Pattern Accounts. The Adviser serves as investment adviser for a number of clients which are patterned
after model portfolios or designated mutual funds managed by the Adviser. For example, a client pursuing the Adviser’s large-cap value strategy may be patterned after Davis New York Venture Fund. A client patterned after Davis New
York Venture Fund will usually have all of its trading (other than trading reflecting cash flows due to client deposits or
withdrawals) aggregated with that of Davis New York Venture Fund. In unusual circumstances, the Adviser may not purchase or sell
a given security on behalf of all clients (even clients managed in a similar style), and it may not execute a purchase of securities
or a sale of securities for all participating clients at the same time.
Orders for accounts which are not patterned after model portfolios or designated mutual
funds are generally executed in the order received by the trading desk with the following exceptions: (1) the execution
of orders for clients that have directed that particular brokers be used may be delayed until the orders which do not direct a particular
broker have been filled; (2) the execution of orders may be delayed when the client (or responsible Portfolio Manager)
requests such delay due to market conditions in the security to be purchased or sold; and (3) the execution of orders
which are to be bunched or aggregated.
Aggregated Trades. Generally, the Adviser’s equity Portfolio Managers communicate investment decisions to a centralized equity trading desk while fixed income Portfolio Managers normally place their transactions
themselves. The Adviser frequently follows the practice of aggregating orders of various institutional clients
for execution if the Adviser believes that this will result in the best net price and most favorable execution. In some instances,
aggregating trades could adversely affect a given client. However, the Adviser believes that aggregating trades generally benefits
clients because larger orders tend to have lower execution costs and the Adviser’s clients do not compete with each other trading in the market. Directed brokerage trades in a particular security are typically executed separately from, and possibly after, the Adviser’s other client trades.
In general, all of the Adviser’s clients (excluding clients who are directing brokerage and managed account/wrap programs) seeking to purchase or sell a given security at approximately the same time will,
generally, be aggregated into a single order or series of orders. When an aggregated order is filled, all participating clients receive
the price at which the order was executed. If, at a later time, the participating clients wish to purchase or sell additional
shares of the same security or if additional clients seek to purchase or sell the same security, then the Adviser will issue a new order
and the clients participating in the new order will receive the price at which the new order was executed.
In the event that an aggregated order is not entirely filled, the Adviser will allocate
the purchases or sales among participating clients in the manner it considers to be most equitable and consistent with its fiduciary
obligations to all such clients. Generally, partially-filled orders are allocated pro rata based on the initial order
submitted by each participating client.
In accordance with the various managed account/wrap programs in which the Adviser
participates, the Adviser typically directs all trading to the applicable program sponsor unless, in the Adviser’s reasonable discretion, doing so would adversely affect the client. Clients typically pay no commissions on trades executed through
program sponsors. In the event that an order to the sponsor of a managed account/wrap program is not entirely filled, the Adviser
will allocate the purchases or sales among the clients of that sponsor in the manner it considers to be most equitable and consistent
with its fiduciary obligations to all such clients. Generally, partially-filled orders are allocated among the particular sponsor’s participating clients on a random basis that is anticipated to be equitable over time. The Adviser may, if circumstances
permit, execute transactions for ETF clients through transfers-in-kind. There may be times that the Adviser is not able
to aggregate transactions because of applicable law or other considerations (such as tax or liquidity considerations) when
doing so might otherwise be advantageous.
Trading Error Correction. In the course of managing client accounts, it is possible that trading errors will
occur from time to time. The Adviser has adopted Trading Error Correction Policies & Procedures which,
when the Adviser is at fault, seek to place a client’s account in the same position it would have been had there been no error. The Adviser retains flexibility in
Statement of Additional Information | Davis Funds | 11
attempting to place a client’s account in the same position it would have been had there been no error. The Adviser attempts to treat all material errors uniformly, regardless of whether they would result in a
profit or loss to the client. For example, the Adviser may purchase securities from a client account at cost if they were acquired
due to a trading error. If more than one trading error or a series of trading errors is discovered in a client account, then
gains and losses on the erroneous trades may be netted.
Research Paid for with Commissions. The Adviser does not use client commissions (“Soft Dollars”) to pay for: (1) computer hardware or software or other electronic communications facilities; (2) publications,
both paper based or electronic, that are available to the general public; and (3) research reports that are created by parties
other than the broker-dealers providing trade execution, clearing, and/or settlement services to the Adviser’s clients. If the Adviser determines to purchase such services, it pays for them using its own resources.
The Adviser may receive research that is bundled with the trade execution, clearing,
and/or settlement services provided by a particular broker-dealer. The Adviser may take into account the products and services
as well as the execution capacity of a brokerage firm in selecting brokers. Thus, transactions may be directed to a brokerage
firm that provides: (1) important information concerning a company; (2) introductions to key company officers; (3) industry
and company conferences; and (4) other value added research services. The Adviser may have an incentive to select or
recommend a broker-dealer based on its interest in continuing to receive these value added research or services that the
Adviser believes are useful in its investment decision-making process but only when, in the Adviser’s judgment, the broker-dealer is capable of providing best execution for that transaction. If the Adviser were to direct brokerage to a firm providing these
value added services, the Adviser may receive a benefit as it may not have to pay for the services it has received.
Research or other services obtained in this manner may be used in servicing the Adviser’s other accounts, including in connection with other Adviser client accounts other than those that pay commissions
to the broker. Such products and services may disproportionately benefit other Adviser client accounts relative to the Funds
based on the amount of brokerage commissions paid by the Funds and such other Adviser client accounts. For example,
research or other services that are paid for through one client’s commissions may not be used in managing that client’s account.
The Adviser follows the concepts of Section 28(e) of the Securities Exchange Act of
1934. Subject to the criteria of Section 28(e), the Adviser may pay a broker a brokerage commission in excess of that
which another broker might have charged for effecting the same transactions, in recognition of the value of the brokerage
and research services provided by or through the broker. The Adviser’s Head Trader exercises their professional judgment to determine which brokerage firm is best suited to execute any given portfolio transaction. This includes transactions executed
through brokerage firms which provide the services listed above. The Adviser does not attempt to allocate soft dollar benefits
to client accounts proportionately to the commissions which the accounts pay to brokerage firms which provide research services.
The Adviser believes it is important to its investment decision-making to have access to independent research.
Exceptions. There are occasions when the Adviser varies the trading procedures and considerations
described above. The Adviser exercises its best judgment in determining whether clients should execute
portfolio transactions simultaneously with, prior to, or subsequent to the model portfolio or designated mutual fund that they
are patterned after. The factors that the Adviser considers in exercising its judgment include, but are not limited to, the
need for confidentiality of the purchase or sale, market liquidity of the securities in issue, the particular events or circumstances
that prompt the purchase or sale of the securities, and operational efficiencies. Even when transactions are executed on the
same day, clients may not receive the same price as the model portfolios or designated mutual funds they are patterned after.
If the transactions are not aggregated, such prices may be better or worse.
Portfolio Turnover. Because the equity Funds' portfolios are managed using the Davis Investment Discipline,
portfolio turnover is expected to be low. The Funds anticipate that, during normal market conditions,
their annual portfolio turnover rates will be less than 100%. However, depending upon market conditions, portfolio
turnover rates will vary. At times they could be high which could require the payment of larger amounts in brokerage commissions
and possibly more taxable distributions.
When the Adviser deems it to be appropriate, the Funds may engage in active and frequent
trading to achieve their investment objectives. Active trading may include participation in IPOs. Active trading may result
in the realization and distribution to shareholders of larger amounts of capital gains compared with a fund with less active
trading strategies which could increase shareholder tax liability. Active trading may also generate larger amounts of short-term
capital gains which are generally taxable as ordinary income when distributed to taxable shareholders. Frequent trading
also increases transaction costs which could detract from the Funds' performance.
ReFlow Liquidity Program. Davis Financial Fund, Davis Opportunity Fund, and Davis Balanced Fund may participate
in the ReFlow liquidity program, which is designed to provide an alternative liquidity source
for mutual funds experiencing redemptions of their shares. In order to pay cash to shareholders who redeem their
shares on a given day, a mutual fund typically must hold cash in its portfolio, liquidate portfolio securities, or borrow
money, all of which impose certain costs on the Fund. ReFlow Fund, LLC (“ReFlow”) provides participating mutual funds with another source of cash by standing ready to purchase shares from the Fund up to the amount of the Fund’s net redemptions on a given day. ReFlow then generally redeems those shares when the Fund experiences net sales. In return for this service,
the Fund will pay a fee to ReFlow at a rate determined by a daily auction with other participating mutual funds. The costs
to the Fund for participating in ReFlow are
Statement of Additional Information | Davis Funds | 12
expected to be influenced by and comparable to the cost of other sources of liquidity, such as the Fund’s short- term lending arrangements or the costs of selling portfolio securities to meet redemptions. In
accordance with federal securities laws, ReFlow is prohibited from acquiring more than 3% of the outstanding voting securities
of the Fund.
There is no assurance that ReFlow will have sufficient funds available to meet the Fund’s liquidity needs on a particular day. Investments in the Fund by ReFlow in connection with the ReFlow liquidity program
are not subject to the market timing limitations described in the Fund’s prospectus.
The Adviser believes that participation in the ReFlow liquidity program may assist in stabilizing the Fund’s net assets, to the benefit of the Fund and its shareholders, although there is no guarantee that the program will do so. To the extent the Fund’s net assets do not decline, the Adviser typically will also benefit.
Portfolio Commissions
The Funds paid the following brokerage commissions:
|
Fiscal Year-Ended December 31,
|
2025
|
2024
|
2023
|
|
DOF
|
|
|
|
|
Brokerage commissions paid:
|
$82,697
|
$151,205
|
$37,294
|
|
Amount paid to brokers providing research:
|
None
|
None
|
None
|
|
Amount paid to brokers providing services:
|
None
|
None
|
None
|
|
DFF
|
|
|
|
|
Brokerage commissions paid:
|
$86,803
|
$14,316
|
$81,262
|
|
Amount paid to brokers providing research:
|
None
|
None
|
None
|
|
Amount paid to brokers providing services:
|
None
|
None
|
None
|
|
DREF
|
|
|
|
|
Brokerage commissions paid:
|
$33,697
|
$33,601
|
$44,607
|
|
Amount paid to brokers providing research:
|
None
|
None
|
None
|
|
Amount paid to brokers providing services:
|
None
|
None
|
None
|
|
DBF
|
|
|
|
|
Brokerage commissions paid:
|
$25,348
|
$16,200
|
$10,628
|
|
Amount paid to brokers providing research:
|
None
|
None
|
None
|
|
Amount paid to brokers providing services:
|
None
|
None
|
None
|
Davis Government Bond Fund and Davis Government Money Market Fund did not pay any
commissions in the preceding three years.
Investments in Certain Broker-Dealers. As of December 31, 2025, the Funds owned the following securities (excluding repurchase agreements) issued by any of their regular brokers and dealers. The Funds'
regular brokers and dealers are the ten brokers or dealers receiving the greatest amount of commissions from the Funds' portfolio
transactions during the most recent fiscal year, the ten brokers or dealers engaging in the largest amount of principal
transactions during the most recent fiscal year, and the ten brokers or dealers that sold the largest amount of Fund shares during
the most recent fiscal year. As of the most recent fiscal year-ended December 31, 2025, the Funds owned securities (excluding
repurchase agreements) issued by the following broker dealer(s):
|
Fund
|
Broker-Dealer
|
Value
|
|
DOF
|
None
|
|
|
DFF
|
Wells Fargo & Co.
|
$116,476,141
|
|
|
JPMorgan Chase & Co.
|
$92,753,605
|
|
|
Charles Schwab Corp.
|
$13,195,613
|
|
DREF
|
None
|
|
|
DBF
|
Wells Fargo & Co.
|
$4,984,149
|
|
|
JPMorgan Chase & Co.
|
$4,428,592
|
|
|
Goldman Sachs Group
|
$3,504,485
|
|
DGBF
|
None
|
|
|
DGMMF
|
None
|
|
Investment Restrictions
The Funds follow investment strategies developed in accordance with their investment
objectives, policies, and restrictions described in their prospectus and this SAI.
The Funds have adopted the fundamental investment policies set forth below which may
not be changed without shareholder approval. Where necessary, an explanation following a fundamental policy describes
the Funds' practices with respect to that policy as permitted by governing rules, regulations, and interpretations. If the governing
rules, regulations, and/or interpretations change, the Funds' investment practices may change without a shareholder
vote.
Statement of Additional Information | Davis Funds | 13
The fundamental investment restrictions set forth below may not be changed without
the approval of the lesser of: (1) 67% or more of the voting securities present at such meeting if the holders of more than
50% of the outstanding voting securities of such company are present or represented by proxy; or (2) more than 50% of the outstanding
voting securities of such company.
Except for the fundamental investment policies regarding illiquid securities and borrowing,
all percentage restrictions apply as of the time of an investment without regard to any later fluctuations in the value
of portfolio securities or other assets. All references to the assets of the Funds are in terms of current value.
◼
Diversification (All Funds except Davis Financial Fund). The Fund may not make any investment that is inconsistent with its classification as a diversified investment company under the 1940 Act.
Further Explanation of Diversification Policy. To remain classified as a diversified investment company under the 1940 Act, a Fund must conform with the following: with respect to 75% of its total assets,
a diversified investment company may not invest more than 5% of its total assets, determined at market or other fair
value at the time of purchase, in the securities of any one issuer or invest in more than 10% of the outstanding voting
securities of any one issuer, determined at the time of purchase. These limitations do not apply to investments in securities
issued or guaranteed by the U.S. Government or its agencies or instrumentalities.
◼
Diversification (Davis Financial Fund). The Fund is not required to diversify its investments.
Further Explanation of Diversification Policy. The Fund is classified as non-diversified under the 1940 Act. The Fund intends to remain classified as a regulated investment company under the Internal
Revenue Code. This requires the Fund to conform to the following: at the end of each quarter of the taxable year, at least 50% of the value of the Fund’s total assets must be represented by: cash and cash items, U.S. Government securities, securities
of other regulated investment companies, and “other securities.” For this purpose, “other securities” does not include investments in the securities of any one issuer representing more than 5% of the value of the Fund’s total assets or more than 10% of the issuer’s outstanding voting securities.
◼
Concentration (Davis Opportunity Fund, Davis Balanced Fund, Davis Government Bond
Fund, and Davis Government Money Market Fund). The Fund may not concentrate its investments in the securities of issuers primarily
engaged in any particular industry or group of industries.
Further Explanation of Concentration Policy. A Fund may not invest 25% or more of its total assets, taken at market value, in the securities of issuers primarily engaged in any particular industry (other than
securities issued or guaranteed by the U.S. Government or its agencies or instrumentalities). The Fund generally uses the
Global Industry Classification Standard (“GICS”) as developed by Morgan Stanley Capital International and S&P Global to determine industry classification. GICS presents industry classification as a series of levels (i.e., sector, industry
group, industry, and sub-industry). For purposes of measuring concentration, a Fund generally classifies companies at the “industry group” or “industry” level. However, further analysis may lead the Adviser to classify companies at the sub-industry
level. The Adviser will only measure concentration at the sub-industry level when it believes that the various
sub-industries in question can reasonably be expected to be impacted differently to a material extent by future economic events. For example, in the “Insurance” industry, the Adviser believes that the sub-industries (insurance brokers, life &
health insurance, multi-line insurance, property & casualty insurance, and reinsurance) can reasonably be expected to be impacted
differently to a material extent by future economic events such as natural disasters, global politics, inflation, unemployment,
technology, etc. In addition, the Adviser may reclassify a company into an entirely different sector if it believes
that the GICS classification on a specific company does not accurately describe the company.
◼
Concentration (Davis Financial Fund). The Fund concentrates its investments in the financial services industry.
Further Explanation of Concentration Policy. Financial services are a “sector” composed of a number of “industries,” examples of which are included in the following paragraph. The concentration policy
requires the Fund to invest at least 25% of its assets in securities principally engaged in the financial services group
of industries which together make up the financial services sector. Due to the non-fundamental Name Policy, under normal circumstances,
the Fund invests at least 80% of its net assets, plus any borrowing for investment purposes, in securities issued
by companies principally engaged in the financial services sector.
A company is “principally engaged” in financial services if it owns financial services related assets constituting at least 50% of the total value of the company’s assets or if at least 50% of the company’s revenues are derived from its provision of financial services. The financial services sector consists of several different
industries that behave differently in different economic and market environments, for example: banking, insurance, and securities
brokerage houses. Financial services companies include those with their principal business activity in one of
the following areas: banks, financial services, consumer finance, capital markets, insurance, and mortgage REITs.
The Fund may not invest 25% or more of its total assets, taken at market value, in
the securities of issuers primarily engaged in any particular industry (other than issuers in the financial services sector
or securities issued or guaranteed by the U.S. Government or its agencies or instrumentalities). The Fund generally uses
the Global Industry Classification Standard (“GICS”) as developed by Morgan Stanley Capital International and S&P Global to determine industry classification. GICS presents industry classification as a series of levels (i.e.,
sector, industry group, industry, and sub-industry). For purposes of measuring concentration, the Fund generally classifies companies at the “industry group” or
Statement of Additional Information | Davis Funds | 14
“industry” level. However, further analysis may lead the Adviser to classify companies at the sub-industry level. The Adviser will only measure concentration at the sub-industry level when it believes
that the various sub-industries in question can reasonably be expected to be impacted differently to a material extent
by future economic events. For example, in the “Insurance” industry, the Adviser believes that the sub-industries (insurance brokers, life & health insurance, multi-line insurance, property & casualty insurance, and reinsurance) can
reasonably be expected to be impacted differently to a material extent by future economic events such as natural
disasters, global politics, inflation, unemployment, technology, etc. In addition, the Adviser may reclassify a company into
an entirely different sector if it believes that the GICS classification on a specific company does not accurately describe
the company.
◼
Concentration (Davis Real Estate Fund). The Fund concentrates its investments in real estate securities.
Further Explanation of Concentration Policy. Real estate is a “sector” composed of a number of “industries,” examples of which are included in the following paragraph. The concentration policy requires the
Fund to invest at least 25% of its assets in securities principally engaged in the real estate group of industries which
together makeup the real estate sector. Due to the non-fundamental Name Policy, under normal circumstances the Fund invests
at least 80% of its net assets plus any borrowing for investment purposes in securities issued by companies principally
engaged in the real estate industry.
Real estate securities are issued by companies that have at least 50% of the value
of their assets, gross income, or net profits attributable to ownership, financing, construction, management or sale of
real estate, or to products or services that are related to real estate or the real estate industry. Real estate companies include
real estate investment trusts or other securitized real estate investments, brokers, developers, lenders, and companies with
substantial real estate holdings such as paper, lumber, hotel, and entertainment companies.
The Fund may not invest 25% or more of its total assets, taken at market value, in
the securities of issuers primarily engaged in any particular industry (other than real estate securities or securities
issued or guaranteed by the U.S. Government or its agencies or instrumentalities). The Fund generally uses the
Global Industry Classification Standard (“GICS”) as developed by Morgan Stanley Capital International and S&P Global to determine industry classification. GICS presents industry classification as a series of levels (i.e., sector, industry
group, industry, and sub-industry). For purposes of measuring concentration, the Fund generally classifies companies at the “industry group” or “industry” level. However, further analysis may lead the Adviser to classify companies at the sub-industry
level. The Adviser will only measure concentration at the sub-industry level when it believes that the various
sub-industries in question can reasonably be expected to be impacted differently to a material extent by future economic events. For example, in the “Insurance” industry, the Adviser believes that the sub-industries (insurance brokers, life &
health insurance, multi-line insurance, property & casualty insurance, and reinsurance) can reasonably be expected to be impacted
differently to a material extent by future economic events such as natural disasters, global politics, inflation, unemployment,
technology, etc. In addition, the Adviser may reclassify a company into an entirely different sector if it believes
that the GICS classification on a specific company does not accurately describe the company.
◼
Issuing Senior Securities (All Funds). The Funds may not issue senior securities, except as permitted under applicable law, including the 1940 Act and published SEC staff positions.
Further Explanation of Issuing Senior Securities. The Funds may not issue senior securities, except as provided by the 1940 Act and any rules, regulations, orders, or letters issued thereunder. This limitation
does not apply to selling short against the box. See the non-fundamental restriction further limiting short selling below. The 1940 Act defines a “Senior Security” as any bond, debenture, note, or similar obligation or instrument constituting a security and evidencing indebtedness, and any stock of a class having priority over any other class as to
distribution of assets or payment of dividends.
◼
Borrowing (All Funds). The Funds may not borrow money, except to the extent permitted by applicable law
including the 1940 Act and published SEC staff positions.
Further Explanation of Borrowing Policy. A Fund may borrow from banks provided that, immediately thereafter, it has 300% asset coverage for all borrowings. A Fund may purchase additional securities
so long as borrowings do not exceed 5% of its total assets. A Fund may obtain such short-term credit as may be necessary
for the clearance of purchases and sales of portfolio securities. In the event that market fluctuations cause borrowing
to exceed the limits stated above, the Adviser would act to remedy the situation as promptly as possible, normally within
three business days. The Adviser is not required to dispose of portfolio holdings immediately if a Fund would suffer losses
as a result.
◼
Underwriting (All Funds). The Funds may not underwrite securities of other issuers except to the extent permitted
by applicable law, including the 1940 Act and published SEC staff positions.
Further Explanation of Underwriting Policy. The Funds may not underwrite securities of other issuers, except insofar as the Funds may be deemed to be underwriters in connection with the disposition of their
portfolio securities.
◼
Investments in Commodities and Real Estate (All Funds). The Funds may not purchase or sell commodities or real estate, except to the extent permitted by applicable law, including the 1940 Act and published
SEC staff positions.
Further Explanation of Policy Restricting Investments in Commodities and Real Estate.
The Funds may purchase or sell financial futures contracts, options on financial futures contracts, currency contracts,
and options on currency contracts as
Statement of Additional Information | Davis Funds | 15
described in their prospectus and SAI. The Funds may not purchase or sell real estate,
except that the Funds may invest in securities that are directly or indirectly secured by real estate or issued by issuers
that invest in real estate.
◼
Making Loans (All Funds). The Funds may not make loans to other persons, except as allowed by applicable law
including the 1940 Act and published SEC staff positions.
Further Explanation of Lending Policy. The acquisition of investment securities or other investment instruments, entering
into repurchase agreements, leaving cash on deposit with the Funds' custodian, and
similar actions are not deemed to be the making of a loan.
To generate income and offset expenses, the Funds may lend portfolio securities to
broker-dealers and other financial institutions that the Adviser believes to be creditworthy in an amount up to 33 1∕3% of its total assets, taken at market value. While securities are on loan, the borrower will pay the Funds any income accruing
on the security. The Funds may invest any collateral it receives in additional portfolio securities, typically U.S. Treasury
notes, certificates of deposit, other high-grade, short-term obligations, or interest-bearing cash equivalents. The Funds are still
subject to gains or losses due to changes in the value of securities that they have lent.
When the Funds lend their securities, they will require the borrower to give the Funds
collateral in cash or U.S. Government securities. The Funds will require collateral in an amount equal to
at least 100% of the current value of the securities lent, including accrued interest. The Funds have the right to call
a loan and obtain the securities lent any time on notice of not more than five business days. The Funds may pay reasonable fees in
connection with such loans.
Non-Fundamental Investment Policies
The Funds have adopted and will follow the non-fundamental investment policies set
forth below which may be changed by the Funds' Board of Directors without the approval of the Funds' shareholders.
◼
Illiquid Securities. A Fund will not purchase or hold illiquid securities if more than 15% of the value of the Fund’s net assets would be invested in such securities. If illiquid securities exceeded 15% of the value of the Fund’s net assets, the Adviser would attempt to reduce the Fund’s investment in illiquid securities in an orderly fashion. Davis Government Money Market Fund may not purchase illiquid securities if more than 10% of the value of the Fund’s net assets would be invested in such securities.
◼
High-Yield, High-Risk Securities. The Funds will not purchase debt securities rated BB or Ba or lower (sometimes referred
to as “Junk Bonds”) if the securities are in default at the time of purchase or if such purchase would then cause more than 20% of the Funds' net assets to be invested in such lower-rated securities.
◼
Short Selling. The Funds will not sell any security short if it would cause more than 5% of their
total assets, taken at market value, to be sold short. This limitation does not apply to selling short against the
box.
◼
Investing for Control. The Funds do not invest for the purpose of exercising control or management of other
companies.
◼
Mortgage, Pledge, Lend or Hypothecate Assets. The Funds will not mortgage, pledge, lend, or hypothecate more than 33 1∕3% of their total assets, taken at market value, in securities lending or other activities.
◼
Name Policy (Davis Financial Fund, Davis Real Estate Fund, Davis Government Bond Fund
and Davis Government Money Market Fund). Under normal circumstances, Davis Financial Fund invests at least 80% of net assets
plus any borrowing for investment purposes in securities issued by companies in the financial
services sector, and Davis Real Estate Fund invests at least 80% of net assets plus any borrowing for investment purposes
in securities issued by companies in the real estate sector. Under normal circumstances, Davis Government Bond Fund and Davis
Government Money Market Fund invest exclusively in U.S. Government securities and repurchase agreements collateralized
by U.S. Government securities. The Funds also own other assets that are not investments, typically cash
and receivables. Davis Financial Fund, Davis Real Estate Fund, Davis Government Bond Fund, and Davis Government Money Market
Fund will comply with the Name Policy as of the time an investment is made. If at some point a Fund no longer
meets the 80% test (e.g., due to value changes), it would not be required to sell assets. Any future investments would need
to be made in a manner that tends to bring the Fund back into compliance. In addition, because the 80% test applies under “normal circumstances,” a Fund could depart from the 80% requirement to take temporary defensive positions or due
to other unusual events (e.g., large in-flows or redemptions).
Davis Financial Fund, Davis Real Estate Fund, Davis Government Bond Fund, and Davis
Government Money Market Fund will provide the Fund’s shareholders with at least 60 days’ prior notice before changing their Name Policies such that they would invest, under normal circumstances, less than 80% of their net assets plus any
borrowing for investment purposes in financial companies, real estate companies, and U.S. Government securities and repurchase
agreements collateralized with U.S. Government securities (both Davis Government Bond Fund and Davis Government Money
Market Fund), respectively.
Statement of Additional Information | Davis Funds | 16
Section II:
The Funds and Key Persons
The Funds and Key Persons
This SAI should be read in conjunction with the Funds' prospectus. This SAI supplements
the information available in the prospectus.
Organization of the Funds
The Funds. Davis Series, Inc. is an open-end, diversified management investment company incorporated
in Maryland in 1976 and registered under the 1940 Act. Davis Series, Inc. is a series investment company
that may issue multiple series, each of which would represent an interest in its separate portfolio. Davis Series, Inc. currently
offers six series: Davis Financial Fund, Davis Opportunity Fund, Davis Real Estate Fund, Davis Balanced Fund, Davis Government
Bond Fund, and Davis Government Money Market Fund. On November 1, 1995, Davis Series, Inc. changed its
name from Retirement Planning Funds of America, Inc., to Davis Series, Inc.
Fund Shares. The Funds may issue shares in different classes. The Funds’ shares currently are divided into three classes of shares: Class A, Class C, and Class Y. The Board of Directors may offer additional
series or classes in the future and may at any time discontinue the offering of any series or class of shares. Each share, when
issued and paid for in accordance with the terms of the offering, is fully paid and non-assessable. Shares have no preemptive or subscription rights. Each of the Funds’ shares represent an interest in the assets of the Fund issuing the shares and have
identical voting, dividend, liquidation, and other rights and the same terms and conditions as any other shares except that: (1)
each dollar of net asset value per share is entitled to one vote; (2) other than for DGMMF, the expenses related to a particular
class, such as those related to the distribution of each class and the transfer agency expenses of each class, are borne
solely by each such class (all expenses for DGMMF are allocated evenly across all classes of shares based upon the relative portion
of net assets represented by each class); (3) each class of shares votes separately with respect to provisions of the
Rule 12b-1 Distribution Plan that pertain to a particular class; and (4) other matters for which separate class voting is appropriate
under applicable law. Each fractional share has the same rights, in proportion, as a full share. Due to the differing expenses
of the classes, dividends are likely to be lower for Class C shares than for Class A shares and are likely to be higher for Class Y
shares than for any other class of shares.
For some issues, such as the election of directors, all of Davis Series, Inc.’s authorized series vote together. For other issues, such as approval of the advisory agreement, each authorized series votes separately.
Shares do not have cumulative voting rights. Therefore, the holders of more than 50% of the voting power can elect all
of the directors. Rule 18f-2 under the 1940 Act provides that any matter required to be submitted under the provisions of the
1940 Act or applicable state law or otherwise to the shareholders of the outstanding voting securities of an investment company
will not be deemed to have been effectively acted on unless approved by the holders of a majority of the outstanding shares of
each series affected by such matter. Rule 18f-2 further provides that a series shall be deemed to be affected by a matter
unless it is clear that the interests of each series in the matter are identical or that the matter does not affect any interest
of such series. Rule 18f-2 exempts the selection of independent accountants and the election of members of the Board of Directors from
the separate voting requirements of the Rule.
In accordance with applicable Maryland law and Davis Series, Inc.’s bylaws, the Funds do not hold regular annual shareholder meetings. Shareholder meetings are held when they are required under the 1940 Act
or when otherwise called for special purposes. Special shareholder meetings may be called on the written request of shareholders
of at least 25% of the voting power that could be cast at the meeting. The Funds will provide assistance in calling
and holding such special meetings to the extent required by Maryland statutes or SEC rules and regulations then in effect.
Directors and Officers
Each of the Independent Directors/Trustees and officers holds identical offices with
each of the Davis Funds, Selected Fund, and Clipper Fund (five registrants, a total of 15 separate series): Davis New York
Venture Fund, Inc., Davis Series, Inc., Davis Variable Account Fund, Inc., Selected American Shares, Inc., and Clipper Funds Trust.
The five registrants have the same Directors/Trustees. Certain Directors/Trustees and officers also may hold similar
positions with Davis Fundamental ETF Trust, which is also managed by the Adviser.
The Funds' Board of Directors (the “Board”) supervises the business and management of the Funds. The Board establishes the Funds' policies and meets regularly to review the activities of the officers, who
are responsible for day-to-day operations of the Funds, the Adviser, and certain other service providers. The Board approves all
significant agreements between the Funds and those companies that furnish services to the Funds. Directors are elected and
serve until their successors are elected and qualified. Information about the Directors, including their business addresses, dates
of birth, principal occupations during the past five years, and other current Directorships of publicly traded companies or funds
are set forth in the table below.
The Board has appointed an Independent Director as Chairman. The Chairman presides
at meetings of the Directors and may call meetings of the Board and any Board committee whenever deemed necessary. The
Chairman may act as a liaison with the Funds' management, officers, attorneys, and other Directors generally between meetings.
The Chairman may perform such other functions as may be requested by the Board from time to time. The Board has
designated a number of standing committees as further described below, each of which has a Chairman. The Board also
may designate working groups or ad hoc committees as it deems appropriate.
Statement of Additional Information | Davis Funds | 17
The Board believes that this leadership structure is appropriate because it allows
the Board to exercise informed and independent judgment over matters under its purview and it allocates areas of responsibility
among committees or working groups of Directors and the full Board in a manner that enhances effective oversight.
The Board also believes that having a majority of Independent Directors is appropriate and in the best interest of the Funds'
shareholders. Nevertheless, the Board also believes that having interested persons serve on the Board brings corporate and
financial viewpoints that are, in the Board’s view, crucial elements in its decision-making process. The leadership structure of the Board may be changed at any time and in the discretion of the Board, including in response to changes in circumstances
or the characteristics of the Funds.
Directors
For the purposes of their service as Directors to the Davis Funds, the business address
for each of the Directors is: 2949 East Elvira Road, Suite 101, Tucson, AZ 85756. Subject to exceptions and exemptions which
may be granted by the Independent Directors, Directors must retire from the Board of Directors and cease being a Director
at the close of business on the last day of the calendar year in which the Director attains age seventy-eight (78).
|
Name, Date of Birth,
Position(s) Held with
Fund, Length of Service
|
Principal Occupation(s) During Past 5
Years
|
Number of
Portfolios
Overseen
|
Other Directorships Held by
Director During the Past 5 Years
|
|
Independent Directors:
|
|
|
|
|
Francisco Borges
(11/17/51)
Director since 2025
|
Retired; Chairman and Head of
Secondaries, Ares Management Corp.
(global alternative investment manager)
until 2024; Chairman and Managing
Partner, Landmark Partners, LLC (private
equity firm) until 2021.
|
15
|
Director, Selected American Shares,
Inc. (consisting of one
portfolio); Trustee, Clipper Funds
Trust (consisting of one portfolio);
Chairman and Trustee, John S. and
James L. Knight Foundation;
Chairman/Director, Assured Guaranty
Ltd. (financial guaranty insurance
business); Trustee, Millbrook School;
Director, Hartford HealthCare
(healthcare network).
|
|
John Gates, Jr.
(08/02/53)
Director since 2007
|
Executive Chairman, TradeLane
Properties LLC (industrial real estate
company); Chairman and Chief Executive
Officer of PortaeCo LLC (private
investment company).
|
15
|
Director, Selected American Shares,
Inc. (consisting of one
portfolio); Trustee, Clipper Funds
Trust (consisting of one portfolio);
Director, Miami Corp. (diversified
investment company).
|
|
Samuel Iapalucci
(07/19/52)
Director since 2006
Chairman since 2025
|
Retired; Executive Vice President and Chief
Financial Officer, CH2M HILL Companies,
Ltd. (engineering) until 2008.
|
15
|
Director, Selected American Shares,
Inc. (consisting of one portfolio);
Trustee, Clipper Funds Trust
(consisting of one portfolio).
|
|
Katherine MacWilliams
(01/19/56)
Director since 2025
|
Retired; Chief Financial Officer, Caridian
BCT, Inc. (medical device company) until
2012.
|
15
|
Director, Selected American Shares,
Inc. (consisting of one portfolio);
Trustee, Clipper Funds Trust
(consisting of one portfolio).
|
|
Lara Vaughan
(04/20/69)
Director since 2021
|
Chief Executive Officer and Chief Financial
Officer of Parchman, Vaughan, & Company,
L.L.C. (investment bank).
|
15
|
Director, Selected American Shares,
Inc. (consisting of one portfolio);
Trustee, Clipper Funds Trust
(consisting of one portfolio).
|
|
Interested Directors:
|
|
|
|
|
Andrew Davis
(06/25/63)
Director since 1997
|
President or Vice President of each Davis
Fund, Selected Fund, and Clipper Fund;
President, Davis Selected Advisers, L.P.,
and also serves as an executive officer of
certain companies affiliated with the
Adviser.
|
15
|
Director, Selected American Shares,
Inc. (consisting of one portfolio);
Trustee, Clipper Funds Trust
(consisting of one portfolio).
|
Statement of Additional Information | Davis Funds | 18
|
Name, Date of Birth,
Position(s) Held with
Fund, Length of Service
|
Principal Occupation(s) During Past 5
Years
|
Number of
Portfolios
Overseen
|
Other Directorships Held by
Director During the Past 5 Years
|
|
Christopher Davis
(07/13/65)
Director since 1997
|
President or Vice President of each Davis
Fund, Selected Fund, Clipper Fund, and
Davis ETF; Chairman, Davis Selected
Advisers, L.P., and also serves as an
executive officer of certain companies
affiliated with the Adviser, including sole
member of the Adviser’s general partner,
Davis Investments, LLC.
|
15
|
Director, Selected American Shares,
Inc. (consisting of one
portfolio); Trustee, Clipper Funds
Trust (consisting of one portfolio);
Lead Independent Director, Graham
Holdings Company (educational and
media company); Director, The
Coca-Cola Company (beverage
company); Director, Berkshire
Hathaway Inc. (financial services).
|
Andrew Davis and Christopher Davis own partnership units (directly, indirectly, or
both) of the Adviser and are considered to be “interested persons” of the Funds as defined in the 1940 Act. Andrew Davis and Christopher Davis are brothers.
Independent Directors’ Compensation
Independent Directors receive an annual retainer for their service. During the fiscal
year-ended December 31, 2025, the compensation paid to the Directors who are not considered to be interested persons
of the Funds is listed in the table below. The Directors receive no pecuniary retirement benefits accrued as Fund expenses. Interested
Directors are not compensated by the Funds.
|
Independent
Directors
|
DOF
|
DFF
|
DREF
|
DBF
|
DGBF
|
DGMMF
|
Aggregate Fund
Compensation(1)
|
Total Complex
Compensation(2)
|
|
F. Borges
|
$8,750
|
$16,921
|
$2,188
|
$4,132
|
$259
|
$1,530
|
$33,780
|
$125,000
|
|
J. Gates Jr.
|
$8,750
|
$16,921
|
$2,188
|
$4,132
|
$259
|
$1,530
|
$33,780
|
$125,000
|
|
S. Iapalucci
|
$8,750
|
$16,921
|
$2,188
|
$4,132
|
$259
|
$1,530
|
$33,780
|
$125,000
|
|
K. MacWilliams
|
$8,998
|
$17,402
|
$2,250
|
$4,249
|
$267
|
$1,574
|
$34,740
|
$128,600
|
|
L. Vaughan
|
$8,750
|
$16,921
|
$2,188
|
$4,132
|
$259
|
$1,530
|
$33,780
|
$125,000
|
|
Director Emeritus
|
|
|
|
|
|
|
|
|
|
T Gayner(3)
|
$5,458
|
$10,575
|
$1,392
|
$2,576
|
$162
|
$949
|
$21,112
|
$78,125
|
1.
“Aggregate Fund Compensation” is the aggregate compensation paid for service as a director by all series of Davis Series, Inc.
2.
“Total Complex Compensation” is the aggregate compensation paid for service as a director by all mutual funds with the same investment adviser. There are six registered investment companies in the complex.
3.
Mr. Gayner retired in March 2025, currently serves as Director Emeritus, and can serve
as Director Emeritus until age 78.
Officers
All Davis Funds officers (including some Interested Directors) hold positions as executive
officers with the Adviser and its affiliates, including Davis Selected Advisers, L.P. (Adviser), Davis Selected Advisers–NY, Inc. (sub-adviser), Davis Distributors, LLC (the principal underwriter), Davis Investments, LLC (the sole general
partner of the Adviser), and other affiliated companies. The Davis Funds do not pay salaries to any of their officers.
Each of the Davis Funds' officers is elected annually. Davis Funds' officers serve until reelection or until their successor is
elected and qualified.
Lisa Cohen (born 04/25/89, Officer of Davis Series, Inc. since 2021). Vice President and Secretary of Davis New York Venture Fund, Inc., Davis Variable Account Fund, Inc., and Davis Series, Inc. (collectively, the “Davis Funds,” consisting of thirteen portfolios), Selected American Shares, Inc. (consisting of one portfolio),
Clipper Funds Trust (consisting of one portfolio), and Davis Fundamental ETF Trust (consisting of four portfolios); Vice
President, Chief Legal Officer, and Secretary of Davis Selected Advisers, L.P.; and also serves as an executive officer
of certain companies affiliated with the Adviser. Prior to assuming these positions, Ms. Cohen worked for Honeywell International, Inc. (January 2020 – June 2021) and as an attorney at Davis Selected Advisers, L.P. (December 2015 – January 2020).
Andrew Davis (born 06/25/63, Officer of Davis Series, Inc. since 1997). See description in the section on Interested Directors.
Christopher Davis (born 07/13/65, Officer of Davis Series, Inc. since 1997). See description in the section on Interested Directors.
Kenneth Eich (born 08/14/53, Officer of Davis Series, Inc. since 1997). Executive Vice President and Principal Executive Officer of Davis New York Venture Fund, Inc., Davis Variable Account Fund, Inc., and
Davis Series, Inc. (collectively, the “Davis Funds,” consisting of thirteen portfolios), Selected American Shares, Inc. (consisting of one portfolio), and Clipper Funds Trust (consisting of one portfolio); Trustee/Chairman, Executive Vice President,
and Principal Executive Officer of Davis Fundamental ETF Trust (consisting of four portfolios); Chief Operating Officer
of Davis Selected Advisers, L.P.; and also serves as an executive officer of certain companies affiliated with the Adviser.
Statement of Additional Information | Davis Funds | 19
Douglas Haines (born 03/04/71, Officer of Davis Series, Inc. since 2004). Vice President, Treasurer, Chief Financial Officer, Principal Financial Officer, and Principal Accounting Officer of Davis New York Venture
Fund, Inc., Davis Variable Account Fund, Inc., and Davis Series, Inc. (collectively, the “Davis Funds,” consisting of thirteen portfolios), Selected American Shares, Inc. (consisting of one portfolio), Clipper Funds Trust (consisting of one
portfolio), and Davis Fundamental ETF Trust (consisting of four portfolios); Vice President and Director of Fund Accounting of
Davis Selected Advisers, L.P.
Michaela McLoughry (born 03/21/81, Officer of Davis Series, Inc. since 2023). Vice President and Chief Compliance Officer of Davis New York Venture Fund, Inc., Davis Variable Account Fund, Inc., and
Davis Series, Inc. (collectively, the “Davis Funds,” consisting of thirteen portfolios), Selected American Shares, Inc. (consisting of one portfolio), Clipper Funds Trust (consisting of one portfolio), and Davis Fundamental ETF Trust (consisting of
four portfolios); Vice President and Chief Compliance Officer of Davis Selected Advisers, L.P.; and also serves as an executive
officer of certain companies affiliated with the Adviser. Prior to assuming these positions, Ms. McLoughry spent approximately
18 years in the Fund Accounting department at Davis Selected Advisers, L.P.
Standing Committees of the Board of Directors
Although the Board of Directors has general criteria that guide its choice of candidates
to serve on the Board of Directors, there are no specific required qualifications for Board membership, including with
respect to the diversity of candidates for Board membership. Candidates for Board membership nominated by shareholders are not
treated differently than candidates nominated from other sources. The Board of Directors believes that the different perspectives,
viewpoints, professional experience, education, and individual qualities of each Director represent a diversity
of experiences and a variety of complementary skills. Each Director has experience as a Director of the Davis Funds
and Selected Fund and Trustee of Clipper Fund. It is the Directors’ belief that this allows the Board of Directors, as a whole, to oversee the business of the Davis Funds in a manner consistent with the best interests of the shareholders of the Davis
Funds. When considering potential nominees to fill vacancies on the Board of Directors and as part of its annual self-evaluation,
the Board of Directors reviews the mix of skills and other relevant experiences of the Directors. Qualified candidates
will be people of proven character and talent who have achieved notable success in their professional careers. The specific
talents that the Nominating Committee of the Board of Directors seeks in a candidate depend to a great extent upon the Board of Directors’ needs at the time a vacancy occurs.
The table above provides professional experience of each Director on an individual
basis. This disclosure includes the length of time serving the Davis Funds, other directorships held, and their principal occupation
during the past five years. With their experience, each of the Directors has become familiar with the regulatory and investment
matters of the Davis Funds and have contributed to the Directors’ deliberations. In light of the Davis Funds' business and structure, the Board of Directors believes the experience of each Director is beneficial for overseeing the business of the Davis
Funds. Moreover, the Board of Directors believes that the different experiences and backgrounds of the Directors are complementary
and enhance the Board of Directors’ ability to oversee the Davis Funds' affairs.
Audit Committee. The Board of Directors has established an Audit Committee, which is comprised entirely
of Independent Directors (Katherine MacWilliams, Chair; Francisco Borges; and Lara Vaughan). The
Audit Committee has a charter. The Audit Committee reviews financial statements and other audit-related matters for the
Davis Funds. The Audit Committee also holds discussions with management and with the Independent Accountants concerning the scope of the audit and the auditor’s independence. The Audit Committee meets as often as deemed appropriate by the Audit
Committee. The Audit Committee met four times during the fiscal year-ended December 31, 2025.
The Board of Directors has determined that Katherine MacWilliams is the Davis Funds'
Independent Audit Committee Financial Expert pursuant to Section 407 of the Sarbanes-Oxley Act and as defined
by Item 3 of Form N-CSR of the 1940 Act. In their deliberations, the Board of Directors considered Ms. MacWilliams’: (1) professional experience; (2) independence as defined in Item 3 of Form N-CSR; and (3) integrity and absence of disciplinary history.
Nominating Committee. The Board of Directors has established a Nominating Committee, which is comprised
entirely of Independent Directors (Samuel Iapalucci, Chair; and Francisco Borges), which meets
as often as deemed appropriate by the Nominating Committee. The Davis Funds do not elect Directors annually. Each Director
serves until retirement, resignation, death, or removal. Subject to exceptions and exemptions which may be granted by the
Independent Directors, Directors must retire from the Board of Directors and cease being a Director at the close of business
on the last day of the calendar year in which the Director attains age seventy-eight (78). After formal retirement, Directors
may serve in emeritus status, attend board functions, and receive up to one-half the current compensation of Directors. The Nominating
Committee met one time during the fiscal year-ended December 31, 2025. The Nominating Committee reviews and nominates
persons to serve as members of the Board of Directors, and reviews and makes recommendations concerning the compensation
of the Independent Directors. The chairperson of the Nominating Committee also currently serves as the Chairman
of the Board and: (1) presides over Board meetings; (2) presides over executive sessions of the Independent Directors
of the Davis Funds, in addition to presiding over meetings of the committee; (3) participates with the officers and counsel in
the preparation of agendas and materials for Board meetings; (4) facilitates communication between the Independent Directors and
management, and among the Independent Directors; and (5) has such other responsibilities as the Board or Independent
Directors shall determine.
The Nominating Committee has a charter. When the Board of Directors is seeking a candidate
to become a Director, it considers qualified candidates received from a variety of sources, including having
authority to retain third-parties that may
Statement of Additional Information | Davis Funds | 20
receive compensation related to identifying and evaluating candidates. Shareholders
may propose nominees by writing to the Nominating Committee, in care of the Secretary of the Davis Funds, at 2949 East Elvira,
Suite 101, Tucson, Arizona 85756.
Brokerage Committee. The Board of Directors has established a Brokerage Committee, which is comprised
entirely of Independent Directors (John Gates, Jr., Chair), which meets as often as deemed appropriate
by the Brokerage Committee. The Brokerage Committee met one time during the fiscal year-ended December 31, 2025. The
Brokerage Committee reviews and makes recommendations concerning the Davis Funds' portfolio brokerage and trading
practices.
Risk Oversight
Registered investment companies, including Davis Funds, are subject to a variety of
risks, including investment risk, valuation risk, reputational risk, risk of operational failure or lack of business continuity,
and legal, compliance, and regulatory risk. Risk management seeks to identify and address risks, i.e., events or circumstances
that could have material adverse effects on the business, operations, shareholder services, investment performance or reputation
of the Funds.
Day-to-day management of Davis Funds, including risk management, is the responsibility
of the Davis Funds' contractual service providers, including the Funds' Adviser, Sub-Adviser, as applicable, the Distributor,
Custodian and Transfer Agent. Each of these entities is responsible for specific portions of the Funds' operations
including the processes and associated risks relating to the Funds' investments, integrity of cash movements, financial reporting,
operations, and compliance. The Board of Directors oversees the service providers’ discharge of their responsibilities including the processes they use to manage relevant risks. As part of its overall activities, the Board of Directors reviews
the management of the Funds' risk management structure by various departments of the Adviser including: Portfolio Management, Fund
Operations, Legal, and Internal Audit, as well as by Davis Funds' Chief Compliance Officer (“CCO”). The responsibility to manage the Funds' risk management structure on a day-to-day basis is within the Adviser’s overall investment management responsibilities. The Adviser has its own, independent interest in risk management.
The Board of Directors discharges risk oversight as part of its overall activities
with the assistance of its Audit Committee and CCO. In addressing issues regarding the Funds' risk management between meetings, appropriate
representatives of the Adviser communicate with the Chair of the Board of Directors or Davis Funds' CCO,
who is accountable and reports directly to the Board of Directors. Various personnel, including Davis Funds' CCO, the Adviser’s management, and other service providers (such as the Funds' independent accountants) make periodic reports to the
Board of Directors or to the Audit Committee with respect to various aspects of risk management.
The Board of Directors recognizes that not all risks that may affect the Funds can
be identified, that it may not be practical or cost-effective to eliminate or mitigate certain risks, that it may be necessary to
bear certain risks (such as investment-related risks) to achieve the Funds' investment objectives, and that the processes, procedures,
and controls employed to address certain risks may be limited in their effectiveness. Moreover, reports received by
the Directors as to risk management matters are typically summaries of the relevant information. As a result of the foregoing and other factors, the Board of Directors’ risk management oversight is subject to substantial limitations.
The Audit Committee assists the Board of Directors in reviewing with the independent
auditors, at various times throughout the year, matters relating to the annual audits and financial accounting and reporting
matters.
Davis Funds' CCO assists the Board of Directors in overseeing the significant investment
policies of the Funds. The CCO monitors these policies. The Board of Directors receives and considers the CCO’s annual written report which, among other things, summarizes material compliance issues that arose during the previous year
and any remedial action taken to address these issues, as well as any material changes to the compliance programs. The Board
of Directors also receives and considers reports from Davis Funds' CCO throughout the year. As part of its oversight responsibilities,
the Board of Directors has approved various compliance policies and procedures. Each Committee presents reports
to the Board of Directors which may prompt further discussion of issues concerning the oversight of the Funds' risk management.
The Board of Directors also may discuss particular risks that are not addressed in the Committee process.
Directors’ Fund Holdings
As of December 31, 2025, the Directors had invested the following amounts in all Funds
managed by the Adviser. Investments are listed in the following ranges: None, $1–10,000, $10,001–50,000, $50,001–100,000 and Over $100,000:
Statement of Additional Information | Davis Funds | 21
|
Independent
Directors
|
DOF
|
DFF
|
DREF
|
DBF
|
DGBF
|
DGMMF
|
Total Invested
In All Funds(1)
|
|
F. Borges
|
$50,001–
$100,000
|
Over $100,000
|
$50,001–
$100,000
|
$50,001–
$100,000
|
None
|
None
|
Over $100,000
|
|
J. Gates Jr.
|
None
|
None
|
None
|
None
|
None
|
None
|
Over $100,000
|
|
S. Iapalucci
|
None
|
None
|
None
|
Over $100,000
|
None
|
None
|
Over $100,000
|
|
K. MacWilliams
|
None
|
Over $100,000
|
None
|
$50,001–
$100,000
|
None
|
Over $100,000
|
Over $100,000
|
|
L. Vaughan
|
$50,001–
$100,000
|
$50,001–
$100,000
|
$1–$10,000
|
$50,001–
$100,000
|
None
|
$1–$10,000
|
Over $100,000
|
|
Interested
Directors(2)
|
|
|
|
|
|
|
|
|
A. Davis
|
None
|
Over $100,000
|
Over $100,000
|
None
|
None
|
$1–10,000
|
Over $100,000
|
|
C. Davis
|
Over $100,000
|
Over $100,000
|
Over $100,000
|
Over $100,000
|
None
|
Over $100,000
|
Over $100,000
|
(1)
“Total Invested in All Funds” is the aggregate dollar range of investments in all Funds overseen by the individual Director and managed by Davis Selected Advisers, L.P. This includes the Davis Funds, Selected Fund, and Clipper
Fund.
(2)
Interested Directors are employed by and own shares in the Adviser and are considered to be “interested persons” of the Davis Funds as defined in the 1940 Act.
Stock Ownership Guidelines. The Directors consider ownership of Funds in the Fund Complex by Directors to be
of utmost importance and believe that such ownership enhances the commitment of the Directors
to the Funds' future and aligns the interests of the Directors with those of the Funds' shareholders. Therefore, the Directors adopted minimum Directors’ stock ownership guidelines. These guidelines require that each Director shall beneficially
own and maintain ownership of shares of the Funds with an aggregate value, measured as of December 31 of each year, of at
least three times their respective annual retainer (not including any meeting fees or non-recurring compensation) for such year.
Interested Directors do not receive Directors’ fees, but maintain stock ownership positions in the Funds of at least three times the base annual retainer for an Independent Director. Newly elected Independent Directors have three years from the
date the Director is first elected on the Board of any of the Funds to reach this ownership level. As of December 31, 2025,
all of the Funds' Directors on such date met these suggested stock ownership guidelines.
Independent Directors’ Affiliations and Transactions
None of the Independent Directors (or their immediate family members) own any securities
issued by the Davis Funds' investment adviser, sub-adviser, principal underwriter, or any company (other than
a registered investment company) directly or indirectly controlling, controlled by, or under common control with the above listed
companies (hereafter referred to as the “Adviser and its affiliates”). Andrew Davis and Christopher Davis own partnership units (directly, indirectly, or both) in the Adviser and are considered to be Interested Directors.
None of the Independent Directors (or their immediate family members) have had any
direct or indirect interest, the value of which exceeds $120,000, during the last two calendar years in the Adviser or in the
Adviser and its affiliates.
None of the Independent Directors (or their immediate family members) have had any
material interest in any transaction, or series of transactions, during the last two calendar years, in which the amount involved
exceeds $120,000 and to which any of the following persons was a party: the Davis Funds, an officer of the Davis Funds,
or any fund managed by the Adviser, or in the Adviser and its affiliates.
None of the Independent Directors (or their immediate family members) have had any
direct or indirect relationships during the last two calendar years, in which the amount involved exceeds $120,000 and to
which any of the following persons was a party: the Davis Funds, an officer of the Davis Funds, or any fund managed by the
Adviser, or in the Adviser and its affiliates.
None of the officers of the Adviser and its affiliates have served during the last
two calendar years on the Board of Directors of a company where any Director of the Fund (or any of the Directors’ immediate family members) served as an officer.
Certain Shareholders of the Funds
As of April 1, 2026, the Funds' Directors and Officers, as a group, owned the following
percentages of each class of shares issued by the Funds. This percentage does not include investments controlled indirectly,
including holdings by Davis Selected Advisers, L.P.
|
|
Class A
|
Class C
|
Class Y
|
|
DOF
|
4%
|
-
|
*
|
|
DFF
|
10%
|
-
|
1%
|
|
DREF
|
26%
|
-
|
3%
|
|
DBF
|
2%
|
-
|
*
|
|
DGBF
|
*
|
-
|
-
|
|
DGMMF
|
1%
|
-
|
2%
|
(1)
This percentage does not include investments controlled indirectly, including holdings
by Davis Selected Advisers, L.P.
*
Indicates that officers and directors as a group owned less than 1% of the outstanding
shares of the indicated class of shares.
Statement of Additional Information | Davis Funds | 22
The following table sets forth, as of April 1, 2026, the name and holdings of each
person known by Davis Series, Inc., to be a record owner of more than 5% of the outstanding shares of any class of the Funds.
Other than as indicated below, the Funds are not aware of any shareholder who beneficially owns more than 25% of the Funds'
total outstanding shares. Shareholders owning a significant percentage of the Funds' shares do not affect the voting rights
of other shareholders.
|
Class of Shares
|
Name and Address of Shareholders
Owning More Than 5% of Fund
|
Percent of Class Outstanding
|
|
Class A Shares
|
DOF
|
|
|
|
Morgan Stanley Smith Barney LLC
New York, NY
|
14.59%
|
|
|
Charles Schwab & Co. Inc.
San Francisco, CA
|
11.23%
|
|
|
Merrill Lynch Pierce Fenner & Smith
Jacksonville, FL
|
8.19%
|
|
|
Wells Fargo Clearing Services LLC
Saint Louis, MO
|
7.81%
|
|
|
Pershing LLC
Jersey City, NJ
|
6.09%
|
|
Class A Shares
|
DFF
|
|
|
|
Charles Schwab & Co. Inc.
San Francisco, CA
|
16.38%
|
|
|
J.P. Morgan Securities LLC
Brooklyn, NY
|
9.90%
|
|
|
Morgan Stanley Smith Barney LLC
New York, NY
|
8.49%
|
|
|
Wells Fargo Clearing Services LLC
Saint Louis, MO
|
8.42%
|
|
|
Merrill Lynch Pierce Fenner & Smith
Jacksonville, FL
|
7.54%
|
|
|
Pershing LLC
Jersey City, NJ
|
5.92%
|
|
Class A Shares
|
DREF
|
|
|
|
Christopher Davis
New York, NY
|
14.61%
|
|
|
J.P. Morgan Securities LLC
Brooklyn, NY
|
9.46%
|
|
|
Morgan Stanley Smith Barney LLC
New York, NY
|
7.95%
|
|
|
Charles Schwab & Co. Inc.
San Francisco, CA
|
6.97%
|
|
|
Pershing LLC
Jersey City, NJ
|
5.97%
|
|
|
Wells Fargo Clearing Services LLC
Saint Louis, MO
|
5.10%
|
|
Class A Shares
|
DBF
|
|
|
|
Wells Fargo Clearing Services LLC
Saint Louis, MO
|
10.58%
|
|
|
Morgan Stanley Smith Barney LLC
New York, NY
|
10.38%
|
|
|
Edward D. Jones & Co.
Saint Louis, MO
|
9.27%
|
|
|
Charles Schwab & Co. Inc.
San Francisco, CA
|
7.48%
|
|
|
Merrill Lynch Pierce Fenner & Smith
Jacksonville, FL
|
7.16%
|
Statement of Additional Information | Davis Funds | 23
|
Class of Shares
|
Name and Address of Shareholders
Owning More Than 5% of Fund
|
Percent of Class Outstanding
|
|
|
Pershing LLC
Jersey City, NJ
|
7.15%
|
|
|
UBS WM USA
Weehawken, NJ
|
6.64%
|
|
|
LPL Financial
San Diego, CA
|
5.71%
|
|
Class A Shares
|
DGBF
|
|
|
|
Merrill Lynch Pierce Fenner & Smith
Jacksonville, FL
|
16.53%
|
|
|
LPL Financial
San Diego, CA
|
8.98%
|
|
|
Pershing LLC
Jersey City, NJ
|
7.57%
|
|
|
Wells Fargo Clearing Services LLC
Saint Louis, MO
|
7.32%
|
|
|
Raymond James
St. Petersburg, FL
|
6.31%
|
|
Class A Shares
|
DGMMF
|
|
|
|
Davis Selected Advisers, L.P.
Tucson, AZ
|
57.67%
|
|
|
Davis Distributors, LLC
Tucson, AZ
|
7.60%
|
|
|
State Street Bank & Trust Co.
Boston, MA
|
6.29%
|
|
Class C Shares
|
DOF
|
|
|
|
Wells Fargo Clearing Services LLC
Saint Louis, MO
|
29.55%
|
|
|
Charles Schwab & Co. Inc.
San Francisco, CA
|
24.29%
|
|
|
Morgan Stanley Smith Barney LLC
New York, NY
|
11.35%
|
|
|
UBS WM USA
Weehawken, NJ
|
9.79%
|
|
|
Pershing LLC
Jersey, City, NJ
|
6.72%
|
|
Class C Shares
|
DFF
|
|
|
|
Morgan Stanley Smith Barney LLC
New York, NY
|
23.27%
|
|
|
Pershing LLC
Jersey City, NJ
|
15.89%
|
|
|
Wells Fargo Clearing Services LLC
Saint Louis, MO
|
14.64%
|
|
|
Raymond James
St. Petersburg, FL
|
11.12%
|
|
|
LPL Financial
San Diego, CA
|
7.52%
|
|
|
Charles Schwab & Co. Inc.
San Francisco, CA
|
5.48%
|
|
Class C Shares
|
DREF
|
|
|
|
LPL Financial
San Diego, CA
|
55.95%
|
Statement of Additional Information | Davis Funds | 24
|
Class of Shares
|
Name and Address of Shareholders
Owning More Than 5% of Fund
|
Percent of Class Outstanding
|
|
|
Mid Atlantic Trust Co.
Pittsburgh, PA
|
22.72%
|
|
|
Pershing LLC
Jersey City, NJ
|
8.58%
|
|
Class C Shares
|
DBF
|
|
|
|
Wells Fargo Clearing Services LLC
Saint Louis, MO
|
28.78%
|
|
|
Charles Schwab & Co. Inc.
San Francisco, CA
|
17.10%
|
|
|
LPL Financial
San Diego, CA
|
15.74%
|
|
|
RBC Capital Markets Corp.
Minneapolis, MN
|
13.54%
|
|
|
Raymond James
St. Petersburg, FL
|
12.87%
|
|
Class C Shares
|
DGBF
|
|
|
|
Raymond James
St. Petersburg, FL
|
40.72%
|
|
|
Pershing LLC
Jersey City, NJ
|
39.52%
|
|
|
Charles Schwab & Co. Inc.
San Francisco, CA
|
17.12%
|
|
Class C Shares
|
DGMMF
|
|
|
|
Morgan Stanley Smith Barney LLC
New York, NY
|
34.33%
|
|
|
John F. Bushey
Ashburn, VA
|
15.31%
|
|
|
UBS WM USA
Weehawken, NJ
|
7.88%
|
|
|
Peter and Brenda Rizzotto
Sugar Land, TX
|
6.37%
|
|
|
Wells Fargo Clearing Services LLC
Saint Louis, MO
|
5.67%
|
|
Class Y Shares
|
DOF
|
|
|
|
Davis Selected Advisers, L.P.
Tucson, AZ
|
32.35%
|
|
|
Morgan Stanley Smith Barney LLC
New York, NY
|
14.40%
|
|
|
Charles Schwab & Co. Inc.
San Francisco, CA
|
7.94%
|
|
|
Merrill Lynch Pierce Fenner & Smith
Jacksonville, FL
|
6.89%
|
|
|
UBS WM USA
Weehawken, NJ
|
5.12%
|
|
|
Raymond James
St. Petersburg, FL
|
5.01%
|
|
Class Y Shares
|
DFF
|
|
|
|
Morgan Stanley Smith Barney
New York, NY
|
13.02%
|
|
|
Charles Schwab & Co. Inc.
San Francisco, CA
|
11.44%
|
Statement of Additional Information | Davis Funds | 25
|
Class of Shares
|
Name and Address of Shareholders
Owning More Than 5% of Fund
|
Percent of Class Outstanding
|
|
|
Davis Selected Advisers, L.P.
Tucson, AZ
|
11.30%
|
|
|
Merrill Lynch Pierce Fenner & Smith
Jacksonville, FL
|
10.89%
|
|
|
Pershing LLC
Jersey City, NJ
|
7.33%
|
|
|
American Enterprise Investment
Services Inc.
Minneapolis, MN
|
7.14%
|
|
|
LPL Financial
San Diego, CA
|
6.28%
|
|
|
Wells Fargo Clearing Services LLC
Saint Louis, MO
|
5.99%
|
|
Class Y Shares
|
DREF
|
|
|
|
Davis Selected Advisers, L.P.
Tucson, AZ
|
34.22%
|
|
|
NFS LLC
Jersey City, NJ
|
25.78%
|
|
|
Charles Schwab & Co. Inc.
San Francisco, CA
|
9.27%
|
|
|
American Enterprise Investment
Services Inc.
Minneapolis, MN
|
7.68%
|
|
Class Y Shares
|
DBF
|
|
|
|
Davis Selected Advisers, L.P.
Tucson, AZ
|
58.26%
|
|
|
Raymond James
St. Petersburg, FL
|
10.09%
|
|
|
RBC Capital Markets Corp.
Minneapolis, MN
|
6.39%
|
|
Class Y Shares
|
DGBF
|
|
|
|
NFS LLC
Jersey City, NJ
|
57.92%
|
|
|
Merrill Lynch Pierce Fenner & Smith
Jacksonville, FL
|
13.09%
|
|
|
Raymond James
St. Petersburg, FL
|
6.68%
|
|
Class Y Shares
|
DGMMF
|
|
|
|
NFS LLC
Jersey City, NJ
|
73.07%
|
|
|
State Street Bank & Trust Co.
Boston, MA
|
21.11%
|
|
|
Matrix Trust Co.
Denver, CO
|
5.35%
|
Investment Advisory Services
Davis Selected Advisers, L.P. and Davis Selected Advisers–NY, Inc. Davis Selected Advisers, L.P. (the “Adviser”), whose principal office is at 2949 East Elvira Road, Suite 101, Tucson, Arizona 85756, serves
as investment adviser for Davis New York Venture Fund, Inc., Davis Series, Inc., and Davis Variable Account Fund, Inc. (the “Davis Funds”); Davis Fundamental ETF Trust (the “Davis ETFs”); Selected American Shares, Inc. (the “Selected Fund”); and Clipper Funds Trust (the “Clipper Fund”). The Adviser also provides advisory or sub-advisory services to other parties including other registered investment companies, private accounts, offshore funds, and managed money/wrap accounts. Davis
Investments, LLC, an entity controlled by Christopher Davis, is the Adviser’s sole general partner. Christopher Davis is Chairman of the Adviser and, as the sole member of the general partner, controls the Adviser. Davis Distributors, LLC (the “Distributor”), a subsidiary of the
Statement of Additional Information | Davis Funds | 26
Adviser, serves as the distributor or principal underwriter of many of the funds that
the Adviser administers including Davis Funds, Selected Fund, Clipper Fund, and offshore funds. Davis Selected Advisers–NY, Inc. (the “Sub-Adviser”), a wholly owned subsidiary of the Adviser, performs investment management, research, and other
services for the Davis Funds on behalf of the Adviser under sub-advisory agreements with the Adviser. All fees paid to the
Sub-Adviser are paid by the Adviser.
Advisory Agreement with Davis Selected Advisers, L.P. and Sub-Advisory Agreement with Davis Selected Advisers–NY, Inc. Pursuant to an Advisory Agreement, each Fund pays the Adviser a fee according to the
following schedule:
Davis Opportunity Fund, Davis Financial Fund, Davis Real Estate Fund, and Davis Balanced
Fund pay the Adviser a fee at the annual rate of 0.55% of average net assets.
Davis Government Bond Fund and Davis Government Money Market Fund pay the Adviser a fee at the annual rate of 0.30% of average net assets.
These fees may be higher than those of some other mutual funds but are not necessarily
higher than those paid by funds with similar objectives. Advisory fees are allocated among each Class of shares in proportion to each Class’s relative total net assets.
Expense Cap. The Adviser is contractually committed to waive fees and/or reimburse the expenses
of Davis Financial Fund, Davis Opportunity Fund, Davis Balanced Fund, Davis Government Bond Fund, and Davis
Real Estate Fund to the extent necessary to cap total annual fund operating expenses (Class A shares, 1.00%; Class
C shares, 1.75%; Class Y shares, 0.75%) For purposes of these expense caps, operating expenses do not include foreign tax
reclaim filing expenses. The Adviser is obligated to continue the expense cap through May 1, 2027. The expense cap cannot
be terminated prior to this date without the consent of the Board of Directors. After that date, there is no assurance that
the Adviser will continue to cap expenses. The Adviser may not recoup any of the operating expenses it has reimbursed to the Fund.
The Adviser is contractually committed to waive fees and/or reimburse Davis Government Money Market Fund’s expenses such that net investment income will not be less than zero until May 1, 2027. After
that date, there is no assurance that the Adviser will continue to cap expenses. The Adviser may recapture from the assets of
the Fund any of the operating expenses it has reimbursed (but not any of the management fees which it has waived) until the
end of the third calendar year after the end of the calendar year in which such reimbursement occurs, subject to certain limitations.
This recapture could negatively affect the Fund’s future yield.
The Funds paid the following aggregate advisory fees to the Adviser during the last
three fiscal years:
|
Fiscal Year-Ended December 31,
|
2025
|
2024
|
2023
|
|
DOF
|
$3,140,148
|
$3,092,976
|
$2,707,063
|
|
DFF
|
$6,042,881
|
$5,039,069
|
$4,330,736
|
|
DREF
|
$773,826
|
$852,059
|
$894,400
|
|
DBF
|
$1,486,119
|
$1,356,231
|
$1,090,080
|
|
DGBF
|
$50,937
|
$52,255
|
$56,626
|
|
DGMMF
|
$309,400
|
$302,969
|
$328,265
|
In accordance with the provisions of the 1940 Act, the Advisory Agreement and Sub-Advisory
Agreement will terminate automatically on assignment and are subject to cancellation on 60 days’ written notice by the Board of Directors, the vote of the holders of a majority of the Funds' outstanding shares, or the Adviser. The continuance
of the Advisory Agreement and Sub-Advisory Agreement must be approved at least annually by the Funds' Board of Directors
or by the vote of holders of a majority of the outstanding shares of the Funds. In addition, any new agreement or
the continuation of the existing agreement, must be approved by a majority of Directors who are not parties to the agreements
or interested persons of any such party. The Advisory Agreement also makes provisions for portfolio transactions and brokerage
policies of the Funds, which are discussed above under “Portfolio Transactions.”
The Adviser has entered into a Sub-Advisory Agreement with its wholly owned subsidiary, Davis Selected Advisers–NY, Inc., where the Sub-Adviser performs research and other services on behalf of the Adviser.
Under the Agreement, the Adviser pays all of the Sub-Adviser’s direct and indirect costs of operation. All of the fees paid to the Sub-Adviser are paid by the Adviser and not the Funds.
Pursuant to the Advisory Agreement, the Adviser, subject to the general supervision
of the Funds' Board of Directors, provides management and investment advice and furnishes statistical, executive and
clerical personnel, bookkeeping, office space and equipment necessary to carry out its investment advisory functions, and
such corporate managerial duties as requested by the Board of Directors of the Funds. The Funds bear all expenses other
than those specifically assumed by the Adviser under the Advisory Agreement, including preparation of their tax returns,
financial reports to regulatory authorities, dividend determinations, transactions and accounting matters related to their custodian
bank, transfer agency, custodial and investor services, and qualification of their shares under federal and state securities
laws. The Funds reimburse the Adviser for providing certain services, including accounting and administrative services, and
investor services. Such reimbursements are detailed below:
Statement of Additional Information | Davis Funds | 27
|
Fiscal Year-Ended December 31,
|
2025
|
2024
|
2023
|
|
DOF
|
|
|
|
|
Accounting and administrative services:
|
$29,246
|
$28,750
|
$27,004
|
|
Investor services:
|
$38,965
|
$40,303
|
$35,245
|
|
DFF
|
|
|
|
|
Accounting and administrative services:
|
$50,000
|
$45,746
|
$47,500
|
|
Investor services:
|
$85,502
|
$91,355
|
$89,820
|
|
DREF
|
|
|
|
|
Accounting and administrative services:
|
$7,500
|
$8,748
|
$11,002
|
|
Investor services:
|
$20,772
|
$23,015
|
$21,916
|
|
DBF
|
|
|
|
|
Accounting and administrative services:
|
$13,496
|
$12,004
|
$10,496
|
|
Investor services:
|
$21,181
|
$21,779
|
$16,380
|
|
DGBF
|
|
|
|
|
Accounting and administrative services:
|
$2,000
|
$2,000
|
$2,000
|
|
Investor services:
|
$7,145
|
$7,269
|
$6,213
|
|
DGMMF
|
|
|
|
|
Accounting and administrative services:
|
$5,002
|
$5,250
|
$5,502
|
|
Investor services:
|
$15,521
|
$16,260
|
$14,157
|
Approval of the Advisory and Sub-Advisory Agreements. The Board of Directors is scheduled to meet four times a year. The Directors believe that matters bearing on the Advisory and Sub-Advisory Agreements
are considered at most, if not all, of their meetings. The Independent Directors are advised by independent legal counsel
selected by the Independent Directors. A discussion of the Directors’ considerations in the annual approval of Advisory and Sub-Advisory Agreements is contained in the Funds' most recent semi-annual Form N-CSR financial statements.
Unique Nature of Each Fund. The Adviser may serve as the investment adviser or sub-adviser to other funds that
have investment objectives and principal investment strategies similar to those of the
Funds. While the Funds may have many similarities to these other funds, the investment performance of each fund will be
different due to a number of differences between the funds including differences in sales charges, expense ratios, and cashflows.
Code of Ethics. The Adviser, Sub-Adviser, Distributor, and the Davis Funds have adopted a Code of
Ethics, meeting the requirements of Rule 17j-1 under the 1940 Act that regulate the personal securities transactions of the Adviser’s investment personnel, other employees, and affiliates with access to information regarding securities
transactions of the Davis Funds. Such employees may invest in securities including securities that may be purchased
or held by the Davis Funds. A copy of the Code of Ethics is on public file with and available from the SEC.
Continuing Regulation. The Adviser, like most other asset managers, is subject to ongoing inquiries from
the SEC and/or the Financial Industry Regulatory Authority (“FINRA”) regarding industry practices.
Proxy Voting Policies and Record. The Board of Directors has directed the Adviser to vote the Funds' portfolio securities
in conformance with the Adviser’s Proxy Voting Policies and Procedures. These policies and procedures are summarized in Appendix C. Information regarding how the Funds voted proxies relating to portfolio
securities during the most recent 12-month period ended June 30 is available, without charge, on the Funds' website, https://davisfunds.com/proxy-voting,
by calling Davis Funds' Investor Services at 1-800-279-0279, or on the SEC’s website (www.sec.gov).
Portfolio Managers
Davis Financial Fund. The Portfolio Managers of the Davis Financial Fund are Christopher Davis and Pierce
Crosbie. They are the persons primarily responsible for investing the Fund’s assets on a daily basis.
Davis Opportunity Fund. The listed Portfolio Managers of the Davis Opportunity Fund are Dwight Blazin, Christopher
Davis, Danton Goei, Darin Prozes, and Edward Yen. They are the persons primarily responsible for investing the Fund’s assets on a daily basis.
Davis Real Estate Fund. The Portfolio Managers of the Davis Real Estate Fund are Andrew Davis and Chandler
Spears. They are the persons primarily responsible for investing the Fund’s assets on a daily basis.
Davis Balanced Fund. The Portfolio Managers of the Davis Balanced Fund are Christopher Davis, Erik Jones,
and Darin Prozes. They are the persons primarily responsible for investing the Fund’s assets on a daily basis.
Davis Government Bond Fund & Davis Government Money Market Fund. The Portfolio Manager of the Davis Government Bond Fund and the Davis Government Money Market Fund is Erik Jones. He is the person
primarily responsible for investing the Funds’ assets on a daily basis.
Statement of Additional Information | Davis Funds | 28
Accounts Managed as of December 31, 2025
|
Portfolio
Managers
|
Number of
other RICs(1)
|
Assets(2) in
RICs
in millions
|
Number of
OPIV(3)
|
Assets in OPIV
in millions
|
Number of
OA(4)
|
Assets in OA
in millions
|
|
DFF
|
|
|
|
|
|
|
|
Christopher Davis
|
10
|
$12,933.2
|
2
|
$539.3
|
35
|
$10,858.7
|
|
Pierce Crosbie
|
3
|
$483.8
|
0
|
$0
|
3
|
$948.6
|
|
DOF
|
|
|
|
|
|
|
|
Christopher Davis
|
10
|
$13,546.7
|
2
|
$539.3
|
35
|
$10,858.7
|
|
Danton Goei
|
10
|
$13,485.3
|
4
|
$804.8
|
33
|
$10,424.7
|
|
Darin Prozes
|
2
|
$259.6
|
0
|
$0
|
20
|
$982.9
|
|
Dwight Blazin
|
1
|
$19.3
|
0
|
$0
|
19
|
$162.4
|
|
Edward Yen
|
1
|
$15.8
|
0
|
$0
|
4
|
$43.8
|
|
DREF
|
|
|
|
|
|
|
|
Andrew Davis
|
1
|
$7.0
|
1
|
$170.0
|
2
|
$30.5
|
|
Chandler Spears
|
1
|
$7.0
|
1
|
$170.0
|
2
|
$30.5
|
|
DBF
|
|
|
|
|
|
|
|
Christopher Davis
|
10
|
$13,851.1
|
2
|
$539.3
|
35
|
$10,858.7
|
|
Darin Prozes
|
2
|
$304.1
|
0
|
$0
|
20
|
$982.9
|
|
Erik Jones
|
2
|
$107.9
|
0
|
$0
|
1
|
$25.6
|
|
DGBF
|
|
|
|
|
|
|
|
Erik Jones
|
2
|
$135.3
|
0
|
$0
|
1
|
$25.6
|
|
DGMMF
|
|
|
|
|
|
|
|
Erik Jones
|
2
|
$61.6
|
0
|
$0
|
1
|
$25.6
|
(1)
“RIC” means Registered Investment Company.
(2)
“Assets” means total assets managed by the Portfolio Manager. Some or all of these assets may be co-managed with another Portfolio Manager who will also be credited with managing the same assets. The sum of assets managed by Davis Advisors’ Portfolio Managers may exceed the total assets managed by Davis Advisors.
(3)
“OPIV” means Other Pooled Investment Vehicles.
(4)
“OA” means Other Accounts. These accounts are primarily private accounts and sponsors of managed money/wrap accounts.
Ownership of Fund Shares as of December 31, 2025
|
Portfolio Managers
|
|
|
DFF
|
|
|
Christopher Davis
|
Over $1 million
|
|
Pierce Crosbie
|
$500,001–$1 million
|
|
DOF
|
|
|
Christopher Davis
|
Over $1 million
|
|
Danton Goei
|
Over $1 million
|
|
Darin Prozes
|
Over $1 million
|
|
Dwight Blazin
|
$500,001–$1 million
|
|
Edward Yen
|
$100,001–$500,000
|
|
DREF
|
|
|
Andrew Davis
|
Over $1 million
|
|
Chandler Spears
|
$100,001–$500,000
|
|
DBF
|
|
|
Christopher Davis
|
Over $1 million
|
|
Darin Prozes
|
Over $1 million
|
|
Erik Jones
|
None
|
|
DGBF
|
|
|
Erik Jones
|
None
|
|
DGMMF
|
|
|
Erik Jones
|
None
|
Ownership disclosure is made using the following ranges: None; $1–$10,000; $10,001–$50,000; $50,001–$100,000; $100,001–$500,000; $500,001–$1 million; Over $1 million.
Structure of Compensation
Christopher Davis’ and Andrew Davis’ compensation for services provided to the Adviser consists of a base salary. The
Adviser’s Portfolio Managers are provided benefits packages including life insurance, health insurance, and participation in the Adviser’s 401(k) plan comparable to that received by other company employees.
Dwight Blazin’s, Pierce Crosbie’s, Danton Goei’s, Darin Prozes’, Chandler Spears’, and Edward Yen’s compensation for services provided to the Adviser consists of: (1) a base salary; (2) an annual discretionary
bonus; (3) awards of equity
Statement of Additional Information | Davis Funds | 29
(“Units”) in Davis Selected Advisers, L.P., including Units and/or phantom Units; (4) an incentive plan whereby the Adviser purchases shares in certain mutual funds managed by the Adviser, which vest based
on the passage of time provided that the Portfolio Manager is still employed by the Adviser; and (5) an incentive plan whereby
the Adviser purchases shares in selected mutual funds managed by the Adviser. In the case of fund shares purchased as described
above in (5), at the end of specified periods, generally five-years following the date of purchase, some, all, or none of
the Fund shares will be registered in the employee’s name based on Fund performance, after expenses on a pre-tax basis, versus the Fund’s benchmark index, as described in the Fund’s prospectus or, in limited cases, based on performance ranking among established peer groups. The Adviser does not purchase incentive shares in every fund these Portfolio Managers
manage or assist on. In limited cases, such incentive compensation is tied on a memorandum basis to the performance of the portion of the Fund (“sleeve”) managed by the analyst versus the Fund’s benchmark. The Adviser’s Portfolio Managers are provided benefits packages including life insurance, health insurance, and participation in the Adviser’s 401(k) plan comparable to that received by other company employees.
Erik Jones’ compensation for services provided to the Adviser consists of: (1) a base salary;
(2) an annual bonus based principally upon long-term fund performance relative to similar funds; (3) awards of equity (“Units”) in Davis Advisors including Units, and/or phantom Units; and (4) an incentive plan whereby the Adviser
purchases shares in certain mutual funds managed by the Adviser, which vest based on the passage of time provided that
the Portfolio Manager is still employed by the Adviser; (5) an incentive plan whereby the Adviser purchases shares in selected
mutual funds managed by the Adviser. In the case of fund shares purchased as described above in (5), at the end of specified
periods, generally five-years following the date of purchase, some, all, or none of the Fund shares will be registered in the employee’s name based on Fund performance, after expenses on a pre-tax basis, versus the Fund’s benchmark index, as described in the Fund’s prospectus or, in limited cases, based on performance ranking among established peer groups. The
Adviser does not purchase incentive shares in every fund this Portfolio Manager manages or assists on. The Advisers’ Portfolio Managers are provided benefits packages including life insurance, health insurance, and participation in the Advisers’ 401(k) plan comparable to that received by other company employees.
Potential Conflicts of Interest
Potential conflicts of interest may arise in connection with the management of multiple
accounts, including potential conflicts of interest related to the knowledge and timing of Davis Funds' trades, investment
opportunities, broker selection, and Fund investments. Portfolio Managers and other investment professionals may be privy to
the size, timing, and possible market impact of the Funds' trades. It is theoretically possible that Portfolio Managers
could use this information to the advantage of other accounts they manage and to the possible detriment of the Funds. It is possible
that an investment opportunity may be suitable for both the Funds and other accounts managed by Portfolio Managers but may
not be available in sufficient quantities for both the Funds and other accounts to participate fully. Similarly, there may be
limited opportunity to sell an investment held by the Funds and another account. Management of multiple portfolios and/or other
accounts may result in a Portfolio Manager devoting unequal time and attention to the management of each portfolio and/or
other accounts. The Adviser seeks to manage such competing interests for the time and attention of Portfolio Managers. For example, many of Davis Advisors’ Portfolio Managers focus on a small set of model accounts with similar accounts being
managed by investing in the same securities and using the same investment weightings that are used in connection with
the management of the model accounts.
If a Portfolio Manager identifies a limited investment opportunity which may be suitable
for more than one portfolio or other account, a portfolio may not be able to take full advantage of that opportunity due
to an allocation of filled purchase or sale orders across all eligible portfolios and other accounts. Large clients may generate
more revenue for the Adviser than do smaller accounts. Accounts which pay higher management fees usually generate more
revenue than accounts of the same size paying lower management fees. A Portfolio Manager may be faced with a conflict of
interest when allocating limited investment opportunities given the benefit to the Adviser of favoring accounts that
pay a higher fee or generate more income for the Adviser. To deal with these situations, the Adviser has adopted procedures
for allocating limited investment opportunities across multiple accounts.
With respect to securities transactions for the portfolios, the Adviser determines
which broker to use to execute each order, consistent with its duty to seek best execution of the transaction. However, with
respect to certain other accounts (such as mutual funds, other pooled investment vehicles that are not registered mutual funds,
and other accounts managed for organizations and individuals), the Adviser may be limited by the client with respect
to the selection of brokers or may be instructed to direct trades through a particular broker. In these cases, the Adviser
may place separate, non-simultaneous, transactions for a portfolio and another account which may temporarily affect the
market price of the security or the execution of the transaction, or both, to the detriment of the portfolio or the other account.
Substantial investment of the Adviser or Davis Family assets in certain mutual funds
may lead to conflicts of interest. A portion of a Portfolio Manager’s compensation may include awards of equity in Davis Advisors. A Portfolio Manager may face a conflict of interest given that the Adviser is more heavily invested in some funds
than in other funds. A portion of the Portfolio Manager’s compensation may also include an incentive plan whereby the Adviser purchases shares in certain funds managed by Davis Advisors. A Portfolio Manager may face a conflict of interest given
that their long-term compensation may be more heavily determined by the performance of one fund or portion of a fund than
by another fund which he also manages. To mitigate these potential conflicts of interest, the Adviser has adopted policies
and procedures intended to ensure that all clients are treated fairly over time. Davis Advisors does not receive an incentive
based fee on any account.
Statement of Additional Information | Davis Funds | 30
Davis Advisors expects that, over long periods of time, most clients pursuing similar
investment strategies should experience similar, but not identical, investment performance. Many factors affect investment
performance including, but not limited to: (1) the timing of cash deposits and withdrawals to and from an account; (2) the
possibility that Davis Advisors may not purchase or sell a given security on behalf of all clients pursuing similar strategies;
(3) price and timing differences when buying or selling securities; and (4) clients pursuing similar investment strategies
but imposing different investment restrictions. Davis Advisors has adopted written trading policies designed to minimize
possible conflicts of interest in trading for its clients.
Conflicts of interest may also arise regarding proxy voting. Davis Advisors has adopted
written proxy voting policies designed to minimize possible conflicts of interest when voting proxies on behalf of its clients.
Certain Portfolio Managers may serve on the board(s) of public companies where they,
from time to time, may have access to material, non-public information (“MNPI”). Davis Advisors has instituted policies and procedures to ensure that these Portfolio Managers will not be able to utilize MNPI for their own benefit or for any
of the accounts they manage.
Disclosure of Portfolio Holdings
Portfolio Holdings Information Is Protected. Information about the Funds' portfolio holdings is proprietary information which the Adviser is committed to protecting. Davis Funds have adopted procedures
reasonably designed to ensure that portfolio holdings information is not released on a selective basis except to qualified
persons rendering services to the Funds which require that those persons receive information concerning the Funds' portfolio
holdings. Neither the Funds nor the Adviser receives compensation with respect to the disclosure of portfolio holdings.
Public Disclosure of Portfolio Holdings. Information about the Funds' portfolio holdings that has previously been made public may be freely disclosed. Information about portfolio holdings may become “public” by: (1) publication on the Davis Funds' website; (2) quarterly filings with the SEC on Form N-CSR or Form N-PORT Part
F; (3) monthly filings with the SEC on Form N-MFP for Davis Government Money Market Fund; or (4) other publication determined by the Adviser’s Chief Legal Officer or their designee, in writing, stating their rationale, to be public. The
publicly disclosed portfolio may exclude certain securities when allowed by applicable regulations and deemed to be in the best interest
of a Fund.
Davis Funds' Executive Vice President, or their designee, currently the Davis Funds'
Chief Compliance Officer, may authorize publication of portfolio holdings on a more frequent basis.
The Adviser manages other accounts such as separate accounts, private accounts, unregistered
products, and portfolios sponsored by companies other than the Adviser. These other accounts may be managed
in a similar fashion to certain Davis Funds and thus may have similar portfolio holdings. Such accounts may be subject to
different portfolio holdings disclosure policies that permit public disclosure of portfolio holdings information in different
forms and at different times than the Funds' portfolio holdings disclosure policies. Additionally, clients of such accounts
have access to their portfolio holdings and may not be subject to the Funds' portfolio holdings disclosure policies.
Statistical Information. The Funds' portfolio holdings procedures do not prevent the release of aggregate,
composite or descriptive information that, in the opinion of Davis Funds' Chief Compliance Officer
or their designee, does not present material risks of dilution, arbitrage, market timing, insider trading, or other inappropriate
trading that may be detrimental to the Funds. Information excluded from the definition of portfolio holdings information
generally includes, without limitation: (1) descriptions of allocations among asset classes, regions, countries
or industries/sectors; (2) aggregated data such as average or median ratios, market capitalization, credit quality, or duration;
(3) performance attributions by industry, sector, or country; or (4) aggregated risk statistics.
Release of Non-Public Portfolio Holdings Information. Davis Funds or the Adviser may disclose non-public information about the Funds' portfolio holdings to third-parties in a number of situations, including:
(1) disclosure of specific securities (not a material portion of the entire portfolio) to broker-dealers in connection with
the purchase or sale by the Fund of such securities; (2) requests for price quotations on specific securities (not a material
portion of the entire portfolio) from broker-dealers for the purpose of enabling the Fund’s service providers to calculate the Fund’s net asset value; (3) requests for bids on one or more securities; (4) disclosures in connection with litigation involving Fund
portfolio securities; (5) disclosure to regulatory authorities; (6) statements to the press by Portfolio Managers from time to time about the Fund’s portfolio and securities held by the Fund which may or may not have been previously disclosed; and
(7) attendance by employees of the Adviser at due diligence meetings with existing or potential investors in which specific
Fund holdings are discussed and other information which the employee reasonably believes cannot be used in a manner which
would be harmful to the Fund. In addition, the Adviser may provide a wide variety of information about the Fund (other
than portfolio holdings) to existing and potential investors and intermediaries working on behalf of such investors. Such information
may not be available from publicly available information and may consist of statistical and analytical information concerning the Fund’s portfolio as a whole and how it has performed, without naming specific portfolio securities held
by the Fund. Davis Funds' portfolio holdings procedures prohibit release of non-public information concerning the Fund’s portfolio holdings to individual investors, institutional investors, intermediaries which distribute the Fund’s shares, and other parties which are not employed by the Adviser or its affiliates. Information about the Fund’s portfolio holdings may be reviewed by third-parties for legitimate business purposes, but only if: (1) the Adviser’s Chief Operating Officer, or their designee, currently Davis Funds' Chief Compliance Officer, considers the application for review of the Fund’s portfolio holdings and, in their business judgment, the requesting third-party: (a) has a legitimate business purpose for reviewing the portfolio
holdings and (b) does not pose a
Statement of Additional Information | Davis Funds | 31
material risk to the Fund; and (2) the third-party enters into an acceptable confidentiality
agreement (including a duty not to trade). Davis Funds' Board of Directors is notified of the application for review of the Fund’s portfolio holdings by any such third-parties at the next scheduled quarterly meeting of the Board of Directors, at
which time the Board of Directors reviews the application by each such party and considers whether the release of the Fund’s portfolio holding information to the third-parties is in the best interests of the Fund and its shareholders.
Third-Parties Receiving Portfolio Holdings Information. As of January 31, 2026, each of the following third-party service providers have been approved to receive non-public information concerning Davis Funds'
portfolio holdings: (1) KPMG LLP (serves as the Funds' independent registered public accounting firm); (2) Linedata
(trading software); (3) Global Trading Analytics (provides analytical reports); (4) Clearwater Analytics (provides investment
performance attribution reports); (5) State Street Bank and Trust Company (serves as the Funds' custodian bank and securities
lending agent); (6) Greenberg Traurig, LLP (counsel for Davis Funds); (7) K&L Gates LLP (counsel for the Adviser);
(8) Donnelley Financial Solutions (Software Development); (9) Diligent Corporation (Software Development); (10) Broadridge
Financial Solutions (provides analytical reports to the Directors); (11) Deloitte & Touche, R&A CPAs, and Johnson Lambert LLP (serve as the Adviser’s auditors); (12) MSCI/ISS Inc.; (13) Gresham Technologies (US) Inc. (share reconciliation);
(14) Compliance Science, Inc.; (15) Pointpath Studios; (16) the Investment Company Institute; and (17) John Pitt
(provides editing services).
Administration. Davis Funds' Chief Compliance Officer oversees the release of portfolio holdings
information including authorizing the release of portfolio holdings information.
Distribution of Fund Shares
The Distributor. Davis Distributors, LLC (the “Distributor”), 2949 East Elvira Road, Suite 101, Tucson, Arizona 85756, is a wholly owned subsidiary of the Adviser and, pursuant to a Distributing Agreement,
acts as principal underwriter of the Funds' shares on a continuing basis. By the terms of the Distributing Agreement, the Distributor
(or an affiliate) pays for all expenses in connection with the preparation, printing, and distribution of advertising and
sales literature for use in offering the Funds' shares to the public, including reports to shareholders to the extent they are used
as sales literature. The Distributor (or an affiliate) also pays for the preparation and printing of prospectuses other than those
forwarded to existing shareholders. The continuance and assignment provisions of the Distributing Agreement are the same as
those of the Advisory Agreement.
The Distributor has agreements with securities dealers and other financial institutions
for distributing shares of the Funds and/or providing services to shareholders. The Distributor may pay such firms service fees
for accounts for which representatives of the dealers are responsible and provide services.
The sources for these payments include the distribution fees paid by Class A and Class
C shares and the Distributor or Adviser may also use their own resources.
The Distributor received the following amounts in total sales charges (which the Funds
do not pay) on the sale of Class A shares:
|
Fiscal Year-Ended December 31,
|
2025
|
2024
|
2023
|
|
DOF
|
|
|
|
|
Total sales charges:
|
$41,825
|
$46,026
|
$18,585
|
|
Amount re-allowed to dealers:
|
$35,604
|
$39,788
|
$15,588
|
|
DFF
|
|
|
|
|
Total sales charges:
|
$224,989
|
$106,256
|
$127,144
|
|
Amount re-allowed to dealers:
|
$190,659
|
$89,239
|
$107,373
|
|
DREF
|
|
|
|
|
Total sales charges:
|
$2,254
|
$9,123
|
$5,519
|
|
Amount re-allowed to dealers:
|
$1,893
|
$7,661
|
$4,646
|
|
DBF
|
|
|
|
|
Total sales charges:
|
$52,194
|
$27,412
|
$18,039
|
|
Amount re-allowed to dealers:
|
$44,289
|
$23,249
|
$15,324
|
|
DGBF
|
|
|
|
|
Total sales charges:
|
$27,235
|
$5,129
|
$1,005
|
|
Amount re-allowed to dealers:
|
$22,679
|
$4,475
|
$836
|
The Distributor received compensation on redemptions and repurchases of shares in
the following amounts:
|
Fiscal Year-Ended December 31, 2025
|
Class A
|
Class C
|
|
DOF
|
$-
|
$96
|
|
DFF
|
$-
|
$2,104
|
|
DREF
|
$-
|
$-
|
|
DBF
|
$-
|
$124
|
|
DGBF
|
$-
|
$-
|
|
DGMMF
|
N/A
|
N/A
|
The Distributor received the following amounts as reimbursements under the Funds'
Distribution plans:
Statement of Additional Information | Davis Funds | 32
|
Fiscal Year-Ended December 31,
|
2025
|
2024
|
2023
|
|
DOF
|
|
|
|
|
Class A Shares
|
$672,014
|
$679,274
|
$600,955
|
|
Class C Shares
|
$72,794
|
$104,924
|
$120,027
|
|
DFF
|
|
|
|
|
Class A Shares
|
$1,280,860
|
$1,049,756
|
$878,178
|
|
Class C Shares
|
$351,979
|
$439,216
|
$520,669
|
|
DREF
|
|
|
|
|
Class A Shares
|
$142,362
|
$163,006
|
$173,561
|
|
Class C Shares
|
$6,414
|
$11,214
|
$19,005
|
|
DBF
|
|
|
|
|
Class A Shares
|
$322,294
|
$301,430
|
$256,668
|
|
Class C Shares
|
$27,217
|
$25,017
|
$22,937
|
|
DGBF
|
|
|
|
|
Class A Shares
|
$33,287
|
$34,024
|
$37,074
|
|
Class C Shares
|
$3,292
|
$4,432
|
$4,847
|
Class Y shares do not have a Distribution Plan.
Distribution Plans. Class A and Class C shares use distribution plans to pay asset-based sales charges
or distribution and/or services fees in connection with the distribution of shares, including payments to
financial intermediaries for providing distribution assistance. Financial intermediaries that receive these fees may pay
some or all of them to their investment professionals. Because these fees are paid out of a Class’s assets on an on-going basis, over time these fees will increase the cost of an investment and may cost more than other types of sales and marketing charges.
The Distribution Plans were approved by the Board of Directors of Davis Funds in accordance
with Rule 12b-1 under the 1940 Act. Rule 12b-1 regulates the manner in which a mutual fund may assume costs of distributing
and promoting the sale of its shares. Payments pursuant to a Distribution Plan are included in the operating expenses
of the Class of shares.
How Share Classes Affect Payments to Brokers. A financial advisor may receive different compensation for selling one class of shares than for selling another class. It is important to remember that Class C
contingent deferred sales charges and/or asset-based sales charges have the same purpose as the front-end sales charge on sales
of Class A shares: to compensate the Distributor for concessions and expenses it (or an affiliate) pays to dealers and
financial institutions for selling shares.
Recordkeeping Fees. Certain dealers (and other financial intermediaries) have chosen to maintain omnibus
accounts with the Funds. In an omnibus account, a fund maintains a single account in the name of the
dealer and the dealer maintains all of the individual shareholder accounts. Likewise, for many retirement plans, a third-party
administrator may open an omnibus account with the Funds and the administrator will then maintain all of the participant
accounts. The Adviser, on behalf of the Funds, enters into agreements whereby the Funds and sometimes the Adviser in addition,
compensate the dealer or administrator for recordkeeping services. This compensation is not treated as a distribution
expense.
Class A Shares. Payments under the Class A Distribution Plan may be up to an annual rate of 0.25%
of the average daily net asset value of the Class A shares. Such payments are made to reimburse the Distributor
for the fees it (or an affiliate) pays to its salespersons and other firms for selling Class A shares, servicing its shareholders,
and maintaining its shareholder accounts. Normally, servicing fees are paid at an annual rate of 0.25% of the average
net asset value of the accounts serviced and maintained on the books of the Funds. In addition, when the Distributor (or an
affiliate) pays a commission to a broker-dealer for qualifying purchases of Class A shares at net asset value, the Fund may reimburse
the Distributor for this commission. The Fund will not reimburse this commission if the result would be that
Class A shares would pay Distribution Plan fees in excess of 0.25% of average net assets. Payments under the Class A Distribution
Plan also may be used to reimburse the Distributor for other distribution costs (excluding overhead) not covered
in any year by any portion of the sales charges the Distributor retains.
Class C Shares. Payments under the Class C Distribution Plan are limited to an annual rate equal
to the lesser of 1.25% of the average daily net asset value of the Class C shares or the maximum amount provided
by applicable rule or regulation of the Financial Industry Regulatory Authority, which currently is 1%. Therefore, the effective
rate of the Class C Distribution Plan at present is 1%. In accordance with current applicable rules, such payments also
are limited to 6.25% of gross sales of Class C shares plus interest at 1% over the prime rate on any unpaid amounts. The
Distributor (or an affiliate) pays broker/dealers up to 1% in commissions on new sales of Class C shares. The Fund pays the distribution
fee on Class C shares in order: (1) to pay the Distributor commissions on Class C shares which have been sold
and (2) to enable the Distributor (or an affiliate) to pay services fees on Class C shares which have been sold. From these
distribution payments, the Distributor currently uses up to 0.25% of average net assets for the payment of service and maintenance
fees to its salespersons and other firms for shareholder servicing and maintenance of its shareholder accounts.
Davis Government Money Market Fund. The Distribution Plan for each class of shares does not provide for any amounts to
be paid by the Fund directly to the Distributor as either compensation or reimbursement
for distributing shares of the Fund but does authorize the use of the advisory fee for distribution to the extent such fee
may be considered to be indirectly financing any activity or expense that primarily is intended to result in the sale of Fund shares.
Statement of Additional Information | Davis Funds | 33
Additional Information Concerning the Distribution Plans. In addition, to the extent that any investment advisory fees paid by the Funds may be deemed to be indirectly financing any activity that primarily
is intended to result in the sale of Fund shares within the meaning of Rule 12b-1, the Distribution Plans authorize the payment
of such fees.
The Distribution Plans continue annually so long as they are approved in the manner
provided by Rule 12b-1 or unless earlier terminated by vote of the majority of the Independent Directors or a majority of the
Funds' outstanding Class of shares. The Distributor is required to furnish quarterly written reports to the Board of Directors
detailing the amounts expended under the Distribution Plans. The Distribution Plans may be amended, provided that all such
amendments comply with the applicable requirements then in effect under Rule 12b-1. Currently, Rule 12b-1 provides that
as long as the Distribution Plans are in effect, the Funds must commit the selection and nomination of candidates for new Independent
Directors to the sole discretion of the existing Independent Directors.
Dealer Compensation. Dealers or others may receive different levels of compensation depending on which
class of shares they sell. The Distributor may make expense reimbursements for special training of a dealer’s registered representatives or personnel of dealers and other firms who provide sales or other services with respect
to a Fund and/or its shareholders, or to defray the expenses of meetings, advertising or equipment. Any such amounts may be
paid by the Distributor from the fees it receives under the Class A and Class C Distribution Plans.
In addition, the Distributor (or an affiliate) may, from time to time, pay additional
cash compensation or other promotional incentives to authorized dealers or agents who sell shares of a Fund. In some instances,
such cash compensation or other incentives may be offered only to certain dealers or agents who employ registered
representatives who have sold or may sell significant amounts of shares of the Funds during a specified period of time. These
payments are more fully described in the prospectus.
Fund Supermarkets. The Funds participate in various “Fund Supermarkets” in which a supermarket sponsor (usually a registered broker-dealer) offers many mutual funds to the supermarket sponsor’s clients. The Funds pay the supermarket sponsor a negotiated fee for distributing the shares and for continuing services provided
to their shareholders. A portion of the supermarket sponsor’s fee (that portion related to sales, marketing or distribution of shares) is paid with fees authorized under the Distribution Plans.
A portion of the supermarket sponsor’s fee (that portion related to investor services such as new account setup, shareholder accounting, shareholder inquiries, transaction processing, and shareholder confirmations
and reporting) is paid as a shareholder servicing fee of the Funds. The Funds typically would be paying these
shareholder servicing fees directly, were it not that the supermarket sponsor holds all customer accounts in a single omnibus account
with the Funds. If the supermarket sponsor’s fees exceed the sum available from the Distribution Plans and shareholder servicing fees, then the Adviser pays the remainder out of its profits.
Financial Statements
The audited financial statements and the report of the Funds' independent registered
public accounting firm, included in the Funds' Annual Financial Statements and Other Information, are incorporated by reference
into this SAI.
Other Important Service Providers
Custodian. State Street Bank and Trust Company (“State Street” or the “Custodian”), One Congress Street, Suite 1, Boston, MA 02114-2016, serves as custodian of the Funds' assets. The Custodian maintains all of the instruments
representing the Funds' investments and all cash. The Custodian delivers securities against payment
on sale and pays for securities against delivery on purchase. The Custodian also remits the Funds' assets in payment of their
expenses, pursuant to instructions of officers or resolutions of the Board of Directors. The Custodian also provides certain
fund accounting services to the Funds.
Transfer Agent. SS&C Global Investor & Distribution Solutions, Inc. (“SS&C GIDS”), P.O. Box 219197, Kansas City, MO 64121-9197, serves as the Funds' transfer agent.
Independent Registered Public Accounting Firm. KPMG LLP (“KPMG”), 191 W Nationwide Blvd, Suite 500, Columbus, OH 43215, serves as the Funds' independent registered public accounting firm. KPMG
audits the Funds' financial statements and financial highlights, performs other related audit services, and meets with the
Audit Committee of the Board of Directors. KPMG also acts as the independent registered public accounting firm to certain other
funds advised by the Adviser. In addition, KPMG prepares the Funds' federal and state income tax returns and related
forms. Audit and non-audit services provided by KPMG to the Funds must be pre-approved by the Audit Committee.
Counsel. Greenberg Traurig, LLP, 1144 15th Street, Suite 3300, Denver, CO 80202, serves as
counsel to the Davis Funds and also serves as counsel for the Independent Directors.
Statement of Additional Information | Davis Funds | 34
Section III:
Classes of Shares, Purchases, Exchanges, and Redemptions
Classes of Shares, Purchases, Exchanges, and Redemptions
This SAI should be read in conjunction with the Funds' prospectus. This SAI supplements
the information available in the Funds' prospectus.
Selecting the Appropriate Class of Shares
Each of the Davis Funds (other than Davis Research Fund, which only offers Class A
shares, and Davis Variable Account Fund, which does not have any share classes) offers Class A, Class C, and Class Y shares.
Davis New York Venture Fund offers Class R shares. Depending on the amount of the purchase and the anticipated length
of time of the investment, investors may choose to purchase one Class of shares rather than another. Investors who would rather
pay the entire cost of distribution, or sales charge, at the time of investment rather than spreading such cost over time,
might consider Class A shares. Other investors might consider Class C shares, in which case 100% of the purchase price
is invested immediately. If you have significant Davis Funds holdings, you may not be eligible to invest in Class C shares. See “How to Choose a Share Class,” in the prospectus for details.
Class A Shares
With certain exceptions described below, Class A shares are sold with a front-end
sales charge at the time of purchase and are not subject to a sales charge when they are redeemed.
Class C Shares
Class C shares are purchased at their net asset value per share without the imposition
of a front-end sales charge but are subject to a 1% deferred sales charge if redeemed within one year after purchase. Class C
shares will automatically convert to Class A shares eight years after the end of the calendar month in which the shareholder’s order to purchase was accepted.
Class Y Shares
Class Y shares are sold at net asset value without the imposition of Rule 12b-1 charges.
Class Y shares are only available through certain institutions which have entered into agreements with Davis Distributors
LLC.
Shares Issued by Davis Government Money Market Fund
The three classes of Davis Government Money Market Fund shares are available so as
to enable investors to facilitate exchanges since, with the exception of exchanges from Class A shares to Class Y shares,
shares may be exchanged only for shares of the same class. Davis Government Money Market Fund shares are sold directly
without sales charges. However, front-end or deferred sales charges may be imposed in certain cases on their exchange
into shares of other Davis Funds (see “Exchange of Shares”). Shares of the Davis Government Money Market Fund are offered at net asset value. However, in the case of certain exchanges, the Davis Government Money Market Fund shares received
may be subject to an escrow, pursuant to a Statement of Intention or a contingent deferred sales load. See “Exchange of Shares.”
Reduction of Class A Sales Charge. There are a number of ways to reduce the sales charge imposed on the purchase of the
Davis Funds’ Class A shares, as described below. In addition to the methods described below that may be used to reduce the sales charge certain financial intermediaries may adopt their own schedule. Descriptions
of the sales load waivers and/or discounts for Class A shares with respect to certain financial intermediaries are reproduced in “Appendix A-Intermediary- Specific Sales Charge Waivers and Discounts” to the statutory prospectus based on information provided by the financial intermediary.
These reductions are based on the fact that there is less sales effort and expense
involved with respect to purchases by affiliated persons and purchases made in large quantities. The examples listed below
are descriptive of the types of fact patterns which qualify for a reduction of sales charge. It is not possible to list
every potential qualifying transaction. The Distributor uses its discretion to determine whether or not any specific transaction
is similar enough to the examples listed below to qualify for a reduction of sales charge. If you claim any reduction of sales
charges, you or your dealer must notify the Distributor (or Davis Funds, if the investment is mailed to Davis Funds) when the
purchase is made. Enough information must be given to verify that you are entitled to such reduction.
◼
Immediate Family or Group Purchases. Certain purchases made by or for more than one person may be considered to constitute a single purchase, including: (1) purchases for immediate family members, (“immediate family members” consist of spouses and children under 21); (2) purchases by trust or other fiduciary
accounts and purchases by Individual Retirement Accounts for employees of a single employer; and (3) purchases made by
an organized group of persons, whether incorporated or not, if the group has a purpose other than buying shares of
mutual funds. For further information on group purchase reductions, contact the Adviser or your dealer.
◼
Other Groups. Certain purchases made by or for more than one person may be considered to constitute
a single purchase, including: (1) purchases by trust or other fiduciary accounts and purchases by Individual
Retirement Accounts for employees of a single employer; and (2) purchases made by an organized group of persons,
whether incorporated or not, if the group has a purpose other than buying shares of mutual funds. For further information
on group purchase reductions, contact the Adviser or your dealer.
Statement of Additional Information | Davis Funds | 35
◼
Statement of Intention. Another way to reduce the sales charge is by signing a Statement of Intention (“Statement”). See “Appendix B: Terms and Conditions of a Statement of Intention.” If you enter into a Statement you (or any “single purchaser”) may combine all purchases of all share classes of the Davis Funds, excluding Davis Government Money Market Fund, over a 13-month period. The amount you say you intend to invest may include
shares that you already own, valued at public offering price, the day prior to the period covered by the Statement.
A Statement may be backdated up to 90 days to include purchases made during that period, but the total period covered
by the Statement may not exceed 13 months and purchases made prior to the start of the 13-month period will not be readjusted
to reflect a lower sales charge.
Shares having a value of up to 5% of the amount you state you intend to invest will be held “in escrow” to make sure that any additional sales charges are paid. If any of the Fund’s shares are in escrow pursuant to a Statement and such shares are exchanged for shares of another Davis Fund, the escrow will continue with respect
to the acquired shares.
No additional sales charge will be payable if you invest the amount you have indicated.
Each purchase under a Statement will be made as if you were buying the total amount indicated at one time. For example,
if you indicate that you intend to invest $100,000, you will pay a sales charge of 3 1∕2% on each purchase.
If during the 13-month period you invest less than the amount you have indicated,
you will pay an additional sales charge. For example, if you state that you intend to invest $250,000 and actually invest only
$100,000, you will, by retroactive adjustment, pay a sales charge of 3 1∕2%. The sales charge you actually pay will be the same as if you had purchased the
shares in a single purchase.
A Statement does not bind you to buy, nor does it bind the Adviser or Distributor
to sell, the shares covered by the Statement.
◼
Rights of Accumulation (All Davis Funds Combined). Another way to reduce the sales charge is under a right of accumulation. This means that the larger purchase entitled to a lower sales charge
does not have to be in dollars invested at one time or in a single Davis Fund. The larger purchases that you (or any “single purchaser”) make at any one time can be determined by adding to the amount of a current purchase to the value of any Davis
Fund shares (at offering price) already owned by you. Davis Government Money Market Fund shares are not counted in determining
the total amount of Davis Funds shares you own.
For example, if you own $100,000 worth (at offering price) of shares, including Class
A, Class C, Class R, and Class Y shares of all Davis Funds except Davis Government Money Market Fund shares and invest
$5,000 in additional shares, the sales charge on that $5,000 investment would be 3 1∕2%, not 4 3∕4%.
Lastly, the right of accumulation also applies to the Class A, Class C, Class R, and
Class Y shares of the other Davis Funds that you own. Thus, the amount of current purchases of the Fund’s Class A shares that you make may be added to the value of the Class A, Class C, Class R, and Class Y shares of the other Davis Funds (valued
at their current offering price, excluding Davis Government Money Market Fund shares) already owned by you in determining
the applicable sales charge.
In all of the above instances where you wish to assert this right of combining the
shares you own of the other Davis Funds, you or your dealer must notify the Distributor (or Davis Funds, if the investment
is mailed to Davis Funds) of the pertinent facts. Enough information must be given to permit verification as to whether you are
entitled to a reduction in sales charges.
◼
Combining Statement of Intention(s) and/or Rights of Accumulation. A Statement of Intention for the Fund and shares of the other Davis Funds may be aggregated. Also, the Fund’s Class A shares and all share classes of the other Davis Funds that you already own, excluding Davis Government Money Market Fund, valued at the
current offering price the day prior to the period covered by your Statement of Intention, may be included in the amount
you have stated you intend to invest pursuant to your Statement.
◼
Purchases for Employee Benefit Plans. Trustees or other fiduciary accounts and Individual Retirement Accounts (“IRA”) of a single employer are treated as purchases of a single person. Purchases of and
ownership by an individual and such individual’s spouse under an IRA are combined with their other purchases and ownership.
Class A Share Sales at Net Asset Value. There are situations where the sales charge will not apply to the purchase of Class
A shares. A sales charge is not imposed on these transactions either because the purchaser
deals directly with the Fund (as in employee purchases), or because a responsible party (such as a financial institution)
is providing the necessary services usually provided by a registered representative. Although the investor pays no front-end
sales charge, a contingent deferred sales charge of 0.50% may be imposed if the Distributor paid a sales commission to
a broker or agent and the shares purchased at net asset value without a sales load are redeemed within the first year after purchase.
In addition, if investors effect purchases in Fund shares through a broker or agent, the broker or agent may charge
a fee. The situations where the sales charge will not apply are described in the prospectus.
A Fund also may issue Class A shares at net asset value incident to a merger with
or acquisition of assets of an investment company. The Fund occasionally may be provided with an opportunity to purchase substantially
all the assets of a public or private investment company or to merge another such company into the Fund. This offers
the Fund the opportunity to obtain
Statement of Additional Information | Davis Funds | 36
significant assets. No dealer concession is involved. It is industry practice to effect
such transactions at net asset value as it would adversely affect the Fund’s ability to do such transactions if the Fund had to impose a sales charge.
Class C Shares. Class C shares are offered at net asset value without a sales charge at the time of
purchase. Class C shares redeemed within one year of purchase will be subject to a 1% charge on redemption.
Class C shares that have been outstanding for eight years, including reinvested dividends and capital gain distributions, will
automatically convert to Class A shares without imposition of a front-end sales charge. The Class C shares so converted will
no longer be subject to the higher expenses borne by Class C shares. Because the net asset value per share of the Class
A shares may be higher or lower than that of the Class C shares at the time of conversion, although the dollar value will be
the same, a shareholder may receive more or fewer Class A shares than the number of Class C shares converted. Under a private
Internal Revenue Service Ruling, such a conversion will not constitute a taxable event under the federal income tax law. In
the event that this ceases to be the case, the Board of Directors will consider what action, if any, is appropriate and in the best
interests of the Class C shareholders. The Davis Funds will not accept any purchases of Class C shares when Class A shares may
be purchased at net asset value.
The Distributor will pay a commission to the firm responsible for the sale of Class
C shares. No other fees will be paid by the Distributor during the one-year period following purchase. The Distributor will be
reimbursed for the commission paid from 12b-1 fees paid by the Fund during the one-year period. If Class C shares are redeemed
within one year of purchase, the 1% redemption charge will be paid to the Distributor. After Class C shares have been
outstanding for more than one year, the Distributor will make quarterly payments to the firm responsible for the sale of the
shares in amounts equal to 0.75% of the annual average daily net asset value of such shares for sales fees and 0.25% of the
annual average daily net asset value of such shares for service and maintenance fees.
The Distributor will pay a commission to the firm responsible for the sale of Class
C shares. No other fees will be paid by the Distributor during the one-year period following purchase. The Distributor will be
reimbursed for the commission paid from 12b-1 fees paid by the Funds during the one-year period. If Class C shares are redeemed
within one year of purchase, the 1% redemption charge will be paid to the Distributor. After Class C shares have been
outstanding for more than one year, the Distributor will make quarterly payments to the firm responsible for the sale of the
shares in amounts equal to 0.75% of the annual average daily net asset value of such shares for sales fees and 0.25% of the
annual average daily net asset value of such shares for service and maintenance fees.
Contingent Deferred Sales Charges. Any contingent deferred sales charge (“CDSC”) imposed on the redemption of Class A or Class C shares is a percentage of the lesser of: (1) the net asset value of the
shares redeemed; or (2) the original cost of such shares. No CDSC is imposed when you redeem amounts derived from: (1) increases in
the value of shares redeemed above the net cost of such shares; or (2) certain shares with respect to which the Fund did
not pay a commission on issuance, including shares acquired through reinvestment of dividend income and capital gains distributions.
On request for a redemption, shares not subject to the CDSC will be redeemed first. Thereafter, shares held the longest
will be redeemed.
The CDSC on Class A and Class C shares that are subject to a CDSC will be waived if
the redemption relates to the following: (1) in the event of the total disability of the last surviving shareholder
(as evidenced by a determination by the federal Social Security Administration) occurring after the purchase of the shares
being redeemed; (2) in the event of the death of the last surviving shareholder; (3) for redemptions made pursuant to an automatic
withdrawal plan, if: (a) there are at least four withdrawals a year (except for retirement accounts subject to a required minimum
distribution, in which case it may run once a year); and (b) the aggregate value of the redeemed shares does not exceed 12% of the account’s value on an annual basis**; (4) for redemptions from a qualified retirement plan or IRA that constitute
a tax-free return of excess contributions to avoid tax penalty; (5) on redemptions of shares sold to directors, officers and employees
of any fund for which the Adviser acts as investment adviser, or officers and employees of the Adviser, Sub-Adviser or Distributor,
including former directors and officers and extended family members of all of the foregoing and any employee benefit
or payroll deduction plan established by or for such persons; and (6) on redemptions pursuant to the right of the Funds to liquidate a shareholder’s account if the aggregate net asset value of the shares held in such account falls below an established
minimum amount.
**
An Automatic Withdrawal Plan may be established as either a percentage or a fixed
dollar amount. The shares that may be redeemed without a sales charge are recalculated as a percentage of the current value of the account as of
the date of each withdrawal. If established as a percentage, no sales charge will be incurred regardless of market fluctuations. If established as a fixed
dollar amount, a sales charge may be incurred if the value of the account decreases. If you redeem shares in addition to those redeemed pursuant to
the Automatic Withdrawal Plan, a deferred sales charge may be imposed on those shares and on any subsequent redemptions within a 12-month period,
regardless of whether such redemptions are pursuant to an Automatic Withdrawal Plan.
Subject to various limitations, shares in different Davis Funds may be exchanged at
relative net asset value. If a sales charge is due on Class A shares and has not been previously paid, then the sales charge will
be deducted at the time of the exchange. If any Class of Davis Fund shares being exchanged are subject to a sales charge, Statement
of Intention, or other limitation, the limitation will continue to apply to the shares received in the exchange. When an
investor exchanges any Class of shares in a Davis Fund for shares in Davis Government Money Market Fund, the holding period for
any deferred sales charge does not continue during the time that the investor owns Davis Government Money Market Fund
shares. For example, Class C shares are subject to a contingent deferred sales charge for one year. Any period that an
investor owns shares of Davis Government Money Market Fund will be added to the one-year period.
Class Y Shares. Class Y shares are sold at net asset value without the imposition of Rule 12b-1 charges.
Class Y shares are offered to: (1) trust companies, bank trusts, endowments, pension plans, or foundations (“Institutions”) acting on behalf of
Statement of Additional Information | Davis Funds | 37
their own account or one or more clients for which such Institution acts in a fiduciary
capacity and investing at least $5,000,000 at any one time; (2) any state, county, city, department, authority or
similar agency that invests at least $5,000,000 (“Government Entities”); (3) any investor with an account established under a “wrap account” or other similar fee-based program sponsored and maintained by a registered broker-dealer approved by the Davis Funds’ Distributor (“Wrap Program Investors”); (4) a 401(k) plan, 457 plan, employer sponsored 403(b) plan, profit sharing and money purchase pension plan, defined benefit plan, or non-qualified deferred compensation plan where plan level
or omnibus accounts are held on the books of the Fund if at least $500,000 is invested; (5) the Adviser and its affiliates;
and (6) through a registered investment adviser (RIA) who initially invests for clients an aggregate of at least $100,000 in Davis Funds through a fund “supermarket” or other mutual fund trading platform sponsored by a broker-dealer or trust company and which
has entered into an agreement with Davis Distributors, LLC.
Wrap Program Investors may purchase Class Y shares through the sponsors of such programs
who have entered into agreements with Davis Distributors, LLC. Wrap Program Investors should be aware that
both Class A and Class Y shares are made available by the Davis Funds at net asset value to sponsors of wrap programs.
However, Class A shares are subject to additional expenses under the Fund’s Rule 12b-1 Plan and sponsors of wrap programs utilizing Class A shares generally are entitled to payments under the Plan. If the sponsor has selected Class A shares, investors
should discuss these charges with their program’s sponsor and weigh the benefits of any services to be provided by the sponsor against the higher expenses paid by Class A shareholders.
Conversion between Class A Shares or Class C Shares and Class Y Shares
For shareholders who currently hold Class A or Class C shares but are authorized under
certain circumstances to purchase Class Y shares, those shareholders may convert their eligible existing shares to Class
Y shares of the Fund provided that the Class Y shares received in the conversion are held in a fee-based account and their
dealer has entered into an agreement with the Distributor. Shares that are subject to a CDSC are not eligible to convert to
Class Y shares until the applicable CDSC period has expired. Shareholders who are no longer eligible for Class Y shares may
be converted to Class A shares without a sales charge. Under current interpretations of applicable federal income tax law by the Internal Revenue Service (the “IRS”), these conversions to or from Class Y shares are not treated as taxable events. If
those laws or the IRS interpretation of those laws should change, these conversion features may be suspended.
Investment Minimums. The Distributor may waive the investment minimums for any and all Classes of shares
at its discretion. The Distributor may determine that it is appropriate to waive the investment minimum
for participants in certain fee based programs sponsored by financial intermediaries. The Distributor may determine that
it is appropriate to treat related investors as a single investment account. Examples may include trust funds of the same bank,
separate accounts of the same insurance company, clients whose funds are managed by a single bank, insurance company, investment
adviser, broker-dealer, or clients of a financial intermediary that maintains an omnibus account with the Fund.
How to Purchase Shares
Davis Funds and the Distributor reserve the right to reject any purchase order for
any reason. The Funds' prospectus provides full directions on how to purchase shares.
Broker-Dealers May Remit Payment. Your broker-dealer may order and remit payment for the shares on your behalf. The
broker-dealer can also order the shares from the Distributor by telephone or wire.
Please note that the following rules and provisions apply with respect to purchases of Fund shares through a broker-dealer:
◼
The Distributor has entered into agreements with broker-dealers to receive on its
behalf purchase and redemptions orders;
◼
Such broker-dealers are authorized to designate other intermediaries to receive purchase
and redemption orders on behalf of the Distributor;
◼
The Funds will be deemed to have received a purchase or redemption order when an authorized
broker or, if applicable, its broker’s authorized designee receives the order; and
◼
A Client order will be priced at the Fund’s net asset value next computed after they are received by an authorized broker-dealer or the broker-dealer’s authorized designee.
Special Services
The Funds' prospectus describes a number of special services offered by the Davis
Funds. This SAI supplements that discussion.
Prototype Retirement Plans. The Distributor and certain qualified dealers have available prototype retirement
plans (e.g., profit sharing, money purchase, Simplified Employee Pension (“SEP”) plans, and model 403(b) and 457 plans for charitable, educational and governmental entities) sponsored by the Davis Funds for corporations
and self-employed individuals. The Distributor and certain qualified dealers also have prototype Individual Retirement Account (“IRA”) plans (deductible IRAs and non-deductible IRAs, including “Roth IRAs”), Education Savings Accounts, and SIMPLE IRA plans for both individuals and employers. These plans utilize the shares of the Davis Funds as their investment
vehicles. UMB Bank acts as custodian or trustee for certain retirement plans and charges each participant an annual custodial
fee of $15 per Social Security Number regardless of the number of plans established. For a detailed explanation of the custodial
fees charged to an IRA, please refer to the prospectus.
Statement of Additional Information | Davis Funds | 38
In-Kind Purchases. Shares of the Davis Funds are continuously offered at their public offering price
next determined after an order is accepted. The methods available for purchasing shares of the Davis Funds
are described in the Funds' prospectus. In addition, shares of the Davis Funds may be purchased using securities if the Adviser
determines that doing so is in the best interest of the Funds and their shareholders. The Adviser must review the securities that are offered in exchange for the “in-kind” purchase to determine that the securities delivered to the Fund: (1) meet the investment
objective, strategy, and policies of the Fund; (2) do not cause the violation of any investment restrictions at the
time of acceptance; (3) are readily marketable; (4) may be accurately and objectively valued on a daily basis; and (5) represent securities
that are desirable for the Fund to own given the Fund’s investment strategy and the Adviser’s view of market conditions. The Adviser reserves the right to reject all or any part of the securities offered in exchange for shares of the Fund. On any such
in-kind purchase, the following conditions will apply:
◼
The securities offered by the investor in exchange for shares of a Fund must not be
in any way restricted as to resale or otherwise be illiquid;
◼
The securities must have a value that is readily ascertainable (and not established
only by evaluation procedures) as evidenced by a listing on the NYSE, AMEX, NASDAQ, or other appropriate method; and
◼
The transaction involves a net purchase of $1 million or more in Fund shares.
Davis Funds believe that this ability to purchase shares of the Fund using securities
provides a means by which holders of certain securities may obtain diversification and continuous professional management
of their investments without the expense of selling those securities in the public market. Benefits to the Funds include
the ability to purchase desirable securities without brokerage commissions.
An investor who wishes to make an in-kind purchase must provide the Adviser with a
full and exact written description of each security that they propose to deliver to the Fund. The Fund will advise the investor
as to those securities that it is prepared to accept and will provide the forms required to be completed and signed by the investor.
The investor should then send the securities, in proper form for transfer and with the necessary forms, to the Adviser
and certify that there are no legal or contractual restrictions on the free transfer and sale of the securities. The securities
will be valued as of the close of business on the day of receipt by the Fund in the same manner as portfolio securities of the
Fund are valued. The number of shares of the Fund, having a net asset value as of the close of business on the day of receipt
equal to the value of the securities delivered by the investor, will be issued to the investor, less applicable stock transfer taxes,
if any.
The exchange of securities by the investor pursuant to this in-kind offer will constitute
a taxable transaction and may result in a gain or loss for federal income tax purposes. Each investor should consult their
tax adviser to determine the tax consequences under Federal and state law of making such an in-kind purchase. This
service may be discontinued at any time without prior notice.
Exchange of Shares
The prospectus describes exchange procedures. This SAI supplements that discussion.
Market Timing. Davis Funds have not entered into any arrangements which permit organizations or individuals to “market time” the Davis Funds. Although the Davis Funds will not knowingly permit investors to excessively trade the Davis Funds, shareholders seeking to engage in market timing may employ a variety of strategies
to avoid detection and there can be no guarantee that all market timing will be prevented despite the Davis Funds' best efforts.
The Davis Funds receive purchase and sales orders through financial intermediaries and cannot always know or reasonably
detect excessive trading which may be facilitated by these intermediaries or by the use of omnibus accounts by intermediaries.
The Davis Funds reserve the right to terminate or amend the exchange privilege at any time by filing amended registration
statements.
Redemption of Shares
The prospectus describes redemption procedures. This SAI supplements that discussion.
Certificates. In the past, Davis Funds issued share certificates and some are still outstanding.
If shares to be redeemed are represented by a certificate, the certificate must be sent by certified mail to Davis
Funds with a letter of instruction signed by all account owner(s).
Redemption Proceeds. Redemption proceeds normally are paid to you within seven days after Davis Funds
receives your proper redemption request. Payment for redemptions can be suspended under certain
emergency conditions determined by the SEC or if the New York Stock Exchange (“NYSE”) is closed for reasons other than customary or holiday closings. You may redeem shares on any business day (i.e., any day the NYSE is open for regular session
trading). Redemption proceeds may be withheld until a sufficient period of time has passed for State Street to be reasonably
sure that all checks or drafts (including certified or cashiers’ checks) for shares purchased have cleared, normally not exceeding fifteen calendar days. You can avoid any redemption delay by paying for your shares with a bank or federal funds wire.
The Funds have elected to be governed by Rule 18f-1 under the 1940 Act so that the
Funds are obligated to redeem their shares solely in cash up to the lesser of $250,000 or 1% of its net asset value during any
90-day period for any shareholder of the Funds. The Funds could pay the redemption price of their shares in excess of $250,000
or 1% of their net asset value, either totally or partially, by a distribution in-kind of portfolio securities (instead of
cash). The securities so distributed would be valued at the same amount as that assigned to them in calculating the NAV for the
shares being sold. If a shareholder receives
Statement of Additional Information | Davis Funds | 39
a distribution in-kind, the shareholder could incur brokerage or other charges in
converting the securities to cash and will bear any market risks associated with such securities until they are converted into cash.
A redemption in-kind is treated as a taxable transaction and a sale of the redeemed shares, generally resulting in a capital gain
or loss to you, subject to certain loss limitation rules.
The Funds do not intend to hold any significant percentage of their portfolios in
illiquid securities, although the Funds, like virtually all mutual funds, may from time to time hold a small percentage of securities
that are illiquid. When the Funds make an in-kind redemption, the Funds follow the Funds' protocol of making such distribution
by way of (a) a pro rata distribution of securities or (b) a non-pro rata distribution of securities that is in the best
interest of all Fund shareholders. If the securities provided to investors in an in-kind redemption are a non-pro rata portion of that Fund’s portfolio, it will only include securities that have been disclosed in the Fund’s most recent public portfolio holdings disclosure. The portfolio securities distributed in an in-kind redemption would be those traded on a public securities market or be otherwise
considered liquid pursuant to the Fund’s liquidity policies and procedures. Except as otherwise may be approved by the Board of Directors, the securities that would not be included in an in-kind distribution include: (1) unregistered securities
which, if distributed, would be required to be registered under the Securities Act of 1933, as amended; (2) securities issued
by entities in countries which (a) restrict or prohibit the holding of securities by non-nationals other than through qualified investment
vehicles, such as a fund, or (b) permit transfers of ownership of securities to be effected only by transactions conducted
on a local stock exchange; and (3) certain Fund assets that, although they may be liquid and marketable, must be traded
through the marketplace or with the counterparty to the transaction in order to effect a change in beneficial ownership.
There may be a risk that redemption in-kind activity could negatively impact the market
value of the securities distributed in-kind and, in turn, the NAV of the Fund(s) that holds securities that are being distributed
in-kind. The Adviser believes that the benefits to a Fund of redemptions in-kind will generally outweigh the risk of any
potential negative NAV impact.
Federal Funds Wire. You may be eligible to have your redemption proceeds electronically transferred to
a commercial bank account by federal funds wire. There is a $5 charge by State Street for wire service,
and receiving banks also may charge for this service. Redemption by federal funds wire is usually credited to your bank account
on the next business day after the sale. Alternatively, redemption through Automated Clearing House usually will arrive at
your bank two banking days after the sale. To have redemption proceeds sent by federal funds wire to your bank, you must first fill out the “Banking Instruction” section on the Account Application Form and attach a voided check or deposit slip. If the
account has already been established, an Account Service Form must be submitted with a medallion guarantee and a copy of a
voided check or deposit slip.
Redeeming Shares in Davis Government Money Market Fund. You may request redemption of part or all of your shares in Davis Government Money Market Fund by mail by sending your request to Davis Funds,
P.O. Box 219197, Kansas City, MO 64121-9197. You also may redeem shares through the Check Writing Privilege or by Expedited Redemption
Privilege to a pre-designated bank account. Normally, except for payment to a pre-designated bank account, Davis
Funds will send payment for Davis Government Money Market Fund shares redeemed within three business days, but
in no event, later than seven days, after receipt of a redemption request in proper form. Redemption of Davis Government
Money Market Fund shares that were acquired by exchange from shares subject to a contingent deferred sales charge may
be subject to such a charge. Shares exchanged into Davis Government Money Market Fund are subject to segregation to assure
payment of any sales charges that may be due on redemption.
Segregation of Davis Government Money Market Fund Shares. In order to secure the payment of any sales charge or CDSC that may be due on shares exchanged into shares of Davis Government Money Market Fund,
the number of shares equal in value to the sales charge are segregated and separately maintained in Davis Government
Money Market Fund. The purpose of the segregation is to assure that redemptions utilizing the Davis Government Money
Market Fund check writing privilege do not deplete the account without payment of any applicable sales charge and therefore
no draft will be honored for liquidation of shares in excess of the shares in the Davis Government Money Market Fund account
that are free of segregation.
Davis Government Money Market Fund Check Writing Privilege, Class A Shares. A shareholder may issue a “Stop Payment” on any draft by calling Davis Funds at 1-800-279-0279. The “Stop Payment” order will become effective if it is given on a timely basis pursuant to the “Stop Payment” rules in effect at Davis Funds with respect to their regular checking accounts.
If a shareholder seeks to use the check writing privilege or expedited redemption
privilege to a pre-designated bank account to redeem Davis Government Money Market Fund shares recently purchased by check (whether
by regular or expedited method), the Fund will refuse to accept telephone redemption requests when made and to honor
redemption drafts when presented unless it is then reasonably assured of the collection of the check representing the
purchase (normally up to 15 days after receipt of such check). This result can be avoided by investing by wire.
Statement of Additional Information | Davis Funds | 40
Section IV:
General Information
General Information
This SAI should be read in conjunction with the Funds' prospectus. This SAI supplements
the information available in the Funds' prospectus.
Determining the Price of Shares
The procedures used to determine the price of shares is described in the Funds' prospectus.
This SAI supplements that discussion.
Net Asset Value. The price per share for purchases or redemptions of Fund shares made directly through
Davis Funds, generally, is the value next computed after Davis Funds receives the purchase order
or redemption request in good order. In order for your purchase order or redemption request to be effective on the day you
place your order with your broker-dealer or other financial institution, such broker-dealer or financial institution must: (1)
receive your order before 4 p.m. Eastern time; and (2) promptly transmit the order to Davis Funds. The broker-dealer or financial
institution is responsible for promptly transmitting purchase orders or redemption requests to Davis Funds so that you may receive the same day’s net asset value. Note that in the case of redemptions and repurchases of Fund shares owned by corporations,
trusts, or estates or of shares represented by outstanding certificates (in the past, Davis Funds issued share certificates),
Davis Funds may require additional documents to effect the redemption and the applicable price will be determined as
of the next computation following the receipt of the required documentation or outstanding certificates. See “Redemption of Shares.”
The Funds do not price their shares or accept orders for purchases or redemptions
on days when the NYSE is closed.
Certain brokers and certain designated intermediaries may accept purchase and redemption
orders on their behalf. The Distributor will be deemed to have received such an order when the broker or the designee
has accepted the order. Customer orders are priced at the net asset value next computed after such acceptance. Such
order may be transmitted to the Funds or their agents several hours after the time of the acceptance and pricing.
Valuation of Portfolio Securities. The valuation of the Funds' portfolio securities is described in the Funds' prospectus
and annual and semi-annual financial statements and other information.
Dividends and Distributions
The Funds' prospectus describes the Funds' dividend and distribution policies. This
SAI supplements that discussion.
There are two sources of income, net income and realized capital gains, paid to you
by the Funds. You will receive confirmation statements for dividends declared and Fund shares purchased through reinvestment
of dividends. You also will receive confirmations after each purchase or redemption. Different classes of Fund
shares may be expected to have different expense ratios due to differing distribution services fees and certain other expenses.
Classes with higher expense ratios will pay correspondingly lower dividends than classes with lower expense ratios. For tax
purposes, information concerning Fund distributions will be mailed annually to shareholders. Shareholders have the option
of receiving all Fund dividends and distributions in cash, of having all dividends and distributions reinvested, or of
having income dividends paid in cash and capital gain distributions reinvested. Reinvestment of all dividends and distributions
is automatic for accounts utilizing the Automatic Withdrawal Plan. The reinvestment of dividends and distributions is made
at net asset value (without any initial or contingent deferred sales charge) on the payment date.
Dividends and Distributions May Change. Usually dividends and capital gains distributions are paid as discussed above. However, the Board of Directors reserves the right to suspend payments or to make
additional payments.
Federal Income Taxes
The Funds' prospectus provides a general discussion of federal income taxes. This
SAI supplements that discussion. This discussion is not intended to be a full discussion of all the aspects of the federal
income tax law and its effects on the Funds and their shareholders. Shareholders may be subject to state and local taxes on distributions.
Each investor should consult their own tax adviser regarding the effect of federal, state, and local taxes on any investment
in the Funds.
The Funds intend to continue to qualify as regulated investment companies under the
Internal Revenue Code and, if so qualified, will not be liable for federal income tax to the extent their earnings
are distributed. If the Funds do not qualify as regulated investment companies, they will be subject to corporate tax on their net
investment income and net capital gains at the corporate tax rates. If the Funds do not distribute all of their net investment
income or net capital gains, they will be subject to tax on the amount that is not distributed. If, for any calendar year, the distribution
of earnings required under the Internal Revenue Code exceeds the amount distributed, an excise tax, equal to 4% of the excess,
will be imposed on the applicable Fund(s). The Funds intend to make distributions during each calendar year sufficient
to prevent imposition of the excise tax.
From time to time, the Funds may be entitled to a tax loss carry-forward. Such carry-forward
would be disclosed in the most current version of the Funds' annual and semi-annual financial statements and other
information.
As they invest in foreign securities, the Funds may be subject to the withholding
of foreign taxes on dividends or interest they receive on foreign securities. Foreign taxes withheld will be treated as an expense
of the Funds unless the Funds meet the
Statement of Additional Information | Davis Funds | 41
qualifications and make the election to enable them to pass these taxes through to
shareholders for use by them as a foreign tax credit or deduction. Tax conventions and treaties between certain countries and
the United States may reduce or eliminate such taxes.
Distributions of net investment income and net realized short-term capital gains will
be taxable to shareholders as ordinary income. Distributions of net long-term capital gains will be taxable to shareholders
as long-term capital gains regardless of how long the shares have been held. Distributions will be treated the same for tax
purposes whether received in cash or in additional shares. Dividends declared in the last calendar month to shareholders of
record in such month and paid by the end of the following January are treated as received by the shareholder in the year in
which they are declared. A gain or loss for tax purposes may be realized on the redemption of shares. If the shareholder realizes
a loss on the sale or exchange of any shares held for six months or less and if the shareholder received a capital gain distribution
during that period, then the loss is treated as a long-term capital loss to the extent of such distribution.
We recommend that you consult with a tax advisor about dividends and capital gains
that may be received from the Funds.
Cost Basis Reporting
Mutual funds are required to report to the Internal Revenue Service the “cost basis” of shares acquired by a shareholder on or after January 1, 2012 (“covered shares”) and subsequently redeemed. These requirements do not apply to investments through a tax-deferred arrangement such as a 401(k) plan or an individual retirement plan.
The cost basis of a share is generally its purchase price adjusted for dividends, return of capital, and other corporate actions.
Cost basis is used to determine whether a sale of the shares results in a gain or loss. If you redeem covered shares during
any year, then the Funds will report the cost basis of such covered shares to you and the IRS on Form 1099-B. The Funds will permit
Fund shareholders to elect from among several IRS-accepted cost basis methods to calculate the cost basis in your
covered shares. If you do not affirmatively elect a cost basis method, then the Funds' default cost basis calculation method,
which is currently the Average Cost method, will be applied to your account(s). The cost basis method elected or applied may not
be changed after the settlement date of a sale of Fund shares. If you hold Fund shares through a broker (or another nominee),
please contact that broker (nominee) with respect to the reporting of cost basis and available elections for your account. You
are encouraged to consult your tax advisor regarding the application of the cost basis reporting rules and, in particular, which
cost basis calculation method you should elect.
Procedures and Shareholder Rights Are Described by Current Prospectus and Other Disclosure
Documents
Among other disclosures, the Funds' most current prospectus, SAI, annual and semi-annual
reports, and other documents describe: (1) the procedures which the Funds follow when interacting with shareholders; and (2) shareholders’ rights. The Funds' procedures and shareholders’ rights may change from time to time to reflect changing laws, rules, and operations. The Funds' prospectus and other disclosure documents will be amended from time to time
to reflect these changes.
Performance Data
From time to time, the Funds may advertise information regarding their performance.
Such information will be calculated separately for each class of shares. These performance figures are based on historical
results and are not intended to indicate future performance.
Performance Rankings
Lipper Rankings. From time to time, the Funds may publish the ranking of the performance of each class
of their shares by Lipper Analytical Services, Inc. Lipper is a widely recognized independent mutual
fund monitoring service. Lipper monitors the performance of regulated investment companies, including the Funds, and ranks
their performance for various periods in categories based on investment style. The Lipper performance rankings are based on
total returns that include the reinvestment of capital gain distributions and income dividends but do not take sales charges or
taxes into consideration. Lipper also publishes “peer-group” indices of the performance of all mutual funds in a category that it monitors and averages of the performance of the funds in particular categories.
Morningstar Ratings and Rankings. From time to time, the Funds may publish the ranking and/or star rating of the performance of each class of their shares by Morningstar, Inc., an independent mutual
fund monitoring service. Morningstar rates and ranks mutual funds in broad investment categories: domestic stock funds,
international stock funds, taxable bond funds, and municipal bond funds.
Performance Rankings and Comparisons by Other Entities and Publications. From time to time, the Funds may include in their advertisements and sales literature performance information about the Funds
cited in newspapers and other periodicals such as The New York Times, The Wall Street Journal, Barron’s, or similar publications. That information may include performance quotations from other sources, including Lipper and Morningstar. The performance
of each class of the Funds' shares may be compared in publications to the performance of various market indices
or other investments and averages, performance rankings, or other benchmarks prepared by recognized mutual fund statistical
services.
Investors also may wish to compare the returns on each class of the Funds' shares
to the return on fixed-income investments available from banks and thrift institutions. Those include certificates of deposit,
ordinary interest-paying checking and savings accounts, and other forms of fixed- or variable-time deposits and various
other instruments such as Treasury bills.
Statement of Additional Information | Davis Funds | 42
However, none of the Funds' returns or share prices are guaranteed or insured by the
FDIC or any other agency and will fluctuate daily, while bank depositary obligations may be insured by the FDIC and
may provide fixed rates of return. Repayment of principal and payment of interest on Treasury securities is backed by
the full faith and credit of the U.S. Government.
From time to time, the Funds may publish rankings or ratings of the Adviser or the
Funds' transfer agent and of the investor services provided by them to shareholders of the Funds. Those ratings or rankings
of shareholder and investor services by third parties may include comparisons of their services to those provided by other mutual
fund families selected by the rating or ranking services. They may be based on the opinions of the rating or ranking service
itself, using its research or judgment, or based on surveys of investors, brokers, shareholders or others.
Other Performance Statistics
In reports or other communications to shareholders and in advertising material, the
performance of the Funds may be compared to recognized unmanaged indices or averages of the performance of similar
securities. Also, the performance of the Funds may be compared to that of other funds of comparable size and objectives as
listed in the rankings prepared by Lipper, Morningstar, or similar independent mutual fund rating services, and the Funds may
use evaluations published by nationally recognized independent ranking services and publications. Any given performance comparison
should not be considered representative of the Funds' performance for any future period.
In advertising and sales literature, the Funds may publish various statistics relating
to investment portfolios such as the average price to book and price to earnings ratios, beta, alpha, R-squared, standard deviation,
etc. of the Funds' portfolio holdings.
The performance of the Funds may be compared in publications to the performance of
various indices and investments for which reliable performance data is available and to averages, performance rankings
or other information prepared by recognized mutual fund statistical services. The Funds' annual report and semi-annual
report contain additional performance information and are available on request and without charge by calling Davis Funds
toll-free at 1-800-279-0279, Monday through Friday, 9 a.m. to 6 p.m. Eastern time.
Statement of Additional Information | Davis Funds | 43
Appendix A:
Quality Ratings of Debt Securities
Quality Ratings of Debt Securities
Moody’s Credit Ratings
|
Aaa
|
Obligations rated Aaa are judged to be of the highest quality, with minimal risk.
|
|
Aa
|
Obligations rated Aa are judged to be of high quality and are subject to very low
credit risk.
|
|
A
|
Obligations rated A are considered upper medium-grade-obligations and are subject
to low credit risk.
|
|
Baa
|
Obligations rated Baa are subject to moderate credit risk. They are considered medium-grade
and as such may
possess speculative characteristics.
|
|
Ba
|
Obligations rated Ba are judged to have speculative elements and are subject to substantial
credit risk.
|
|
B
|
Obligations rated B are considered speculative and are subject to high credit risk.
|
|
Caa
|
Obligations rated Caa are judged to be of poor standing and are subject to very high
credit risk.
|
|
Ca
|
Obligations rated Ca are highly speculative and are likely in, or very near, default,
with some prospect of recovery
in principal and interest.
|
|
C
|
Obligations rated C are the lowest-rated class of bonds, and are typically in default,
with little prospect for
recovery of principal and interest.
|
S&P Global’s Credit Ratings
|
AAA
|
Extremely strong capacity to meet financial commitments. Highest rating.
|
|
AA
|
Very strong capacity to meet financial commitments.
|
|
A
|
Strong capacity to meet financial commitments, but somewhat susceptible to adverse
economic conditions and
changes in circumstances.
|
|
BBB
|
Adequate capacity to meet financial commitments, but more subject to adverse economic
conditions.
|
|
BBB-
|
Considered lowest investment-grade by market participants.
|
|
BB+
|
Considered highest speculative-grade by market participants.
|
|
BB
|
Less vulnerable in near-term but faces major ongoing uncertainties to adverse business,
financial and economic
conditions.
|
|
B
|
More vulnerable to adverse business, financial and economic conditions but currently
has the capacity to meet
financial commitments.
|
|
CCC
|
Currently vulnerable and dependent on favorable business, financial and economic conditions
to meet financial
commitments.
|
|
CC
|
Highly vulnerable; default has not yet occurred, but is expected to be a virtual certainty.
|
|
C
|
Currently highly vulnerable to non-payment, and ultimate recovery is expected to be
lower than that of higher rated
obligations.
|
|
D
|
Payment default on a financial commitment or breach or an imputed promise; also used
when a bankruptcy
petition has been filed or similar action taken.
|
Statement of Additional Information | Davis Funds | 44
Appendix B:
Terms and Conditions for a Statement of Intention
(Class A Shares Only)
Terms and Conditions for a Statement of Intention
(Class A Shares Only)
Terms of Escrow:
1.
Out of my initial purchase (or subsequent purchases if necessary) 5% of the dollar
amount specified in this Statement will be held in escrow by SS&C GIDS, Inc. in the form of shares (computed to the nearest
full share at the public offering price applicable to the initial purchase hereunder) registered in my name.
For example, if the minimum amount specified under this statement is $100,000 and the public offering price applicable
to transactions of $100,000 is $10 a share, 500 shares (with a value of $5,000) would be held in escrow.
2.
In the event I should exchange some or all of my shares to those of another mutual
fund for which Davis Distributors, LLC, acts as distributor, according to the terms of this prospectus, I hereby authorize
SS&C GIDS, Inc. to escrow the applicable number of shares of the new fund, until such time as this Statement is
complete.
3.
If my total purchases are at least equal to the intended purchases, the shares in
escrow will be delivered to me or to my order.
4.
If my total purchases are less than the intended purchases I will permit Davis Distributors,
LLC, my dealer, or SS&C GIDS, Inc. to redeem the difference in the dollar amount of the sales charge that
would have originally been paid by me, from the escrowed shares.
5.
I hereby irrevocably constitute and appoint SS&C GIDS, Inc. as my attorney-in-fact
to surrender for redemption any or all escrowed shares with full power of substitution in the premises.
6.
Shares remaining after the redemption referred to in Paragraph No. 4 will be credited
to my account.
7.
The duties of SS&C GIDS, Inc. are only such as are herein provided being purely ministerial
in nature, and it shall incur no liability whatever except for willful misconduct or gross negligence so long
as it has acted in good faith. It shall be under no responsibility other than faithfully to follow the instructions
herein. It may consult with legal counsel and shall be fully protected in any action taken in good faith in accordance
with advice from such counsel. It shall not be required to defend any legal proceedings that may be instituted against
it in respect of the subject matter of this Agreement unless requested to do so and indemnified to its satisfaction against
the cost and expense of such defense.
Statement of Additional Information | Davis Funds | 45
Appendix C:
Summary of the Adviser’s Proxy Voting Policies and Procedures
Summary of the Adviser’s Proxy Voting Policies and Procedures
Davis Selected Advisers, L.P. (the “Adviser”) votes on behalf of its clients in matters of corporate governance through the proxy voting process. The Adviser takes its ownership responsibilities very seriously
and believes the right to vote proxies for its clients’ holdings is a significant asset of the clients. The Adviser exercises its voting responsibilities as a fiduciary, solely with the goal of maximizing the value of its clients’ investments.
The Adviser votes proxies with a focus on the investment implications of each issue.
For each proxy vote, the Adviser takes into consideration its duty to clients and all other relevant facts known to the Adviser
at the time of the vote. Therefore, while these guidelines provide a framework for voting, votes are ultimately cast on a case-by-case
basis.
The Adviser has adopted written Proxy Voting Policies and Procedures and established
a Proxy Oversight Group to oversee voting policies and deal with potential conflicts of interest. In evaluating issues,
the Proxy Oversight Group may consider information from many sources, including the Portfolio Managers for each client account,
management of a company presenting a proposal, shareholder groups, and independent proxy research services.
While the Proxy Oversight Group may consider information from many sources, there
is no requirement that it consider each source and the Proxy Oversight Group shall have the discretion in its professional
judgement to determine each matter to be voted on. The Adviser may utilize research provided by an independent third-party
proxy advisory firm. As a policy, the Adviser does not follow the voting recommendations provided by these firms.
Clients may obtain a copy of the Adviser’s Proxy Voting Policies and Procedures, and/or a copy of how their own proxies were voted, by writing to:
Davis Selected Advisers, L.P.
Attn: Chief Compliance Officer
2949 East Elvira Road, Suite 101
Tucson, Arizona, 85756
Attn: Chief Compliance Officer
2949 East Elvira Road, Suite 101
Tucson, Arizona, 85756
Guiding Principles
Creating Value for Existing Shareholders. The most important factors that the Adviser will consider in evaluating proxy issues are: (1) the company’s or management’s long-term track record of creating value for shareholders (e.g., in general, the Adviser will consider the recommendations of a management with a good record of creating
value for shareholders as more credible than the recommendations of a management with a poor record); (2) whether, in the Adviser’s estimation, the current proposal being considered will significantly enhance or detract from long-term value
for existing shareholders; and (3) whether a poor record of long term performance resulted from poor management or from factors outside of management’s control.
Other factors which the Adviser will consider may include:
◼
Shareholder oriented management. One of the factors that the Adviser considers in selecting stocks for investment
is the presence of shareholder-oriented management. In general, such managements will have
a large ownership stake in the company. They will also have a record of taking actions and supporting policies designed
to increase the value of the company’s shares and thereby enhance shareholder wealth. The Adviser’s research analysts are active in meeting with top management of portfolio companies and in discussing their views on policies or actions
which could enhance shareholder value. Whether management shows evidence of responding to reasonable shareholder suggestions,
and otherwise improving general corporate governance, is a factor which may be taken into consideration
in proxy voting.
◼
Allow responsible management teams to run the business. Because the Adviser tries, generally, to invest with “owner oriented” managements (see above), it will vote with the recommendation of management on most routine matters, unless circumstances such as long standing poor performance or a change from its initial
assessment indicates otherwise. Examples include the election of directors and ratification of auditors. The Adviser
supports policies, plans, and structures that give management teams the appropriate latitude to run the business in the way
that is most likely to maximize value for owners. Conversely, the Adviser opposes proposals that limit management’s ability to do this. The Adviser will generally vote with management on shareholder social and environmental proposals on
the basis that their impact on share value is difficult to judge and is therefore best done by management.
◼
Preserve and expand the power of shareholders in areas of corporate governance. Equity shareholders are owners of the business, and company boards and management teams are ultimately accountable to them.
The Adviser will support policies, plans, and structures that promote accountability of the board and management
to owners, and align the interests of the board and management with owners. Examples include: annual election of all
board members and incentive plans that are contingent on delivering value to shareholders. The Adviser will generally
oppose proposals that reduce accountability or misalign interests, including but not limited to classified boards,
poison pills, excessive option plans, and repricing of options.
Statement of Additional Information | Davis Funds | 46
◼
Support compensation policies that reward management teams appropriately for performance. The Adviser believes that well thought out incentives are critical to driving long-term shareholder value creation.
Management incentives ought to be aligned with the goals of long-term owners. In the Adviser’s view, the basic problem of skyrocketing executive compensation is not high pay for high performance, but high pay for mediocrity or
worse. In situations where the Adviser feels that the compensation practices at companies the Funds own are not acceptable,
the Adviser will exercise its discretion to vote against compensation committee members and specific compensation
proposals.
The Adviser exercises its professional judgment in applying these principles to specific proxy votes. The Adviser’s Proxy Policies and Procedures provide additional explanation of the analysis which the Adviser
may conduct when applying these guiding principles to specific proxy votes.
Conflicts of Interest
A potential conflict of interest arises when the Adviser has business interests that
may not be consistent with the best interests of its client. The Adviser’s Proxy Oversight Group is charged with resolving material potential conflicts of interest which it becomes aware of. It is charged with resolving conflicts in a manner that is consistent
with the best interests of clients. There are many acceptable methods of resolving potential conflicts, and the Proxy Oversight
Group exercises its judgment and discretion to determine an appropriate means of resolving a potential conflict in
any given situation:
◼
Votes consistent with the “General Proxy Voting Policies,” are presumed to be consistent with the best interests of clients;
◼
The Adviser may disclose the conflict to the client and obtain the client’s consent prior to voting the proxy;
◼
The Adviser may obtain guidance from an independent third-party;
◼
The potential conflict may be immaterial; or
◼
Other reasonable means of resolving potential conflicts of interest which effectively
insulate the decision on how to vote client proxies from the conflict.
Statement of Additional Information | Davis Funds | 47
PART C
OTHER INFORMATION
Item 28.
Exhibits:
|
(a)(1)
|
|
|
(a)(2)
|
|
|
(a)(3)
|
|
|
(a)(4)
|
|
|
(a)(5)
|
|
|
(a)(6)
|
|
|
(a)(7)
|
|
|
(b)
|
|
|
(c)
|
Instruments Defining Rights of Security Holders. Not applicable.
|
|
(d)(1)
|
|
|
(d)(2)
|
|
|
(d)(3)
|
|
|
(e)(1)
|
|
|
(e)(2)
|
|
|
(f)
|
Bonus or Profit Sharing Contracts. Not applicable.
|
|
(g)
|
|
(h)(1)
|
|
|
(h)(2)
|
|
|
(h)(3)
|
|
|
(h)(4)
|
|
|
(h)(5)
|
|
|
(i)*
|
|
|
(j)*
|
|
|
(k)
|
Omitted Financial Statements. Incorporated from the Annual Report.
|
|
(l)
|
Initial Capital Agreements. Not applicable.
|
|
(m)(1)
|
|
|
(m)(2)
|
|
|
(n)
|
|
|
(o)
|
Reserved.
|
|
(p)*
|
|
|
(q)(1)
|
*
filed herein
Item 29.
Persons Controlled by or Under Common Control With Registrant
Information pertaining to persons controlled by or under common control with Registrant
is incorporated by reference from the Statement of Additional Information contained in Part B of this
Registration Statement.
Item 30.
Indemnification
Registrant’s Articles of Incorporation indemnifies its directors, officers and employees to the full extent permitted by Section 2-418 of the Maryland General Corporation Law, subject only to
the provisions of the Investment Company Act of 1940. The indemnification provisions of the Maryland General
Corporation Law (the “Law”) permit, among other things, corporations to indemnify directors and officers unless it is proved that the individual (1) acted in bad faith or with active and deliberate dishonesty,
(2) actually received an improper personal benefit in money, property or services, or (3) in the
case of a criminal
proceeding, had reasonable cause to believe that his act or omission was unlawful.
The Law was also amended to permit corporations to indemnify directors and officers for amounts paid
in settlement of stockholders’ derivative suits.
In addition, the Registrant’s directors and officers are covered under a policy to indemnify them for loss (subject to certain deductibles) including costs of defense incurred by reason of
alleged errors or omissions, neglect or breach of duty. The policy has a number of exclusions including
alleged acts, errors, or omissions which are finally adjudicated or established to be deliberate, dishonest,
malicious or fraudulent or to constitute willful misfeasance, bad faith, gross negligence or reckless
disregard of their duties in respect to any registered investment company. This coverage is incidental
to a general policy carried by the Registrant’s adviser.
In addition to the foregoing indemnification, Registrant’s Articles of Incorporation exculpate directors and officers with respect to monetary damages except to the extent that an individual
actually received an improper benefit in money property or services or to the extent that a final adjudication
finds that the individual acted with active and deliberate dishonesty.
Item 31.
Business and Other Connections of Investment Adviser
Davis Selected Advisers, L.P. (“DSA”) and affiliated companies comprise a financial services organization whose business consists primarily of providing investment management services as the
investment adviser and manager for investment companies registered under the Investment Company Act of
1940, unregistered domestic and off-shore investment companies, and as an investment adviser
to institutional and individual accounts. DSA also serves as sub-adviser to other investment companies.
Affiliated companies include:
Davis Investments, LLC: the sole general partner of DSA. Controlled by its sole member,
Christopher C. Davis.
Venture Advisers, Inc.: a corporation whose primary purpose is to hold limited partner
units in DSA.
Davis Selected Advisers – NY, Inc.: a wholly-owned subsidiary of DSA, is a federally registered investment adviser which serves as sub-adviser for many of DSA’s advisory clients.
Davis Distributors LLC: a wholly-owned subsidiary of DSA, is a registered broker-dealer
which serves as primary underwriter of Davis New York Venture Fund, Inc., Davis Series, Inc., Davis
Variable Account Fund, Inc. (herein collectively referred to as the “Davis Funds”), Selected American Shares, Inc., and Clipper Funds Trust.
Other business of a substantial nature that directors or officers of DSA are or have
been engaged in the last two years:
Lisa Cohen (4/25/89), 2949 East Elvira Road, Suite 101, Tucson, AZ 85756. Vice President and Secretary
of each of Davis New York Venture Fund, Inc., Davis Series, Inc., Davis Variable Account
Fund, Inc., Selected American Shares, Inc., Clipper Funds Trust, and Davis Fundamental ETF Trust.
Vice President, Chief Legal Officer, and Secretary, Davis Investments, LLC. Also serves as a senior
officer for several companies affiliated with DSA which are described above.
Andrew Davis (6/25/63), 620 Fifth Avenue, 3rd Floor, New York, NY 10020. A director and officer of each of Davis New York Venture Fund, Inc., Davis Series, Inc., Davis Variable Account
Fund, Inc., and Selected American Shares, Inc. Trustee of Clipper Funds Trust. President of Davis
Investments, LLC. Also serves as a director and/or senior officer for several companies affiliated with DSA
which are described above.
Christopher Davis (7/13/65), 620 Fifth Avenue, 3rd Floor, New York, NY 10020. A director and officer of each of Davis New York Venture Fund, Inc., Davis Series, Inc., Davis Variable Account
Fund, Inc., and Selected American Shares, Inc. President and Trustee of Clipper Funds Trust. Director,
Chairman of Davis Investments, LLC. Also serves as a director and/or senior officer for several companies
affiliated with DSA, which are described above. Director, Graham Holdings Company. Director, The Coca-Cola
Company. Director, Berkshire Hathaway, Inc.
Kenneth Eich (8/14/53), 2949 East Elvira Road, Suite 101, Tucson, AZ 85756. Executive Vice President and Principal Executive Officer of each of Davis New York Venture Fund, Inc., Davis
Series, Inc., Davis Variable Account Fund, Inc. Selected American Shares, Inc., Clipper Funds Trust; Trustee/Chairman,
Executive Vice President, and Principal Executive Officer of Davis Fundamental ETF
Trust. Chief Operating Officer of Davis Investments, LLC. Also serves as a senior officer for several
companies affiliated with DSA which are described above.
Douglas Haines (3/4/71), 2949 East Elvira Road, Suite 101, Tucson, AZ 85756. Vice President, Treasurer, Chief Financial Officer, Principal Financial Officer, and Principal Accounting Officer
of each of Davis New York Venture Fund, Inc., Davis Series, Inc., Davis Variable Account Fund., Inc.,
Selected American Shares, Inc., Clipper Funds Trust, and Davis Fundamental ETF Trust. Vice President
of Davis Investments, LLC.
Michaela McLoughry (3/21/81), 2949 East Elvira Road, Suite 101, Tucson, AZ 85756. Vice President and Chief Compliance Officer of each of Davis New York Venture Fund, Inc., Davis Series,
inc., Davis Variable Account Fund, Inc., Selected American Shares, Inc., Clipper Funds Trust,
and Davis Fundamental ETF Trust. Vice President of Davis Investments, LLC. Also serves as Chief Compliance
Officer for DSA and as a senior officer for several companies affiliated with DSA which are described
above.
Gary Tyc (5/27/56), 2949 East Elvira Road, Suite 101, Tucson, AZ 85756. Vice President, Chief Financial
Officer, Treasurer, and Secretary of Davis Investments, LLC. Also serves as a senior
officer for several companies affiliated with DSA which are described above.
Russell Wiese (5/18/66), 620 Fifth Avenue, 3rd Floor, New York, NY 10020. Chief Marketing Officer of Davis Investments, LLC. Also serves as a director and/or senior officer for several
companies affiliated with DSA which are described above.
Item 32.
Principal Underwriter
Item 32 (a)
Davis Distributors, LLC, a wholly owned subsidiary of the Adviser, located at 2949
East Elvira Road, Suite 101, Tucson, AZ 85756, is the principal underwriter for Davis New York Venture
Fund, Inc., Davis Series, Inc., Davis Variable Account Fund, Inc., Selected American Shares, Inc., Clipper
Funds Trust, and Davis Funds SICAV.
Item 32 (b)
Management of the Principal Underwriter:
|
Name and Principal
Business Address
|
Positions and Offices with
Underwriter
|
Positions and Offices with
Registrant
|
|
Kenneth Eich
2949 East Elvira
Road, Suite 101
Tucson, AZ 85756
|
President
|
Executive Vice President
and Principal Executive
Officer
|
|
Russell Wiese
620 Fifth Avenue,
3rd Floor
New York, NY
10020
|
Chief Marketing Officer
|
None
|
|
Gary Tyc
2949 East Elvira
Road, Suite 101
Tucson, AZ 85756
|
Vice President, Treasurer and
Secretary
|
None
|
|
Name and Principal
Business Address
|
Positions and Offices with
Underwriter
|
Positions and Offices with
Registrant
|
|
Michaela
McLoughry
2949 East Elvira
Road, Suite 101
Tucson, AZ 85756
|
Chief Compliance Officer
|
Vice President and Chief
Compliance Officer
|
|
Lisa Cohen
2949 East Elvira
Road, Suite 101
Tucson, AZ 85756
|
Vice President and Secretary
|
Vice President and
Secretary
|
Item 32 (c)
Not applicable.
Item 33.
Location of Accounts and Records
Accounts and records are maintained at the offices of Davis Selected Advisers, L.P.,
2949 East Elvira Road, Suite 101, Tucson, Arizona 85756, and at the offices of the Registrant’s custodian, State Street Bank and Trust Company, One Congress Street, Suite 1, Boston, MA, 02114-2016, and the Registrant’s transfer agent SS&C GIDS, Inc., 1055 Broadway, Kansas City, MO 64105
Item 34.
Management Services
Not applicable.
Item 35.
Undertakings
Registrant undertakes to furnish each person to whom a prospectus is delivered with a copy of Registrant’s latest annual report to shareholders upon request and without charge.
DAVIS SERIES, INC.
SIGNATURES
Pursuant to the requirements of the Securities Act of 1933 and the Investment Company
Act of 1940, the Registrant has caused this Registration Statement to be signed on its behalf by the
undersigned, duly authorized, in the City of Tucson and State of Arizona on April 29, 2026.
The Registrant hereby certifies that this Post-Effective Amendment meets all the requirements
for effectiveness under paragraph (b) of Rule 485 of the Securities Act of 1933.
DAVIS SERIES, INC.
|
* By:
|
/s/ Lisa Cohen
|
|
Lisa Cohen
|
|
|
Attorney-in-Fact
|
|
Pursuant to the requirements of the Securities Act of 1933, this Registration Statement
has been signed below by the following persons in the capacities indicated.
|
Signature
|
Title
|
Date
|
|
/s/ Kenneth Eich*
|
Principal Executive Officer
|
April 29, 2026
|
|
Kenneth Eich
|
|
|
|
/s/ Douglas Haines*
|
Principal Financial Officer; and
|
April 29, 2026
|
|
Douglas Haines
|
Principal Accounting Officer
|
|
|
*By:
|
/s/ Lisa Cohen
|
|
Lisa Cohen
|
|
|
Attorney-in-Fact
|
|
*
Lisa Cohen signs this document on behalf of the Registrant and each of the foregoing
officers pursuant to the power of attorney filed as Exhibit 28 (q)(1).
|
*By:
|
/s/ Lisa Cohen
|
|
Lisa Cohen
|
|
|
Attorney-in-Fact
|
|
DAVIS SERIES, INC.
Pursuant to the requirements of the Securities Act of 1933, this Registration Statement
has been signed on April 29, 2026, by the following persons in the capacities indicated.
|
Signature
|
Title
|
|
/s/ Francisco Borges*
|
Director
|
|
Francisco Borges
|
|
|
/s/ Andrew Davis*
|
Director
|
|
Andrew Davis
|
|
|
/s/ Christopher Davis*
|
Director
|
|
Christopher Davis
|
|
|
/s/ John Gates*
|
Director
|
|
John Gates
|
|
|
/s/ Samuel Iapalucci*
|
Director
|
|
Samuel Iapalucci
|
|
|
/s/ Katherine MacWilliams*
|
Director
|
|
Katherine MacWilliams
|
|
|
/s/ Lara Vaughan*
|
Director
|
|
Lara Vaughan
|
|
*
Lisa Cohen signs this document on behalf of the Registrant and each of the foregoing
officers pursuant to the power of attorney filed as Exhibit 28 (q)(1).
|
*By:
|
/s/ Lisa Cohen
|
|
Lisa Cohen
|
|
|
Attorney-in-Fact
|
|