Pay vs Performance Disclosure
Jan. 31, 2026
USD ($)
Pay versus Performance Table
The following table sets forth certain information with respect to the Company’s financial performance and the compensation paid to our NEOs for the fiscal year ended on January 31, 2026.
Fiscal Year |
Summary Compensation Table Total for PEO (1) |
Compensation Actually Paid to PEO (1)(2) |
Average Summary Compensation Table Total for Non-PEO NEOs (3) |
Average Compensation Actually Paid to Non-PEO NEOs (2)(3) |
Value of Initial Fixed $100 Investment Based on: |
Net Income (in millions) |
Annual Recurring Revenue (in millions) |
|||||||||||||||||||||||||||
Total Shareholder Return (4) |
Peer Group Total Shareholder Return (4) |
|||||||||||||||||||||||||||||||||
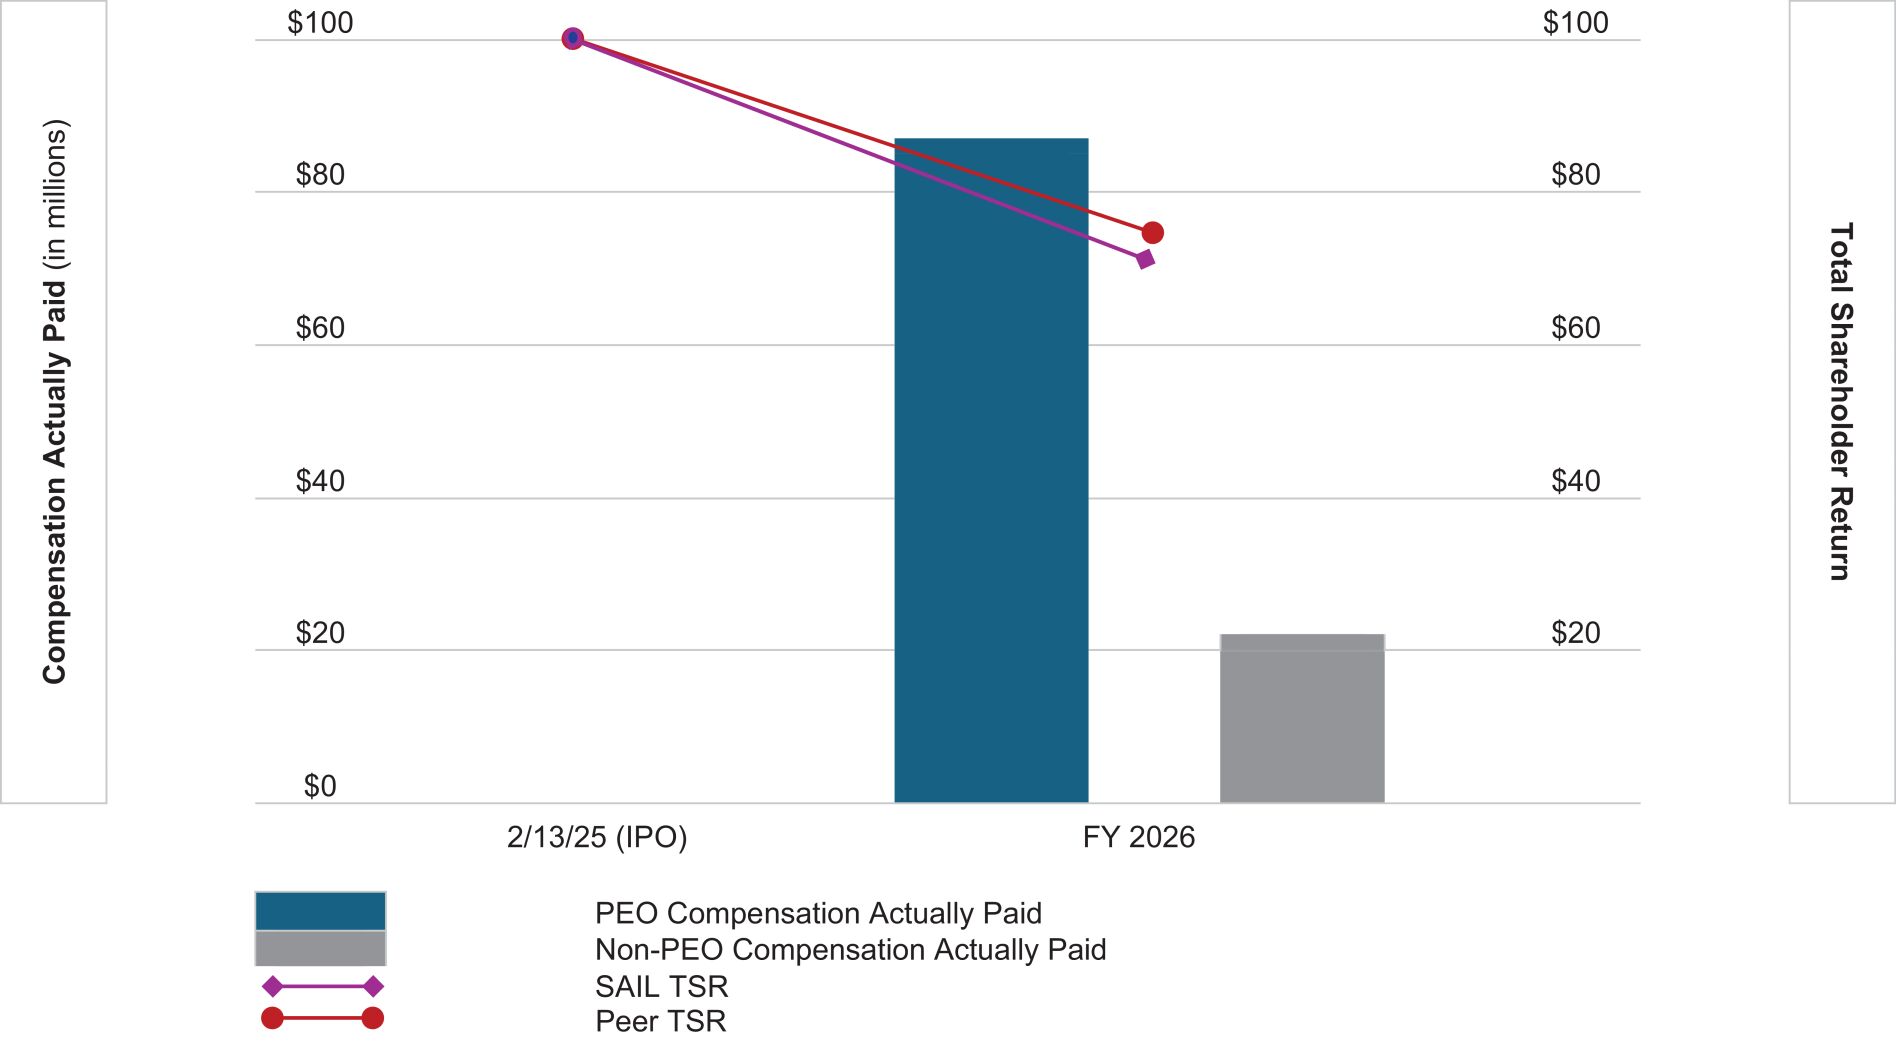
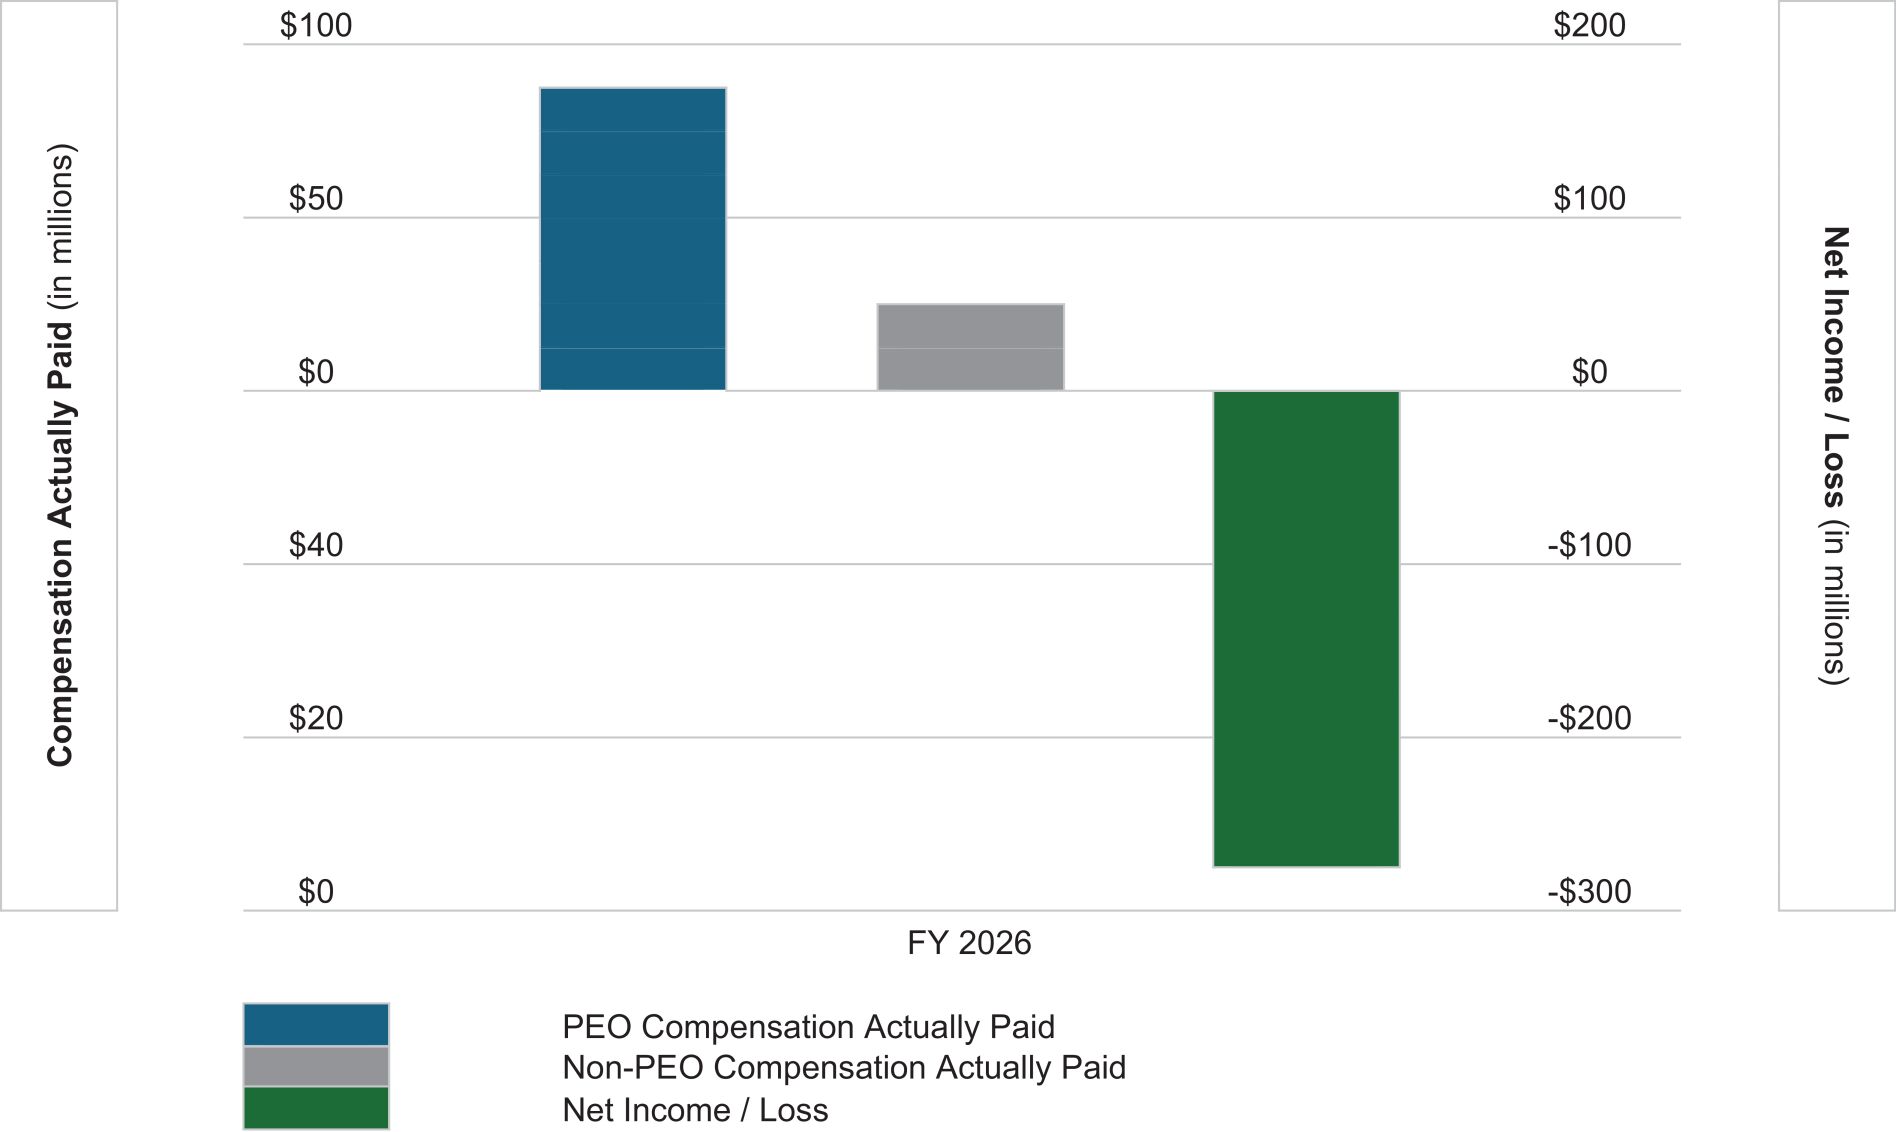
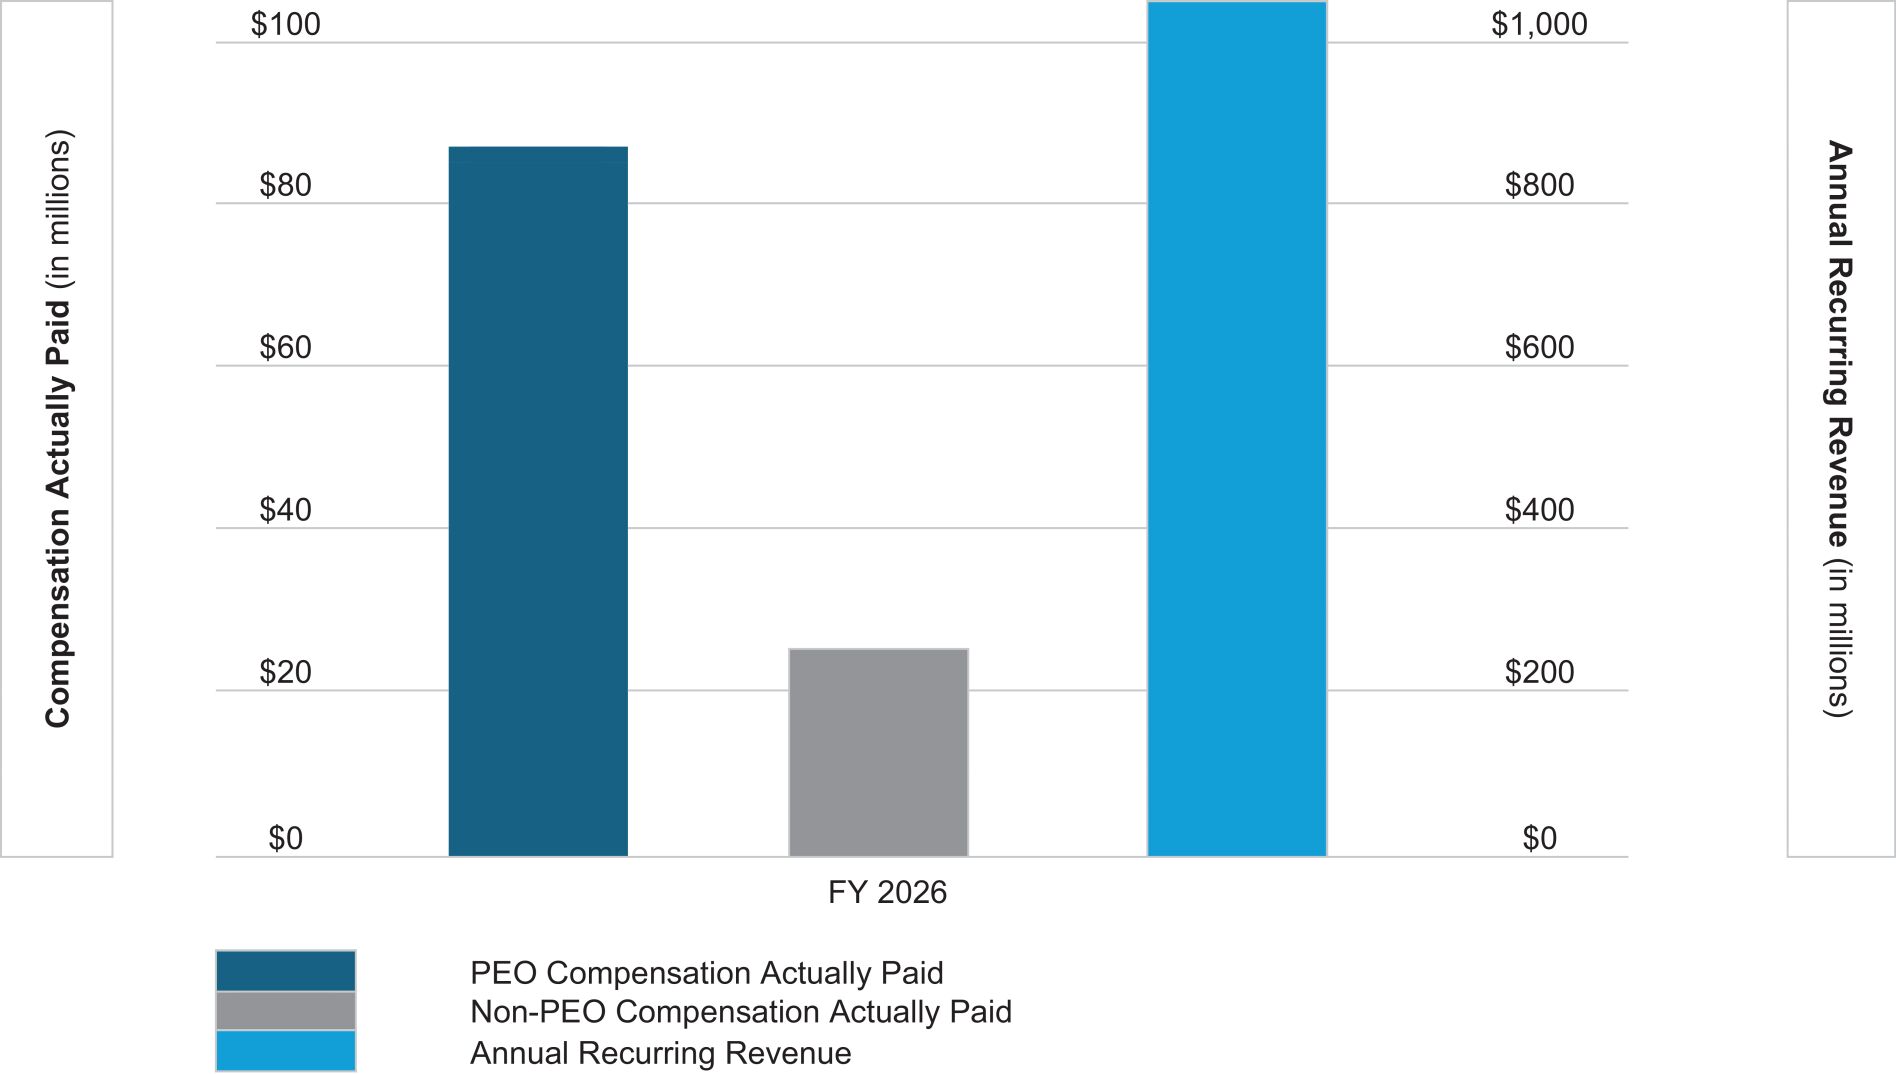
| 2026 | $ | 80,100,892 | $ | 87,715,560 | (7) |
$ | 19,990,188 | $ | 22,104,707 | (8) |
$ | 71.32 | $ | 74.50 | $ | (270.05) | $ | 1,125 | ||||||||||||||||
| (1) | The name of the Principal Executive Officer of the Company (“PEO”) reflected in these columns for the applicable fiscal year is Mark McClain. |
| (2) | In calculating the ‘compensation actually paid’ amounts reflected in these columns, the fair value or change in fair value, as applicable, of the equity award adjustments included in such calculations was computed in accordance with FASB ASC Topic 718. The valuation assumptions used to calculate such fair values did not materially differ from those disclosed at the time of grant. |
| (3) | The names of each of the non-PEO NEOs reflected in these columns for the applicable fiscal year are as follows: Brian Carolan, Matt Mills, Abby Payne, Chris Schmitt. |
| (4) | The Company TSR and the Company’s Peer Group TSR reflected in these columns for each applicable fiscal year is calculated based on a fixed investment of $100 at the applicable measurement point on the same cumulative basis as is used in Item 201(e) of Regulation S-K. |
The peer group used to determine the Company’s Peer Group TSR for each applicable fiscal year is the following published industry index, as disclosed in our Fiscal Year 2026 Annual Report on Form
10-K
pursuant to Item 201(e) of Regulation S-K:
BVP Nasdaq Emerging Cloud. | (5) | Represents the amount of net income reflected in the Company’s audited GAAP financial statements for each applicable fiscal year. |
| (6) | We have selected Annual Recurring Revenue (ARR) as our most important financial measure (that is not otherwise required to be disclosed in the table) used to link ‘compensation actually paid’ to our NEOs to company performance for the fiscal year ended January 31, 2026. See the Annual Incentive Compensation section for ARR as a key measure for the Corporate Bonus Plan. |
| (7) | For the fiscal year ended January 31, 2026, the ‘compensation actually paid’ to the PEO reflects each of the following adjustments made to the total compensation amounts reported in the Summary Compensation Table for the fiscal year ended January 31, 2026, computed in accordance with Item 402(v) of Regulation S-K: |
Compensation Element |
PEO |
|||
Summary Compensation Table Total |
$ |
80,100,892 |
||
Less, Grant date fair value of stock and option awards reported in the Summary Compensation Table |
$ | (78,849,289) | ||
Plus, Year-End Fair Value of Awards Granted in the Covered Fiscal year that are Outstanding and Unvested |
$ | 28,006,964 | ||
Plus, Change in Fair Value of Awards Granted in Prior Years that are Outstanding and Unvested (from Prior-Year-end to Year-end) |
$ | 0 | ||
Plus, Vesting Date Fair Value of Awards Granted in the Covered Fiscal Year that Vested in the Fiscal Year |
$ | 34,953,408 | ||
Plus, Change in Fair Value of Awards Granted in Prior Years that Vested in the Covered Fiscal Year (from Prior Year-end to vesting Date) |
$ | 23,503,585 | ||
Less Prior Year-end Fair Value of Awards Granted in Prior Years that Failed to Vest in the Covered Fiscal Year |
$ | (0) | ||
Plus, Dollar Value of Dividends, Dividend Equivalents or other Earnings Paid on Stock and Option Awards in the Covered Fiscal Year Prior to Vesting |
$ | 0 | ||
Total Adjustments |
$ |
— |
||
Total Compensation Actually Paid |
$ |
87,715,560 |
||
| (8) | For the fiscal year ended January 31, 2026, the average ‘compensation actually paid’ to the non-PEO NEOs reflects each of the following adjustments made to the total compensation amounts reported in the Summary Compensation Table for the fiscal year ended January 31, 2026 , computed in accordance with Item 402(v) of Regulation S-K: |
Compensation Element |
Average of Non-PEO NEO’s |
|||
Summary Compensation Table Total |
$ |
19,990,188 |
||
Less, Grant date fair value of stock and option awards reported in the Summary Compensation Table |
$ | (19,179,112) | ||
Plus, Year-End Fair Value of Awards Granted in the Covered Fiscal year that are Outstanding and Unvested |
$ | 6,812,343 | ||
Plus, Change in Fair Value of Awards Granted in Prior Years that are Outstanding and Unvested (from Prior-Year-end to Year-end) |
$ | 0 | ||
Plus, Vesting Date Fair Value of Awards Granted in the Covered Fiscal Year that Vested in the Fiscal Year |
$ | 8,501,990 | ||
Plus, Change in Fair Value of Awards Granted in Prior Years that Vested in the Covered Fiscal Year (from Prior Year-end to vesting Date) |
$ | 5,979,299 | ||
Less Prior Year-end Fair Value of Awards Granted in Prior Years that Failed to Vest in the Covered Fiscal Year |
$ | (0) | ||
Plus, Dollar Value of Dividends, Dividend Equivalents or other Earnings Paid on Stock and Option Awards in the Covered Fiscal Year Prior to Vesting |
$ | 0 | ||
Total Compensation Actually Paid |
$ |
22,104,707 |
||
non-PEO
NEOs reflected in these columns for the applicable fiscal year are as follows: Brian Carolan, Matt Mills, Abby Payne, Chris Schmitt.
| (4) | The Company TSR and the Company’s Peer Group TSR reflected in these columns for each applicable fiscal year is calculated based on a fixed investment of $100 at the applicable measurement point on the same cumulative basis as is used in Item 201(e) of Regulation S-K. |
The peer group used to determine the Company’s Peer Group TSR for each applicable fiscal year is the following published industry index, as disclosed in our Fiscal Year 2026 Annual Report on Form
10-K
pursuant to Item 201(e) of Regulation S-K:
BVP Nasdaq Emerging Cloud. | (7) | For the fiscal year ended January 31, 2026, the ‘compensation actually paid’ to the PEO reflects each of the following adjustments made to the total compensation amounts reported in the Summary Compensation Table for the fiscal year ended January 31, 2026, computed in accordance with Item 402(v) of Regulation S-K: |
Compensation Element |
PEO |
|||
Summary Compensation Table Total |
$ |
80,100,892 |
||
Less, Grant date fair value of stock and option awards reported in the Summary Compensation Table |
$ | (78,849,289) | ||
Plus, Year-End Fair Value of Awards Granted in the Covered Fiscal year that are Outstanding and Unvested |
$ | 28,006,964 | ||
Plus, Change in Fair Value of Awards Granted in Prior Years that are Outstanding and Unvested (from Prior-Year-end to Year-end) |
$ | 0 | ||
Plus, Vesting Date Fair Value of Awards Granted in the Covered Fiscal Year that Vested in the Fiscal Year |
$ | 34,953,408 | ||
Plus, Change in Fair Value of Awards Granted in Prior Years that Vested in the Covered Fiscal Year (from Prior Year-end to vesting Date) |
$ | 23,503,585 | ||
Less Prior Year-end Fair Value of Awards Granted in Prior Years that Failed to Vest in the Covered Fiscal Year |
$ | (0) | ||
Plus, Dollar Value of Dividends, Dividend Equivalents or other Earnings Paid on Stock and Option Awards in the Covered Fiscal Year Prior to Vesting |
$ | 0 | ||
Total Adjustments |
$ |
— |
||
Total Compensation Actually Paid |
$ |
87,715,560 |
||
| (8) | For the fiscal year ended January 31, 2026, the average ‘compensation actually paid’ to the non-PEO NEOs reflects each of the following adjustments made to the total compensation amounts reported in the Summary Compensation Table for the fiscal year ended January 31, 2026 , computed in accordance with Item 402(v) of Regulation S-K: |
Compensation Element |
Average of Non-PEO NEO’s |
|||
Summary Compensation Table Total |
$ |
19,990,188 |
||
Less, Grant date fair value of stock and option awards reported in the Summary Compensation Table |
$ | (19,179,112) | ||
Plus, Year-End Fair Value of Awards Granted in the Covered Fiscal year that are Outstanding and Unvested |
$ | 6,812,343 | ||
Plus, Change in Fair Value of Awards Granted in Prior Years that are Outstanding and Unvested (from Prior-Year-end to Year-end) |
$ | 0 | ||
Plus, Vesting Date Fair Value of Awards Granted in the Covered Fiscal Year that Vested in the Fiscal Year |
$ | 8,501,990 | ||
Plus, Change in Fair Value of Awards Granted in Prior Years that Vested in the Covered Fiscal Year (from Prior Year-end to vesting Date) |
$ | 5,979,299 | ||
Less Prior Year-end Fair Value of Awards Granted in Prior Years that Failed to Vest in the Covered Fiscal Year |
$ | (0) | ||
Plus, Dollar Value of Dividends, Dividend Equivalents or other Earnings Paid on Stock and Option Awards in the Covered Fiscal Year Prior to Vesting |
$ | 0 | ||
Total Compensation Actually Paid |
$ |
22,104,707 |
||
Compensation Actually Paid and Company and Peer TSR
Compensation Actually Paid and Net Income
Compensation Actually Paid and Annual Recurring Revenue
Compensation Actually Paid and Company and Peer TSR
Pay versus Performance Tabular List
The following table lists our most important performance measures used by us to link ‘compensation actually paid’ to our NEOs to company performance for the fiscal year ended January 31, 2026. We only consider the two metrics listed below when making executive compensation determinations.
Most Important Performance Measures |
Annual Recurring Revenue |
Adjusted Income from Operations |