Shareholder Report
Feb. 28, 2026
USD ($)
$ / shares
WHAT
WERE THE FUND COSTS FOR THE LAST YEAR? (based
on a hypothetical $10,000 investment)
|
Class
Name |
Costs
of a $10,000 investment
|
Costs
paid as a percentage of a $10,000
investment |
|
Class
A |
$79
|
0.77%
|
HOW
DID THE FUND PERFORM LAST YEAR AND WHAT AFFECTED ITS PERFORMANCE?
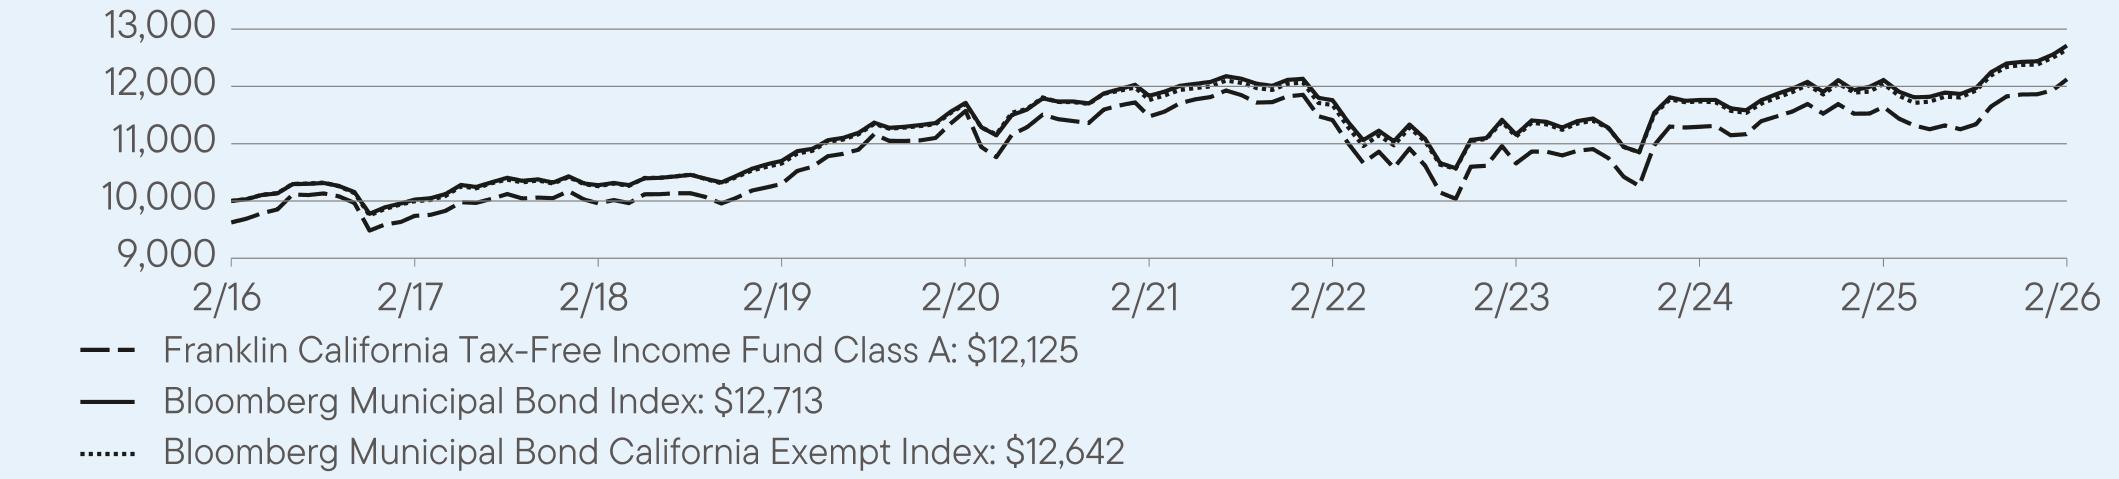
For the twelve months ended February
28, 2026, Class A shares of
Franklin California Tax-Free Income Fund returned 4.15%.
The Fund compares its performance
to the Bloomberg Municipal Bond California Exempt Index, which returned 4.98% for the same period.
PERFORMANCE
HIGHLIGHTS
|
Top
contributors to performance: | |
|
↑
|
Selection
in A rated bonds |
|
↑
|
Selection
in AA rated bonds |
|
↑
|
Overweight
to BBB rated bonds |
|
Top
detractors from performance: | |
|
↓
|
Underweight
bonds with five years or less to maturity |
|
↓
|
Overweight
bonds with 20 or more years to maturity |
|
↓
|
Selection
in BBB rated bonds |
AVERAGE
ANNUAL TOTAL RETURNS (%) Period
Ended February 28, 2026
|
|
1
Year |
5
Year |
10
Year |
|
Class
A |
4.15
|
1.11
|
2.37
|
|
Class
A (with sales charge) |
0.25
|
0.34
|
1.98
|
|
Bloomberg
Municipal Bond Index |
4.96
|
1.44
|
2.43
|
|
Bloomberg
Municipal Bond California Exempt Index |
4.98
|
1.45
|
2.37
|
For current month-end performance,
please call Franklin Templeton at (800)
DIAL BEN/342-5236 or visit
https://www.franklintempleton.com/investments/options/mutual-funds.
https://www.franklintempleton.com/investments/options/mutual-funds.
Important data provider notices
and terms available at www.franklintempletondatasources.com.
KEY
FUND STATISTICS (as
of February 28, 2026)
|
Total
Net Assets |
$13,284,092,002
|
|
Total
Number of Portfolio Holdings |
1,111
|
|
Total
Management Fee Paid |
$56,929,729
|
|
Portfolio
Turnover Rate |
11.93%
|
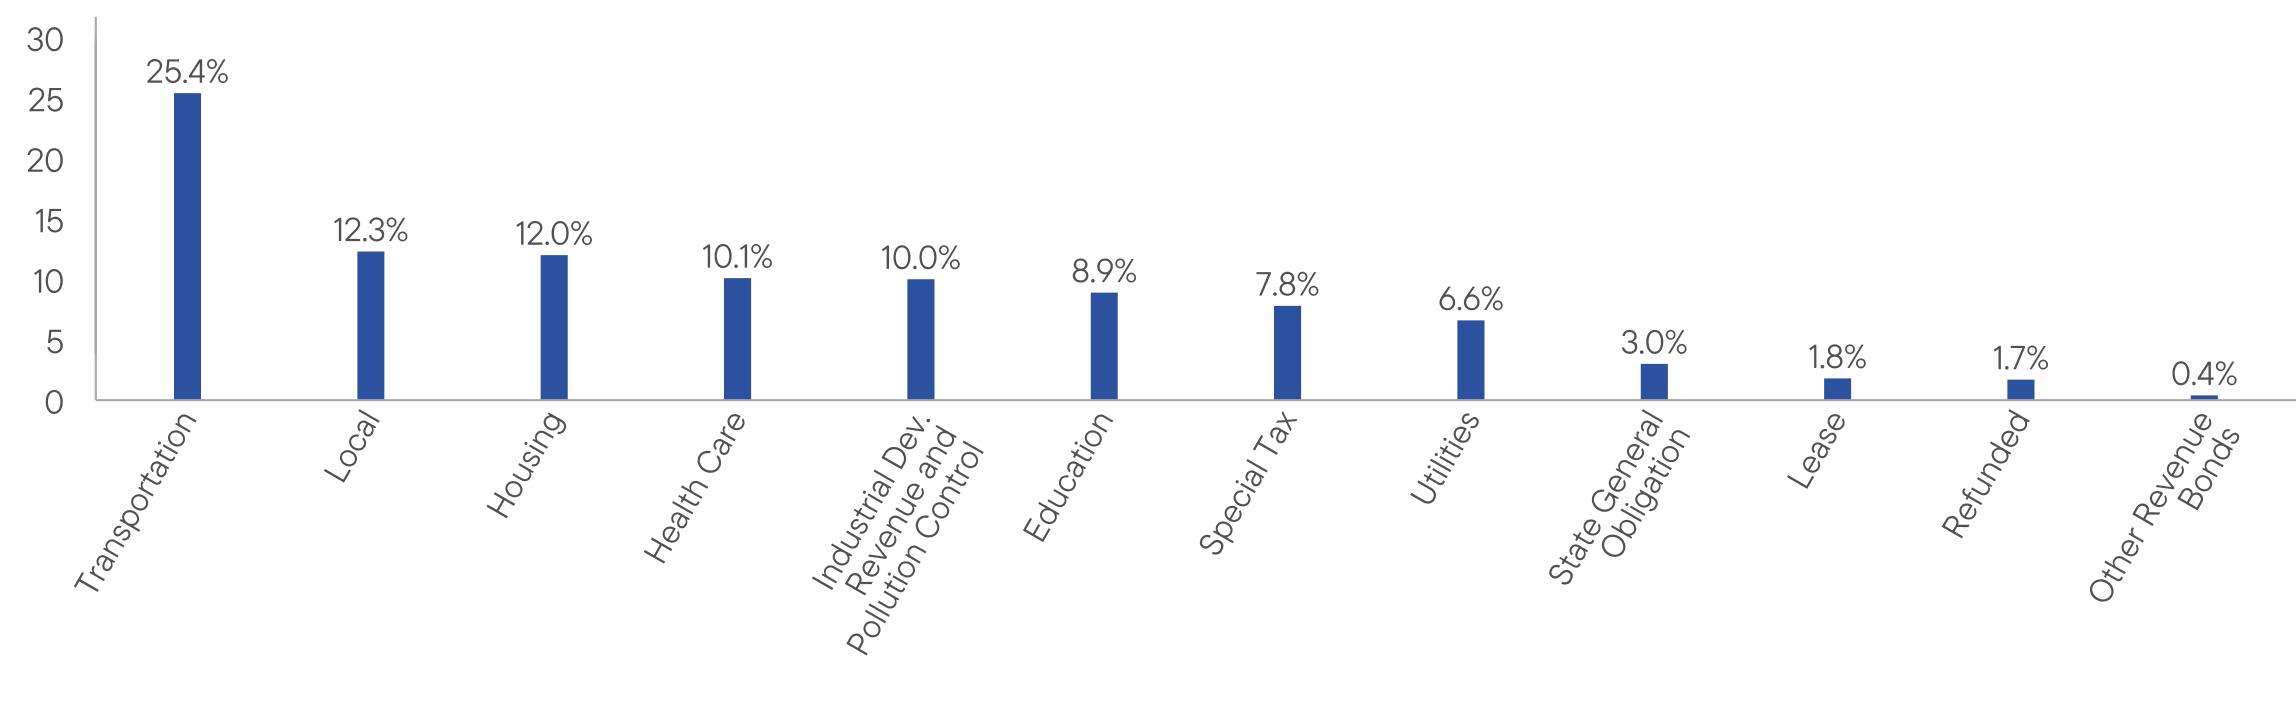
WHAT
DID THE FUND INVEST IN? (as
of February 28, 2026)
Portfolio Composition*
(% of Total Investments)

WHAT
WERE THE FUND COSTS FOR THE LAST YEAR? (based
on a hypothetical $10,000 investment)
|
Class
Name |
Costs
of a $10,000 investment
|
Costs
paid as a percentage of a $10,000
investment |
|
Class
A1 |
$62
|
0.61%
|
HOW
DID THE FUND PERFORM LAST YEAR AND WHAT AFFECTED ITS PERFORMANCE?
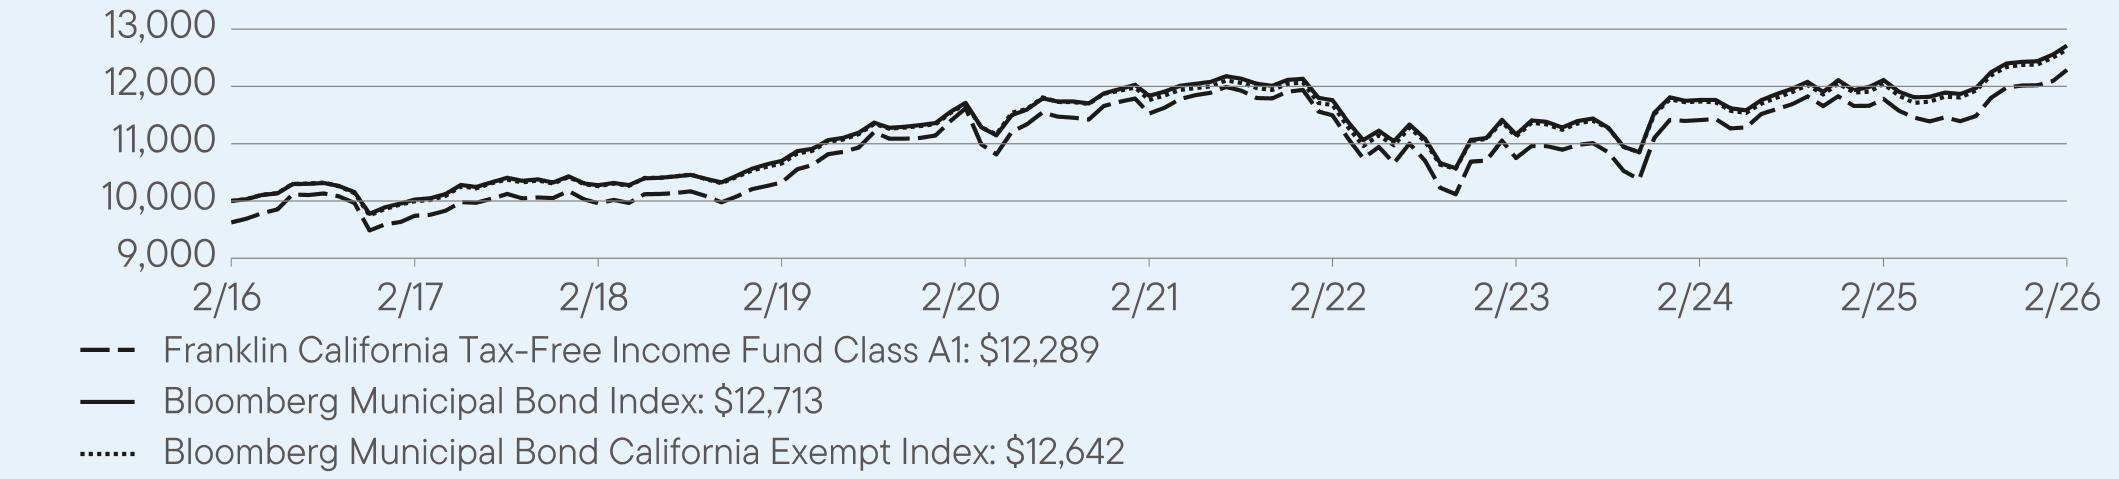
For the twelve months ended February
28, 2026, Class A1 shares of
Franklin California Tax-Free Income Fund returned 4.32%.
The Fund compares its performance
to the Bloomberg Municipal Bond California Exempt Index, which returned 4.98% for the same period.
PERFORMANCE
HIGHLIGHTS
|
Top
contributors to performance: | |
|
↑
|
Selection
in A rated bonds |
|
↑
|
Selection
in AA rated bonds |
|
↑
|
Overweight
to BBB rated bonds |
|
Top
detractors from performance: | |
|
↓
|
Underweight
bonds with five years or less to maturity |
|
↓
|
Overweight
bonds with 20 or more years to maturity |
|
↓
|
Selection
in BBB rated bonds |
AVERAGE
ANNUAL TOTAL RETURNS (%) Period
Ended February 28, 2026
|
|
1
Year |
5
Year |
10
Year |
|
Class
A1 |
4.32
|
1.29
|
2.48
|
|
Class
A1 (with sales charge) |
0.36
|
0.51
|
2.09
|
|
Bloomberg
Municipal Bond Index |
4.96
|
1.44
|
2.43
|
|
Bloomberg
Municipal Bond California Exempt Index |
4.98
|
1.45
|
2.37
|
For current month-end performance,
please call Franklin Templeton at (800)
DIAL BEN/342-5236 or visit
https://www.franklintempleton.com/investments/options/mutual-funds.
https://www.franklintempleton.com/investments/options/mutual-funds.
Important data provider notices
and terms available at www.franklintempletondatasources.com.
KEY
FUND STATISTICS (as
of February 28, 2026)
|
Total
Net Assets |
$13,284,092,002
|
|
Total
Number of Portfolio Holdings |
1,111
|
|
Total
Management Fee Paid |
$56,929,729
|
|
Portfolio
Turnover Rate |
11.93%
|
WHAT
DID THE FUND INVEST IN? (as
of February 28, 2026)
Portfolio Composition*
(% of Total Investments)
WHAT
WERE THE FUND COSTS FOR THE LAST YEAR? (based
on a hypothetical $10,000 investment)
|
Class
Name |
Costs
of a $10,000 investment
|
Costs
paid as a percentage of a $10,000
investment |
|
Class
C |
$119
|
1.17%
|
HOW
DID THE FUND PERFORM LAST YEAR AND WHAT AFFECTED ITS PERFORMANCE?
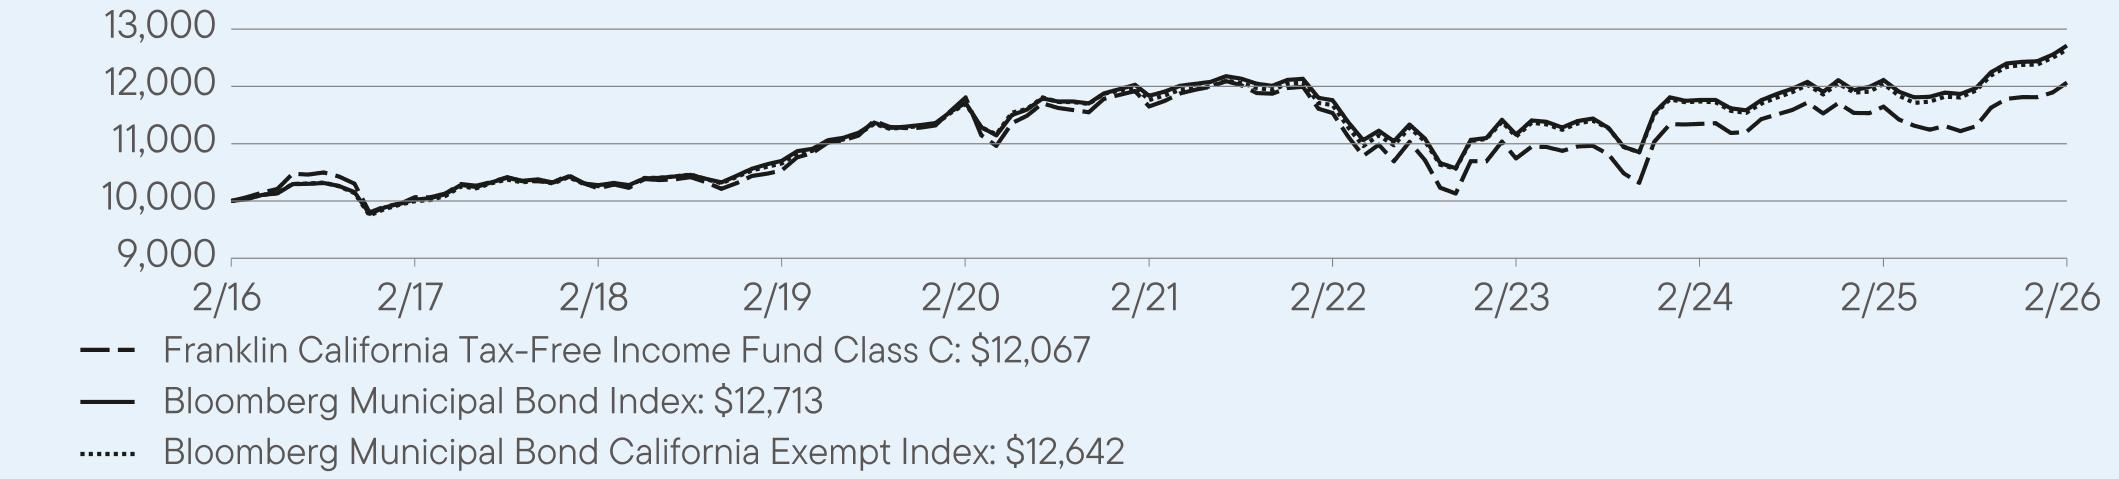
For the twelve months ended February
28, 2026, Class C shares of
Franklin California Tax-Free Income Fund returned 3.61%.
The Fund compares its performance
to the Bloomberg Municipal Bond California Exempt Index, which returned 4.98% for the same period.
PERFORMANCE
HIGHLIGHTS
|
Top
contributors to performance: | |
|
↑
|
Selection
in A rated bonds |
|
↑
|
Selection
in AA rated bonds |
|
↑
|
Overweight
to BBB rated bonds |
|
Top
detractors from performance: | |
|
↓
|
Underweight
bonds with five years or less to maturity |
|
↓
|
Overweight
bonds with 20 or more years to maturity |
|
↓
|
Selection
in BBB rated bonds |
AVERAGE
ANNUAL TOTAL RETURNS (%) Period
Ended February 28, 2026
|
|
1
Year |
5
Year |
10
Year |
|
Class
C |
3.61
|
0.71
|
1.90
|
|
Class
C (with sales charge) |
2.61
|
0.71
|
1.90
|
|
Bloomberg
Municipal Bond Index |
4.96
|
1.44
|
2.43
|
|
Bloomberg
Municipal Bond California Exempt Index |
4.98
|
1.45
|
2.37
|
For current month-end performance,
please call Franklin Templeton at (800)
DIAL BEN/342-5236 or visit
https://www.franklintempleton.com/investments/options/mutual-funds.
https://www.franklintempleton.com/investments/options/mutual-funds.
Important data provider notices
and terms available at www.franklintempletondatasources.com.
KEY
FUND STATISTICS (as
of February 28, 2026)
|
Total
Net Assets |
$13,284,092,002
|
|
Total
Number of Portfolio Holdings |
1,111
|
|
Total
Management Fee Paid |
$56,929,729
|
|
Portfolio
Turnover Rate |
11.93%
|
WHAT
DID THE FUND INVEST IN? (as
of February 28, 2026)
Portfolio Composition*
(% of Total Investments)

WHAT
WERE THE FUND COSTS FOR THE LAST YEAR? (based
on a hypothetical $10,000 investment)
|
Class
Name |
Costs
of a $10,000 investment
|
Costs
paid as a percentage of a $10,000
investment |
|
Class
R6 |
$49
|
0.48%
|
HOW
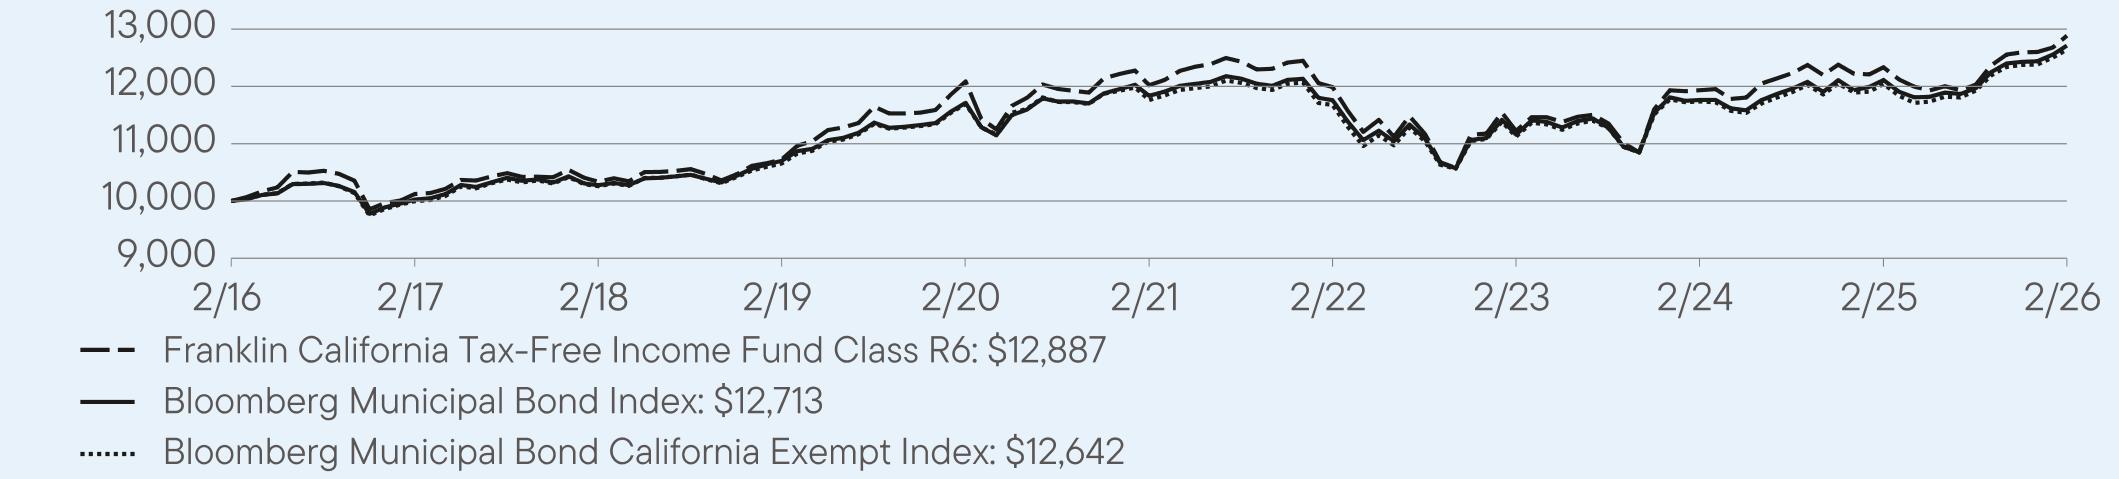
DID THE FUND PERFORM LAST YEAR AND WHAT AFFECTED ITS PERFORMANCE?
For the twelve months ended February
28, 2026, Class R6 shares of
Franklin California Tax-Free Income Fund returned 4.47%.
The Fund compares its performance
to the Bloomberg Municipal Bond California Exempt Index, which returned 4.98% for the same period.
PERFORMANCE
HIGHLIGHTS
|
Top
contributors to performance: | |
|
↑
|
Selection
in A rated bonds |
|
↑
|
Selection
in AA rated bonds |
|
↑
|
Overweight
to BBB rated bonds |
|
Top
detractors from performance: | |
|
↓
|
Underweight
bonds with five years or less to maturity |
|
↓
|
Overweight
bonds with 20 or more years to maturity |
|
↓
|
Selection
in BBB rated bonds |
AVERAGE
ANNUAL TOTAL RETURNS (%) Period
Ended February 28, 2026
|
|
1
Year |
5
Year |
10
Year |
|
Class
R6 |
4.47
|
1.40
|
2.57
|
|
Bloomberg
Municipal Bond Index |
4.96
|
1.44
|
2.43
|
|
Bloomberg
Municipal Bond California Exempt Index |
4.98
|
1.45
|
2.37
|
For current month-end performance,
please call Franklin Templeton at (800)
DIAL BEN/342-5236 or visit
https://www.franklintempleton.com/investments/options/mutual-funds.
https://www.franklintempleton.com/investments/options/mutual-funds.
Important data provider notices
and terms available at www.franklintempletondatasources.com.
KEY
FUND STATISTICS (as
of February 28, 2026)
|
Total
Net Assets |
$13,284,092,002
|
|
Total
Number of Portfolio Holdings |
1,111
|
|
Total
Management Fee Paid |
$56,929,729
|
|
Portfolio
Turnover Rate |
11.93%
|
WHAT
DID THE FUND INVEST IN? (as
of February 28, 2026)
Portfolio Composition*
(% of Total Investments)

WHAT
WERE THE FUND COSTS FOR THE LAST YEAR? (based
on a hypothetical $10,000 investment)
|
Class
Name |
Costs
of a $10,000 investment
|
Costs
paid as a percentage of a $10,000
investment |
|
Advisor
Class |
$53
|
0.52%
|
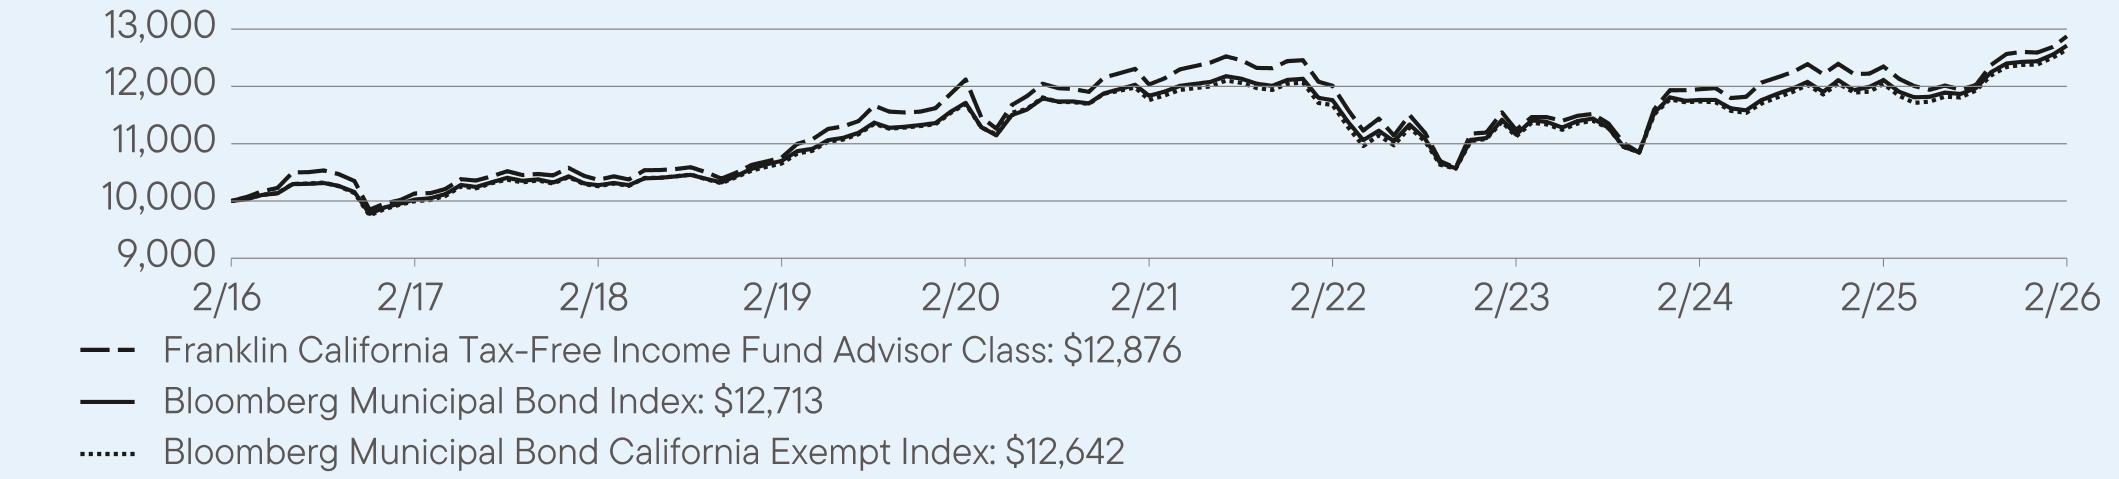
HOW
DID THE FUND PERFORM LAST YEAR AND WHAT AFFECTED ITS PERFORMANCE?
For the twelve months ended February
28, 2026, Advisor Class shares
of Franklin California Tax-Free Income Fund returned 4.28%.
The Fund compares its performance
to the Bloomberg Municipal Bond California Exempt Index, which returned 4.98% for the same period.
PERFORMANCE
HIGHLIGHTS
|
Top
contributors to performance: | |
|
↑
|
Selection
in A rated bonds |
|
↑
|
Selection
in AA rated bonds |
|
↑
|
Overweight
to BBB rated bonds |
|
Top
detractors from performance: | |
|
↓
|
Underweight
bonds with five years or less to maturity |
|
↓
|
Overweight
bonds with 20 or more years to maturity |
|
↓
|
Selection
in BBB rated bonds |
AVERAGE
ANNUAL TOTAL RETURNS (%) Period
Ended February 28, 2026
|
|
1
Year |
5
Year |
10
Year |
|
Advisor
Class |
4.28
|
1.36
|
2.56
|
|
Bloomberg
Municipal Bond Index |
4.96
|
1.44
|
2.43
|
|
Bloomberg
Municipal Bond California Exempt Index |
4.98
|
1.45
|
2.37
|
For current month-end performance,
please call Franklin Templeton at (800)
DIAL BEN/342-5236 or visit
https://www.franklintempleton.com/investments/options/mutual-funds.
https://www.franklintempleton.com/investments/options/mutual-funds.
Important data provider notices
and terms available at www.franklintempletondatasources.com.
KEY
FUND STATISTICS (as
of February 28, 2026)
|
Total
Net Assets |
$13,284,092,002
|
|
Total
Number of Portfolio Holdings |
1,111
|
|
Total
Management Fee Paid |
$56,929,729
|
|
Portfolio
Turnover Rate |
11.93%
|
WHAT
DID THE FUND INVEST IN? (as
of February 28, 2026)
Portfolio Composition*
(% of Total Investments)

| [1] |
|
||
| [2] |
|
||
| [3] |
|
||
| [4] |
|
||
| [5] |
|