false
0000225375
N-1A
0000225375
tsr:C000199722Member
2025-03-01
2026-02-28
0000225375
tsr:C000199722Member
oef:WithoutSalesLoadMember
2025-03-01
2026-02-28
0000225375
tsr:bench202511256810_6679Member
2025-03-01
2026-02-28
0000225375
tsr:benchmarkBM3072_6679Member
2025-03-01
2026-02-28
0000225375
tsr:C000199722Member
2026-02-28
0000225375
tsr:C000199722Member
tsr:bench202409274049_6679Member
2026-02-28
0000225375
tsr:C000199722Member
tsr:bench202409274053_6679Member
2026-02-28
0000225375
tsr:C000199722Member
tsr:bench202409274047_6679Member
2026-02-28
0000225375
tsr:C000199722Member
tsr:bench202409043993_6679Member
2026-02-28
0000225375
tsr:C000199722Member
tsr:bench202409274046_6679Member
2026-02-28
0000225375
tsr:C000199722Member
tsr:bench202409274048_6679Member
2026-02-28
0000225375
tsr:C000199722Member
tsr:bench202409274045_6679Member
2026-02-28
0000225375
tsr:C000199722Member
tsr:bench202409044002_6679Member
2026-02-28
0000225375
tsr:C000199722Member
tsr:bench202409274050_6679Member
2026-02-28
0000225375
tsr:C000199722Member
tsr:bench202409274052_6679Member
2026-02-28
0000225375
tsr:C000199722Member
tsr:bench202409274051_6679Member
2026-02-28
0000225375
tsr:C000199722Member
tsr:bench202409274054_6679Member
2026-02-28
0000225375
tsr:C000199722Member
oef:WithoutSalesLoadMember
2021-03-01
2026-02-28
0000225375
tsr:C000199722Member
2021-03-01
2026-02-28
0000225375
tsr:bench202511256810_6679Member
2021-03-01
2026-02-28
0000225375
tsr:benchmarkBM3072_6679Member
2021-03-01
2026-02-28
0000225375
tsr:C000199722Member
oef:WithoutSalesLoadMember
2016-02-29
2026-02-28
0000225375
tsr:C000199722Member
2016-02-29
2026-02-28
0000225375
tsr:bench202511256810_6679Member
2016-02-29
2026-02-28
0000225375
tsr:benchmarkBM3072_6679Member
2016-02-29
2026-02-28
0000225375
tsr:C000199722Member
2016-02-29
2016-02-29
0000225375
tsr:bench202511256810_6679Member
2016-02-29
2016-02-29
0000225375
tsr:benchmarkBM3072_6679Member
2016-02-29
2016-02-29
0000225375
tsr:C000199722Member
2017-02-28
2017-02-28
0000225375
tsr:bench202511256810_6679Member
2017-02-28
2017-02-28
0000225375
tsr:benchmarkBM3072_6679Member
2017-02-28
2017-02-28
0000225375
tsr:C000199722Member
2018-02-28
2018-02-28
0000225375
tsr:bench202511256810_6679Member
2018-02-28
2018-02-28
0000225375
tsr:benchmarkBM3072_6679Member
2018-02-28
2018-02-28
0000225375
tsr:C000199722Member
2019-02-28
2019-02-28
0000225375
tsr:bench202511256810_6679Member
2019-02-28
2019-02-28
0000225375
tsr:benchmarkBM3072_6679Member
2019-02-28
2019-02-28
0000225375
tsr:C000199722Member
2020-02-29
2020-02-29
0000225375
tsr:bench202511256810_6679Member
2020-02-29
2020-02-29
0000225375
tsr:benchmarkBM3072_6679Member
2020-02-29
2020-02-29
0000225375
tsr:C000199722Member
2021-02-28
2021-02-28
0000225375
tsr:bench202511256810_6679Member
2021-02-28
2021-02-28
0000225375
tsr:benchmarkBM3072_6679Member
2021-02-28
2021-02-28
0000225375
tsr:C000199722Member
2022-02-28
2022-02-28
0000225375
tsr:bench202511256810_6679Member
2022-02-28
2022-02-28
0000225375
tsr:benchmarkBM3072_6679Member
2022-02-28
2022-02-28
0000225375
tsr:C000199722Member
2023-02-28
2023-02-28
0000225375
tsr:bench202511256810_6679Member
2023-02-28
2023-02-28
0000225375
tsr:benchmarkBM3072_6679Member
2023-02-28
2023-02-28
0000225375
tsr:C000199722Member
2024-02-29
2024-02-29
0000225375
tsr:bench202511256810_6679Member
2024-02-29
2024-02-29
0000225375
tsr:benchmarkBM3072_6679Member
2024-02-29
2024-02-29
0000225375
tsr:C000199722Member
2025-02-28
2025-02-28
0000225375
tsr:bench202511256810_6679Member
2025-02-28
2025-02-28
0000225375
tsr:benchmarkBM3072_6679Member
2025-02-28
2025-02-28
0000225375
2025-03-01
2026-02-28
tsr:Years
iso4217:USD
xbrli:pure
xbrli:shares
iso4217:USD
xbrli:shares
0000225375
tsr:C000018181Member
2025-03-01
2026-02-28
0000225375
tsr:C000018181Member
oef:WithoutSalesLoadMember
2025-03-01
2026-02-28
0000225375
tsr:bench202511256810_6678Member
2025-03-01
2026-02-28
0000225375
tsr:benchmarkBM3072_6678Member
2025-03-01
2026-02-28
0000225375
tsr:C000018181Member
2026-02-28
0000225375
tsr:C000018181Member
tsr:bench202409274049_6678Member
2026-02-28
0000225375
tsr:C000018181Member
tsr:bench202409274053_6678Member
2026-02-28
0000225375
tsr:C000018181Member
tsr:bench202409274047_6678Member
2026-02-28
0000225375
tsr:C000018181Member
tsr:bench202409043993_6678Member
2026-02-28
0000225375
tsr:C000018181Member
tsr:bench202409274046_6678Member
2026-02-28
0000225375
tsr:C000018181Member
tsr:bench202409274048_6678Member
2026-02-28
0000225375
tsr:C000018181Member
tsr:bench202409274045_6678Member
2026-02-28
0000225375
tsr:C000018181Member
tsr:bench202409044002_6678Member
2026-02-28
0000225375
tsr:C000018181Member
tsr:bench202409274050_6678Member
2026-02-28
0000225375
tsr:C000018181Member
tsr:bench202409274052_6678Member
2026-02-28
0000225375
tsr:C000018181Member
tsr:bench202409274051_6678Member
2026-02-28
0000225375
tsr:C000018181Member
tsr:bench202409274054_6678Member
2026-02-28
0000225375
tsr:C000018181Member
oef:WithoutSalesLoadMember
2021-03-01
2026-02-28
0000225375
tsr:C000018181Member
2021-03-01
2026-02-28
0000225375
tsr:bench202511256810_6678Member
2021-03-01
2026-02-28
0000225375
tsr:benchmarkBM3072_6678Member
2021-03-01
2026-02-28
0000225375
tsr:C000018181Member
oef:WithoutSalesLoadMember
2016-02-29
2026-02-28
0000225375
tsr:C000018181Member
2016-02-29
2026-02-28
0000225375
tsr:bench202511256810_6678Member
2016-02-29
2026-02-28
0000225375
tsr:benchmarkBM3072_6678Member
2016-02-29
2026-02-28
0000225375
tsr:C000018181Member
2016-02-29
2016-02-29
0000225375
tsr:bench202511256810_6678Member
2016-02-29
2016-02-29
0000225375
tsr:benchmarkBM3072_6678Member
2016-02-29
2016-02-29
0000225375
tsr:C000018181Member
2017-02-28
2017-02-28
0000225375
tsr:bench202511256810_6678Member
2017-02-28
2017-02-28
0000225375
tsr:benchmarkBM3072_6678Member
2017-02-28
2017-02-28
0000225375
tsr:C000018181Member
2018-02-28
2018-02-28
0000225375
tsr:bench202511256810_6678Member
2018-02-28
2018-02-28
0000225375
tsr:benchmarkBM3072_6678Member
2018-02-28
2018-02-28
0000225375
tsr:C000018181Member
2019-02-28
2019-02-28
0000225375
tsr:bench202511256810_6678Member
2019-02-28
2019-02-28
0000225375
tsr:benchmarkBM3072_6678Member
2019-02-28
2019-02-28
0000225375
tsr:C000018181Member
2020-02-29
2020-02-29
0000225375
tsr:bench202511256810_6678Member
2020-02-29
2020-02-29
0000225375
tsr:benchmarkBM3072_6678Member
2020-02-29
2020-02-29
0000225375
tsr:C000018181Member
2021-02-28
2021-02-28
0000225375
tsr:bench202511256810_6678Member
2021-02-28
2021-02-28
0000225375
tsr:benchmarkBM3072_6678Member
2021-02-28
2021-02-28
0000225375
tsr:C000018181Member
2022-02-28
2022-02-28
0000225375
tsr:bench202511256810_6678Member
2022-02-28
2022-02-28
0000225375
tsr:benchmarkBM3072_6678Member
2022-02-28
2022-02-28
0000225375
tsr:C000018181Member
2023-02-28
2023-02-28
0000225375
tsr:bench202511256810_6678Member
2023-02-28
2023-02-28
0000225375
tsr:benchmarkBM3072_6678Member
2023-02-28
2023-02-28
0000225375
tsr:C000018181Member
2024-02-29
2024-02-29
0000225375
tsr:bench202511256810_6678Member
2024-02-29
2024-02-29
0000225375
tsr:benchmarkBM3072_6678Member
2024-02-29
2024-02-29
0000225375
tsr:C000018181Member
2025-02-28
2025-02-28
0000225375
tsr:bench202511256810_6678Member
2025-02-28
2025-02-28
0000225375
tsr:benchmarkBM3072_6678Member
2025-02-28
2025-02-28
0000225375
tsr:C000018183Member
2025-03-01
2026-02-28
0000225375
tsr:C000018183Member
oef:WithoutSalesLoadMember
2025-03-01
2026-02-28
0000225375
tsr:bench202511256810_6680Member
2025-03-01
2026-02-28
0000225375
tsr:benchmarkBM3072_6680Member
2025-03-01
2026-02-28
0000225375
tsr:C000018183Member
2026-02-28
0000225375
tsr:C000018183Member
tsr:bench202409274049_6680Member
2026-02-28
0000225375
tsr:C000018183Member
tsr:bench202409274053_6680Member
2026-02-28
0000225375
tsr:C000018183Member
tsr:bench202409274047_6680Member
2026-02-28
0000225375
tsr:C000018183Member
tsr:bench202409043993_6680Member
2026-02-28
0000225375
tsr:C000018183Member
tsr:bench202409274046_6680Member
2026-02-28
0000225375
tsr:C000018183Member
tsr:bench202409274048_6680Member
2026-02-28
0000225375
tsr:C000018183Member
tsr:bench202409274045_6680Member
2026-02-28
0000225375
tsr:C000018183Member
tsr:bench202409044002_6680Member
2026-02-28
0000225375
tsr:C000018183Member
tsr:bench202409274050_6680Member
2026-02-28
0000225375
tsr:C000018183Member
tsr:bench202409274052_6680Member
2026-02-28
0000225375
tsr:C000018183Member
tsr:bench202409274051_6680Member
2026-02-28
0000225375
tsr:C000018183Member
tsr:bench202409274054_6680Member
2026-02-28
0000225375
tsr:C000018183Member
oef:WithoutSalesLoadMember
2021-03-01
2026-02-28
0000225375
tsr:C000018183Member
2021-03-01
2026-02-28
0000225375
tsr:bench202511256810_6680Member
2021-03-01
2026-02-28
0000225375
tsr:benchmarkBM3072_6680Member
2021-03-01
2026-02-28
0000225375
tsr:C000018183Member
oef:WithoutSalesLoadMember
2016-02-29
2026-02-28
0000225375
tsr:C000018183Member
2016-02-29
2026-02-28
0000225375
tsr:bench202511256810_6680Member
2016-02-29
2026-02-28
0000225375
tsr:benchmarkBM3072_6680Member
2016-02-29
2026-02-28
0000225375
tsr:C000018183Member
2016-02-29
2016-02-29
0000225375
tsr:bench202511256810_6680Member
2016-02-29
2016-02-29
0000225375
tsr:benchmarkBM3072_6680Member
2016-02-29
2016-02-29
0000225375
tsr:C000018183Member
2017-02-28
2017-02-28
0000225375
tsr:bench202511256810_6680Member
2017-02-28
2017-02-28
0000225375
tsr:benchmarkBM3072_6680Member
2017-02-28
2017-02-28
0000225375
tsr:C000018183Member
2018-02-28
2018-02-28
0000225375
tsr:bench202511256810_6680Member
2018-02-28
2018-02-28
0000225375
tsr:benchmarkBM3072_6680Member
2018-02-28
2018-02-28
0000225375
tsr:C000018183Member
2019-02-28
2019-02-28
0000225375
tsr:bench202511256810_6680Member
2019-02-28
2019-02-28
0000225375
tsr:benchmarkBM3072_6680Member
2019-02-28
2019-02-28
0000225375
tsr:C000018183Member
2020-02-29
2020-02-29
0000225375
tsr:bench202511256810_6680Member
2020-02-29
2020-02-29
0000225375
tsr:benchmarkBM3072_6680Member
2020-02-29
2020-02-29
0000225375
tsr:C000018183Member
2021-02-28
2021-02-28
0000225375
tsr:bench202511256810_6680Member
2021-02-28
2021-02-28
0000225375
tsr:benchmarkBM3072_6680Member
2021-02-28
2021-02-28
0000225375
tsr:C000018183Member
2022-02-28
2022-02-28
0000225375
tsr:bench202511256810_6680Member
2022-02-28
2022-02-28
0000225375
tsr:benchmarkBM3072_6680Member
2022-02-28
2022-02-28
0000225375
tsr:C000018183Member
2023-02-28
2023-02-28
0000225375
tsr:bench202511256810_6680Member
2023-02-28
2023-02-28
0000225375
tsr:benchmarkBM3072_6680Member
2023-02-28
2023-02-28
0000225375
tsr:C000018183Member
2024-02-29
2024-02-29
0000225375
tsr:bench202511256810_6680Member
2024-02-29
2024-02-29
0000225375
tsr:benchmarkBM3072_6680Member
2024-02-29
2024-02-29
0000225375
tsr:C000018183Member
2025-02-28
2025-02-28
0000225375
tsr:bench202511256810_6680Member
2025-02-28
2025-02-28
0000225375
tsr:benchmarkBM3072_6680Member
2025-02-28
2025-02-28
0000225375
tsr:C000191685Member
2025-03-01
2026-02-28
0000225375
tsr:bench202411154454_6681Member
2025-03-01
2026-02-28
0000225375
tsr:benchmarkBM3072_6681Member
2025-03-01
2026-02-28
0000225375
tsr:C000191685Member
2026-02-28
0000225375
tsr:C000191685Member
tsr:bench202409274049_6681Member
2026-02-28
0000225375
tsr:C000191685Member
tsr:bench202409274053_6681Member
2026-02-28
0000225375
tsr:C000191685Member
tsr:bench202409274047_6681Member
2026-02-28
0000225375
tsr:C000191685Member
tsr:bench202409043993_6681Member
2026-02-28
0000225375
tsr:C000191685Member
tsr:bench202409274046_6681Member
2026-02-28
0000225375
tsr:C000191685Member
tsr:bench202409274048_6681Member
2026-02-28
0000225375
tsr:C000191685Member
tsr:bench202409274045_6681Member
2026-02-28
0000225375
tsr:C000191685Member
tsr:bench202409044002_6681Member
2026-02-28
0000225375
tsr:C000191685Member
tsr:bench202409274050_6681Member
2026-02-28
0000225375
tsr:C000191685Member
tsr:bench202409274052_6681Member
2026-02-28
0000225375
tsr:C000191685Member
tsr:bench202409274051_6681Member
2026-02-28
0000225375
tsr:C000191685Member
tsr:bench202409274054_6681Member
2026-02-28
0000225375
tsr:C000191685Member
2021-03-01
2026-02-28
0000225375
tsr:bench202411154454_6681Member
2021-03-01
2026-02-28
0000225375
tsr:benchmarkBM3072_6681Member
2021-03-01
2026-02-28
0000225375
tsr:C000191685Member
2016-02-29
2026-02-28
0000225375
tsr:bench202411154454_6681Member
2016-02-29
2026-02-28
0000225375
tsr:benchmarkBM3072_6681Member
2016-02-29
2026-02-28
0000225375
tsr:C000191685Member
2016-02-29
2016-02-29
0000225375
tsr:bench202411154454_6681Member
2016-02-29
2016-02-29
0000225375
tsr:benchmarkBM3072_6681Member
2016-02-29
2016-02-29
0000225375
tsr:C000191685Member
2017-02-28
2017-02-28
0000225375
tsr:bench202411154454_6681Member
2017-02-28
2017-02-28
0000225375
tsr:benchmarkBM3072_6681Member
2017-02-28
2017-02-28
0000225375
tsr:C000191685Member
2018-02-28
2018-02-28
0000225375
tsr:bench202411154454_6681Member
2018-02-28
2018-02-28
0000225375
tsr:benchmarkBM3072_6681Member
2018-02-28
2018-02-28
0000225375
tsr:C000191685Member
2019-02-28
2019-02-28
0000225375
tsr:bench202411154454_6681Member
2019-02-28
2019-02-28
0000225375
tsr:benchmarkBM3072_6681Member
2019-02-28
2019-02-28
0000225375
tsr:C000191685Member
2020-02-29
2020-02-29
0000225375
tsr:bench202411154454_6681Member
2020-02-29
2020-02-29
0000225375
tsr:benchmarkBM3072_6681Member
2020-02-29
2020-02-29
0000225375
tsr:C000191685Member
2021-02-28
2021-02-28
0000225375
tsr:bench202411154454_6681Member
2021-02-28
2021-02-28
0000225375
tsr:benchmarkBM3072_6681Member
2021-02-28
2021-02-28
0000225375
tsr:C000191685Member
2022-02-28
2022-02-28
0000225375
tsr:bench202411154454_6681Member
2022-02-28
2022-02-28
0000225375
tsr:benchmarkBM3072_6681Member
2022-02-28
2022-02-28
0000225375
tsr:C000191685Member
2023-02-28
2023-02-28
0000225375
tsr:bench202411154454_6681Member
2023-02-28
2023-02-28
0000225375
tsr:benchmarkBM3072_6681Member
2023-02-28
2023-02-28
0000225375
tsr:C000191685Member
2024-02-29
2024-02-29
0000225375
tsr:bench202411154454_6681Member
2024-02-29
2024-02-29
0000225375
tsr:benchmarkBM3072_6681Member
2024-02-29
2024-02-29
0000225375
tsr:C000191685Member
2025-02-28
2025-02-28
0000225375
tsr:bench202411154454_6681Member
2025-02-28
2025-02-28
0000225375
tsr:benchmarkBM3072_6681Member
2025-02-28
2025-02-28
0000225375
tsr:C000018184Member
2025-03-01
2026-02-28
0000225375
tsr:bench202511256810_6677Member
2025-03-01
2026-02-28
0000225375
tsr:benchmarkBM3072_6677Member
2025-03-01
2026-02-28
0000225375
tsr:C000018184Member
2026-02-28
0000225375
tsr:C000018184Member
tsr:bench202409274049_6677Member
2026-02-28
0000225375
tsr:C000018184Member
tsr:bench202409274053_6677Member
2026-02-28
0000225375
tsr:C000018184Member
tsr:bench202409274047_6677Member
2026-02-28
0000225375
tsr:C000018184Member
tsr:bench202409043993_6677Member
2026-02-28
0000225375
tsr:C000018184Member
tsr:bench202409274046_6677Member
2026-02-28
0000225375
tsr:C000018184Member
tsr:bench202409274048_6677Member
2026-02-28
0000225375
tsr:C000018184Member
tsr:bench202409274045_6677Member
2026-02-28
0000225375
tsr:C000018184Member
tsr:bench202409044002_6677Member
2026-02-28
0000225375
tsr:C000018184Member
tsr:bench202409274050_6677Member
2026-02-28
0000225375
tsr:C000018184Member
tsr:bench202409274052_6677Member
2026-02-28
0000225375
tsr:C000018184Member
tsr:bench202409274051_6677Member
2026-02-28
0000225375
tsr:C000018184Member
tsr:bench202409274054_6677Member
2026-02-28
0000225375
tsr:C000018184Member
2021-03-01
2026-02-28
0000225375
tsr:bench202511256810_6677Member
2021-03-01
2026-02-28
0000225375
tsr:benchmarkBM3072_6677Member
2021-03-01
2026-02-28
0000225375
tsr:C000018184Member
2016-02-29
2026-02-28
0000225375
tsr:bench202511256810_6677Member
2016-02-29
2026-02-28
0000225375
tsr:benchmarkBM3072_6677Member
2016-02-29
2026-02-28
0000225375
tsr:C000018184Member
2016-02-29
2016-02-29
0000225375
tsr:bench202511256810_6677Member
2016-02-29
2016-02-29
0000225375
tsr:benchmarkBM3072_6677Member
2016-02-29
2016-02-29
0000225375
tsr:C000018184Member
2017-02-28
2017-02-28
0000225375
tsr:bench202511256810_6677Member
2017-02-28
2017-02-28
0000225375
tsr:benchmarkBM3072_6677Member
2017-02-28
2017-02-28
0000225375
tsr:C000018184Member
2018-02-28
2018-02-28
0000225375
tsr:bench202511256810_6677Member
2018-02-28
2018-02-28
0000225375
tsr:benchmarkBM3072_6677Member
2018-02-28
2018-02-28
0000225375
tsr:C000018184Member
2019-02-28
2019-02-28
0000225375
tsr:bench202511256810_6677Member
2019-02-28
2019-02-28
0000225375
tsr:benchmarkBM3072_6677Member
2019-02-28
2019-02-28
0000225375
tsr:C000018184Member
2020-02-29
2020-02-29
0000225375
tsr:bench202511256810_6677Member
2020-02-29
2020-02-29
0000225375
tsr:benchmarkBM3072_6677Member
2020-02-29
2020-02-29
0000225375
tsr:C000018184Member
2021-02-28
2021-02-28
0000225375
tsr:bench202511256810_6677Member
2021-02-28
2021-02-28
0000225375
tsr:benchmarkBM3072_6677Member
2021-02-28
2021-02-28
0000225375
tsr:C000018184Member
2022-02-28
2022-02-28
0000225375
tsr:bench202511256810_6677Member
2022-02-28
2022-02-28
0000225375
tsr:benchmarkBM3072_6677Member
2022-02-28
2022-02-28
0000225375
tsr:C000018184Member
2023-02-28
2023-02-28
0000225375
tsr:bench202511256810_6677Member
2023-02-28
2023-02-28
0000225375
tsr:benchmarkBM3072_6677Member
2023-02-28
2023-02-28
0000225375
tsr:C000018184Member
2024-02-29
2024-02-29
0000225375
tsr:bench202511256810_6677Member
2024-02-29
2024-02-29
0000225375
tsr:benchmarkBM3072_6677Member
2024-02-29
2024-02-29
0000225375
tsr:C000018184Member
2025-02-28
2025-02-28
0000225375
tsr:bench202511256810_6677Member
2025-02-28
2025-02-28
0000225375
tsr:benchmarkBM3072_6677Member
2025-02-28
2025-02-28
0000225375
tsr:C000018184Member
2026-02-28
2026-02-28
0000225375
tsr:bench202511256810_6677Member
2026-02-28
2026-02-28
0000225375
tsr:benchmarkBM3072_6677Member
2026-02-28
2026-02-28
UNITED STATES
SECURITIES AND EXCHANGE COMMISSION
Washington, D.C. 20549
FORM N-CSR
CERTIFIED SHAREHOLDER REPORT OF REGISTERED
MANAGEMENT INVESTMENT COMPANIES
Investment Company Act file number 811-02790
Franklin
California Tax-Free Income Fund
(Exact name of registrant as specified in charter)
One Franklin Parkway, San Mateo, CA 94403-1906
(Address of principal executive offices) (Zip code)
Alison Baur
Franklin Templeton
One Franklin Parkway
San Mateo, CA 94403-1906
(Name and address of agent for service)
Registrant’s telephone number, including area
code: (650) 312-2000
Date of fiscal year end: February 28
Date of reporting period: February
28, 2026
| ITEM 1. |
REPORT TO STOCKHOLDERS |
(a) The Report to Shareholders is filed herewith
|
|
|
|
Franklin
California Tax-Free Income Fund |
|
|
Class
A [FTFQX]
|
|
Annual
Shareholder Report | February
28, 2026 |
|
|
This
annual
shareholder report
contains important information about Franklin
California Tax-Free Income Fund for the period March
1, 2025, to February
28, 2026.
You
can find additional information about the Fund at https://www.franklintempleton.com/regulatory-fund-documents.
You can also request this information
by contacting us at (800)
DIAL BEN/342-5236.
|
|
|
|
Class
Name |
Costs
of a $10,000 investment
|
Costs
paid as a percentage of a $10,000
investment |
|
Class
A |
$79
|
%
|
HOW
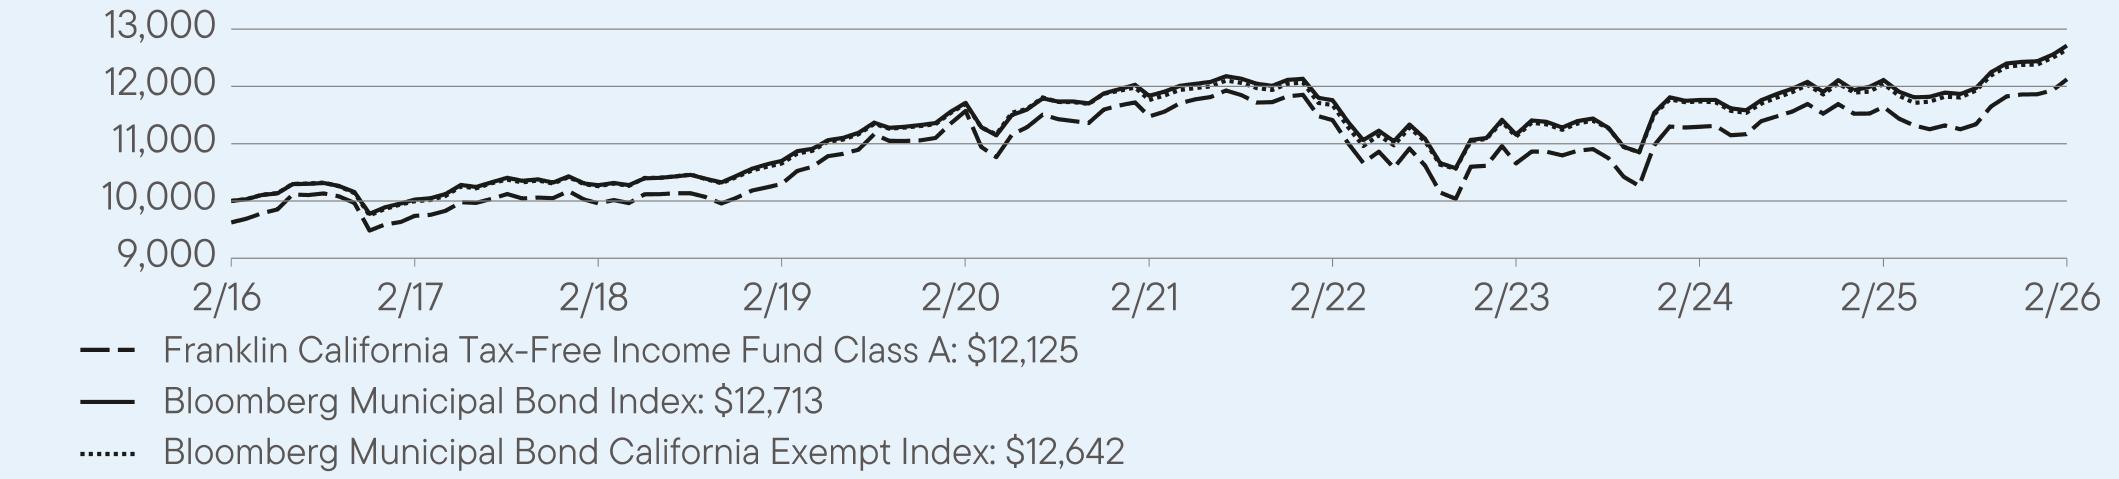
DID THE FUND PERFORM LAST YEAR AND WHAT AFFECTED ITS PERFORMANCE?
For the twelve months ended February
28, 2026, Class A shares of
Franklin California Tax-Free Income Fund returned 4.15%.
The Fund compares its performance
to the Bloomberg Municipal Bond California Exempt Index, which returned 4.98% for the same period.
|
|
|
Top
contributors to performance: |
|
↑
|
Selection
in A rated bonds |
|
↑
|
Selection
in AA rated bonds |
|
↑
|
Overweight
to BBB rated bonds |
|
|
|
Top
detractors from performance: |
|
↓
|
Underweight
bonds with five years or less to maturity |
|
↓
|
Overweight
bonds with 20 or more years to maturity |
|
↓
|
Selection
in BBB rated bonds |
| Franklin
California Tax-Free Income Fund |
PAGE
1 |
1112-ATSR-0426 |
HOW
DID THE FUND PERFORM OVER THE LAST 10 YEARS?
The
Fund’s past performance is not necessarily an indication of how the Fund will perform in the future. The
graph and table do not reflect
the deduction of taxes that a shareholder would pay on Fund distributions or redemption of Fund shares.
VALUE
OF A $10,000
INVESTMENT ($9,625
AFTER MAXIMUM APPLICABLE SALES CHARGE) –
Class
A 2/29/2016 —
2/28/2026
AVERAGE
ANNUAL TOTAL RETURNS (%) Period
Ended February 28, 2026
|
|
|
|
|
|
1
Year |
5
Year |
10
Year |
|
Class
A |
4.15
|
1.11
|
2.37
|
|
Class
A (with sales charge) |
0.25
|
0.34
|
1.98
|
|
Bloomberg
Municipal Bond Index |
4.96
|
1.44
|
2.43
|
|
Bloomberg
Municipal Bond California Exempt Index |
4.98
|
1.45
|
2.37
|
Fund
performance figures may reflect fee waivers and/or expense reimbursements, without which the performance would have been lower.
The
Fund began offering Class A shares on 9/10/2018. Returns for periods before 9/10/2018, are based on the Fund’s Class A1 performance,
which has been adjusted to take into account differences in class-specific operating expenses and maximum sales charges.
For periods after the share class offering, performance for the specific share class is used, reflecting the applicable expenses and
maximum sales charges.
Performance
for periods prior to March 1, 2019, has been restated to reflect the current maximum sales charge, which is lower than the maximum
sales charge prior to that date.
For current month-end performance,
please call Franklin Templeton at (800)
DIAL BEN/342-5236 or visit
https://www.franklintempleton.com/investments/options/mutual-funds.
Important data provider notices
and terms available at www.franklintempletondatasources.com.
KEY
FUND STATISTICS (as
of February 28, 2026)
|
|
|
Total
Net Assets |
$13,284,092,002
|
|
Total
Number of Portfolio Holdings |
1,111
|
|
Total
Management Fee Paid |
$56,929,729
|
|
Portfolio
Turnover Rate |
11.93%
|
| Franklin
California Tax-Free Income Fund |
PAGE
2 |
1112-ATSR-0426 |
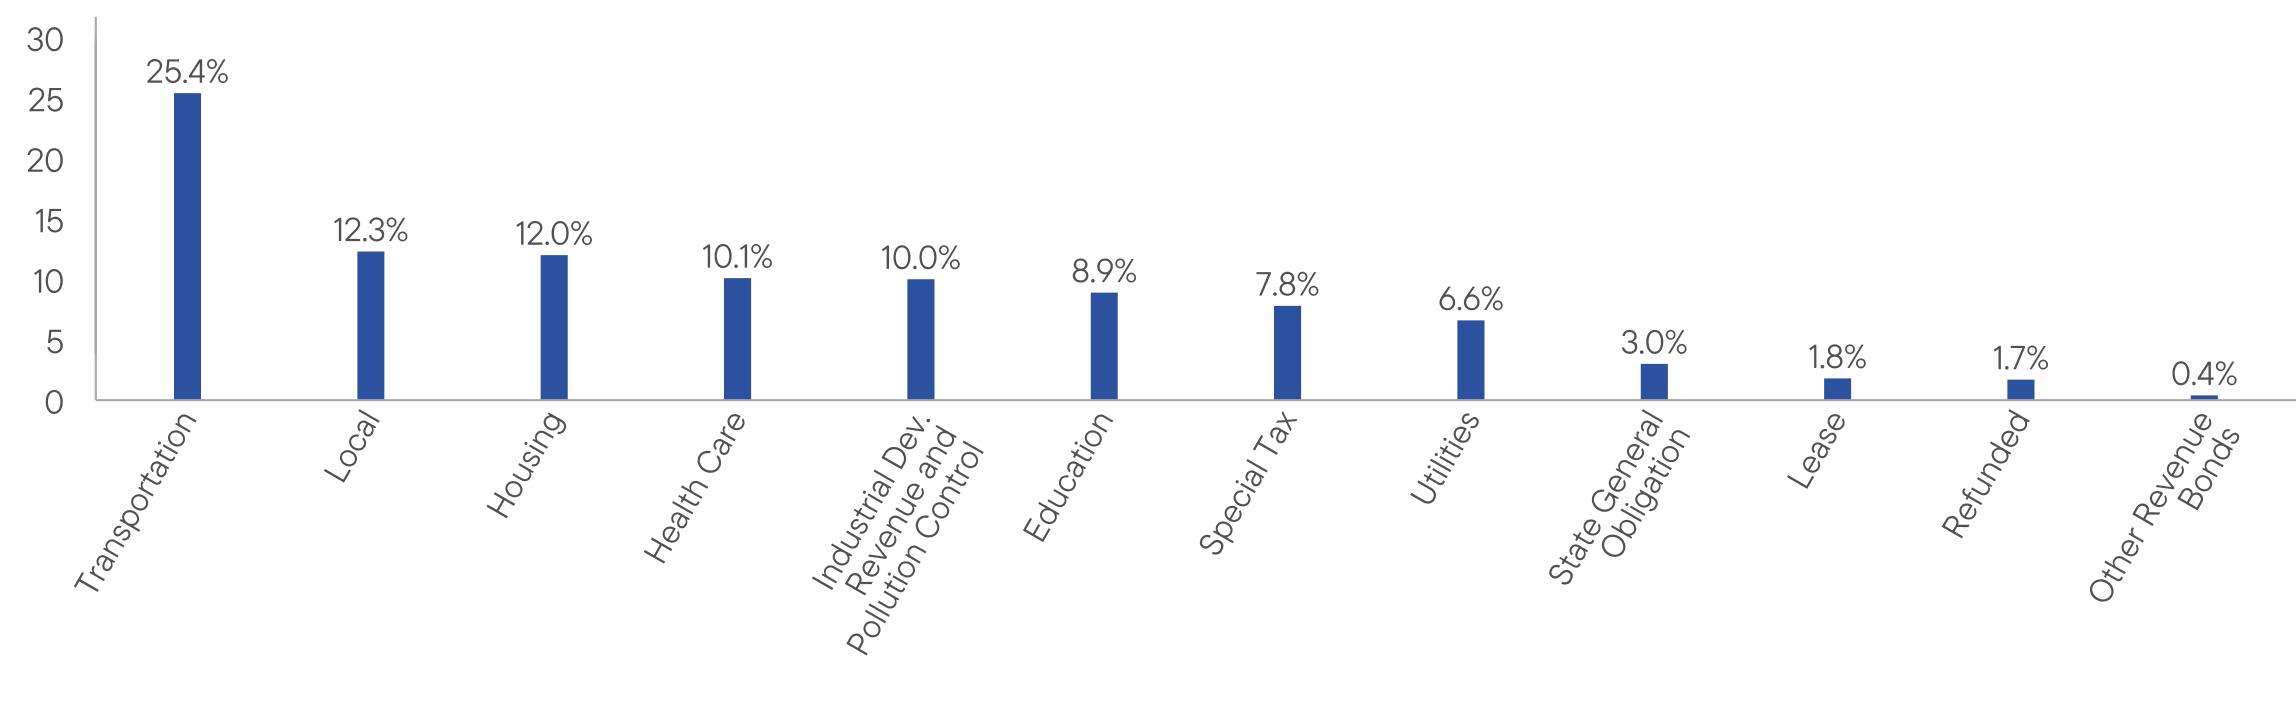
Portfolio Composition*
(% of Total Investments)
| * |
Does
not include derivatives, except purchased options, if any. |
|
|
|
|
WHERE
CAN I FIND ADDITIONAL INFORMATION ABOUT THE FUND? |
|
Additional
information is available on https://www.franklintempleton.com/regulatory-fund-documents,
including its: |
|
•
prospectus • proxy voting information • financial information • holdings • tax information |
HOUSEHOLDING
You
will receive the Fund’s shareholder reports every six months. In addition, you will receive an annual updated summary prospectus
(detail prospectus available
upon request). To reduce Fund expenses, we try to identify related shareholders in a household and send only
one copy of the shareholder reports and summary prospectus. This process, called “householding,” will continue indefinitely
unless you instruct us otherwise.
If you prefer not to have these documents householded, please call us at (800)
DIAL BEN/342-5236. At any time,
you may view current prospectuses/summary prospectuses and shareholder reports on our website. If you choose, you may
receive these documents through electronic delivery.
| Franklin
California Tax-Free Income Fund |
PAGE
3 |
1112-ATSR-0426 |
9625974199591029811571114761141110655112961164212125100001002510276107001171311837117591115911764121121271310000999710259106541169311763116761112411738120421264225.412.312.010.110.08.97.86.63.01.81.70.4
|
|
|
|
Franklin
California Tax-Free Income Fund |
|
|
Class
A1 [FKTFX]
|
|
Annual
Shareholder Report | February
28, 2026 |
|
|
This
annual
shareholder report
contains important information about Franklin
California Tax-Free Income Fund for the period March
1, 2025, to February
28, 2026.
You
can find additional information about the Fund at https://www.franklintempleton.com/regulatory-fund-documents.
You can also request this information
by contacting us at (800)
DIAL BEN/342-5236.
|
|
|
|
Class
Name |
Costs
of a $10,000 investment
|
Costs
paid as a percentage of a $10,000
investment |
|
Class
A1 |
$62
|
%
|
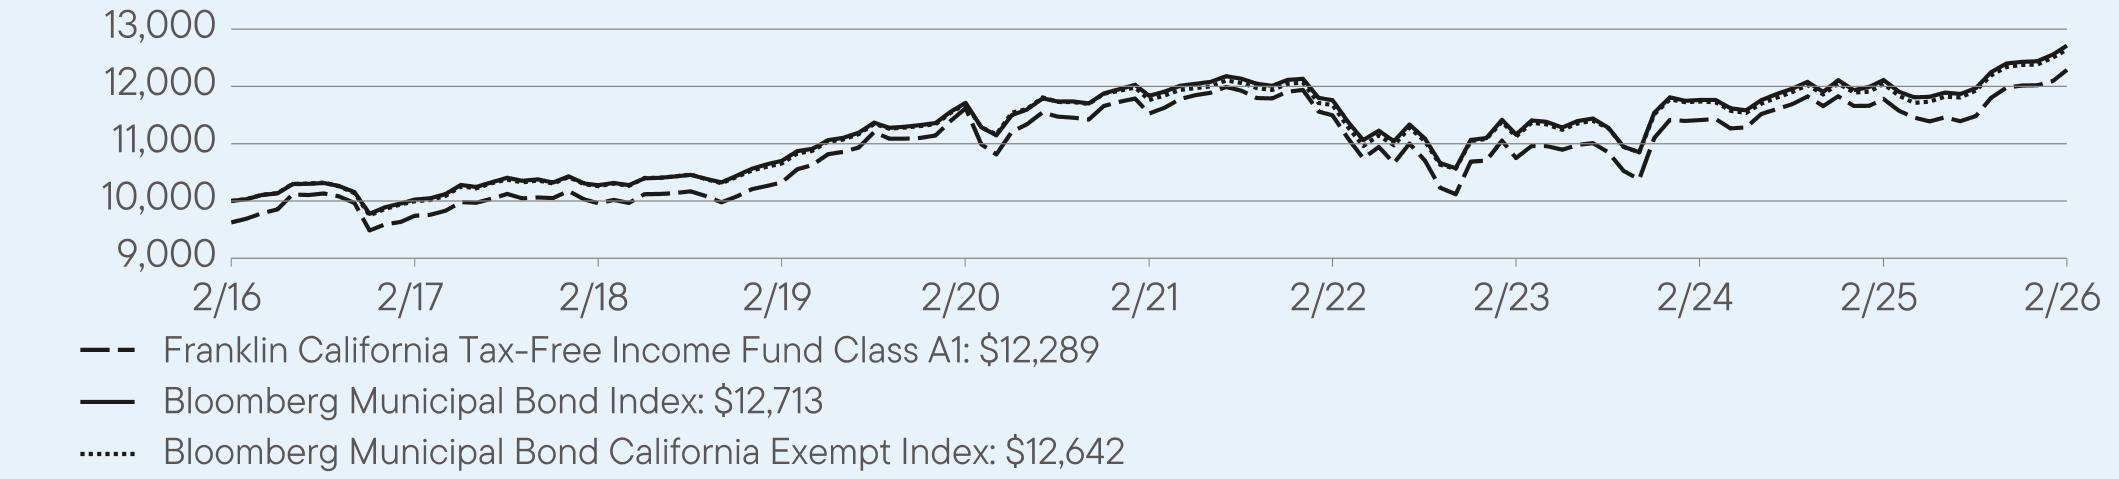
HOW
DID THE FUND PERFORM LAST YEAR AND WHAT AFFECTED ITS PERFORMANCE?
For the twelve months ended February
28, 2026, Class A1 shares of
Franklin California Tax-Free Income Fund returned 4.32%.
The Fund compares its performance
to the Bloomberg Municipal Bond California Exempt Index, which returned 4.98% for the same period.
|
|
|
Top
contributors to performance: |
|
↑
|
Selection
in A rated bonds |
|
↑
|
Selection
in AA rated bonds |
|
↑
|
Overweight
to BBB rated bonds |
|
|
|
Top
detractors from performance: |
|
↓
|
Underweight
bonds with five years or less to maturity |
|
↓
|
Overweight
bonds with 20 or more years to maturity |
|
↓
|
Selection
in BBB rated bonds |
| Franklin
California Tax-Free Income Fund |
PAGE
1 |
112-ATSR-0426 |
HOW
DID THE FUND PERFORM OVER THE LAST 10 YEARS?
The
Fund’s past performance is not necessarily an indication of how the Fund will perform in the future. The
graph and table do not reflect
the deduction of taxes that a shareholder would pay on Fund distributions or redemption of Fund shares.
VALUE
OF A $10,000
INVESTMENT ($9,625
AFTER MAXIMUM APPLICABLE SALES CHARGE) –
Class
A1 2/29/2016 —
2/28/2026
AVERAGE
ANNUAL TOTAL RETURNS (%) Period
Ended February 28, 2026
|
|
|
|
|
|
1
Year |
5
Year |
10
Year |
|
Class
A1 |
4.32
|
1.29
|
2.48
|
|
Class
A1 (with sales charge) |
0.36
|
0.51
|
2.09
|
|
Bloomberg
Municipal Bond Index |
4.96
|
1.44
|
2.43
|
|
Bloomberg
Municipal Bond California Exempt Index |
4.98
|
1.45
|
2.37
|
Fund
performance figures may reflect fee waivers and/or expense reimbursements, without which the performance would have been lower.
Effective
9/10/18, Class A shares closed to new investors, were renamed Class A1 shares, and a new Class A share with a different expense
structure became available.
Performance
for periods prior to March 1, 2019, has been restated to reflect the current maximum sales charge, which is lower than the maximum
sales charge prior to that date.
For current month-end performance,
please call Franklin Templeton at (800)
DIAL BEN/342-5236 or visit
https://www.franklintempleton.com/investments/options/mutual-funds.
Important data provider notices
and terms available at www.franklintempletondatasources.com.
KEY
FUND STATISTICS (as
of February 28, 2026)
|
|
|
Total
Net Assets |
$13,284,092,002
|
|
Total
Number of Portfolio Holdings |
1,111
|
|
Total
Management Fee Paid |
$56,929,729
|
|
Portfolio
Turnover Rate |
11.93%
|
| Franklin
California Tax-Free Income Fund |
PAGE
2 |
112-ATSR-0426 |
Portfolio Composition*
(% of Total Investments)
| * |
Does
not include derivatives, except purchased options, if any. |
|
|
|
|
WHERE
CAN I FIND ADDITIONAL INFORMATION ABOUT THE FUND? |
|
Additional
information is available on https://www.franklintempleton.com/regulatory-fund-documents,
including its: |
|
•
prospectus • proxy voting information • financial information • holdings • tax information |
HOUSEHOLDING
You
will receive the Fund’s shareholder reports every six months. In addition, you will receive an annual updated summary prospectus
(detail prospectus available
upon request). To reduce Fund expenses, we try to identify related shareholders in a household and send only
one copy of the shareholder reports and summary prospectus. This process, called “householding,” will continue indefinitely
unless you instruct us otherwise.
If you prefer not to have these documents householded, please call us at (800)
DIAL BEN/342-5236. At any time,
you may view current prospectuses/summary prospectuses and shareholder reports on our website. If you choose, you may
receive these documents through electronic delivery.
| Franklin
California Tax-Free Income Fund |
PAGE
3 |
112-ATSR-0426 |
9625974299611032411620115271149410749114131178112289100001002510276107001171311837117591115911764121121271310000999710259106541169311763116761112411738120421264225.412.312.010.110.08.97.86.63.01.81.70.4
|
|
|
|
Franklin
California Tax-Free Income Fund |
|
|
Class
C [FRCTX]
|
|
Annual
Shareholder Report | February
28, 2026 |
|
|
This
annual
shareholder report
contains important information about Franklin
California Tax-Free Income Fund for the period March
1, 2025, to February
28, 2026.
You
can find additional information about the Fund at https://www.franklintempleton.com/regulatory-fund-documents.
You can also request this information
by contacting us at (800)
DIAL BEN/342-5236.
|
|
|
|
Class
Name |
Costs
of a $10,000 investment
|
Costs
paid as a percentage of a $10,000
investment |
|
Class
C |
$119
|
%
|
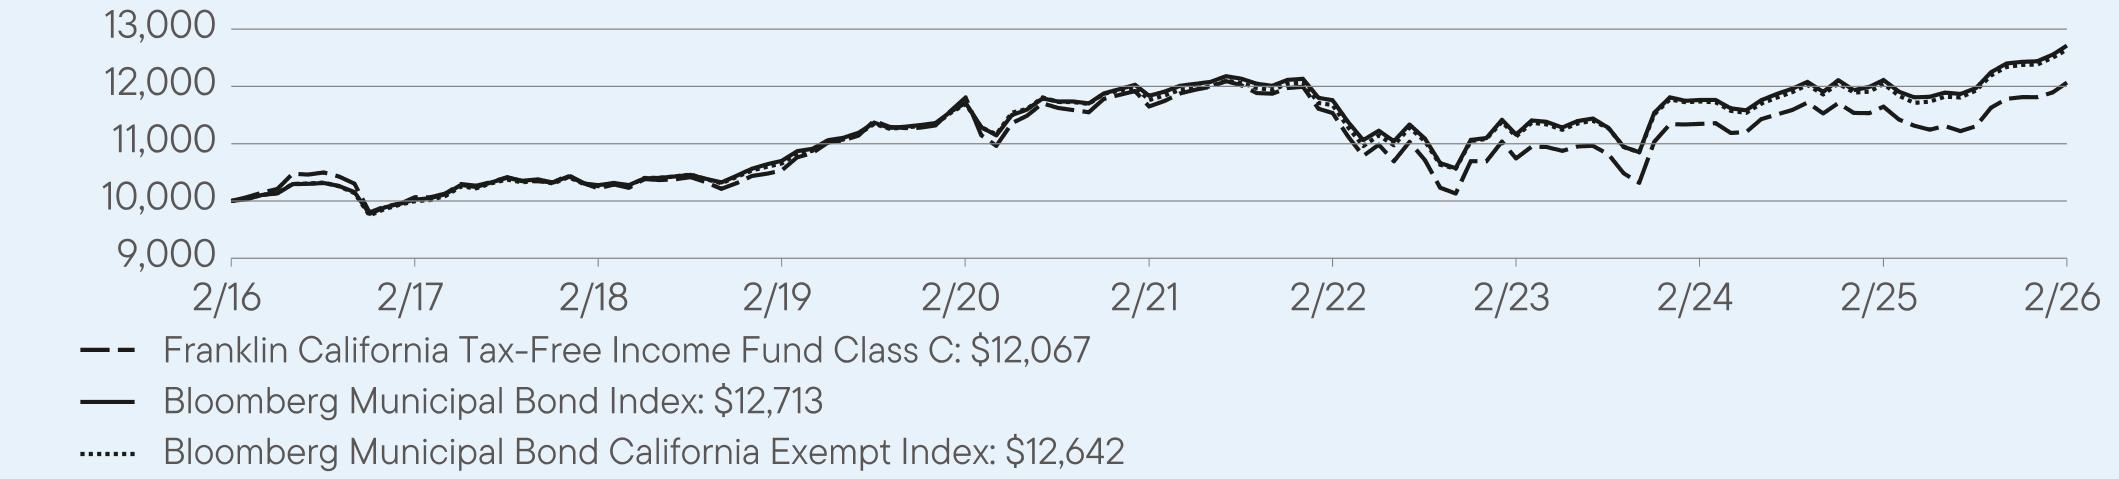
HOW
DID THE FUND PERFORM LAST YEAR AND WHAT AFFECTED ITS PERFORMANCE?
For the twelve months ended February
28, 2026, Class C shares of
Franklin California Tax-Free Income Fund returned 3.61%.
The Fund compares its performance
to the Bloomberg Municipal Bond California Exempt Index, which returned 4.98% for the same period.
|
|
|
Top
contributors to performance: |
|
↑
|
Selection
in A rated bonds |
|
↑
|
Selection
in AA rated bonds |
|
↑
|
Overweight
to BBB rated bonds |
|
|
|
Top
detractors from performance: |
|
↓
|
Underweight
bonds with five years or less to maturity |
|
↓
|
Overweight
bonds with 20 or more years to maturity |
|
↓
|
Selection
in BBB rated bonds |
| Franklin
California Tax-Free Income Fund |
PAGE
1 |
212-ATSR-0426 |
HOW
DID THE FUND PERFORM OVER THE LAST 10 YEARS?
The
Fund’s past performance is not necessarily an indication of how the Fund will perform in the future. The
graph and table do not reflect
the deduction of taxes that a shareholder would pay on Fund distributions or redemption of Fund shares.
VALUE
OF A $10,000
INVESTMENT – Class
C 2/29/2016 —
2/28/2026
AVERAGE
ANNUAL TOTAL RETURNS (%) Period
Ended February 28, 2026
|
|
|
|
|
|
1
Year |
5
Year |
10
Year |
|
Class
C |
3.61
|
0.71
|
1.90
|
|
Class
C (with sales charge) |
2.61
|
0.71
|
1.90
|
|
Bloomberg
Municipal Bond Index |
4.96
|
1.44
|
2.43
|
|
Bloomberg
Municipal Bond California Exempt Index |
4.98
|
1.45
|
2.37
|
Fund
performance figures may reflect fee waivers and/or expense reimbursements, without which the performance would have been lower.
For current month-end performance,
please call Franklin Templeton at (800)
DIAL BEN/342-5236 or visit
https://www.franklintempleton.com/investments/options/mutual-funds.
Important data provider notices
and terms available at www.franklintempletondatasources.com.
KEY
FUND STATISTICS (as
of February 28, 2026)
|
|
|
Total
Net Assets |
$13,284,092,002
|
|
Total
Number of Portfolio Holdings |
1,111
|
|
Total
Management Fee Paid |
$56,929,729
|
|
Portfolio
Turnover Rate |
11.93%
|
Portfolio Composition*
(% of Total Investments)
| * |
Does
not include derivatives, except purchased options, if any. |
| Franklin
California Tax-Free Income Fund |
PAGE
2 |
212-ATSR-0426 |
|
|
|
|
WHERE
CAN I FIND ADDITIONAL INFORMATION ABOUT THE FUND? |
|
Additional
information is available on https://www.franklintempleton.com/regulatory-fund-documents,
including its: |
|
•
prospectus • proxy voting information • financial information • holdings • tax information |
HOUSEHOLDING
You
will receive the Fund’s shareholder reports every six months. In addition, you will receive an annual updated summary prospectus
(detail prospectus available
upon request). To reduce Fund expenses, we try to identify related shareholders in a household and send only
one copy of the shareholder reports and summary prospectus. This process, called “householding,” will continue indefinitely
unless you instruct us otherwise.
If you prefer not to have these documents householded, please call us at (800)
DIAL BEN/342-5236. At any time,
you may view current prospectuses/summary prospectuses and shareholder reports on our website. If you choose, you may
receive these documents through electronic delivery.
| Franklin
California Tax-Free Income Fund |
PAGE
3 |
212-ATSR-0426 |
1000010065102201053411808116501153710743113461164712067100001002510276107001171311837117591115911764121121271310000999710259106541169311763116761112411738120421264225.412.312.010.110.08.97.86.63.01.81.70.4
|
|
|
|
Franklin
California Tax-Free Income Fund |
|
|
Class
R6 [FKTQX]
|
|
Annual
Shareholder Report | February
28, 2026 |
|
|
This
annual
shareholder report
contains important information about Franklin
California Tax-Free Income Fund for the period March
1, 2025, to February
28, 2026.
You
can find additional information about the Fund at https://www.franklintempleton.com/regulatory-fund-documents.
You can also request this information
by contacting us at (800)
DIAL BEN/342-5236.
|
|
|
|
Class
Name |
Costs
of a $10,000 investment
|
Costs
paid as a percentage of a $10,000
investment |
|
Class
R6 |
$49
|
%
|
HOW
DID THE FUND PERFORM LAST YEAR AND WHAT AFFECTED ITS PERFORMANCE?
For the twelve months ended February
28, 2026, Class R6 shares of
Franklin California Tax-Free Income Fund returned 4.47%.
The Fund compares its performance
to the Bloomberg Municipal Bond California Exempt Index, which returned 4.98% for the same period.
|
|
|
Top
contributors to performance: |
|
↑
|
Selection
in A rated bonds |
|
↑
|
Selection
in AA rated bonds |
|
↑
|
Overweight
to BBB rated bonds |
|
|
|
Top
detractors from performance: |
|
↓
|
Underweight
bonds with five years or less to maturity |
|
↓
|
Overweight
bonds with 20 or more years to maturity |
|
↓
|
Selection
in BBB rated bonds |
| Franklin
California Tax-Free Income Fund |
PAGE
1 |
8112-ATSR-0426 |
HOW
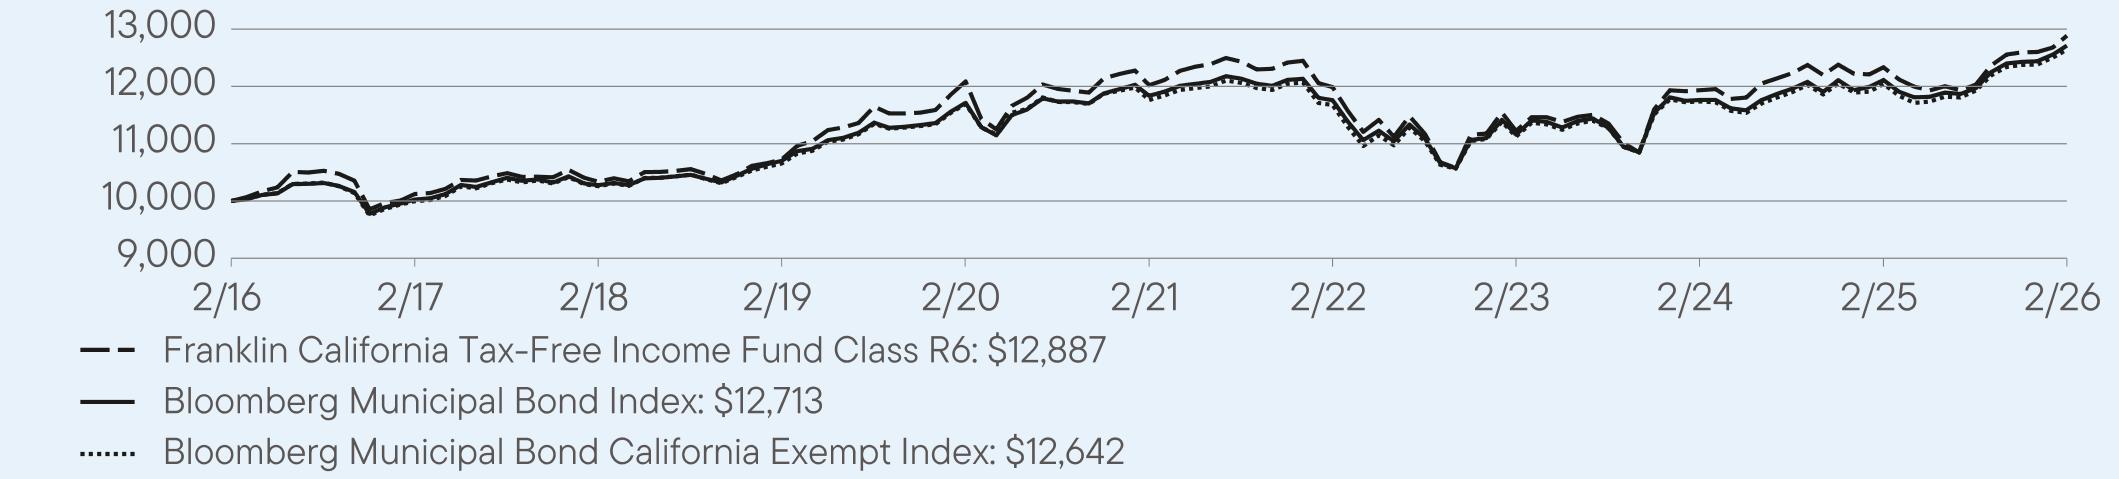
DID THE FUND PERFORM OVER THE LAST 10 YEARS?
The
Fund’s past performance is not necessarily an indication of how the Fund will perform in the future. The
graph and table do not reflect
the deduction of taxes that a shareholder would pay on Fund distributions or redemption of Fund shares.
VALUE
OF A $10,000
INVESTMENT – Class
R6 2/29/2016 —
2/28/2026
AVERAGE
ANNUAL TOTAL RETURNS (%) Period
Ended February 28, 2026
|
|
|
|
|
|
1
Year |
5
Year |
10
Year |
|
Class
R6 |
4.47
|
1.40
|
2.57
|
|
Bloomberg
Municipal Bond Index |
4.96
|
1.44
|
2.43
|
|
Bloomberg
Municipal Bond California Exempt Index |
4.98
|
1.45
|
2.37
|
Fund
performance figures may reflect fee waivers and/or expense reimbursements, without which the performance would have been lower.
The
Fund began offering Class R6 shares on 8/1/2017. Returns for periods before 8/1/2017, are based on the Fund’s Advisor Class performance,
which has been adjusted to take into account differences in class-specific operating expenses and maximum sales charges.
For periods after the share class offering, performance for the specific share class is used, reflecting the applicable expenses and
maximum sales charges.
For current month-end performance,
please call Franklin Templeton at (800)
DIAL BEN/342-5236 or visit
https://www.franklintempleton.com/investments/options/mutual-funds.
Important data provider notices
and terms available at www.franklintempletondatasources.com.
KEY
FUND STATISTICS (as
of February 28, 2026)
|
|
|
Total
Net Assets |
$13,284,092,002
|
|
Total
Number of Portfolio Holdings |
1,111
|
|
Total
Management Fee Paid |
$56,929,729
|
|
Portfolio
Turnover Rate |
11.93%
|
| Franklin
California Tax-Free Income Fund |
PAGE
2 |
8112-ATSR-0426 |
Portfolio Composition*
(% of Total Investments)
| * |
Does
not include derivatives, except purchased options, if any. |
|
|
|
|
WHERE
CAN I FIND ADDITIONAL INFORMATION ABOUT THE FUND? |
|
Additional
information is available on https://www.franklintempleton.com/regulatory-fund-documents,
including its: |
|
•
prospectus • proxy voting information • financial information • holdings • tax information |
HOUSEHOLDING
You
will receive the Fund’s shareholder reports every six months. In addition, you will receive an annual updated summary prospectus
(detail prospectus available
upon request). To reduce Fund expenses, we try to identify related shareholders in a household and send only
one copy of the shareholder reports and summary prospectus. This process, called “householding,” will continue indefinitely
unless you instruct us otherwise.
If you prefer not to have these documents householded, please call us at (800)
DIAL BEN/342-5236. At any time,
you may view current prospectuses/summary prospectuses and shareholder reports on our website. If you choose, you may
receive these documents through electronic delivery.
| Franklin
California Tax-Free Income Fund |
PAGE
3 |
8112-ATSR-0426 |
1000010122103371072512087120221198711223119341233512887100001002510276107001171311837117591115911764121121271310000999710259106541169311763116761112411738120421264225.412.312.010.110.08.97.86.63.01.81.70.4
|
|
|
|
Franklin
California Tax-Free Income Fund |
|
|
Advisor
Class [FCAVX]
|
|
Annual
Shareholder Report | February
28, 2026 |
|
|
This
annual
shareholder report
contains important information about Franklin
California Tax-Free Income Fund for the period March
1, 2025, to February
28, 2026.
You
can find additional information about the Fund at https://www.franklintempleton.com/regulatory-fund-documents.
You can also request this information
by contacting us at (800)
DIAL BEN/342-5236.
|
|
|
|
Class
Name |
Costs
of a $10,000 investment
|
Costs
paid as a percentage of a $10,000
investment |
|
Advisor
Class |
$53
|
%
|
HOW
DID THE FUND PERFORM LAST YEAR AND WHAT AFFECTED ITS PERFORMANCE?
For the twelve months ended February
28, 2026, Advisor Class shares
of Franklin California Tax-Free Income Fund returned 4.28%.
The Fund compares its performance
to the Bloomberg Municipal Bond California Exempt Index, which returned 4.98% for the same period.
|
|
|
Top
contributors to performance: |
|
↑
|
Selection
in A rated bonds |
|
↑
|
Selection
in AA rated bonds |
|
↑
|
Overweight
to BBB rated bonds |
|
|
|
Top
detractors from performance: |
|
↓
|
Underweight
bonds with five years or less to maturity |
|
↓
|
Overweight
bonds with 20 or more years to maturity |
|
↓
|
Selection
in BBB rated bonds |
| Franklin
California Tax-Free Income Fund |
PAGE
1 |
614-ATSR-0426 |
HOW
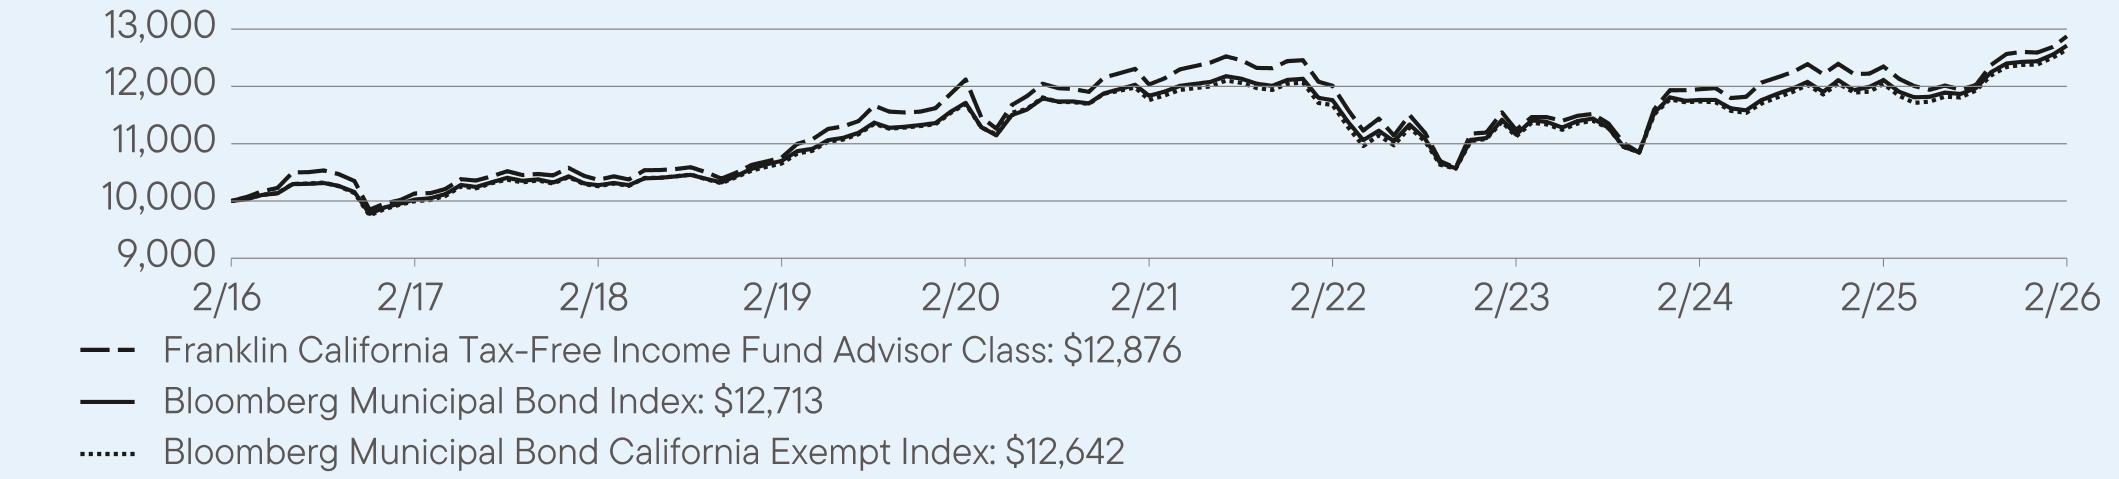
DID THE FUND PERFORM OVER THE LAST 10 YEARS?
The
Fund’s past performance is not necessarily an indication of how the Fund will perform in the future. The
graph and table do not reflect
the deduction of taxes that a shareholder would pay on Fund distributions or redemption of Fund shares.
VALUE
OF A $10,000
INVESTMENT – Advisor
Class 2/29/2016
— 2/28/2026
AVERAGE
ANNUAL TOTAL RETURNS (%) Period
Ended February 28, 2026
|
|
|
|
|
|
1
Year |
5
Year |
10
Year |
|
Advisor
Class |
4.28
|
1.36
|
2.56
|
|
Bloomberg
Municipal Bond Index |
4.96
|
1.44
|
2.43
|
|
Bloomberg
Municipal Bond California Exempt Index |
4.98
|
1.45
|
2.37
|
Fund
performance figures may reflect fee waivers and/or expense reimbursements, without which the performance would have been lower.
For current month-end performance,
please call Franklin Templeton at (800)
DIAL BEN/342-5236 or visit
https://www.franklintempleton.com/investments/options/mutual-funds.
Important data provider notices
and terms available at www.franklintempletondatasources.com.
KEY
FUND STATISTICS (as
of February 28, 2026)
|
|
|
Total
Net Assets |
$13,284,092,002
|
|
Total
Number of Portfolio Holdings |
1,111
|
|
Total
Management Fee Paid |
$56,929,729
|
|
Portfolio
Turnover Rate |
11.93%
|
Portfolio Composition*
(% of Total Investments)
| * |
Does
not include derivatives, except purchased options, if any. |
| Franklin
California Tax-Free Income Fund |
PAGE
2 |
614-ATSR-0426 |
|
|
|
|
WHERE
CAN I FIND ADDITIONAL INFORMATION ABOUT THE FUND? |
|
Additional
information is available on https://www.franklintempleton.com/regulatory-fund-documents,
including its: |
|
•
prospectus • proxy voting information • financial information • holdings • tax information |
HOUSEHOLDING
You
will receive the Fund’s shareholder reports every six months. In addition, you will receive an annual updated summary prospectus
(detail prospectus available
upon request). To reduce Fund expenses, we try to identify related shareholders in a household and send only
one copy of the shareholder reports and summary prospectus. This process, called “householding,” will continue indefinitely
unless you instruct us otherwise.
If you prefer not to have these documents householded, please call us at (800)
DIAL BEN/342-5236. At any time,
you may view current prospectuses/summary prospectuses and shareholder reports on our website. If you choose, you may
receive these documents through electronic delivery.
| Franklin
California Tax-Free Income Fund |
PAGE
3 |
614-ATSR-0426 |
1000010132103701075712120120341201111242119511234812876100001002510276107001171311837117591115911764121121271310000999710259106541169311763116761112411738120421264225.412.312.010.110.08.97.86.63.01.81.70.4
(b) Not applicable
(a) The Registrant has adopted a code of ethics that applies
to its principal executive officers and principal financial and accounting officer.
(c) N/A
(d) N/A
(f) Pursuant to Item 19(a) (1), the Registrant is attaching
as an exhibit a copy of its code of ethics that applies to its principal executive officers and principal financial and accounting officer.
| ITEM 3. |
AUDIT COMMITTEE FINANCIAL EXPERT. |
The Board of Trustees of the Registrant
has determined that Mary C. Choksi, possesses the technical attributes identified in Item 3 to Form N-CSR to qualify as an “audit
committee financial expert,” and has designated Mary C. Choksi as the Audit Committee’s financial expert. Mary C. Choksi is
an “independent” Trustee pursuant to paragraph (a)(2) of Item 3 to Form N-CSR.
Under applicable securities laws, a person
determined to be an audit committee financial expert will not be deemed an “expert” for any purpose, including without limitation
for the purposes of Section 11 of the Securities Act of 1933, as a result of being designated or identified as an audit committee financial
expert. The designation or identification of a person as an audit committee financial expert does not impose on such person any duties,
obligations, or liabilities greater than the duties, obligations, and liabilities imposed on such person as a member of the audit committee
and board of directors in the absence of such designation or identification. The designation or identification of a person as an audit
committee financial expert does not affect the duties, obligations, or liability of any other member of the audit committee or board of
directors.
|
ITEM 4. |
PRINCIPAL ACCOUNTANT FEES AND SERVICES. |
a) Audit Fees.
The aggregate fees billed in the last two fiscal years ending February 28, 2025 and February 28, 2026 (the “Reporting Periods”)
for professional services rendered by the Registrant’s principal accountant (the “Auditor”) for the audit of the Registrant’s
annual financial statements, or services that are normally provided by the Auditor in connection with the statutory and regulatory filings
or engagements for the Reporting Periods, were $87,711 in February 28, 2025 and $57,855 in February 28, 2026.
b) Audit-Related
Fees. The aggregate fees billed in the Reporting Periods for assurance and related services by the Auditor that are reasonably
related to the performance of the Registrant’s financial statements were $0 in February 28, 2025 and $0 in February 28, 2026.
(c) Tax Fees.
The aggregate fees billed in the Reporting Periods for professional services rendered by the Auditor for tax compliance, tax advice and
tax planning (“Tax Services”) were $9,750 in February 28, 2025 and $9,750 in February 28, 2026. These services consisted of
(i) review or preparation of U.S. federal, state, local and excise tax returns; (ii) U.S. federal, state and local tax planning, advice
and assistance regarding statutory, regulatory or administrative developments, and (iii) tax advice regarding tax qualification matters
and/or treatment of various financial instruments held or proposed to be acquired or held.
There were no fees billed for tax services by the Registrant’s
investment adviser and any entity controlling, controlled by, or under common control with the investment adviser that provides ongoing
services to the Registrant (“Service Affiliates”) during the Reporting Periods that required pre-approval by the Audit Committee.
(d) All Other Fees.
The aggregate fees billed in the Reporting Periods for products and services provided by the Auditor to the Registrant, other than the
services reported in paragraphs (a) through (c) of this item, were $0 in February 28, 2025 and $0
in February 28, 2026.
There were no other non-audit services rendered by the Auditor
to the Service Affiliates requiring pre-approval by the Audit Committee in the Reporting Periods.
(e) Audit Committee’s pre–approval policies and
procedures described in paragraph (c) (7) of Rule 2-01 of Regulation S-X.
(1) The Registrant’s Audit Committee is directly responsible
for approving the services to be provided by the Auditors, including:
(i) pre-approval of all audit and audit
related services;
(ii) pre-approval of all non-audit related
services to be provided to the Registrant by the Auditors;
(iii) pre-approval of all non-audit related
services to be provided by the Auditors to the Registrant and the Service Affiliates where the non-audit services relate directly to the
operations or financial reporting of the Registrant; and
(iv) establishment by the Audit Committee,
if deemed necessary or appropriate, as an alternative to committee pre-approval of services to be provided by the Auditors, as required
by paragraphs (ii) and (iii) above, of policies and procedures to permit such services to be pre-approved by other means, such as through
establishment of guidelines or by action of a designated member or members of the committee; provided the policies and procedures are
detailed as to the particular service and the committee is informed of each service and such policies and procedures do not include delegation
of Audit Committee responsibilities, as contemplated under the Securities Exchange Act of 1934, to management; subject, in the case of
(ii) through (iv), to any waivers, exceptions or exemptions that may be available under applicable law or rules.
(2) None of the services described in paragraphs (b) through
(d) of this Item were performed in reliance on paragraph (c)(7)(i)(C) of Rule 2-01 of Regulation S-X.
(f) Not applicable.
(g) Non-audit fees billed by the Auditor for services rendered
to the Registrant and the Service Affiliates during the reporting period were $489,326 in February 28, 2025 and $1,690,011 in February
28, 2026.
(h) Yes. The Registrant’s Audit Committee has considered
whether the provision of non-audit services that were rendered to Service Affiliates, which were not pre-approved (not requiring pre-approval),
is compatible with maintaining the Auditor’s independence. All services provided by the Auditor to the Registrant or to the Service
Affiliates, which were required to be pre-approved, were pre-approved as required.
(i) Not applicable.
(j) Not applicable.
| ITEM 5. |
AUDIT COMMITTEE OF LISTED REGISTRANTS. |
Not applicable.
| ITEM 6. |
SCHEDULE OF INVESTMENTS. |
|
(a) |
Please see schedule of investments contained in the Financial Statements and Financial
Highlights included under Item 7 of this Form N-CSR. |
|
ITEM 7. |
FINANCIAL STATEMENTS AND FINANCIAL HIGHLIGHTS FOR OPEN-END MANAGEMENT INVESTMENT COMPANIES. |
Franklin
California
Tax-Free
Income
Fund
Financial
Statements
and
Other
Important
Information
Annual
|
February
28,
2026
If
you
need
assistance
accessing
this
content,
please
reach
out
to
your
sales
representative
or
send
an
email
to
accessibility@franklintempleton.com
.
Financial
Statements
and
Other
Important
Information—Annual
Financial
Highlights
and
Schedule
of
Investments
2
Financial
Statements
36
Notes
to
Financial
Statements
40
Report
of
Independent
Registered
Public
Accounting
Firm
48
Tax
Information
49
Changes
In
and
Disagreements
with
Accountants
50
Results
of
Meeting(s)
of
Shareholders
50
Remuneration
Paid
to
Directors,
Officers
and
Others
50
Board
Approval
of
Management
and
Subadvisory
Agreements
50
Franklin
California
Tax-Free
Income
Fund
Annual
Report
The
accompanying
notes
are
an
integral
part
of
these
financial
statements.
a
Year
Ended
February
28,
Year
Ended
February
28,
2022
b
Year
Ended
March
31,
2021
2026
2025
2024
a
2023
Class
A
Per
share
operating
performance
(for
a
share
outstanding
throughout
the
year)
Net
asset
value,
beginning
of
year
.......
$6.86
$6.89
$6.73
$7.44
$7.71
$7.50
Income
from
investment
operations
c
:
Net
investment
income
d
.............
0.25
0.24
0.24
0.22
0.18
0.22
Net
realized
and
unrealized
gains
(losses)
0.02
(0.03)
0.16
(0.71)
(0.28)
0.20
Total
from
investment
operations
........
0.27
0.21
0.40
(0.49)
(0.10)
0.42
Less
distributions
from:
Net
investment
income
..............
(0.24)
(0.24)
(0.24)
(0.22)
(0.17)
(0.21)
Net
asset
value,
end
of
year
...........
$6.89
$6.86
$6.89
$6.73
$7.44
$7.71
Total
return
e
.......................
4.15%
3.06%
6.02%
(6.62)%
(1.30)%
5.66%
Ratios
to
average
net
assets
f
Expenses
.........................
0.77%
0.76%
g
0.76%
g
0.77%
g
0.75%
g
0.75%
g
Net
investment
income
...............
3.72%
3.48%
3.57%
3.27%
2.52%
2.79%
Supplemental
data
Net
assets,
end
of
year
(000’s)
.........
$2,990,950
$2,853,539
$2,554,655
$2,282,254
$2,412,285
$2,074,343
Portfolio
turnover
rate
................
11.93%
7.96%
14.01%
42.30%
19.33%
14.41%
a
For
the
year
ended
February
29.
b
For
the
period
April
1,
2021
to
February
28,
2022.
c
The
amount
shown
for
a
share
outstanding
throughout
the
period
may
not
correlate
with
the
Statement
of
Operations
for
the
period
due
to
the
timing
of
sales
and
repurchases
of
the
Fund’s
shares
in
relation
to
income
earned
and/or
fluctuating
fair
value
of
the
investments
of
the
Fund.
d
Based
on
average
daily
shares
outstanding.
e
Total
return
does
not
reflect
sales
commissions
or
contingent
deferred
sales
charges,
if
applicable,
and
is
not
annualized
for
periods
less
than
one
year.
f
Ratios
are
annualized
for
periods
less
than
one
year.
g
Benefit
of
expense
reduction
rounds
to
less
than
0.01%.
Franklin
California
Tax-Free
Income
Fund
Financial
Highlights
The
accompanying
notes
are
an
integral
part
of
these
financial
statements.
Annual
Report
a
Year
Ended
February
28,
Year
Ended
February
28,
2022
b
Year
Ended
March
31,
2021
2026
2025
2024
a
2023
Class
A1
Per
share
operating
performance
(for
a
share
outstanding
throughout
the
year)
Net
asset
value,
beginning
of
year
.......
$6.85
$6.88
$6.72
$7.43
$7.70
$7.49
Income
from
investment
operations
c
:
Net
investment
income
d
.............
0.26
0.25
0.25
0.23
0.19
0.23
Net
realized
and
unrealized
gains
(losses)
0.02
(0.03)
0.16
(0.71)
(0.27)
0.20
Total
from
investment
operations
........
0.28
0.22
0.41
(0.48)
(0.08)
0.43
Less
distributions
from:
Net
investment
income
..............
(0.25)
(0.25)
(0.25)
(0.23)
(0.19)
(0.22)
Net
asset
value,
end
of
year
...........
$6.88
$6.85
$6.88
$6.72
$7.43
$7.70
Total
return
e
.......................
4.32%
3.22%
6.18%
(6.48)%
(1.17)%
5.83%
Ratios
to
average
net
assets
f
Expenses
.........................
0.61%
0.60%
g
0.61%
g
0.62%
g
0.59%
g
0.60%
g
Net
investment
income
...............
3.88%
3.64%
3.73%
3.42%
2.68%
2.97%
Supplemental
data
Net
assets,
end
of
year
(000’s)
.........
$6,303,627
$6,986,725
$7,640,302
$8,130,315
$10,201,944
$11,084,478
Portfolio
turnover
rate
................
11.93%
7.96%
14.01%
42.30%
19.33%
14.41%
a
For
the
year
ended
February
29.
b
For
the
period
April
1,
2021
to
February
28,
2022.
c
The
amount
shown
for
a
share
outstanding
throughout
the
period
may
not
correlate
with
the
Statement
of
Operations
for
the
period
due
to
the
timing
of
sales
and
repurchases
of
the
Fund’s
shares
in
relation
to
income
earned
and/or
fluctuating
fair
value
of
the
investments
of
the
Fund.
d
Based
on
average
daily
shares
outstanding.
e
Total
return
does
not
reflect
sales
commissions
or
contingent
deferred
sales
charges,
if
applicable,
and
is
not
annualized
for
periods
less
than
one
year.
f
Ratios
are
annualized
for
periods
less
than
one
year.
g
Benefit
of
expense
reduction
rounds
to
less
than
0.01%.
Franklin
California
Tax-Free
Income
Fund
Financial
Highlights
Annual
Report
The
accompanying
notes
are
an
integral
part
of
these
financial
statements.
a
Year
Ended
February
28,
Year
Ended
February
28,
2022
b
Year
Ended
March
31,
2021
2026
2025
2024
a
2023
Class
C
Per
share
operating
performance
(for
a
share
outstanding
throughout
the
year)
Net
asset
value,
beginning
of
year
.......
$6.84
$6.87
$6.71
$7.41
$7.69
$7.47
Income
from
investment
operations
c
:
Net
investment
income
d
.............
0.22
0.21
0.21
0.20
0.15
0.19
Net
realized
and
unrealized
gains
(losses)
0.02
(0.03)
0.16
(0.71)
(0.28)
0.21
Total
from
investment
operations
........
0.24
0.18
0.37
(0.51)
(0.13)
0.40
Less
distributions
from:
Net
investment
income
..............
(0.22)
(0.21)
(0.21)
(0.19)
(0.15)
(0.18)
Net
asset
value,
end
of
year
...........
$6.86
$6.84
$6.87
$6.71
$7.41
$7.69
Total
return
e
.......................
3.61%
2.65%
5.61%
(6.88)%
(1.80)%
5.40%
Ratios
to
average
net
assets
f
Expenses
.........................
1.17%
1.16%
g
1.16%
g
1.17%
g
1.15%
g
1.16%
g
Net
investment
income
...............
3.33%
3.09%
3.19%
2.86%
2.13%
2.42%
Supplemental
data
Net
assets,
end
of
year
(000’s)
.........
$246,506
$324,192
$395,396
$502,065
$723,593
$1,018,197
Portfolio
turnover
rate
................
11.93%
7.96%
14.01%
42.30%
19.33%
14.41%
a
For
the
year
ended
February
29.
b
For
the
period
April
1,
2021
to
February
28,
2022.
c
The
amount
shown
for
a
share
outstanding
throughout
the
period
may
not
correlate
with
the
Statement
of
Operations
for
the
period
due
to
the
timing
of
sales
and
repurchases
of
the
Fund’s
shares
in
relation
to
income
earned
and/or
fluctuating
fair
value
of
the
investments
of
the
Fund.
d
Based
on
average
daily
shares
outstanding.
e
Total
return
does
not
reflect
sales
commissions
or
contingent
deferred
sales
charges,
if
applicable,
and
is
not
annualized
for
periods
less
than
one
year.
f
Ratios
are
annualized
for
periods
less
than
one
year.
g
Benefit
of
expense
reduction
rounds
to
less
than
0.01%.
Franklin
California
Tax-Free
Income
Fund
Financial
Highlights
The
accompanying
notes
are
an
integral
part
of
these
financial
statements.
Annual
Report
a
Year
Ended
February
28,
Year
Ended
February
28,
2022
b
Year
Ended
March
31,
2021
2026
2025
2024
a
2023
Class
R6
Per
share
operating
performance
(for
a
share
outstanding
throughout
the
year)
Net
asset
value,
beginning
of
year
.......
$6.84
$6.87
$6.71
$7.42
$7.69
$7.48
Income
from
investment
operations
c
:
Net
investment
income
d
.............
0.27
0.26
0.26
0.24
0.20
0.24
Net
realized
and
unrealized
gains
(losses)
0.02
(0.03)
0.15
(0.71)
(0.28)
0.20
Total
from
investment
operations
........
0.29
0.23
0.41
(0.47)
(0.08)
0.44
Less
distributions
from:
Net
investment
income
..............
(0.26)
(0.26)
(0.25)
(0.24)
(0.19)
(0.23)
Net
asset
value,
end
of
year
...........
$6.87
$6.84
$6.87
$6.71
$7.42
$7.69
Total
return
e
.......................
4.47%
3.36%
6.33%
(6.37)%
(1.05)%
5.97%
Ratios
to
average
net
assets
f
Expenses
.........................
0.48%
0.47%
g
0.48%
g
0.49%
g
0.47%
g,h
0.47%
g,h
Net
investment
income
...............
4.02%
3.78%
3.87%
3.55%
2.81%
3.08%
Supplemental
data
Net
assets,
end
of
year
(000’s)
.........
$404,787
$380,103
$316,077
$271,190
$345,058
$281,038
Portfolio
turnover
rate
................
11.93%
7.96%
14.01%
42.30%
19.33%
14.41%
a
For
the
year
ended
February
29.
b
For
the
period
April
1,
2021
to
February
28,
2022.
c
The
amount
shown
for
a
share
outstanding
throughout
the
period
may
not
correlate
with
the
Statement
of
Operations
for
the
period
due
to
the
timing
of
sales
and
repurchases
of
the
Fund’s
shares
in
relation
to
income
earned
and/or
fluctuating
fair
value
of
the
investments
of
the
Fund.
d
Based
on
average
daily
shares
outstanding.
e
Total
return
is
not
annualized
for
periods
less
than
one
year.
f
Ratios
are
annualized
for
periods
less
than
one
year.
g
Benefit
of
expense
reduction
rounds
to
less
than
0.01%.
h
Benefit
of
waiver
and
payments
by
affiliates
rounds
to
less
than
0.01%.
Franklin
California
Tax-Free
Income
Fund
Financial
Highlights
Annual
Report
The
accompanying
notes
are
an
integral
part
of
these
financial
statements.
a
Year
Ended
February
28,
Year
Ended
February
28,
2022
b
Year
Ended
March
31,
2021
2026
2025
2024
a
2023
Advisor
Class
Per
share
operating
performance
(for
a
share
outstanding
throughout
the
year)
Net
asset
value,
beginning
of
year
.......
$6.84
$6.87
$6.71
$7.42
$7.69
$7.48
Income
from
investment
operations
c
:
Net
investment
income
d
.............
0.27
0.26
0.26
0.24
0.20
0.24
Net
realized
and
unrealized
gains
(losses)
0.02
(0.04)
0.15
(0.72)
(0.28)
0.20
Total
from
investment
operations
........
0.29
0.22
0.41
(0.48)
(0.08)
0.44
Less
distributions
from:
Net
investment
income
..............
(0.26)
(0.25)
(0.25)
(0.23)
(0.19)
(0.23)
Net
asset
value,
end
of
year
...........
$6.87
$6.84
$6.87
$6.71
$7.42
$7.69
Total
return
e
.......................
4.28%
3.33%
6.30%
(6.40)%
(1.08)%
5.94%
Ratios
to
average
net
assets
f
Expenses
.........................
0.52%
0.51%
g
0.52%
g
0.52%
g
0.50%
g
0.51%
g
Net
investment
income
...............
3.99%
3.74%
3.84%
3.53%
2.78%
3.06%
Supplemental
data
Net
assets,
end
of
year
(000’s)
.........
$3,338,223
$2,609,811
$2,425,421
$2,344,189
$2,619,688
$2,498,587
Portfolio
turnover
rate
................
11.93%
7.96%
14.01%
42.30%
19.33%
14.41%
a
For
the
year
ended
February
29.
b
For
the
period
April
1,
2021
to
February
28,
2022.
c
The
amount
shown
for
a
share
outstanding
throughout
the
period
may
not
correlate
with
the
Statement
of
Operations
for
the
period
due
to
the
timing
of
sales
and
repurchases
of
the
Fund’s
shares
in
relation
to
income
earned
and/or
fluctuating
fair
value
of
the
investments
of
the
Fund.
d
Based
on
average
daily
shares
outstanding.
e
Total
return
is
not
annualized
for
periods
less
than
one
year.
f
Ratios
are
annualized
for
periods
less
than
one
year.
g
Benefit
of
expense
reduction
rounds
to
less
than
0.01%.
Franklin
California
Tax-Free
Income
Fund
Schedule
of
Investments,
February
28,
2026
The
accompanying
notes
are
an
integral
part
of
these
financial
statements.
Annual
Report
a
a
Shares
a
Value
a
Common
Stocks
0.0%
Independent
Power
and
Renewable
Electricity
Producers
0.0%
a,b
AES
Guayama
Holdings
BV
...........................................
79,045
$
—
b
Total
Common
Stocks
(Cost
$
–
)
...............................................
—
Principal
Amount
a
a
a
a
Municipal
Bonds
98.0%
California
95.1%
Alameda
Corridor
Transportation
Authority
,
c
Revenue,
Sub.
Lien
,
2004
A
,
Refunding
,
AMBAC
Insured
,
2.73
%,
10/01/29
......
$
20,000,000
18,158,682
c
Revenue,
Sub.
Lien
,
2004
A
,
Refunding
,
AMBAC
Insured
,
2.76
%,
10/01/30
......
41,665,000
36,764,429
Revenue,
Sub.
Lien
,
2022
C
,
Refunding
,
AG
Insured
,
5
%
,
10/01/52
............
28,000,000
29,068,704
Alameda
Unified
School
District
,
GO
,
2015
A
,
5
%
,
8/01/39
.....................
18,000,000
18,019,735
c
Alhambra
City
Elementary
School
District
,
Alhambra
Unified
School
District
,
GO
,
2004
B
,
NATL
Insured
,
2.34
%,
9/01/27
......................................
3,035,000
2,931,179
Align
Capital
Trust
,
Revenue
,
2023-1
,
5.5
%
,
3/01/35
.........................
13,000,000
13,919,599
c
Alisal
Union
School
District
,
GO
,
2009
B
,
AG
Insured
,
2.52
%,
8/01/32
................................
3,355,000
2,860,169
GO
,
2009
B
,
AG
Insured
,
2.62
%,
8/01/33
................................
3,610,000
2,980,154
GO
,
2009
B
,
AG
Insured
,
2.66
%,
2/01/34
................................
3,345,000
2,715,709
Alta
Loma
School
District
,
GO
,
2019
B
,
5
%
,
8/01/44
.........................
7,375,000
7,543,576
c
Alvord
Unified
School
District
,
GO
,
2011
B
,
AG
Insured
,
3.53
%,
8/01/36
................................
15,000,000
10,448,600
GO
,
2011
B
,
AG
Insured
,
7.218
%,
8/01/46
...............................
42,500,000
53,461,124
Anaheim
Housing
&
Public
Improvements
Authority
,
City
of
Anaheim
Electric
System
,
Revenue
,
2022
A
,
Refunding
,
5
%
,
10/01/52
.....
8,040,000
8,146,996
City
of
Anaheim
Water
System
,
Revenue
,
2022
A
,
5
%
,
10/01/52
...............
8,345,000
8,462,440
c
Anaheim
Public
Financing
Authority
,
City
of
Anaheim
,
Revenue,
Sub.
Lien
,
1997
C
,
AG
Insured
,
2.19
%,
9/01/26
.......
29,430,000
29,107,356
City
of
Anaheim
,
Revenue,
Sub.
Lien
,
1997
C
,
AG
Insured
,
2.26
%,
9/01/27
.......
22,860,000
22,104,164
City
of
Anaheim
,
Revenue,
Sub.
Lien
,
1997
C
,
AG
Insured
,
2.32
%,
9/01/28
.......
14,425,000
13,620,385
City
of
Anaheim
,
Revenue,
Sub.
Lien
,
1997
C
,
AG
Insured
,
2.34
%,
9/01/29
.......
24,810,000
22,874,741
City
of
Anaheim
,
Revenue,
Sub.
Lien
,
1997
C
,
AG
Insured
,
2.54
%,
9/01/32
.......
13,665,000
11,604,170
City
of
Anaheim
,
Revenue,
Sub.
Lien
,
1997
C
,
AG
Insured
,
2.64
%,
9/01/33
.......
37,070,000
30,473,208
City
of
Anaheim
,
Revenue,
Sub.
Lien
,
1997
C
,
AG
Insured
,
2.75
%,
9/01/34
.......
24,970,000
19,829,446
City
of
Anaheim
,
Revenue,
Sub.
Lien
,
1997
C
,
AG
Insured
,
ETM,
2.84
%,
3/01/37
..
15,080,000
11,086,885
c
Anaheim
Union
High
School
District
,
GO
,
2002
A
,
AG
Insured
,
2.13
%,
8/01/26
.....
8,570,000
8,493,739
Bay
Area
Toll
Authority
,
Revenue
,
2017
S-7
,
Refunding
,
4
%
,
4/01/42
.............................
119,305,000
119,564,631
Revenue
,
2017
S-7
,
Refunding
,
4
%
,
4/01/47
.............................
23,330,000
22,694,218
Revenue
,
2017
S-7
,
Refunding
,
4
%
,
4/01/49
.............................
13,625,000
13,109,600
d
Revenue
,
2021
A
,
Refunding
,
Mandatory
Put
,
2
%
,
4/01/28
...................
12,000,000
11,791,234
Beaumont
Public
Improvement
Authority
,
Special
Tax
,
2025
B
,
5
%
,
9/01/55
........
1,250,000
1,265,252
Beaumont
Unified
School
District
,
c
GO
,
2011
C
,
AG
Insured
,
3.83
%,
8/01/40
................................
11,000,000
6,394,177
Community
Facilities
District
No.
2022-1
Improvement
Area
No.
1
,
Special
Tax
,
2025
,
4.125
%
,
9/01/40
.................................................
280,000
284,356
Community
Facilities
District
No.
2022-1
Improvement
Area
No.
1
,
Special
Tax
,
2025
,
4.375
%
,
9/01/45
.................................................
435,000
428,710
Community
Facilities
District
No.
2022-1
Improvement
Area
No.
1
,
Special
Tax
,
2025
,
4.5
%
,
9/01/50
...................................................
640,000
622,795
Community
Facilities
District
No.
2022-1
Improvement
Area
No.
1
,
Special
Tax
,
2025
,
4.5
%
,
9/01/55
...................................................
910,000
874,346
Community
Facilities
District
No.
2022-1
Improvement
Area
No.
2
,
Special
Tax
,
2025
,
4.125
%
,
9/01/40
.................................................
310,000
314,822
Community
Facilities
District
No.
2022-1
Improvement
Area
No.
2
,
Special
Tax
,
2025
,
4.375
%
,
9/01/45
.................................................
875,000
862,347
Franklin
California
Tax-Free
Income
Fund
Schedule
of
Investments
Annual
Report
The
accompanying
notes
are
an
integral
part
of
these
financial
statements.
a
a
Principal
Amount
a
Value
a
a
a
a
a
Municipal
Bonds
(continued)
California
(continued)
Beaumont
Unified
School
District,
(continued)
Community
Facilities
District
No.
2022-1
Improvement
Area
No.
2
,
Special
Tax
,
2025
,
5
%
,
9/01/50
....................................................
$
1,000,000
$
1,022,529
Community
Facilities
District
No.
2022-1
Improvement
Area
No.
2
,
Special
Tax
,
2025
,
5
%
,
9/01/55
....................................................
1,000,000
1,018,136
Burbank-Glendale-Pasadena
Airport
Authority
Brick
Campaign
,
Revenue,
Senior
Lien
,
2024
B
,
5.25
%
,
7/01/49
............................
6,750,000
7,161,189
Revenue,
Senior
Lien
,
2024
B
,
5.25
%
,
7/01/54
............................
8,500,000
8,935,352
Cabrillo
Unified
School
District
,
GO
,
2018
A
,
5
%
,
8/01/45
.....................
4,245,000
4,280,684
California
Affordable
Housing
Agency
,
Butte
County
Housing
Authority
,
Revenue
,
2020
A
,
4
%
,
10/01/40
..............
1,580,000
1,609,670
Butte
County
Housing
Authority
,
Revenue
,
2020
A
,
4
%
,
10/01/45
..............
1,930,000
1,870,952
Butte
County
Housing
Authority
,
Revenue
,
2020
A
,
4
%
,
10/01/50
..............
1,855,000
1,723,026
California
Community
Choice
Financing
Authority
,
d
Revenue
,
2022
A-1
,
Mandatory
Put
,
4
%
,
8/01/28
..........................
100,000,000
102,399,170
d
Revenue
,
2023
C
,
Mandatory
Put
,
5.25
%
,
10/01/31
........................
122,575,000
131,795,668
d
Revenue
,
2023
E-1
,
Mandatory
Put
,
5
%
,
3/01/31
..........................
38,855,000
42,043,639
d
Revenue
,
2023
G-1
,
Mandatory
Put
,
5.25
%
,
4/01/30
.......................
23,500,000
25,354,042
d
Revenue
,
2024
B
,
Mandatory
Put
,
5
%
,
12/01/32
...........................
69,000,000
72,963,139
d
Revenue
,
2024
D
,
Mandatory
Put
,
5
%
,
9/01/32
...........................
70,000,000
77,497,532
d
Revenue
,
2024
E
,
Mandatory
Put
,
5
%
,
9/01/32
............................
90,000,000
98,508,402
d
Revenue
,
2025
A
,
Mandatory
Put
,
5
%
,
5/01/35
............................
6,000,000
6,433,531
d
Revenue
,
2025
B
,
Mandatory
Put
,
5
%
,
11/01/35
...........................
15,585,000
17,327,450
d
Revenue
,
2025
C
,
Mandatory
Put
,
5
%
,
10/01/33
...........................
47,500,000
51,573,438
Revenue
,
2025
G
,
5
%
,
12/01/35
.......................................
22,800,000
25,702,160
d
Revenue
,
2026
A-1
,
Mandatory
Put
,
5
%
,
2/01/36
..........................
55,000,000
61,087,323
Revenue
,
2026
B
,
5
%
,
3/01/36
........................................
92,820,000
101,252,827
California
Community
College
Financing
Authority
,
Revenue
,
2001
A
,
NATL
Insured
,
5.125
%
,
4/01/31
.........................
880,000
881,702
NCCD-Orange
Coast
Properties
LLC
,
Revenue
,
2018
,
5.25
%
,
5/01/53
..........
8,150,000
8,228,707
e
California
Community
Housing
Agency
,
Aster
Apartments
,
Revenue,
Senior
Lien
,
144A,
2021
A-1
,
4
%
,
2/01/56
..........
5,235,000
4,448,632
Brio
Apartments
&
Next
on
Lex
Apartments
,
Revenue,
Senior
Lien
,
144A,
2021
A-1
,
4
%
,
2/01/56
....................................................
35,015,000
30,095,781
Exchange
at
Bayfront
Apartments
,
Revenue,
Senior
Lien
,
144A,
201
A-1
T
,
4.25
%
,
2/01/38
........................................................
7,095,000
6,407,013
Exchange
at
Bayfront
Apartments
,
Revenue,
Senior
Lien
,
144A,
2021
A-1
,
3
%
,
2/01/57
........................................................
59,855,000
37,854,966
Fountains
at
Emerald
Park
,
Revenue,
Junior
Lien
,
144A,
2021
A-2
,
4
%
,
8/01/46
...
14,740,000
12,932,525
Fountains
at
Emerald
Park
,
Revenue,
Senior
Lien
,
144A,
2021
A-1
,
3
%
,
8/01/56
..
46,440,000
32,502,409
K
Street
Flats
,
Revenue
,
144A,
2021
A-1
,
3
%
,
2/01/57
......................
47,500,000
33,026,645
Summit
at
Sausalito
Apartments
,
Revenue
,
144A,
2021
A-1
,
3
%
,
2/01/57
........
16,260,000
11,305,542
Twin
Creek
Apartments
,
Revenue
,
144A,
2022
A-1
,
4.5
%
,
8/01/52
.............
29,275,000
22,458,457
c
Twin
Creek
Apartments
,
Revenue,
Senior
Lien
,
144A,
2022
A-2
,
6.311
%,
8/01/65
..
79,990,000
3,230,476
Verdant
at
Green
Valley
Apartments
,
Revenue
,
144A,
2019
A
,
5
%
,
8/01/49
.......
15,765,000
14,834,401
California
County
Tobacco
Securitization
Agency
,
Gold
Country
Settlement
Funding
Corp.
,
Revenue
,
2020
A
,
Refunding
,
4
%
,
6/01/40
1,120,000
1,096,108
Gold
Country
Settlement
Funding
Corp.
,
Revenue
,
2020
A
,
Refunding
,
4
%
,
6/01/49
2,000,000
1,784,943
Kern
County
Tobacco
Funding
Corp.
,
Revenue
,
2014
,
Refunding
,
5
%
,
6/01/34
....
7,080,000
7,080,933
Kern
County
Tobacco
Funding
Corp.
,
Revenue
,
2014
,
Refunding
,
5
%
,
6/01/40
....
17,650,000
17,506,675
Los
Angeles
County
Securitization
Corp.
,
Revenue,
Senior
Lien
,
2020
A
,
Refunding
,
4
%
,
6/01/49
....................................................
3,525,000
3,143,684
Merced
County
Tobacco
Funding
Corp.
,
Revenue,
Senior
Lien
,
2020
A
,
Refunding
,
4
%
,
6/01/36
....................................................
470,000
474,026
Merced
County
Tobacco
Funding
Corp.
,
Revenue,
Senior
Lien
,
2020
A
,
Refunding
,
4
%
,
6/01/38
....................................................
530,000
528,449
Franklin
California
Tax-Free
Income
Fund
Schedule
of
Investments
The
accompanying
notes
are
an
integral
part
of
these
financial
statements.
Annual
Report
a
a
Principal
Amount
a
Value
a
a
a
a
a
Municipal
Bonds
(continued)
California
(continued)
California
County
Tobacco
Securitization
Agency,
(continued)
Merced
County
Tobacco
Funding
Corp.
,
Revenue,
Senior
Lien
,
2020
A
,
Refunding
,
4
%
,
6/01/40
....................................................
$
625,000
$
611,668
Merced
County
Tobacco
Funding
Corp.
,
Revenue,
Senior
Lien
,
2020
A
,
Refunding
,
4
%
,
6/01/42
....................................................
100,000
97,343
Sonoma
County
Securitization
Corp.
,
Revenue
,
2020
A
,
Refunding
,
4
%
,
6/01/35
..
350,000
354,852
Sonoma
County
Securitization
Corp.
,
Revenue
,
2020
A
,
Refunding
,
4
%
,
6/01/36
..
600,000
605,140
Sonoma
County
Securitization
Corp.
,
Revenue
,
2020
A
,
Refunding
,
4
%
,
6/01/37
..
530,000
531,339
Sonoma
County
Securitization
Corp.
,
Revenue
,
2020
A
,
Refunding
,
4
%
,
6/01/38
..
790,000
791,218
Sonoma
County
Securitization
Corp.
,
Revenue
,
2020
A
,
Refunding
,
4
%
,
6/01/39
..
620,000
612,431
Sonoma
County
Securitization
Corp.
,
Revenue
,
2020
A
,
Refunding
,
4
%
,
6/01/40
..
830,000
812,294
Sonoma
County
Securitization
Corp.
,
Revenue
,
2020
A
,
Refunding
,
4
%
,
6/01/49
..
3,520,000
3,137,543
Sonoma
County
Securitization
Corp.
,
Revenue
,
2020
B-1
,
Refunding
,
5
%
,
6/01/49
.
345,000
345,551
Stanislaus
County
Tobacco
Funding
Corp.
,
Revenue
,
2002
A
,
5.875
%
,
6/01/43
...
2,115,000
2,117,643
California
Educational
Facilities
Authority
,
Art
Center
College
of
Design
,
Revenue
,
2022
A
,
4
%
,
12/01/40
................
1,295,000
1,276,973
Art
Center
College
of
Design
,
Revenue
,
2022
A
,
4
%
,
12/01/41
................
1,345,000
1,310,587
Art
Center
College
of
Design
,
Revenue
,
2022
A
,
4
%
,
12/01/42
................
1,400,000
1,343,664
Art
Center
College
of
Design
,
Revenue
,
2022
A
,
4
%
,
12/01/46
................
3,000,000
2,745,156
Art
Center
College
of
Design
,
Revenue
,
2022
A
,
4
%
,
12/01/50
................
2,675,000
2,350,757
Art
Center
College
of
Design
,
Revenue
,
2022
A
,
3
%
,
12/01/51
................
650,000
464,351
Chapman
University
,
Revenue
,
2021
A
,
Refunding
,
5
%
,
4/01/31
...............
475,000
543,558
Leland
Stanford
Junior
University
(The)
,
Revenue
,
T-1
,
5
%
,
3/15/39
............
2,815,000
3,556,399
Leland
Stanford
Junior
University
(The)
,
Revenue
,
U-1
,
5.25
%
,
4/01/40
.........
5,000,000
6,437,050
Leland
Stanford
Junior
University
(The)
,
Revenue
,
U-6
,
5
%
,
5/01/45
............
7,000,000
8,405,324
Leland
Stanford
Junior
University
(The)
,
Revenue
,
V-1
,
5
%
,
5/01/49
............
20,850,000
24,225,135
Loma
Linda
University
,
Revenue
,
2017
A
,
Refunding
,
5
%
,
4/01/47
.............
11,000,000
11,055,142
c
Loyola
Marymount
University
,
Revenue
,
2001
A
,
NATL
Insured
,
2.39
%,
10/01/26
..
7,620,000
7,514,356
c
Loyola
Marymount
University
,
Revenue
,
2001
A
,
NATL
Insured
,
2.45
%,
10/01/27
..
7,365,000
7,086,582
c
Loyola
Marymount
University
,
Revenue
,
2001
A
,
NATL
Insured
,
2.51
%,
10/01/28
..
4,120,000
3,863,570
c
Loyola
Marymount
University
,
Revenue
,
2001
A
,
NATL
Insured
,
2.57
%,
10/01/30
..
5,685,000
5,059,611
c
Loyola
Marymount
University
,
Revenue
,
2001
A
,
NATL
Insured
,
2.65
%,
10/01/31
..
7,615,000
6,579,930
c
Loyola
Marymount
University
,
Revenue
,
2001
A
,
NATL
Insured
,
2.75
%,
10/01/32
..
7,615,000
6,370,366
c
Santa
Clara
University
,
Revenue
,
1999
,
AMBAC
Insured
,
2.17
%,
9/01/26
........
655,000
647,883
St.
Mary's
College
of
California
,
Revenue
,
2023
A
,
Refunding
,
5.5
%
,
10/01/53
....
10,850,000
10,819,686
University
of
Redlands
,
Revenue
,
2022
A
,
5
%
,
10/01/44
.....................
3,835,000
3,934,366
University
of
Redlands
,
Revenue
,
2022
A
,
5
%
,
10/01/52
.....................
18,790,000
18,842,076
University
of
San
Francisco
,
Revenue
,
2018
A
,
5
%
,
10/01/48
.................
10,000,000
10,062,971
f
University
of
Southern
California
,
Revenue
,
2025
A
,
5
%
,
10/01/55
.............
50,000,000
53,133,915
California
Enterprise
Development
Authority
,
Castilleja
School
Foundation
,
Revenue
,
2024
,
5
%
,
6/01/49
...................
2,800,000
2,954,910
Provident
Group-SDSU
Properties
LLC
,
Revenue,
First
Tier
,
2020
A
,
5
%
,
8/01/40
..
650,000
679,825
Provident
Group-SDSU
Properties
LLC
,
Revenue,
First
Tier
,
2020
A
,
5
%
,
8/01/45
..
650,000
665,544
Provident
Group-SDSU
Properties
LLC
,
Revenue,
First
Tier
,
2020
A
,
5
%
,
8/01/50
..
650,000
658,294
Provident
Group-SDSU
Properties
LLC
,
Revenue,
First
Tier
,
2020
A
,
5
%
,
8/01/55
..
3,175,000
3,217,718
Provident
Group-SDSU
Properties
LLC
,
Revenue,
First
Tier
,
2020
A
,
5
%
,
8/01/57
..
500,000
504,696
California
Health
Facilities
Financing
Authority
,
Adventist
Health
System/West
Obligated
Group
,
Revenue
,
2024
A
,
5
%
,
12/01/28
..
24,200,000
25,686,797
Cedars-Sinai
Medical
Center
Obligated
Group
,
Revenue
,
2021
A
,
Refunding
,
5
%
,
8/15/41
........................................................
5,000,000
5,501,383
Children's
Hospital
Los
Angeles
Obligated
Group
,
Revenue
,
2017
A
,
Refunding
,
5
%
,
8/15/42
........................................................
14,370,000
14,499,777
Children's
Hospital
Los
Angeles
Obligated
Group
,
Revenue
,
2017
A
,
Refunding
,
5
%
,
8/15/47
........................................................
7,750,000
7,703,570
CommonSpirit
Health
Obligated
Group
,
Revenue
,
2020
A
,
Refunding
,
4
%
,
4/01/36
.
13,220,000
13,722,245
CommonSpirit
Health
Obligated
Group
,
Revenue
,
2020
A
,
Refunding
,
4
%
,
4/01/37
.
5,550,000
5,715,047
CommonSpirit
Health
Obligated
Group
,
Revenue
,
2020
A
,
Refunding
,
4
%
,
4/01/38
.
7,075,000
7,258,521
Franklin
California
Tax-Free
Income
Fund
Schedule
of
Investments
Annual
Report
The
accompanying
notes
are
an
integral
part
of
these
financial
statements.
a
a
Principal
Amount
a
Value
a
a
a
a
a
Municipal
Bonds
(continued)
California
(continued)
California
Health
Facilities
Financing
Authority,
(continued)
CommonSpirit
Health
Obligated
Group
,
Revenue
,
2020
A
,
Refunding
,
3
%
,
4/01/44
.
$
4,340,000
$
3,804,334
El
Camino
Hospital
LP
,
Revenue
,
2017
,
4.125
%
,
2/01/47
....................
11,000,000
10,825,742
El
Camino
Hospital
LP
,
Revenue
,
2017
,
5
%
,
2/01/47
.......................
12,500,000
12,644,576
Episcopal
Communities
&
Services
for
Seniors
Obligated
Group
,
Revenue
,
2024
B
,
5.25
%
,
11/15/48
.................................................
1,905,000
1,978,626
Episcopal
Communities
&
Services
for
Seniors
Obligated
Group
,
Revenue
,
2024
B
,
5.25
%
,
11/15/53
.................................................
1,945,000
2,000,458
Episcopal
Communities
&
Services
for
Seniors
Obligated
Group
,
Revenue
,
2024
B
,
5.25
%
,
11/15/58
.................................................
3,100,000
3,176,577
Kaiser
Foundation
Hospitals
,
Revenue
,
2017
A-2
,
4
%
,
11/01/38
...............
25,000,000
25,198,230
Kaiser
Foundation
Hospitals
,
Revenue
,
2017
A-2
,
4
%
,
11/01/44
...............
411,225,000
404,512,081
Kaiser
Foundation
Hospitals
,
Revenue
,
2017
A-2
,
5
%
,
11/01/47
...............
12,500,000
14,092,946
Lucile
Salter
Packard
Children's
Hospital
at
Stanford
Obligated
Group
,
Revenue
,
2016
B
,
5
%
,
8/15/55
..............................................
24,000,000
24,093,485
Lucile
Salter
Packard
Children's
Hospital
at
Stanford
Obligated
Group
,
Revenue
,
2017
A
,
5
%
,
11/15/56
.............................................
10,300,000
10,397,882
On
Lok
Senior
Health
Services
Obligated
Group
,
Revenue
,
2020
,
Refunding
,
5
%
,
8/01/40
........................................................
1,450,000
1,531,599
On
Lok
Senior
Health
Services
Obligated
Group
,
Revenue
,
2020
,
Refunding
,
5
%
,
8/01/50
........................................................
2,375,000
2,400,588
On
Lok
Senior
Health
Services
Obligated
Group
,
Revenue
,
2020
,
Refunding
,
5
%
,
8/01/55
........................................................
850,000
855,707
Providence
St.
Joseph
Health
Obligated
Group
,
Revenue
,
2014
A
,
5
%
,
10/01/38
..
5,110,000
5,117,341
Scripps
Health
Obligated
Group
,
Revenue
,
2024
A
,
Refunding
,
5
%
,
11/15/42
.....
2,500,000
2,824,074
Sutter
Health
Obligated
Group
,
Revenue
,
2016
B
,
5
%
,
11/15/46
...............
42,105,000
42,505,452
Sutter
Health
Obligated
Group
,
Revenue
,
2017
A
,
Refunding
,
4
%
,
11/15/48
......
10,585,000
9,719,937
Sutter
Health
Obligated
Group
,
Revenue
,
2017
A
,
Refunding
,
5
%
,
11/15/48
......
21,690,000
21,940,016
Sutter
Health
Obligated
Group
,
Revenue
,
2018
A
,
4
%
,
11/15/42
...............
11,680,000
11,608,273
Sutter
Health
Obligated
Group
,
Revenue
,
2018
A
,
5
%
,
11/15/48
...............
24,500,000
24,782,407
California
Housing
Finance
Agency
,
Revenue
,
2019-1
,
A
,
4.25
%
,
1/15/35
...................................
41,795,288
44,083,451
Revenue
,
2019-2
,
A
,
4
%
,
3/20/33
......................................
12,948,188
13,487,635
e
Found
Middle
LP
,
Revenue
,
144A,
2024
L
,
5.2
%
,
12/01/27
...................
5,000,000
5,095,430
d,e
Shermanair
Apartments
Owner
LP
,
Revenue
,
144A,
2021
Q-1
,
Mandatory
Put
,
3
%
,
9/01/36
........................................................
22,535,000
20,120,431
e
Shermanair
Apartments
Owner
LP
,
Revenue
,
144A,
2021
Q-2
,
5
%
,
9/01/36
......
1,940,000
1,692,228
California
Infrastructure
&
Economic
Development
Bank
,
California
State
Teachers'
Retirement
System
,
Revenue
,
2019
,
5
%
,
8/01/44
......
12,750,000
13,430,300
California
State
Teachers'
Retirement
System
,
Revenue
,
2019
,
5
%
,
8/01/49
......
16,040,000
16,614,500
California
State
Water
Resources
Control
Board
Water
Pollution
Control
Revolving
Fund
,
Revenue
,
2018
,
5
%
,
10/01/43
..................................
10,000,000
10,375,504
Equitable
School
Revolving
Fund
LLC
Obligated
Group
,
Revenue
,
2020
B
,
4
%
,
11/01/45
.......................................................
850,000
811,231
Equitable
School
Revolving
Fund
LLC
Obligated
Group
,
Revenue
,
2020
B
,
4
%
,
11/01/50
.......................................................
860,000
781,291
Equitable
School
Revolving
Fund
LLC
Obligated
Group
,
Revenue
,
2021
B
,
4
%
,
11/01/56
.......................................................
1,000,000
880,874
Equitable
School
Revolving
Fund
LLC
Obligated
Group
,
Revenue
,
2022
B
,
5
%
,
11/01/47
.......................................................
2,300,000
2,392,860
Equitable
School
Revolving
Fund
LLC
Obligated
Group
,
Revenue
,
2022
B
,
4.125
%
,
11/01/52
.......................................................
3,100,000
2,835,144
Equitable
School
Revolving
Fund
LLC
Obligated
Group
,
Revenue
,
2022
B
,
5
%
,
11/01/57
.......................................................
5,500,000
5,621,369
Los
Angeles
County
Museum
of
Natural
History
Foundation
,
Revenue
,
2020
,
Refunding
,
3
%
,
7/01/50
............................................
18,995,000
14,403,644
d
Museum
Associates
,
Revenue
,
2021
A
,
Refunding
,
Mandatory
Put
,
1.2
%
,
6/01/28
.
15,000,000
14,330,364
Franklin
California
Tax-Free
Income
Fund
Schedule
of
Investments
The
accompanying
notes
are
an
integral
part
of
these
financial
statements.
Annual
Report
a
a
Principal
Amount
a
Value
a
a
a
a
a
Municipal
Bonds
(continued)
California
(continued)
California
Infrastructure
&
Economic
Development
Bank,
(continued)
University
of
California
,
Revenue
,
2017
,
5
%
,
5/15/52
.......................
$
31,305,000
$
31,844,933
California
Municipal
Finance
Authority
,
e
Revenue
,
144A,
2025
A
,
6.375
%
,
8/01/37
...............................
28,300,000
29,935,083
Revenue
,
2025
A
,
6.1
%
,
12/01/37
.....................................
23,875,000
24,319,553
Revenue,
Senior
Lien
,
2017
A
,
Refunding
,
4
%
,
8/15/52
.....................
27,350,000
23,944,605
Special
Tax
,
2024
C
,
5
%
,
9/01/44
......................................
1,100,000
1,145,623
Special
Tax
,
2024
C
,
5
%
,
9/01/54
......................................
1,000,000
1,010,007
Special
Tax
,
2024
E
,
5
%
,
9/01/55
......................................
2,485,000
2,512,737
Special
Tax
,
2025
A
,
5
%
,
9/01/50
......................................
1,350,000
1,370,008
Special
Tax
,
2025
B
,
5.125
%
,
9/01/50
..................................
1,275,000
1,303,130
Special
Tax
,
2025
C
,
5
%
,
9/01/50
......................................
1,275,000
1,285,007
Special
Tax
,
2025
C
,
5
%
,
9/01/55
......................................
1,090,000
1,093,415
g
1717
University
Associates
LLC
,
Revenue
,
2020
A
,
8.5
%
,
6/01/52
.............
11,413,000
9,341,572
g
1717
University
Associates
LLC
,
Revenue
,
2020
A-T
,
9.25
%
,
6/01/52
...........
3,407,000
2,654,026
e
Ascent
613
,
Revenue
,
144A,
2025
A
,
5.25
%
,
1/01/45
.......................
2,500,000
2,561,483
e
Ascent
613
,
Revenue
,
144A,
2025
A
,
5.375
%
,
1/01/55
......................
3,500,000
3,506,762
e
Ascent
613
,
Revenue
,
144A,
2025
A
,
5.5
%
,
1/01/60
........................
2,850,000
2,869,474
Bethany
Home
Society
of
San
Joaquin
County,
Inc.
,
Revenue
,
2023
,
California
Mortgage
Insured
,
5
%
,
11/15/52
.....................................
26,465,000
27,755,002
California
Institute
of
the
Arts
,
Revenue
,
2021
,
4
%
,
10/01/51
.................
2,355,000
2,050,794
Caritas
Corp.
CMFA
Mobile
Home
Park
Financing
2024
Portfolio
,
Revenue
,
2024
A
,
Refunding
,
5
%
,
8/15/49
............................................
1,235,000
1,270,217
Caritas
Corp.
CMFA
Mobile
Home
Park
Financing
2024
Portfolio
,
Revenue
,
2024
A
,
Refunding
,
5
%
,
8/15/54
............................................
1,800,000
1,836,658
Caritas
Corp.
CMFA
Mobile
Home
Park
Financing
2024
Portfolio
,
Revenue
,
2024
A
,
Refunding
,
5
%
,
8/15/59
............................................
2,600,000
2,641,045
Carmel
Valley
Manor
Obligated
Group
,
Revenue
,
2022
,
California
Mortgage
Insured
,
5
%
,
5/15/52
....................................................
17,775,000
18,600,594
e
Century
CityView
LP
,
Revenue
,
144A,
2021
A
,
4
%
,
11/01/36
..................
10,375,000
10,230,933
CHF-Davis
I
LLC
,
Revenue
,
2018
,
5
%
,
5/15/51
...........................
10,000,000
10,026,757
City
of
Elk
Grove
Community
Facilities
District
No.
2023-7
Improvement
Area
No.
1
,
Special
Tax
,
2024
,
5
%
,
9/01/39
......................................
580,000
618,187
City
of
Elk
Grove
Community
Facilities
District
No.
2023-7
Improvement
Area
No.
1
,
Special
Tax
,
2024
,
5
%
,
9/01/44
......................................
900,000
934,783
City
of
Elk
Grove
Community
Facilities
District
No.
2023-7
Improvement
Area
No.
1
,
Special
Tax
,
2024
,
5
%
,
9/01/49
......................................
785,000
804,278
City
of
Elk
Grove
Community
Facilities
District
No.
2023-7
Improvement
Area
No.
1
,
Special
Tax
,
2024
,
5
%
,
9/01/54
......................................
750,000
758,181
Community
Facilities
District
No.
2020-6
,
Special
Tax
,
2025
,
5
%
,
9/01/50
........
1,000,000
1,014,123
Community
Facilities
District
No.
2020-6
,
Special
Tax
,
2025
,
5
%
,
9/01/55
........
1,500,000
1,516,743
Community
Facilities
District
No.
2021-13
,
Special
Tax
,
2025
,
5
%
,
9/01/45
.......
1,085,000
1,117,005
Community
Facilities
District
No.
2021-13
,
Special
Tax
,
2025
,
5
%
,
9/01/50
.......
1,250,000
1,267,654
Community
Facilities
District
No.
2021-13
,
Special
Tax
,
2025
,
5
%
,
9/01/55
.......
1,400,000
1,413,683
Community
Facilities
District
No.
2021-9
Improvement
Area
No.
1
,
Special
Tax
,
2025
,
5.125
%
,
9/01/50
.................................................
1,725,000
1,763,059
Community
Facilities
District
No.
2021-9
Improvement
Area
No.
1
,
Special
Tax
,
2025
,
5.25
%
,
9/01/55
..................................................
2,425,000
2,490,498
Community
Facilities
District
No.
2022-6
Improvement
Area
No.
1
,
Special
Tax
,
2024
,
5
%
,
9/01/44
....................................................
1,000,000
1,035,738
Community
Facilities
District
No.
2022-6
Improvement
Area
No.
1
,
Special
Tax
,
2024
,
5
%
,
9/01/49
....................................................
1,250,000
1,262,162
Community
Facilities
District
No.
2022-6
Improvement
Area
No.
1
,
Special
Tax
,
2024
,
5
%
,
9/01/54
....................................................
4,025,000
4,065,278
Community
Facilities
District
No.
2023-5
Area
No.
2
Improvement
Area
No.
2
,
Special
Tax
,
2025
,
5
%
,
9/01/50
............................................
1,000,000
1,016,205
Franklin
California
Tax-Free
Income
Fund
Schedule
of
Investments
Annual
Report
The
accompanying
notes
are
an
integral
part
of
these
financial
statements.
a
a
Principal
Amount
a
Value
a
a
a
a
a
Municipal
Bonds
(continued)
California
(continued)
California
Municipal
Finance
Authority,
(continued)
Community
Facilities
District
No.
2023-5
Area
No.
2
Improvement
Area
No.
2
,
Special
Tax
,
2025
,
5
%
,
9/01/55
............................................
$
1,120,000
$
1,131,966
Community
Hospitals
of
Central
California
Obligated
Group
,
Revenue
,
2017
A
,
Refunding
,
5
%
,
2/01/42
............................................
15,900,000
16,045,183
Community
Hospitals
of
Central
California
Obligated
Group
,
Revenue
,
2017
A
,
Refunding
,
5
%
,
2/01/47
............................................
19,145,000
19,218,971
Community
Hospitals
of
Central
California
Obligated
Group
,
Revenue
,
2021
A
,
4
%
,
2/01/51
........................................................
7,000,000
6,146,834
Concordia
University
Irvine
,
Revenue
,
2021
,
4
%
,
1/01/37
....................
1,025,000
1,008,478
Concordia
University
Irvine
,
Revenue
,
2021
,
4
%
,
1/01/38
....................
985,000
959,691
Concordia
University
Irvine
,
Revenue
,
2021
,
4
%
,
1/01/39
....................
1,040,000
1,002,959
Concordia
University
Irvine
,
Revenue
,
2021
,
4
%
,
1/01/40
....................
1,175,000
1,111,931
Concordia
University
Irvine
,
Revenue
,
2021
,
4
%
,
1/01/41
....................
1,060,000
984,166
Congregational
Homes,
Inc.
Obligated
Group
,
Revenue
,
2022
A
,
4
%
,
11/15/42
....
450,000
438,990
Congregational
Homes,
Inc.
Obligated
Group
,
Revenue
,
2022
A
,
4
%
,
11/15/52
....
1,000,000
848,448
Congregational
Homes,
Inc.
Obligated
Group
,
Revenue
,
2022
A
,
4
%
,
11/15/56
....
1,100,000
917,615
Eisenhower
Medical
Center
,
Revenue
,
2017
A
,
Refunding
,
5
%
,
7/01/47
.........
9,100,000
9,126,561
Eskaton
Properties,
Inc.
Obligated
Group
,
Revenue
,
2024
,
Refunding
,
5
%
,
11/15/44
1,500,000
1,571,820
e
IH
Citrus
Whittier
LLC
,
Revenue
,
144A,
2023
,
I-A
,
6.25
%
,
1/01/60
.............
29,830,000
29,575,729
e
IH
Citrus
Whittier
LLC
,
Revenue
,
144A,
2023
,
I-B
,
9
%
,
7/01/42
................
1,800,000
1,890,272
e
IH
Lakes
Concord
LLC
,
Revenue
,
144A,
2022
A-1
,
4.375
%
,
12/01/32
...........
22,510,000
22,657,531
e
IH
Parkside
Fairfield
LLC
,
Revenue
,
144A,
2023
A-1
,
6.75
%
,
9/01/53
...........
51,750,000
54,658,743
e
IH
Parkside
Fairfield
LLC
,
Revenue
,
144A,
2023
A-2
,
8
%
,
9/01/27
.............
565,000
578,839
Inland
Christian
Home,
Inc.
,
Revenue
,
2020
,
California
Mortgage
Insured
,
4
%
,
12/01/49
.......................................................
2,670,000
2,522,185
Inland
Counties
Regional
Center,
Inc.
,
Revenue
,
2015
,
Refunding
,
5
%
,
6/15/45
...
23,300,000
23,311,284
Integrity
Housing
Obligated
Group
,
Revenue
,
2022
A-1
,
4.25
%
,
12/01/37
........
81,985,000
69,082,889
LAX
Integrated
Express
Solutions
LLC
,
Revenue,
Senior
Lien
,
2018
A
,
5
%
,
12/31/37
8,500,000
8,757,550
LAX
Integrated
Express
Solutions
LLC
,
Revenue,
Senior
Lien
,
2018
A
,
5
%
,
12/31/38
5,000,000
5,140,634
LAX
Integrated
Express
Solutions
LLC
,
Revenue,
Senior
Lien
,
2018
A
,
5
%
,
12/31/43
46,895,000
47,685,068
LAX
Integrated
Express
Solutions
LLC
,
Revenue,
Senior
Lien
,
2018
A
,
5
%
,
12/31/47
55,745,000
56,050,115
LAX
Integrated
Express
Solutions
LLC
,
Revenue,
Senior
Lien
,
2018
B
,
5
%
,
6/01/48
14,325,000
14,364,251
e
NCCD-Claremont
Properties
LLC
,
Revenue
,
144A,
2023
A
,
Refunding
,
5.25
%
,
7/01/40
........................................................
7,065,000
7,799,712
e
NCCD-Claremont
Properties
LLC
,
Revenue
,
144A,
2023
A
,
Refunding
,
5.5
%
,
7/01/50
21,145,000
22,272,073
e
NCCD-Claremont
Properties
LLC
,
Revenue
,
144A,
2023
A
,
Refunding
,
6
%
,
7/01/53
12,485,000
13,663,578
e
NCCD-Claremont
Properties
LLC
,
Revenue
,
144A,
2023
B
,
Refunding
,
6.5
%
,
7/01/32
........................................................
2,470,000
2,536,311
Northbay
Healthcare
Corp.
Obligated
Group
,
Revenue
,
2017
A
,
5.25
%
,
11/01/41
..
5,500,000
5,523,695
Northbay
Healthcare
Corp.
Obligated
Group
,
Revenue
,
2017
A
,
5
%
,
11/01/47
.....
8,650,000
8,386,934
Northern
California
Retired
Officers
Community
,
Revenue
,
2019
A
,
California
Mortgage
Insured
,
5
%
,
1/01/43
......................................
10,000,000
10,336,960
Northern
California
Retired
Officers
Community
,
Revenue
,
2019
A
,
California
Mortgage
Insured
,
5
%
,
1/01/49
......................................
18,990,000
19,496,403
Palomar
Health
Obligated
Group
,
COP
,
2022
A
,
Refunding
,
AG
Insured
,
5.25
%
,
11/01/52
.......................................................
43,040,000
43,910,669
Porter
1107
LLC
,
Revenue
,
2025
A
,
6.2
%
,
11/01/37
........................
43,500,000
45,203,190
Samuel
Merritt
University
,
Revenue
,
2022
,
5.25
%
,
6/01/53
...................
39,750,000
41,697,416
Scripps
College
,
Revenue
,
2025
,
5.5
%
,
7/01/60
...........................
8,500,000
9,181,289
e
Sierra
Ridge
3600
LLC
,
Revenue
,
144A,
2024
A
,
5.75
%
,
11/01/39
.............
48,675,000
49,710,390
University
of
La
Verne
,
Revenue
,
2017
A
,
Refunding
,
4
%
,
6/01/47
.............
10,500,000
9,749,563
California
Pollution
Control
Financing
Authority
,
e
Channelside
Water
Resources
LP
,
Revenue
,
144A,
2019
,
Refunding
,
5
%
,
7/01/39
.
7,250,000
7,517,675
e
Channelside
Water
Resources
LP
,
Revenue
,
144A,
2019
,
Refunding
,
5
%
,
11/21/45
11,365,000
11,600,498
e
Channelside
Water
Resources
LP
,
Revenue
,
144A,
2023
,
5
%
,
7/01/30
..........
5,200,000
5,620,902
e
Channelside
Water
Resources
LP
,
Revenue
,
144A,
2023
,
5
%
,
7/01/31
..........
3,000,000
3,286,172
Franklin
California
Tax-Free
Income
Fund
Schedule
of
Investments
The
accompanying
notes
are
an
integral
part
of
these
financial
statements.
Annual
Report
a
a
Principal
Amount
a
Value
a
a
a
a
a
Municipal
Bonds
(continued)
California
(continued)
California
Pollution
Control
Financing
Authority,
(continued)
e
Channelside
Water
Resources
LP
,
Revenue
,
144A,
2023
,
5
%
,
7/01/32
..........
$
5,500,000
$
6,105,314
e
Channelside
Water
Resources
LP
,
Revenue
,
144A,
2023
,
5
%
,
7/01/33
..........
6,000,000
6,737,617
e
Channelside
Water
Resources
LP
,
Revenue
,
144A,
2023
,
5
%
,
7/01/34
..........
3,250,000
3,645,638
e
Channelside
Water
Resources
LP
,
Revenue
,
144A,
2023
,
5
%
,
7/01/35
..........
3,250,000
3,627,728
e
Channelside
Water
Resources
LP
,
Revenue
,
144A,
2023
,
5
%
,
7/01/36
..........
2,650,000
2,936,176
e
Channelside
Water
Resources
LP
,
Revenue
,
144A,
2023
,
5
%
,
7/01/37
..........
2,300,000
2,535,810
e
Channelside
Water
Resources
LP
,
Revenue
,
144A,
2023
,
5
%
,
7/01/38
..........
2,000,000
2,189,496
e
Channelside
Water
Resources
LP
,
Revenue
,
144A,
2023
,
5
%
,
11/21/45
.........
2,200,000
2,308,019
San
Jose
Water
Co.
,
Revenue
,
2016
,
4.75
%
,
11/01/46
......................
15,000,000
15,014,091
California
Public
School
District
Financing
Authority
,
Southern
Kern
Unified
School
District
,
Revenue
,
1996
B
,
AG
Insured
,
ETM,
5.9
%
,
9/01/26
..................
220,000
224,132
e
California
School
Finance
Authority
,
Alliance
for
College
Ready
Public
Schools
Obligated
Group
,
Revenue
,
144A,
2024
,
Refunding
,
4
%
,
7/01/34
............................................
445,000
459,030
Alliance
for
College
Ready
Public
Schools
Obligated
Group
,
Revenue
,
144A,
2024
,
Refunding
,
5
%
,
7/01/49
............................................
1,000,000
1,022,575
Alliance
for
College
Ready
Public
Schools
Obligated
Group
,
Revenue
,
144A,
2024
,
Refunding
,
5
%
,
7/01/59
............................................
3,000,000
3,030,235
Aspire
Public
Schools
Obligated
Group
,
Revenue
,
144A,
2021
A
,
2.125
%
,
8/01/31
.
500,000
460,889
Aspire
Public
Schools
Obligated
Group
,
Revenue
,
144A,
2021
A
,
4
%
,
8/01/36
....
325,000
325,406
Aspire
Public
Schools
Obligated
Group
,
Revenue
,
144A,
2021
A
,
4
%
,
8/01/41
....
525,000
498,065
Aspire
Public
Schools
Obligated
Group
,
Revenue
,
144A,
2021
A
,
4
%
,
8/01/51
....
800,000
671,372
Aspire
Public
Schools
Obligated
Group
,
Revenue
,
144A,
2022
A
,
5
%
,
8/01/52
....
2,935,000
2,826,847
Camino
Nuevo
Charter
Academy
Obligated
Group
,
Revenue
,
144A,
2023
A
,
Refunding
,
5
%
,
6/01/43
............................................
1,000,000
1,014,678
Camino
Nuevo
Charter
Academy
Obligated
Group
,
Revenue
,
144A,
2023
A
,
Refunding
,
5.25
%
,
6/01/53
.........................................
1,550,000
1,551,162
Classical
Academy
Obligated
Group
,
Revenue
,
144A,
2022
A
,
Refunding
,
5
%
,
10/01/42
.......................................................
1,325,000
1,375,306
Classical
Academy
Obligated
Group
,
Revenue
,
144A,
2022
A
,
Refunding
,
5
%
,
10/01/52
.......................................................
2,265,000
2,222,634
Classical
Academy
Obligated
Group
,
Revenue
,
144A,
2022
A
,
Refunding
,
5
%
,
10/01/61
.......................................................
3,905,000
3,778,504
Granada
Hills
Charter
High
School
Obligated
Group
,
Revenue
,
144A,
2021
A
,
Refunding
,
4
%
,
7/01/29
............................................
200,000
203,739
Granada
Hills
Charter
High
School
Obligated
Group
,
Revenue
,
144A,
2024
A
,
5
%
,
7/01/64
........................................................
500,000
477,795
Green
Dot
Public
Schools
Obligated
Group
,
Revenue
,
144A,
2022
A
,
Refunding
,
5.75
%
,
8/01/52
..................................................
1,500,000
1,564,401
KIPP
SoCal
Public
Schools
Obligated
Group
,
Revenue
,
144A,
2020
A
,
4
%
,
7/01/40
800,000
786,325
STEM
Preparatory
Schools
-
Obligated
Group
,
Revenue
,
144A,
2023
A
,
5.125
%
,
6/01/53
........................................................
1,000,000
981,680
STEM
Preparatory
Schools
-
Obligated
Group
,
Revenue
,
144A,
2023
A
,
5.375
%
,
5/01/63
........................................................
1,000,000
1,000,567
Value
Schools
,
Revenue
,
144A,
2023
A
,
Refunding
,
5
%
,
7/01/40
..............
550,000
570,812
Value
Schools
,
Revenue
,
144A,
2023
A
,
Refunding
,
5.25
%
,
7/01/48
............
725,000
736,175
California
State
Public
Works
Board
,
Revenue
,
2025
A
,
5
%
,
4/01/50
........................................
23,775,000
25,484,202
State
of
California
,
Revenue
,
2019
C
,
5
%
,
11/01/44
........................
5,000,000
5,276,811
State
of
California
,
Revenue
,
2021
D
,
4
%
,
11/01/35
........................
1,210,000
1,301,096
State
of
California
,
Revenue
,
2025
C
,
5
%
,
11/01/50
........................
13,750,000
14,790,270
California
State
University
,
Revenue
,
2015
A
,
5
%
,
11/01/47
.......................................
150,000
150,141
Revenue
,
2016
A
,
Refunding
,
5
%
,
11/01/36
..............................
3,760,000
3,775,325
d
Revenue
,
2016
B-2
,
Refunding
,
Mandatory
Put
,
0.55
%
,
11/01/26
..............
12,000,000
11,837,796
Revenue
,
2017
A
,
Refunding
,
5
%
,
11/01/42
..............................
12,310,000
12,594,718
Franklin
California
Tax-Free
Income
Fund
Schedule
of
Investments
Annual
Report
The
accompanying
notes
are
an
integral
part
of
these
financial
statements.
a
a
Principal
Amount
a
Value
a
a
a
a
a
Municipal
Bonds
(continued)
California
(continued)
California
State
University,
(continued)
Revenue
,
2017
A
,
Refunding
,
5
%
,
11/01/47
..............................
$
26,185,000
$
26,563,258
Revenue
,
2018
A
,
Refunding
,
5
%
,
11/01/39
..............................
3,675,000
3,901,353
Revenue
,
2018
A
,
Refunding
,
5
%
,
11/01/43
..............................
3,330,000
3,487,856
Revenue
,
2018
A
,
Refunding
,
5
%
,
11/01/48
..............................
17,385,000
17,896,256
Revenue
,
2019
A
,
5
%
,
11/01/44
.......................................
40,010,000
42,295,767
Revenue
,
2019
A
,
5
%
,
11/01/49
.......................................
31,915,000
33,135,570
Revenue
,
2019
A
,
5
%
,
11/01/51
.......................................
45,680,000
47,235,459
Revenue
,
2025
A
,
Refunding
,
4.625
%
,
11/01/56
...........................
32,800,000
33,737,234
Revenue
,
2025
A
,
Refunding
,
5.25
%
,
11/01/56
............................
75,000,000
81,817,537
California
Statewide
Communities
Development
Authority
,
Revenue
,
2024
B-1
,
5
%
,
9/02/44
......................................
2,500,000
2,612,735
Revenue
,
2024
B-1
,
5
%
,
9/02/49
......................................
2,000,000
2,034,796
Revenue
,
2024
B-1
,
5
%
,
9/02/54
......................................
2,500,000
2,533,719
Special
Assessment
,
2024
A
,
5
%
,
9/02/54
...............................
1,290,000
1,315,462
Special
Assessment
,
2025
C-1
,
5
%
,
9/02/50
..............................
4,830,000
4,986,488
Special
Assessment
,
2025
C-1
,
5
%
,
9/02/55
..............................
4,260,000
4,370,751
Special
Tax
,
2023
A
,
5.25
%
,
9/01/51
...................................
3,300,000
3,409,317
Special
Tax
,
2024
C-2
,
4.375
%
,
9/02/40
.................................
1,000,000
1,029,800
Special
Tax
,
2024
C-2
,
4.5
%
,
9/02/45
...................................
1,050,000
1,053,162
Special
Tax
,
2024
C-2
,
4.625
%
,
9/02/50
.................................
2,135,000
2,131,690
Special
Tax
,
2024
C-2
,
4.75
%
,
9/02/55
..................................
2,000,000
1,987,992
Special
Tax
,
2025
A
,
5
%
,
9/02/55
......................................
10,075,000
10,336,929
Special
Tax
,
2025
B
,
5
%
,
9/02/50
......................................
2,840,000
2,932,014
Special
Tax
,
2025
B
,
5
%
,
9/02/55
......................................
2,000,000
2,051,996
Special
Tax
,
2025
C-2
,
5
%
,
9/02/51
....................................
2,300,000
2,370,129
Special
Tax
,
2025
C-2
,
5
%
,
9/02/56
....................................
3,180,000
3,264,567
899
Charleston
,
Revenue
,
2024
,
Refunding
,
California
Mortgage
Insured
,
4.25
%
,
11/01/44
.......................................................
4,320,000
4,386,848
899
Charleston
,
Revenue
,
2024
,
Refunding
,
California
Mortgage
Insured
,
5
%
,
11/01/49
.......................................................
2,500,000
2,658,693
Adventist
Health
System/West
Obligated
Group
,
Revenue
,
2015
A
,
Refunding
,
5
%
,
3/01/35
........................................................
9,250,000
9,258,521
Adventist
Health
System/West
Obligated
Group
,
Revenue
,
2018
A
,
Refunding
,
5
%
,
3/01/48
........................................................
67,585,000
68,150,700
Cedars-Sinai
Medical
Center
Obligated
Group
,
Revenue
,
2018
,
5
%
,
7/01/48
.....
7,980,000
8,183,904
Community
Facilities
District
Improvement
Area
No.
4
,
Special
Tax
,
2024
,
5
%
,
9/01/45
........................................................
1,840,000
1,908,705
Community
Facilities
District
Improvement
Area
No.
4
,
Special
Tax
,
2024
,
5
%
,
9/01/55
........................................................
2,400,000
2,438,491
Community
Facilities
District
No.
2020-02
Improvement
Area
No.
2
,
Special
Tax
,
2022
,
5.25
%
,
9/01/52
.............................................
1,650,000
1,691,079
Community
Facilities
District
No.
2020-2
Improvement
Area
No.
3
,
Special
Tax
,
2024
,
5
%
,
9/01/34
....................................................
345,000
377,805
Community
Facilities
District
No.
2020-2
Improvement
Area
No.
3
,
Special
Tax
,
2024
,
5
%
,
9/01/39
....................................................
745,000
801,612
Community
Facilities
District
No.
2020-2
Improvement
Area
No.
3
,
Special
Tax
,
2024
,
5
%
,
9/01/44
....................................................
1,230,000
1,285,529
Community
Facilities
District
No.
2020-2
Improvement
Area
No.
3
,
Special
Tax
,
2024
,
5
%
,
9/01/49
....................................................
500,000
510,690
Community
Facilities
District
No.
2020-2
Improvement
Area
No.
3
,
Special
Tax
,
2024
,
5
%
,
9/01/54
....................................................
750,000
761,481
Community
Facilities
District
No.
2021-03
,
Special
Tax
,
2024
,
5
%
,
9/01/44
.......
875,000
915,078
Community
Facilities
District
No.
2021-03
,
Special
Tax
,
2024
,
5
%
,
9/01/49
.......
820,000
837,136
Community
Facilities
District
No.
2021-03
,
Special
Tax
,
2024
,
5
%
,
9/01/54
.......
850,000
863,832
Community
Facilities
District
No.
2021-1
,
Special
Tax
,
2023
,
5
%
,
9/01/43
........
1,000,000
1,052,330
Community
Facilities
District
No.
2021-1
,
Special
Tax
,
2023
,
5
%
,
9/01/53
........
1,850,000
1,881,031
Franklin
California
Tax-Free
Income
Fund
Schedule
of
Investments
The
accompanying
notes
are
an
integral
part
of
these
financial
statements.
Annual
Report
a
a
Principal
Amount
a
Value
a
a
a
a
a
Municipal
Bonds
(continued)
California
(continued)
California
Statewide
Communities
Development
Authority,
(continued)
Community
Facilities
District
No.
20220
,
Special
Tax
,
2023
,
5
%
,
9/01/43
.........
$
1,030,000
$
1,083,900
Community
Facilities
District
No.
20220
,
Special
Tax
,
2023
,
5
%
,
9/01/48
.........
1,120,000
1,147,691
Community
Facilities
District
No.
20220
,
Special
Tax
,
2023
,
5
%
,
9/01/53
.........
1,000,000
1,015,512
Community
Facilities
District
No.
2022-03
,
Special
Tax
,
2023
,
5
%
,
9/01/38
.......
1,675,000
1,804,615
Community
Facilities
District
No.
2022-03
,
Special
Tax
,
2023
,
5
%
,
9/01/43
.......
380,000
399,885
Community
Facilities
District
No.
2022-03
,
Special
Tax
,
2023
,
5
%
,
9/01/53
.......
1,250,000
1,269,390
Community
Facilities
District
No.
2022-10
,
Special
Tax
,
2023
,
5.5
%
,
9/01/53
......
1,770,000
1,853,867
Enloe
Medical
Center
Obligated
Group
,
Revenue
,
2022
A
,
AG
Insured
,
5
%
,
8/15/42
600,000
635,210
Enloe
Medical
Center
Obligated
Group
,
Revenue
,
2022
A
,
AG
Insured
,
5.125
%
,
8/15/47
........................................................
880,000
905,728
Enloe
Medical
Center
Obligated
Group
,
Revenue
,
2022
A
,
AG
Insured
,
5.25
%
,
8/15/52
........................................................
11,215,000
11,498,558
Enloe
Medical
Center
Obligated
Group
,
Revenue
,
2022
A
,
AG
Insured
,
5.375
%
,
8/15/57
........................................................
17,930,000
18,465,261
Sequoia
Living,
Inc.
,
Revenue
,
2025
A
,
Refunding
,
California
Mortgage
Insured
,
5
%
,
7/01/50
........................................................
23,000,000
24,393,230
c
Carlsbad
Unified
School
District
,
GO
,
2011
C
,
6.556
%,
8/01/35
.................
33,000,000
41,872,182
Centinela
Valley
Union
High
School
District
,
GO
,
2004
A
,
Refunding
,
NATL
Insured
,
5.5
%
,
8/01/33
....................................................
12,600,000
14,075,431
Central
Valley
Energy
Authority
,
d
Revenue
,
2025
,
Mandatory
Put
,
5
%
,
8/01/35
.............................
50,000,000
55,535,790
Revenue
,
2026
,
5
%
,
8/01/34
.........................................
32,660,000
35,938,826
Chino
Community
Facilities
District
,
City
of
Chino
Community
Facilities
District
No.
2003-3
Improvement
Area
No.
10
,
Special
Tax
,
2024
,
4
%
,
9/01/29
......................................
285,000
291,996
City
of
Chino
Community
Facilities
District
No.
2003-3
Improvement
Area
No.
10
,
Special
Tax
,
2024
,
5
%
,
9/01/34
......................................
650,000
720,684
City
of
Chino
Community
Facilities
District
No.
2003-3
Improvement
Area
No.
10
,
Special
Tax
,
2024
,
5
%
,
9/01/39
......................................
830,000
903,767
City
of
Chino
Community
Facilities
District
No.
2003-3
Improvement
Area
No.
10
,
Special
Tax
,
2024
,
5
%
,
9/01/44
......................................
795,000
832,564
City
of
Chino
Community
Facilities
District
No.
2003-3
Improvement
Area
No.
10
,
Special
Tax
,
2024
,
5
%
,
9/01/49
......................................
675,000
689,581
City
of
Chino
Community
Facilities
District
No.
2003-3
Improvement
Area
No.
10
,
Special
Tax
,
2024
,
5
%
,
9/01/54
......................................
740,000
751,525
City
of
Chino
Community
Facilities
District
No.
2003-3
Improvement
Area
No.
8
,
Special
Tax
,
2021
,
4
%
,
9/01/41
......................................
1,710,000
1,713,880
City
of
Chino
Community
Facilities
District
No.
2003-3
Improvement
Area
No.
8
,
Special
Tax
,
2021
,
4
%
,
9/01/46
......................................
1,000,000
938,401
City
of
Chino
Community
Facilities
District
No.
2003-3
Improvement
Area
No.
8
,
Special
Tax
,
2021
,
4
%
,
9/01/51
......................................
1,250,000
1,107,154
City
of
Chino
Community
Facilities
District
No.
2003-3
Improvement
Area
No.
9
,
Special
Tax
,
2022
,
5
%
,
9/01/37
......................................
2,740,000
2,980,021
City
of
Chino
Community
Facilities
District
No.
2003-3
Improvement
Area
No.
9
,
Special
Tax
,
2022
,
5.25
%
,
9/01/42
...................................
2,000,000
2,142,966
City
of
Chino
Community
Facilities
District
No.
2003-3
Improvement
Area
No.
9
,
Special
Tax
,
2022
,
5.375
%
,
9/01/47
...................................
2,000,000
2,095,826
City
of
Chino
Community
Facilities
District
No.
2003-3
Improvement
Area
No.
9
,
Special
Tax
,
2022
,
5.375
%
,
9/01/52
...................................
2,695,000
2,792,878
City
of
Chino
Community
Facilities
District
No.
2022-1
,
Special
Tax
,
2025
,
5.25
%
,
9/01/55
........................................................
2,000,000
2,069,818
Chino
Valley
Unified
School
District
,
GO
,
2020
B
,
3.375
%
,
8/01/50
..............
20,500,000
17,246,176
City
&
County
of
San
Francisco
,
GO
,
2022
R-1
,
Refunding
,
5
%
,
6/15/26
.................................
5,000,000
5,046,067
e
District
No.
2020-1
Development
,
Special
Tax
,
144A,
2023
A
,
5.75
%
,
9/01/50
.....
850,000
897,296
e
District
No.
2020-1
Office
,
Special
Tax
,
144A,
2023
B
,
5.75
%
,
9/01/53
..........
1,835,000
1,931,693
Franklin
California
Tax-Free
Income
Fund
Schedule
of
Investments
Annual
Report
The
accompanying
notes
are
an
integral
part
of
these
financial
statements.
a
a
Principal
Amount
a
Value
a
a
a
a
a
Municipal
Bonds
(continued)
California
(continued)
City
of
Beaumont
,
Community
Facilities
District
No.
2016-3
,
Special
Tax
,
2023
,
5
%
,
9/01/38
........
$
500,000
$
544,370
Community
Facilities
District
No.
2016-3
,
Special
Tax
,
2023
,
5
%
,
9/01/43
........
625,000
661,831
Community
Facilities
District
No.
2016-3
,
Special
Tax
,
2023
,
5
%
,
9/01/48
........
745,000
764,369
Community
Facilities
District
No.
2016-3
,
Special
Tax
,
2023
,
5
%
,
9/01/53
........
950,000
961,748
Community
Facilities
District
No.
2021-1
,
Special
Tax
,
2024
,
5
%
,
9/01/39
........
400,000
429,357
Community
Facilities
District
No.
2021-1
,
Special
Tax
,
2024
,
5
%
,
9/01/44
........
650,000
681,042
Community
Facilities
District
No.
2021-1
,
Special
Tax
,
2024
,
5
%
,
9/01/49
........
1,000,000
1,023,285
Community
Facilities
District
No.
2021-1
,
Special
Tax
,
2024
,
5
%
,
9/01/54
........
1,500,000
1,523,908
Community
Facilities
District
No.
93-1
Improvement
Area
No.
17D
,
Special
Tax
,
2024
,
5
%
,
9/01/45
....................................................
1,000,000
1,036,624
Community
Facilities
District
No.
93-1
Improvement
Area
No.
17D
,
Special
Tax
,
2024
,
5
%
,
9/01/49
....................................................
1,000,000
1,023,713
Community
Facilities
District
No.
93-1
Improvement
Area
No.
17D
,
Special
Tax
,
2024
,
5
%
,
9/01/54
....................................................
1,390,000
1,416,511
City
of
Corona
,
Community
Facilities
District
No.
2018-1
Improvement
Area
No.
1
,
Special
Tax
,
2020
,
4
%
,
9/01/45
....................................................
650,000
614,811
Community
Facilities
District
No.
2018-1
Improvement
Area
No.
1
,
Special
Tax
,
2020
,
4
%
,
9/01/50
....................................................
1,500,000
1,339,016
City
of
Dixon
,
Community
Facilities
District
No.
2019-1
Improvement
Area
No.
2
,
Special
Tax
,
2024
,
5
%
,
9/01/54
.......................................
1,000,000
1,017,672
City
of
Dublin
,
Community
Facilities
District
No.
2015-1
Improvement
Area
No.
4
,
Special
Tax
,
2022
,
5.25
%
,
9/01/42
..................................................
2,005,000
2,136,356
Community
Facilities
District
No.
2015-1
Improvement
Area
No.
4
,
Special
Tax
,
2022
,
5.5
%
,
9/01/47
...................................................
2,630,000
2,774,345
Community
Facilities
District
No.
2015-1
Improvement
Area
No.
4
,
Special
Tax
,
2022
,
5.5
%
,
9/01/51
...................................................
3,040,000
3,171,320
Community
Facilities
District
No.
2015-1
Improvement
Area
No.
5
,
Special
Tax
,
2023
,
5.125
%
,
9/01/43
.................................................
1,275,000
1,345,926
City
of
Fillmore
,
Community
Facilities
District
No.
5
Improvement
Area
B
,
Special
Tax
,
2023
,
5
%
,
9/01/38
........................................................
1,000,000
1,079,120
Community
Facilities
District
No.
5
Improvement
Area
B
,
Special
Tax
,
2023
,
5
%
,
9/01/43
........................................................
1,100,000
1,154,674
Community
Facilities
District
No.
5
Improvement
Area
B
,
Special
Tax
,
2023
,
5
%
,
9/01/48
........................................................
2,375,000
2,435,234
Community
Facilities
District
No.
5
Improvement
Area
B
,
Special
Tax
,
2023
,
5
%
,
9/01/53
........................................................
3,740,000
3,802,733
City
of
Fontana
,
Community
Facilities
District
No.
85
,
Special
Tax
,
2020
,
4
%
,
9/01/45
...........
850,000
797,629
Community
Facilities
District
No.
85
,
Special
Tax
,
2020
,
4
%
,
9/01/50
...........
900,000
809,436
Community
Facilities
District
No.
88
,
Special
Tax
,
2020
,
4
%
,
9/01/45
...........
1,100,000
1,037,698
Community
Facilities
District
No.
88
,
Special
Tax
,
2020
,
4
%
,
9/01/51
...........
1,545,000
1,370,527
Community
Facilities
District
No.
89
,
Special
Tax
,
2020
,
4
%
,
9/01/40
...........
750,000
755,589
Community
Facilities
District
No.
89
,
Special
Tax
,
2020
,
4
%
,
9/01/51
...........
1,500,000
1,344,891
Community
Facilities
District
No.
90
,
Special
Tax
,
2021
,
4
%
,
9/01/41
...........
530,000
531,723
Community
Facilities
District
No.
90
,
Special
Tax
,
2021
,
4
%
,
9/01/46
...........
475,000
448,794
Community
Facilities
District
No.
90
,
Special
Tax
,
2021
,
4
%
,
9/01/51
...........
1,825,000
1,641,297
Community
Facilities
District
No.
99
,
Special
Tax
,
2023
,
5
%
,
9/01/45
...........
600,000
621,282
Community
Facilities
District
No.
99
,
Special
Tax
,
2023
,
5
%
,
9/01/53
...........
500,000
507,989
Community
Facilities
District
No.
109
,
Special
Tax
,
2024
,
5
%
,
9/01/44
..........
1,000,000
1,043,637
Community
Facilities
District
No.
109
,
Special
Tax
,
2024
,
5
%
,
9/01/49
..........
1,100,000
1,122,988
Community
Facilities
District
No.
109
,
Special
Tax
,
2024
,
5
%
,
9/01/54
..........
1,400,000
1,420,827
Community
Facilities
District
No.
112
,
Special
Tax
,
2024
,
5
%
,
9/01/39
...........
1,000,000
1,082,076
Community
Facilities
District
No.
112
,
Special
Tax
,
2024
,
5
%
,
9/01/44
...........
2,300,000
2,400,364
Franklin
California
Tax-Free
Income
Fund
Schedule
of
Investments
The
accompanying
notes
are
an
integral
part
of
these
financial
statements.
Annual
Report
a
a
Principal
Amount
a
Value
a
a
a
a
a
Municipal
Bonds
(continued)
California
(continued)
City
of
Fontana,
(continued)
Community
Facilities
District
No.
112
,
Special
Tax
,
2024
,
5
%
,
9/01/54
...........
$
2,000,000
$
2,029,753
City
of
Laguna
Beach
,
Underground
Utility
Assessment
District
No.
2014-2
,
Special
Assessment
,
4.375
%
,
9/02/39
........................................................
1,685,000
1,757,770
Underground
Utility
Assessment
District
No.
2014-2
,
Special
Assessment
,
4.625
%
,
9/02/44
........................................................
1,000,000
1,013,727
City
of
Lake
Elsinore
,
Community
Facilities
District
No.
2006-6
,
Special
Tax
,
2022
,
4.75
%
,
9/01/52
......
1,000,000
977,963
Community
Facilities
District
No.
2019-2
,
Special
Tax
,
2024
,
5
%
,
9/01/49
........
1,000,000
1,022,304
Community
Facilities
District
No.
2019-2
,
Special
Tax
,
2024
,
5
%
,
9/01/54
........
1,000,000
1,015,574
Community
Facilities
District
No.
2022-1
,
Special
Tax
,
2025
,
5
%
,
9/01/50
........
1,000,000
1,020,798
Community
Facilities
District
No.
2022-1
,
Special
Tax
,
2025
,
5
%
,
9/01/55
........
1,500,000
1,522,870
City
of
Lincoln
,
Community
Facilities
District
No.
2006-1
Area
No.
1
,
Special
Tax
,
2021
,
Refunding
,
4
%
,
9/01/39
....................................................
290,000
290,050
Community
Facilities
District
No.
2006-1
Area
No.
1
,
Special
Tax
,
2021
,
Refunding
,
4
%
,
9/01/40
....................................................
160,000
159,336
Community
Facilities
District
No.
2006-1
Area
No.
1
,
Special
Tax
,
2021
,
Refunding
,
4
%
,
9/01/43
....................................................
320,000
309,054
Community
Facilities
District
No.
2019-1
,
Special
Tax
,
2022
,
5
%
,
9/01/42
........
2,015,000
2,101,162
Community
Facilities
District
No.
2019-1
,
Special
Tax
,
2022
,
5
%
,
9/01/47
........
3,430,000
3,507,105
Community
Facilities
District
No.
2019-1
,
Special
Tax
,
2022
,
5
%
,
9/01/52
........
2,090,000
2,113,163
Community
Facilities
District
No.
2019-1
,
Special
Tax
,
2025
,
5
%
,
9/01/55
........
1,400,000
1,414,957
City
of
Long
Beach
,
Harbor
,
Revenue
,
2017
C
,
Refunding
,
5
%
,
5/15/47
.........................
15,660,000
15,912,506
Harbor
,
Revenue
,
2019
A
,
5
%
,
5/15/44
..................................
15,045,000
15,824,193
Harbor
,
Revenue
,
2019
A
,
5
%
,
5/15/49
..................................
8,705,000
9,043,619
City
of
Los
Angeles
,
Department
of
Airports
,
Revenue
,
2018
C
,
5
%
,
5/15/37
.....................
9,550,000
9,862,800
Department
of
Airports
,
Revenue
,
2018
C
,
5
%
,
5/15/44
.....................
39,405,000
40,064,971
Department
of
Airports
,
Revenue
,
2019
A
,
Refunding
,
5
%
,
5/15/49
.............
10,000,000
10,156,213
Department
of
Airports
,
Revenue
,
2019
C
,
5
%
,
5/15/39
.....................
2,305,000
2,482,749
Department
of
Airports
,
Revenue
,
2020
A
,
Refunding
,
5
%
,
5/15/35
.............
10,005,000
11,063,505
Department
of
Airports
,
Revenue
,
2020
A
,
Refunding
,
5
%
,
5/15/36
.............
6,000,000
6,608,063
Department
of
Airports
,
Revenue
,
2020
A
,
Refunding
,
5
%
,
5/15/37
.............
5,000,000
5,483,930
Department
of
Airports
,
Revenue
,
2020
A
,
Refunding
,
5
%
,
5/15/38
.............
15,925,000
17,403,090
Department
of
Airports
,
Revenue
,
2020
A
,
Refunding
,
5
%
,
5/15/40
.............
22,485,000
24,414,921
Department
of
Airports
,
Revenue
,
2021
D
,
5
%
,
5/15/33
.....................
4,735,000
5,344,625
Department
of
Airports
,
Revenue
,
2021
D
,
5
%
,
5/15/34
.....................
2,500,000
2,807,094
Department
of
Airports
,
Revenue
,
2021
D
,
Pre-Refunded
,
5
%
,
5/15/34
..........
140,000
158,682
Department
of
Airports
,
Revenue,
Senior
Lien
,
2020
B
,
Refunding
,
4
%
,
5/15/39
...
2,000,000
2,074,399
Department
of
Airports
,
Revenue,
Senior
Lien
,
2020
C
,
5
%
,
5/15/37
............
6,595,000
7,098,506
Department
of
Airports
,
Revenue,
Senior
Lien
,
2022
G
,
4
%
,
5/15/42
............
16,575,000
16,649,718
Department
of
Airports
,
Revenue,
Senior
Lien
,
2022
G
,
4
%
,
5/15/47
............
11,325,000
10,665,476
Department
of
Airports
,
Revenue,
Senior
Lien
,
2022
H
,
5
%
,
5/15/42
............
1,415,000
1,517,734
Department
of
Airports
,
Revenue,
Senior
Lien
,
2022
H
,
5
%
,
5/15/47
............
25,000,000
25,944,515
Department
of
Airports
,
Revenue,
Senior
Lien
,
2022
H
,
5.25
%
,
5/15/47
.........
24,000,000
25,244,971
Department
of
Airports
,
Revenue,
Senior
Lien
,
2022
I
,
5
%
,
5/15/42
.............
2,360,000
2,627,843
Department
of
Airports
,
Revenue,
Senior
Lien
,
2022
I
,
4
%
,
5/15/48
.............
2,000,000
1,974,887
Department
of
Airports
,
Revenue,
Senior
Lien
,
2022
I
,
5
%
,
5/15/48
.............
6,265,000
6,638,216
Department
of
Airports
,
Revenue,
Sub.
Lien
,
2016
B
,
5
%
,
5/15/41
.............
10,000,000
10,028,670
Department
of
Airports
,
Revenue,
Sub.
Lien
,
2016
B
,
5
%
,
5/15/46
.............
15,265,000
15,285,713
Department
of
Airports
,
Revenue,
Sub.
Lien
,
2017
A
,
5
%
,
5/15/42
.............
3,680,000
3,737,305
Department
of
Airports
,
Revenue,
Sub.
Lien
,
2017
A
,
5
%
,
5/15/47
.............
51,110,000
51,488,444
Department
of
Airports
,
Revenue,
Sub.
Lien
,
2017
B
,
5
%
,
5/15/42
.............
4,000,000
4,107,514
Department
of
Airports
,
Revenue,
Sub.
Lien
,
2018
A
,
5
%
,
5/15/44
.............
32,985,000
33,693,313
Franklin
California
Tax-Free
Income
Fund
Schedule
of
Investments
Annual
Report
The
accompanying
notes
are
an
integral
part
of
these
financial
statements.
a
a
Principal
Amount
a
Value
a
a
a
a
a
Municipal
Bonds
(continued)
California
(continued)
City
of
Los
Angeles,
(continued)
Department
of
Airports
,
Revenue,
Sub.
Lien
,
2018
E
,
Refunding
,
5
%
,
5/15/43
.....
$
16,995,000
$
18,025,004
Department
of
Airports
,
Revenue,
Sub.
Lien
,
2018
E
,
Refunding
,
5
%
,
5/15/48
.....
33,145,000
34,345,873
Department
of
Airports
,
Revenue,
Sub.
Lien
,
2019
E
,
5
%
,
5/15/44
.............
23,485,000
24,663,790
Department
of
Airports
,
Revenue,
Sub.
Lien
,
2019
E
,
5
%
,
5/15/49
.............
10,495,000
10,799,004
Department
of
Airports
,
Revenue,
Sub.
Lien
,
2021
A
,
Refunding
,
5
%
,
5/15/36
.....
3,665,000
4,034,467
Department
of
Airports
,
Revenue,
Sub.
Lien
,
2021
A
,
Refunding
,
5
%
,
5/15/38
.....
4,920,000
5,349,446
Department
of
Airports
,
Revenue,
Sub.
Lien
,
2021
A
,
Refunding
,
5
%
,
5/15/41
.....
7,005,000
7,509,562
Department
of
Airports
,
Revenue,
Sub.
Lien
,
2021
A
,
Refunding
,
5
%
,
5/15/46
.....
25,965,000
26,910,775
Department
of
Airports
,
Revenue,
Sub.
Lien
,
2021
A
,
Refunding
,
5
%
,
5/15/51
.....
26,450,000
27,055,393
Department
of
Airports
,
Revenue,
Sub.
Lien
,
2022
C
,
Refunding
,
5
%
,
5/15/45
.....
8,000,000
8,405,074
Wastewater
System
,
Revenue
,
2025
A
,
5
%
,
6/01/55
........................
5,000,000
5,331,942
Wastewater
System
,
Revenue,
Sub.
Lien
,
2018
A
,
5
%
,
6/01/43
...............
10,000,000
10,393,503
City
of
Menifee
,
Community
Facilities
District
No.
2019-1
Meadow
Run
,
Special
Tax
,
2022
,
4
%
,
9/01/37
........................................................
320,000
325,983
Community
Facilities
District
No.
2019-1
Meadow
Run
,
Special
Tax
,
2022
,
3
%
,
9/01/43
........................................................
135,000
111,526
Community
Facilities
District
No.
2019-1
Meadow
Run
,
Special
Tax
,
2022
,
4
%
,
9/01/51
........................................................
565,000
492,900
Community
Facilities
District
No.
2022-1
,
Special
Tax
,
2023
A
,
5
%
,
9/01/38
......
500,000
542,177
Community
Facilities
District
No.
2022-1
,
Special
Tax
,
2023
A
,
5
%
,
9/01/43
......
600,000
633,374
Community
Facilities
District
No.
2022-1
,
Special
Tax
,
2023
A
,
5
%
,
9/01/48
......
700,000
719,093
Community
Facilities
District
No.
2022-1
,
Special
Tax
,
2023
A
,
5
%
,
9/01/53
......
1,000,000
1,012,994
Community
Facilities
District
No.
2022-1
,
Special
Tax
,
2024
A
,
5
%
,
9/01/54
......
1,000,000
1,012,791
Community
Facilities
District
No.
2023-1
,
Special
Tax
,
2024
,
5
%
,
9/01/44
........
1,500,000
1,567,621
Community
Facilities
District
No.
2023-1
,
Special
Tax
,
2024
,
5
%
,
9/01/49
........
2,100,000
2,148,317
Community
Facilities
District
No.
2023-1
,
Special
Tax
,
2024
,
5
%
,
9/01/55
........
4,365,000
4,416,755
City
of
Mountain
House
,
Community
Facilities
District
No.
2024-1
Improvement
Area
No.
8
,
Special
Tax
,
2025
,
5.25
%
,
9/01/55
................................
1,000,000
1,019,338
City
of
Newport
Beach
,
Assessment
District
No.
113
,
1915
Act,
Special
Assessment
,
2021
A
,
2.25
%
,
9/02/41
.............................................
1,290,000
940,793
City
of
Ontario
,
Community
Facilities
District
No.
13
,
Special
Tax
,
2021
,
Refunding
,
4
%
,
9/01/38
...
400,000
398,688
Community
Facilities
District
No.
45
,
Special
Tax
,
2020
,
4
%
,
9/01/43
...........
410,000
398,933
Community
Facilities
District
No.
45
,
Special
Tax
,
2020
,
4
%
,
9/01/51
...........
1,565,000
1,386,157
Community
Facilities
District
No.
55
,
Special
Tax
,
2022
,
5
%
,
9/01/42
...........
750,000
790,779
Community
Facilities
District
No.
55
,
Special
Tax
,
2022
,
5
%
,
9/01/47
...........
800,000
819,789
Community
Facilities
District
No.
55
,
Special
Tax
,
2022
,
5
%
,
9/01/53
...........
845,000
857,558
Community
Facilities
District
No.
57
,
Special
Tax
,
2022
,
4.25
%
,
9/01/37
.........
415,000
428,758
Community
Facilities
District
No.
57
,
Special
Tax
,
2022
,
4.625
%
,
9/01/42
........
650,000
665,932
Community
Facilities
District
No.
57
,
Special
Tax
,
2022
,
4.75
%
,
9/01/47
.........
840,000
843,455
Community
Facilities
District
No.
57
,
Special
Tax
,
2022
,
4.75
%
,
9/01/52
.........
825,000
812,840
Community
Facilities
District
No.
64
,
Special
Tax
,
2024
,
5
%
,
9/01/49
...........
2,225,000
2,263,697
Community
Facilities
District
No.
66
,
Special
Tax
,
2024
,
5
%
,
9/01/39
...........
1,410,000
1,520,594
Community
Facilities
District
No.
66
,
Special
Tax
,
2024
,
5
%
,
9/01/44
...........
1,795,000
1,882,417
Community
Facilities
District
No.
66
,
Special
Tax
,
2024
,
5
%
,
9/01/49
...........
1,000,000
1,023,008
Community
Facilities
District
No.
66
,
Special
Tax
,
2024
,
5
%
,
9/01/54
...........
1,000,000
1,016,972
Community
Facilities
District
No.
71
,
Special
Tax
,
2025
,
5
%
,
9/01/55
...........
1,500,000
1,526,306
City
of
Orange
,
Community
Facilities
District
No.
06-1
,
Special
Tax
,
2015
,
Refunding
,
AG
Insured
,
5
%
,
10/01/40
...........................................
7,500,000
7,513,195
City
of
Pasadena
,
Electric
,
Revenue
,
2016
A
,
Refunding
,
4
%
,
6/01/46
............
22,625,000
22,556,270
City
of
Rancho
Cordova
,
Arista
Del
Sol
Community
Facilities
District
No.
2022-1
Improvement
Area
No.
1
,
Special
Tax
,
2023
,
5.125
%
,
9/01/43
...................................
525,000
553,593
Arista
Del
Sol
Community
Facilities
District
No.
2022-1
Improvement
Area
No.
1
,
Special
Tax
,
2023
,
5.375
%
,
9/01/53
...................................
1,100,000
1,138,568
Franklin
California
Tax-Free
Income
Fund
Schedule
of
Investments
The
accompanying
notes
are
an
integral
part
of
these
financial
statements.
Annual
Report
a
a
Principal
Amount
a
Value
a
a
a
a
a
Municipal
Bonds
(continued)
California
(continued)
City
of
Rancho
Cordova,
(continued)
City
Grantline
220
Community
Facilities
District
No.
2023-1
Improvement
Area
No.
2
,
Special
Tax
,
2024
,
5
%
,
9/01/54
......................................
$
1,790,000
$
1,811,642
Grantline
220
Community
Facilities
District
No.
2023-1
Improvement
Area
No.
1
,
Special
Tax
,
2024
,
5
%
,
9/01/44
......................................
885,000
920,350
Grantline
220
Community
Facilities
District
No.
2023-1
Improvement
Area
No.
1
,
Special
Tax
,
2024
,
5
%
,
9/01/49
......................................
550,000
560,365
Grantline
220
Community
Facilities
District
No.
2023-1
Improvement
Area
No.
1
,
Special
Tax
,
2024
,
5
%
,
9/01/53
......................................
525,000
532,152
City
of
Rialto
,
Community
Facilities
District
No.
2020-1
,
Special
Tax
,
2025
,
5.125
%
,
9/01/55
.........................................................
1,000,000
1,021,630
City
of
Roseville
,
Amoruso
Ranch
Community
Facilities
District
No.
1
Improvement
Area
No.
2
,
Special
Tax
,
2025
,
5
%
,
9/01/50
............................................
1,190,000
1,202,042
Amoruso
Ranch
Community
Facilities
District
No.
1
Improvement
Area
No.
2
,
Special
Tax
,
2025
,
5
%
,
9/01/55
............................................
1,750,000
1,754,169
Creekview
Community
Facilities
District
No.
1
Improvement
Area
No.
2
,
Special
Tax
,
2024
,
5
%
,
9/01/54
................................................
2,165,000
2,185,164
Electric
System
,
COP
,
2004
,
AG
Insured
,
5
%
,
2/01/34
......................
5,000
5,010
Ranch
at
Sierra
Vista
Community
Facilities
District
No.
1
,
Special
Tax
,
2023
,
5
%
,
9/01/38
........................................................
1,165,000
1,252,624
Ranch
at
Sierra
Vista
Community
Facilities
District
No.
1
,
Special
Tax
,
2023
,
5
%
,
9/01/43
........................................................
1,000,000
1,049,048
Ranch
at
Sierra
Vista
Community
Facilities
District
No.
1
,
Special
Tax
,
2023
,
5
%
,
9/01/48
........................................................
1,000,000
1,026,638
Ranch
at
Sierra
Vista
Community
Facilities
District
No.
1
,
Special
Tax
,
2023
,
5
%
,
9/01/53
........................................................
1,150,000
1,169,289
City
of
Sacramento
,
Transient
Occupancy
Tax
,
Revenue
,
2018
A
,
5
%
,
6/01/43
....................
13,555,000
14,105,065
Transient
Occupancy
Tax
,
Revenue
,
2018
A
,
5
%
,
6/01/48
....................
21,415,000
22,019,376
City
of
San
Francisco
,
Public
Utilities
Commission
Water
,
Revenue
,
2025
D
,
5
%
,
11/01/55
............
75,000,000
80,162,925
Public
Utilities
Commission
Water
,
Revenue,
Sub.
Lien
,
2023
AB-A
,
5.25
%
,
11/01/48
47,895,000
52,618,640
Public
Utilities
Commission
Water
,
Revenue,
Sub.
Lien
,
2023
AB-A
,
5.25
%
,
11/01/52
40,170,000
43,318,187
City
of
Santa
Paula
,
Harvest
Community
Facilities
District
No.
1
Improvement
Area
A
,
Special
Tax
,
2022
,
4
%
,
9/01/42
....................................................
575,000
562,073
Harvest
Community
Facilities
District
No.
1
Improvement
Area
A
,
Special
Tax
,
2022
,
4
%
,
9/01/47
....................................................
1,460,000
1,327,104
Harvest
Community
Facilities
District
No.
1
Improvement
Area
A
,
Special
Tax
,
2022
,
4
%
,
9/01/52
....................................................
3,530,000
3,066,417
Harvest
Community
Facilities
District
No.
1
Improvement
Area
A
,
Special
Tax
,
2023
,
5
%
,
9/01/49
....................................................
325,000
332,981
Harvest
Community
Facilities
District
No.
1
Improvement
Area
A
,
Special
Tax
,
2023
,
5
%
,
9/01/53
....................................................
1,345,000
1,369,259
City
of
Upland
,
San
Antonio
Regional
Hospital
Obligated
Group
,
COP
,
Refunding
,
5
%
,
1/01/47
.........................................................
14,400,000
14,525,326
City
of
Vernon
,
Electric
System
,
Revenue
,
2022
A
,
Refunding
,
5
%
,
8/01/34
..................
1,350,000
1,517,263
Electric
System
,
Revenue
,
2022
A
,
Refunding
,
5
%
,
8/01/39
..................
425,000
462,792
Electric
System
,
Revenue
,
2022
A
,
Refunding
,
5
%
,
8/01/40
..................
365,000
395,389
Electric
System
,
Revenue
,
2022
A
,
Refunding
,
5
%
,
8/01/41
..................
420,000
451,390
City
of
Wildomar
,
Community
Facilities
District
No.
2022-3
,
Special
Tax
,
2024
,
5
%
,
9/01/42
........
800,000
847,092
Community
Facilities
District
No.
2022-3
,
Special
Tax
,
2024
,
5
%
,
9/01/47
........
1,000,000
1,025,337
Community
Facilities
District
No.
2022-3
,
Special
Tax
,
2024
,
5
%
,
9/01/54
........
1,200,000
1,216,179
Franklin
California
Tax-Free
Income
Fund
Schedule
of
Investments
Annual
Report
The
accompanying
notes
are
an
integral
part
of
these
financial
statements.
a
a
Principal
Amount
a
Value
a
a
a
a
a
Municipal
Bonds
(continued)
California
(continued)
e
CMFA
Special
Finance
Agency
,
Latitude33
,
Revenue
,
144A,
2021
A-1
,
3
%
,
12/01/56
.......................
$
9,000,000
$
6,059,924
Solana
at
Grand
,
Revenue,
Senior
Lien
,
144A,
2021
A-1
,
4
%
,
8/01/56
..........
54,800,000
48,136,896
e
CMFA
Special
Finance
Agency
Enclave
,
Revenue,
Senior
Lien
,
144A,
2022
A-1
,
4
%
,
8/01/58
.........................................................
26,500,000
20,548,039
e
CMFA
Special
Finance
Agency
VII
,
Breakwater
Apartments
(The)
,
Revenue
,
144A,
2021
A-1
,
3
%
,
8/01/56
..............................................
94,250,000
66,543,940
e
CMFA
Special
Finance
Agency
VIII
,
Elan
Huntington
Beach
,
Revenue,
Senior
Lien
,
144A,
2021
A-1
,
3
%
,
8/01/56
.........................................
34,750,000
24,278,341
e
CMFA
Special
Finance
Agency
XII
,
Allure
Apartments
,
Revenue,
Senior
Lien
,
144A,
2022
A-1
,
3.25
%
,
2/01/57
............................................
27,500,000
20,170,785
Coachella
Valley
Unified
School
District
,
GO
,
2016
F
,
BAM
Insured
,
5
%
,
8/01/46
.................................
7,135,000
7,170,571
c
GO
,
C
,
AG
Insured
,
3.08
%,
8/01/36
....................................
8,000,000
5,831,475
c
GO
,
C
,
AG
Insured
,
3.22
%,
8/01/37
....................................
8,000,000
5,568,206
c
GO
,
C
,
AG
Insured
,
3.57
%,
8/01/40
....................................
7,500,000
4,519,794
c
GO
,
C
,
AG
Insured
,
4.1
%,
8/01/43
.....................................
10,000,000
4,962,023
c
Colton
Joint
Unified
School
District
,
GO
,
2010
B
,
AG
Insured
,
4.25
%,
8/01/42
......
16,365,000
8,258,947
Contra
Costa
Community
College
District
,
GO
,
2020
C
,
4
%
,
8/01/32
.............
1,200,000
1,299,504
Contra
Costa
Water
District
,
Revenue
,
V
,
Refunding
,
5
%
,
10/01/49
..............
7,500,000
7,778,903
Corona
Community
Facilities
District
,
City
of
Corona
Community
Facilities
District
No.
2018-1
Improvement
Area
No.
2
,
Special
Tax
,
2024
,
5
%
,
9/01/49
......................................
1,600,000
1,631,190
City
of
Corona
Community
Facilities
District
No.
2018-1
Improvement
Area
No.
2
,
Special
Tax
,
2024
,
5
%
,
9/01/54
......................................
1,600,000
1,619,345
c
Corona-Norco
Unified
School
District
,
GO
,
1998
C
,
NATL
Insured
,
2.25
%,
9/01/26
...
6,080,000
6,011,571
County
of
El
Dorado
,
Community
Facilities
District
No.
2014-1
,
Special
Tax
,
2023
,
5
%
,
9/01/48
.........................................................
1,000,000
1,023,451
County
of
Los
Angeles
,
Community
Facilities
District
No.
2021-01
Improvement
Area
No.
2
,
Special
Tax
,
2024
,
5
%
,
9/01/44
................................................
1,400,000
1,470,214
Community
Facilities
District
No.
2021-01
Improvement
Area
No.
2
,
Special
Tax
,
2024
,
5
%
,
9/01/49
................................................
1,400,000
1,430,241
Community
Facilities
District
No.
2021-01
Improvement
Area
No.
2
,
Special
Tax
,
2024
,
5
%
,
9/01/54
................................................
1,750,000
1,776,034
County
of
Orange
,
Community
Facilities
District
No.
2021-1
,
Special
Tax
,
2022
A
,
5
%
,
8/15/37
......
1,300,000
1,394,507
Community
Facilities
District
No.
2021-1
,
Special
Tax
,
2022
A
,
5
%
,
8/15/42
......
850,000
898,394
Community
Facilities
District
No.
2021-1
,
Special
Tax
,
2022
A
,
5
%
,
8/15/47
......
1,250,000
1,282,115
Community
Facilities
District
No.
2021-1
,
Special
Tax
,
2022
A
,
5
%
,
8/15/52
......
8,200,000
8,335,643
County
of
Placer
,
Community
Facilities
District
No.
2017-1
Improvement
Area
No.
2
,
Special
Tax
,
2023
,
5
%
,
9/01/43
....................................................
900,000
933,331
Community
Facilities
District
No.
2017-1
Improvement
Area
No.
2
,
Special
Tax
,
2023
,
5
%
,
9/01/48
....................................................
1,360,000
1,376,826
Community
Facilities
District
No.
2017-1
Improvement
Area
No.
2
,
Special
Tax
,
2023
,
5
%
,
9/01/53
....................................................
1,000,000
1,004,864
County
of
Riverside
,
Community
Facilities
District
No.
07-2
,
Special
Tax
,
2020
,
AG
Insured
,
4
%
,
9/01/45
...............................................
2,730,000
2,682,516
County
of
Sacramento
,
Airport
System
,
Revenue
,
2025
D
,
AG
Insured
,
5.25
%
,
7/01/50
...............
7,500,000
7,897,590
Airport
System
,
Revenue,
Senior
Lien
,
2016
A
,
Refunding
,
5
%
,
7/01/41
.........
10,000,000
10,066,835
Airport
System
,
Revenue,
Sub.
Lien
,
2016
B
,
Refunding
,
5
%
,
7/01/41
...........
9,000,000
9,060,152
Community
Facilities
District
No.
2014-2
,
Special
Tax
,
2021
,
4
%
,
9/01/41
........
325,000
320,065
Community
Facilities
District
No.
2014-2
,
Special
Tax
,
2021
,
4
%
,
9/01/46
........
325,000
298,014
Franklin
California
Tax-Free
Income
Fund
Schedule
of
Investments
The
accompanying
notes
are
an
integral
part
of
these
financial
statements.
Annual
Report
a
a
Principal
Amount
a
Value
a
a
a
a
a
Municipal
Bonds
(continued)
California
(continued)
e
CSCDA
Community
Improvement
Authority
,
1818
Platinum
Triangle-Anaheim
,
Revenue,
Senior
Lien
,
144A,
2021
A-1
,
3.35
%
,
4/01/47
........................................................
$
9,600,000
$
8,448,403
777
Place-Pomona
,
Revenue,
Senior
Lien
,
144A,
2021
A-1
,
3.6
%
,
5/01/47
.......
10,000,000
8,524,677
777
Place-Pomona
,
Revenue,
Senior
Lien
,
144A,
2021
A-2
,
3.25
%
,
5/01/57
......
12,500,000
8,802,491
Acacia
on
Santa
Rosa
Creek
,
Revenue,
Senior
Lien
,
144A,
2021
A
,
4
%
,
10/01/56
.
13,000,000
10,937,135
Cameo/Garrison
Apartments
,
Revenue
,
144A,
2021
A-1
,
2.8
%
,
3/01/47
.........
20,800,000
17,155,251
Cameo/Garrison
Apartments
,
Revenue
,
144A,
2021
B
,
4
%
,
3/01/57
............
7,000,000
5,285,727
Cameo/Garrison
Apartments
,
Revenue,
Senior
Lien
,
144A,
2021
A-2
,
3
%
,
3/01/57
.
7,430,000
5,181,845
Crescent
(The)
,
Revenue,
Senior
Lien
,
144A,
2022
A-1
,
3.25
%
,
7/01/43
.........
6,530,000
5,349,123
Crescent
(The)
,
Revenue,
Senior
Lien
,
144A,
2022
A-2
,
4.3
%
,
7/01/59
..........
18,250,000
14,870,947
Dublin
,
Revenue
,
144A,
2021
B
,
4
%
,
2/01/57
.............................
16,110,000
12,496,314
Dublin
,
Revenue,
Senior
Lien
,
144A,
2021
A-1
,
2.45
%
,
2/01/47
...............
36,300,000
32,125,486
Dublin
,
Revenue,
Senior
Lien
,
144A,
2021
A-2
,
3
%
,
2/01/57
..................
45,500,000
32,835,243
Escondido
Portfolio
,
Revenue,
Senior
Lien
,
144A,
2021
A-1
,
3
%
,
6/01/48
........
10,000,000
7,217,011
Jefferson
Platinum
Triangle
Apartments
,
Revenue
,
144A,
2021
A-1
,
2.875
%
,
8/01/41
17,170,000
16,636,382
Jefferson
Platinum
Triangle
Apartments
,
Revenue
,
144A,
2021
A-2
,
3.125
%
,
8/01/56
54,465,000
41,818,167
Monterey
Station
Apartments
,
Revenue,
Senior
Lien
,
144A,
2021
A-1
,
3
%
,
7/01/43
.
8,000,000
6,627,342
Parallel-Anaheim
,
Revenue
,
144A,
2021
A
,
4
%
,
8/01/56
.....................
17,540,000
16,119,881
Park
Crossing
Apartments
,
Revenue,
Senior
Lien
,
144A,
2021
A
,
3.25
%
,
12/01/58
.
18,750,000
13,116,161
Pasadena
Portfolio
,
Revenue,
Senior
Lien
,
144A,
2021
A-1
,
2.65
%
,
12/01/46
.....
1,340,000
1,152,650
Pasadena
Portfolio
,
Revenue,
Senior
Lien
,
144A,
2021
A-2
,
3
%
,
12/01/56
.......
39,820,000
28,206,386
Renaissance
at
City
Center
,
Revenue
,
144A,
2020
A
,
5
%
,
7/01/51
.............
18,625,000
18,000,059
Theo
Apartments
,
Revenue,
Senior
Lien
,
144A,
2021
A-1
,
3.5
%
,
5/01/47
........
5,000,000
4,366,415
c
Towne
at
Glendale
Apartments
,
Revenue
,
144A,
2022
A
,
1.199
%,
9/01/62
.......
53,000,000
36,320,566
Vineyard
Garden
Apartments
,
Revenue,
Senior
Lien
,
144A,
2021
A
,
3.25
%
,
10/01/58
14,000,000
10,114,586
Waterscape
Apartments
,
Revenue,
Senior
Lien
,
144A,
2021
A
,
3
%
,
9/01/56
......
5,000,000
3,497,728
Westgate
Apartments
,
Revenue,
Senior
Lien
,
144A,
2021
A-1
,
3
%
,
6/01/47
......
14,500,000
10,524,699
Wood
Creek
Apartments
,
Revenue,
Senior
Lien
,
144A,
2021
A-1
,
3
%
,
12/01/49
...
30,000,000
21,697,791
Wood
Creek
Apartments
,
Revenue,
Senior
Lien
,
144A,
2021
A-2
,
4
%
,
12/01/58
...
25,000,000
19,520,273
Daly
City
Housing
Development
Finance
Agency
,
Franciscan
Park
LLC
,
Revenue
,
2007
A
,
Refunding
,
5
%
,
12/15/47
..........................................
17,870,000
17,877,366
Day
Creek
Square
Public
Facilities
,
Community
Facilities
District
No.
2018-1
,
Special
Tax
,
2020
,
4
%
,
9/01/40
........
625,000
629,144
Community
Facilities
District
No.
2018-1
,
Special
Tax
,
2020
,
4
%
,
9/01/45
........
700,000
661,228
Delano
Joint
Union
High
School
District
,
GO
,
2003
A
,
Refunding
,
NATL
Insured
,
5.15
%
,
2/01/32
.........................................................
7,175,000
7,805,798
East
Bay
Municipal
Utility
District
,
Water
System
,
Revenue
,
2017
A
,
Refunding
,
5
%
,
6/01/45
.........................................................
4,240,000
4,318,946
Eastern
Municipal
Water
District
,
Community
Facilities
District
No.
2013-63
Improvement
Area
B
,
Special
Tax
,
2024
,
4
%
,
9/01/43
....................................................
1,315,000
1,262,186
Community
Facilities
District
No.
2013-63
Improvement
Area
B
,
Special
Tax
,
2024
,
4.25
%
,
9/01/49
..................................................
1,095,000
1,007,961
Community
Facilities
District
No.
2017-77
Improvement
Area
A
,
Special
Tax
,
2024
,
5
%
,
9/01/45
....................................................
1,175,000
1,214,676
Community
Facilities
District
No.
2017-77
Improvement
Area
A
,
Special
Tax
,
2024
,
5
%
,
9/01/54
....................................................
2,485,000
2,516,774
Community
Facilities
District
No.
2017-79
,
Special
Tax
,
2021
,
4
%
,
9/01/46
.......
2,815,000
2,553,482
Community
Facilities
District
No.
2017-79
,
Special
Tax
,
2021
,
4
%
,
9/01/51
.......
3,405,000
2,948,133
Community
Facilities
District
No.
2019-83
,
Special
Tax
,
2022
,
4
%
,
9/01/51
.......
2,790,000
2,430,286
Community
Facilities
District
No.
2019-86
,
Special
Tax
,
2023
,
5
%
,
9/01/48
.......
855,000
876,684
Community
Facilities
District
No.
2019-86
,
Special
Tax
,
2023
,
5
%
,
9/01/54
.......
1,775,000
1,799,936
Community
Facilities
District
No.
2022-95
,
Special
Tax
,
2024
,
4
%
,
9/01/39
.......
1,250,000
1,261,149
Community
Facilities
District
No.
2022-95
,
Special
Tax
,
2024
,
4
%
,
9/01/44
.......
1,500,000
1,419,242
Community
Facilities
District
No.
2022-95
,
Special
Tax
,
2024
,
4.25
%
,
9/01/49
.....
2,030,000
1,868,640
Community
Facilities
District
No.
2022-95
,
Special
Tax
,
2024
,
4.375
%
,
9/01/54
....
1,280,000
1,170,982
Franklin
California
Tax-Free
Income
Fund
Schedule
of
Investments
Annual
Report
The
accompanying
notes
are
an
integral
part
of
these
financial
statements.
a
a
Principal
Amount
a
Value
a
a
a
a
a
Municipal
Bonds
(continued)
California
(continued)
Eastern
Municipal
Water
District
Financing
Authority
,
Revenue
,
2015
B
,
5
%
,
7/01/46
.
$
30,705,000
$
30,734,314
Elk
Grove
Finance
Authority
,
Community
Facilities
District
No.
2005-1
Laguna
Ridge
,
Special
Tax
,
2024
,
5
%
,
9/01/51
.......................................
1,725,000
1,757,253
Elsinore
Valley
Municipal
Water
District
,
Community
Facilities
District
No.
2022-2
(Echo
Ridge)
,
Special
Tax
,
2026
,
5
%
,
9/01/55
.................................
1,250,000
1,237,018
c
Fairfax
School
District
,
GO
,
2011
,
AG
Insured
,
4.84
%,
11/01/48
.................
10,380,000
3,557,686
FHLMC,
Multi-family
ML
Pass-Through
Certificates
,
Revenue
,
2019-ML06
,
ACA
,
2.493
%
,
7/25/35
...................................................
976,648
904,668
Folsom
Cordova
Unified
School
District
,
School
Facilities
Improvement
District
No.
5
,
GO
,
C
,
4
%
,
10/01/43
...............................................
5,000,000
5,018,163
Folsom
Ranch
Financing
Authority
,
City
of
Folsom
Community
Facilities
District
No.
18
,
Special
Tax
,
2024
,
5
%
,
9/01/44
1,000,000
1,047,975
City
of
Folsom
Community
Facilities
District
No.
18
,
Special
Tax
,
2024
,
5
%
,
9/01/49
1,250,000
1,279,641
City
of
Folsom
Community
Facilities
District
No.
18
,
Special
Tax
,
2024
,
5
%
,
9/01/54
5,535,000
5,628,941
City
of
Folsom
Community
Facilities
District
No.
23
Improvement
Area
No.
2
,
Special
Tax
,
2024
,
5
%
,
9/01/39
............................................
715,000
767,166
City
of
Folsom
Community
Facilities
District
No.
23
Improvement
Area
No.
2
,
Special
Tax
,
2024
,
5
%
,
9/01/44
............................................
775,000
803,448
City
of
Folsom
Community
Facilities
District
No.
23
Improvement
Area
No.
2
,
Special
Tax
,
2024
,
5
%
,
9/01/49
............................................
425,000
432,740
City
of
Folsom
Community
Facilities
District
No.
23
Improvement
Area
No.
2
,
Special
Tax
,
2024
,
5
%
,
9/01/53
............................................
485,000
492,218
Foothill-Eastern
Transportation
Corridor
Agency
,
Revenue
,
2013
A
,
Refunding
,
AG
Insured
,
5.5
%
,
1/15/31
....................
35,000,000
40,536,314
Revenue
,
2013
A
,
Refunding
,
AG
Insured
,
5.625
%
,
1/15/32
..................
37,260,000
43,278,857
Revenue
,
2013
A
,
Refunding
,
6.85
%
,
1/15/42
.............................
99,150,000
120,427,610
c
Revenue
,
2013
A
,
Refunding
,
AG
Insured
,
3.11
%,
1/15/37
...................
41,250,000
29,564,890
c
Revenue
,
2013
A
,
Refunding
,
AG
Insured
,
3.24
%,
1/15/38
...................
77,650,000
53,153,584
c
Revenue
,
2013
A
,
Refunding
,
AG
Insured
,
3.36
%,
1/15/39
...................
56,100,000
36,648,211
c
Revenue
,
2013
A
,
Refunding
,
3.84
%,
1/15/42
.............................
130,000,000
71,419,894
c
Revenue,
Senior
Lien
,
1995
A
,
ETM,
2.02
%,
1/01/27
.......................
15,000,000
14,749,443
c
Revenue,
Senior
Lien
,
1995
A
,
ETM,
2.03
%,
1/01/28
.......................
2,000,000
1,927,477
c
Revenue,
Senior
Lien
,
1995
A
,
ETM,
2.06
%,
1/01/29
.......................
35,310,000
33,325,461
Revenue,
Senior
Lien
,
2021
A
,
Refunding
,
4
%
,
1/15/46
.....................
17,500,000
17,188,971
c
Fowler
Unified
School
District
,
GO
,
2010
C
,
AG
Insured
,
3.7
%,
8/01/41
.................................
3,095,000
1,767,194
GO
,
2010
C
,
AG
Insured
,
3.82
%,
8/01/42
................................
3,005,000
1,623,740
Fremont
Unified
School
District
,
GO
,
2024
A
,
4
%
,
8/01/45
.....................
5,000,000
5,023,127
Fresno
Unified
School
District
,
GO
,
2020
B
,
5
%
,
8/01/46
............................................
2,635,000
2,776,341
GO
,
2020
B
,
4
%
,
8/01/48
............................................
3,205,000
3,082,543
GO
,
2020
B
,
4
%
,
8/01/52
............................................
6,585,000
6,186,176
GO
,
2020
B
,
4
%
,
8/01/55
............................................
4,000,000
3,719,730
c
Glendale
Community
College
District
,
GO
,
2003
C
,
NATL
Insured
,
3.62
%,
8/01/28
...
6,570,000
6,027,213
Golden
State
Tobacco
Securitization
Corp.
,
Revenue
,
2022
A-1
,
Refunding
,
5
%
,
6/01/51
.........................................................
21,350,000
21,266,109
Golden
Valley
Unified
School
District
,
Community
Facilities
District
No.
2017-1
Improvement
Area
No.
3
,
Special
Tax
,
2025
,
5
%
,
9/01/55
....................
1,570,000
1,558,449
Golden
Valley
Unified
School
District
Financing
Authority
,
Community
Facilities
District
No.
2017-1
,
Revenue
,
2021
A
,
4
%
,
9/01/46
........
250,000
231,428
Community
Facilities
District
No.
2017-1
,
Revenue
,
2021
A
,
4
%
,
9/01/51
........
500,000
438,845
Community
Facilities
District
No.
2017-1
,
Revenue
,
2021
A
,
4
%
,
9/01/56
........
745,000
641,478
Grossmont-Cuyamaca
Community
College
District
,
GO
,
2018
B
,
4
%
,
8/01/47
......
10,000,000
9,920,320
Hacienda
La
Puente
Unified
School
District
,
GO
,
2017
A
,
4
%
,
8/01/47
............
655,000
647,931
Hartnell
Community
College
District
,
GO
,
2009
C
,
6.125
%
,
8/01/33
..............
20,000,000
24,393,502
c
Hawthorne
School
District
,
GO
,
2008
C
,
AG
Insured
,
4.72
%,
8/01/48
.............
37,665,000
13,377,576
Franklin
California
Tax-Free
Income
Fund
Schedule
of
Investments
The
accompanying
notes
are
an
integral
part
of
these
financial
statements.
Annual
Report
a
a
Principal
Amount
a
Value
a
a
a
a
a
Municipal
Bonds
(continued)
California
(continued)
Hemet
Unified
School
District
,
Community
Facilities
District
No.
2021-1
Improvement
Area
No.
2
,
Special
Tax
,
2025
,
5
%
,
9/01/55
....................................................
$
1,000,000
$
1,016,038
Community
Facilities
District
No.
2021-5 Improvement
Area
No.
1
,
Special
Tax
,
2025
,
5
%
,
9/01/45
................................................
1,000,000
1,044,530
Community
Facilities
District
No.
2021-5 Improvement
Area
No.
2
,
Special
Tax
,
2025
,
5
%
,
9/01/50
................................................
1,070,000
1,094,859
Community
Facilities
District
No.
2021-5 Improvement
Area
No.
2
,
Special
Tax
,
2025
,
5
%
,
9/01/54
................................................
1,000,000
1,016,972
Community
Facilities
District
No.
2021-6
Improvement
Area
No.
1
,
Special
Tax
,
2024
,
5
%
,
9/01/44
....................................................
1,000,000
1,055,254
Community
Facilities
District
No.
2021-6
Improvement
Area
No.
1
,
Special
Tax
,
2024
,
5
%
,
9/01/49
....................................................
1,000,000
1,021,601
Community
Facilities
District
No.
2021-6
Improvement
Area
No.
1
,
Special
Tax
,
2024
,
5
%
,
9/01/54
....................................................
1,700,000
1,728,853
Community
Facilities
District
No.
2021-7
,
Special
Tax
,
2023
,
5
%
,
9/01/48
........
1,500,000
1,535,177
Community
Facilities
District
No.
2021-7
,
Special
Tax
,
2023
,
5
%
,
9/01/53
........
1,000,000
1,016,774
Community
Facilities
District
No.
2021-7
,
Special
Tax
,
2024
,
5
%
,
9/01/49
........
1,000,000
1,019,477
Community
Facilities
District
No.
2022-2
,
Special
Tax
,
2024
,
5
%
,
9/01/54
........
1,000,000
1,016,972
Community
Facilities
District
No.
2023-1
,
Special
Tax
,
2025
,
5
%
,
9/01/45
........
1,000,000
1,044,530
Community
Facilities
District
No.
2023-1
,
Special
Tax
,
2025
,
5
%
,
9/01/50
........
900,000
920,910
Community
Facilities
District
No.
2023-1
,
Special
Tax
,
2025
,
5
%
,
9/01/55
........
1,000,000
1,016,737
Community
Facilities
District
No.
2023-3
,
Special
Tax
,
2025
,
5.125
%
,
9/01/55
.....
1,300,000
1,336,094
Hesperia
Unified
School
District
,
Community
Facilities
District
No.
2015-1
,
Special
Tax
,
2015-1
,
5
%
,
9/01/55
................................................
1,000,000
1,013,248
c
Huntington
Beach
City
School
District
,
GO
,
2003
A
,
NATL
Insured
,
3.51
%,
8/01/28
..
7,190,000
6,613,957
Imperial
Irrigation
District
,
Electric
System
,
Revenue
,
2016
B-2
,
Refunding
,
5
%
,
11/01/27
........................................................
1,000,000
1,019,401
Independent
Cities
Finance
Authority
,
Augusta
Communities
LLC
,
Revenue
,
2022
A
,
Refunding
,
5.25
%
,
5/15/56
.......
4,000,000
4,110,287
e
City
of
Compton
Sales
Tax
,
Revenue
,
144A,
2021
,
AG
Insured
,
4
%
,
6/01/36
......
700,000
723,280
e
City
of
Compton
Sales
Tax
,
Revenue
,
144A,
2021
,
AG
Insured
,
4
%
,
6/01/41
......
900,000
923,245
e
City
of
Compton
Sales
Tax
,
Revenue
,
144A,
2021
,
AG
Insured
,
4
%
,
6/01/46
......
925,000
914,688
e
City
of
Compton
Sales
Tax
,
Revenue
,
144A,
2021
,
AG
Insured
,
4
%
,
6/01/51
......
1,250,000
1,205,101
Millennium
Housing
LLC
,
Revenue
,
2021
A
,
Refunding
,
3
%
,
9/15/46
...........
1,000,000
796,655
Millennium
Housing
LLC
,
Revenue
,
2021
A
,
Refunding
,
3
%
,
9/15/56
...........
2,000,000
1,401,189
Millennium
Housing
LLC
,
Revenue
,
2022
,
Refunding
,
4
%
,
9/15/42
.............
2,000,000
1,971,370
Millennium
Housing
LLC
,
Revenue
,
2022
,
Refunding
,
4.25
%
,
9/15/50
...........
2,000,000
1,854,432
Millennium
Housing
LLC
,
Revenue
,
2022
,
Refunding
,
5
%
,
9/15/50
.............
2,000,000
2,038,390
Irvine
Unified
School
District
,
Special
Tax
,
2020
A
,
4
%
,
9/01/40
......................................
2,945,000
2,960,895
Special
Tax
,
2020
A
,
4
%
,
9/01/44
......................................
6,215,000
5,948,583
Special
Tax
,
2020
A
,
BAM
Insured
,
4
%
,
9/01/50
...........................
7,960,000
7,643,541
Community
Facilities
District
No.
09-1
,
Special
Tax
,
2017
D
,
5
%
,
3/01/57
........
14,155,000
14,205,440
Jefferson
Union
High
School
District
,
GO
,
2000
A
,
Refunding
,
NATL
Insured
,
6.45
%
,
8/01/29
.........................................................
2,185,000
2,334,898
Jurupa
Community
Services
District
,
Community
Facilities
District
No.
52
,
Special
Tax
,
2021
A
,
4
%
,
9/01/39
..........
135,000
136,241
Community
Facilities
District
No.
52
,
Special
Tax
,
2021
A
,
4
%
,
9/01/40
..........
140,000
140,583
Community
Facilities
District
No.
52
,
Special
Tax
,
2021
A
,
4
%
,
9/01/50
..........
1,000,000
879,489
Community
Facilities
District
No.
54
,
Special
Tax
,
2021
A
,
4
%
,
9/01/46
..........
900,000
826,387
Community
Facilities
District
No.
54
,
Special
Tax
,
2021
A
,
4
%
,
9/01/51
..........
875,000
762,187
Community
Facilities
District
No.
57
,
Special
Tax
,
2025
A
,
5
%
,
9/01/55
..........
1,000,000
1,012,962
Community
Facilities
District
No.
59
Improvement
Area
A
,
Special
Tax
,
2025
A
,
5
%
,
9/01/50
........................................................
3,980,000
4,050,577
Community
Facilities
District
No.
59
Improvement
Area
A
,
Special
Tax
,
2025
A
,
5
%
,
9/01/55
........................................................
4,455,000
4,502,595
Franklin
California
Tax-Free
Income
Fund
Schedule
of
Investments
Annual
Report
The
accompanying
notes
are
an
integral
part
of
these
financial
statements.
a
a
Principal
Amount
a
Value
a
a
a
a
a
Municipal
Bonds
(continued)
California
(continued)
La
Mirada
Redevelopment
Agency
Successor
Agency
,
Tax
Allocation
,
2010
A
,
Refunding
,
AG
Insured
,
5
%
,
8/15/28
....................................
$
1,855,000
$
1,859,583
Lake
Elsinore
Unified
School
District
,
Community
Facilities
District
No.
2006-3
Area
B
,
Special
Tax
,
2022
,
5
%
,
9/01/47
..
350,000
358,658
Community
Facilities
District
No.
2006-3
Area
B
,
Special
Tax
,
2022
,
5
%
,
9/01/52
..
500,000
507,772
Community
Facilities
District
No.
2017-2
,
Special
Tax
,
2024
,
5
%
,
9/01/49
........
1,250,000
1,275,138
Community
Facilities
District
No.
2017-2
,
Special
Tax
,
2024
,
5
%
,
9/01/54
........
850,000
861,407
c
Lakeside
Union
School
District
,
GO
,
2010
B
,
4.34
%,
8/01/45
...................
11,540,000
5,053,135
Lammersville
Joint
Unified
School
District
,
GO
,
2016
A
,
4
%
,
8/01/46
.............
41,340,000
41,214,645
c
Lancaster
School
District
,
GO
,
2001
,
NATL
Insured
,
2.31
%,
7/01/26
.............
5,965,000
5,918,840
Lassen
Municipal
Utility
District
,
COP
,
2021
,
4
%
,
5/01/51
......................
3,000,000
2,629,365
Lawndale
Redevelopment
Agency
,
Tax
Allocation
,
2009
,
AG
Insured
,
5.5
%
,
8/01/39
...........................
9,875,000
9,898,954
Tax
Allocation
,
2009
,
AG
Insured
,
5.5
%
,
8/01/44
...........................
6,085,000
6,098,694
c
Lemon
Grove
School
District
,
GO
,
2010
B
,
AG
Insured
,
4.5
%,
8/01/50
............
20,990,000
7,160,759
Lodi
Unified
School
District
,
GO
,
2017
,
4
%
,
8/01/41
..........................
15,000,000
15,095,280
Long
Beach
Bond
Finance
Authority
,
Revenue
,
2007
A
,
5.5
%
,
11/15/28
.....................................
8,000,000
8,617,812
Revenue
,
2007
A
,
5
%
,
11/15/29
.......................................
17,465,000
18,959,396
Revenue
,
2007
A
,
5.5
%
,
11/15/30
.....................................
5,000,000
5,637,766
Revenue
,
2007
A
,
5
%
,
11/15/35
.......................................
69,855,000
81,551,745
Revenue
,
2007
A
,
5.5
%
,
11/15/37
.....................................
35,000,000
42,709,730
Los
Angeles
County
Metropolitan
Transportation
Authority
,
Sales
Tax
,
Revenue
,
2016
A
,
Refunding
,
5
%
,
6/01/38
.......................
7,705,000
7,749,220
Sales
Tax
,
Revenue
,
2016
A
,
Refunding
,
5
%
,
6/01/39
.......................
5,000,000
5,027,000
Sales
Tax
,
Revenue
,
2017
A
,
5
%
,
7/01/38
...............................
10,455,000
10,828,362
Sales
Tax
,
Revenue
,
2017
A
,
5
%
,
7/01/39
...............................
7,860,000
8,122,206
Sales
Tax
,
Revenue
,
2017
A
,
5
%
,
7/01/41
...............................
12,350,000
12,712,185
Sales
Tax
,
Revenue
,
2017
A
,
5
%
,
7/01/42
...............................
26,910,000
27,625,276
Sales
Tax
,
Revenue
,
2020
A
,
Refunding
,
5
%
,
6/01/36
.......................
5,375,000
5,978,852
Sales
Tax
,
Revenue
,
2020
A
,
Refunding
,
5
%
,
6/01/37
.......................
10,330,000
11,459,009
Sales
Tax
,
Revenue,
Senior
Lien
,
2021
A
,
5
%
,
7/01/28
......................
3,830,000
4,125,191
Sales
Tax
,
Revenue,
Senior
Lien
,
2021
A
,
5
%
,
7/01/38
......................
3,875,000
4,384,879
Los
Angeles
County
Sanitation
Districts
Financing
Authority
,
Los
Angeles
County
Sanitation
District
No.
20
,
Revenue
,
2016
A
,
Refunding
,
4
%
,
10/01/42
..........
16,430,000
16,464,099
Los
Angeles
Department
of
Water
&
Power
,
Power
System
,
Revenue
,
2017
A
,
5
%
,
7/01/42
............................
22,375,000
22,655,480
Power
System
,
Revenue
,
2017
A
,
5
%
,
7/01/47
............................
81,890,000
82,463,959
Power
System
,
Revenue
,
2017
C
,
5
%
,
7/01/42
............................
5,500,000
5,609,670
Power
System
,
Revenue
,
2018
A
,
Refunding
,
5
%
,
7/01/38
...................
12,870,000
13,294,854
Power
System
,
Revenue
,
2018
D
,
Refunding
,
5
%
,
7/01/39
...................
4,305,000
4,470,556
Power
System
,
Revenue
,
2018
D
,
Refunding
,
5
%
,
7/01/43
...................
5,000,000
5,161,718
Power
System
,
Revenue
,
2019
A
,
5.25
%
,
7/01/49
.........................
12,555,000
12,909,763
Power
System
,
Revenue
,
2019
D
,
Refunding
,
5
%
,
7/01/49
...................
12,960,000
13,278,851
Power
System
,
Revenue
,
2020
B
,
Refunding
,
5
%
,
7/01/40
...................
9,020,000
9,652,804
Power
System
,
Revenue
,
2020
B
,
Refunding
,
5
%
,
7/01/50
...................
11,650,000
11,975,072
Power
System
,
Revenue
,
2021
B
,
Refunding
,
5
%
,
7/01/48
...................
3,245,000
3,367,849
Power
System
,
Revenue
,
2021
C
,
5
%
,
7/01/51
............................
17,555,000
18,116,771
Power
System
,
Revenue
,
2022
A
,
5
%
,
7/01/51
............................
8,500,000
8,772,005
Power
System
,
Revenue
,
2022
B
,
5
%
,
7/01/40
............................
5,000,000
5,497,069
Power
System
,
Revenue
,
2022
C
,
Refunding
,
5
%
,
7/01/42
...................
5,500,000
5,949,502
Power
System
,
Revenue
,
2022
C
,
Refunding
,
5
%
,
7/01/43
...................
6,250,000
6,713,094
Power
System
,
Revenue
,
2024
B
,
Refunding
,
5
%
,
7/01/39
...................
6,000,000
6,759,974
Water
System
,
Revenue
,
2017
A
,
Refunding
,
5
%
,
7/01/41
...................
34,330,000
34,793,211
Water
System
,
Revenue
,
2017
A
,
Refunding
,
5
%
,
7/01/44
...................
36,615,000
36,993,119
Water
System
,
Revenue
,
2018
B
,
Refunding
,
5
%
,
7/01/43
...................
9,495,000
9,802,102
Water
System
,
Revenue
,
2018
B
,
Refunding
,
5
%
,
7/01/48
...................
10,000,000
10,185,014
Franklin
California
Tax-Free
Income
Fund
Schedule
of
Investments
The
accompanying
notes
are
an
integral
part
of
these
financial
statements.
Annual
Report
a
a
Principal
Amount
a
Value
a
a
a
a
a
Municipal
Bonds
(continued)
California
(continued)
Los
Angeles
Department
of
Water
&
Power,
(continued)
Water
System
,
Revenue
,
2020
C
,
Refunding
,
5
%
,
7/01/39
...................
$
6,455,000
$
6,931,721
Water
System
,
Revenue
,
2022
C
,
Refunding
,
5
%
,
7/01/41
...................
2,970,000
3,251,996
Los
Angeles
Unified
School
District
,
GO
,
2020
RYQ
,
4
%
,
7/01/44
.........................................
10,730,000
10,836,106
GO
,
2023
QRR
,
5.25
%
,
7/01/48
.......................................
25,000,000
27,299,095
Manteca
Unified
School
District
,
Community
Facilities
District
No.
2018-5
,
Special
Tax
,
2024
A
,
5
%
,
9/01/44
......
5,755,000
5,977,155
Community
Facilities
District
No.
2018-5
,
Special
Tax
,
2024
A
,
5
%
,
9/01/54
......
6,230,000
6,296,667
Marin
Municipal
Water
District
,
Revenue
,
2022
,
Refunding
,
4
%
,
6/15/52
..........
27,295,000
25,849,443
Marina
Redevelopment
Agency
Successor
Agency
,
Tax
Allocation
,
2023
A
,
5
%
,
9/01/43
....................................
1,000,000
1,034,174
Tax
Allocation
,
2023
B
,
5
%
,
9/01/43
....................................
2,100,000
2,171,765
Menifee
Union
School
District
,
Special
Tax
,
2023
,
5
%
,
9/01/48
.......................................
500,000
511,725
Special
Tax
,
2023
,
5
%
,
9/01/54
.......................................
1,230,000
1,247,280
Community
Facilities
District
No.
2011-1
Improvement
Area
No.
5
,
Special
Tax
,
2021
,
4
%
,
9/01/45
....................................................
875,000
822,174
Community
Facilities
District
No.
2011-1
Improvement
Area
No.
7
,
Special
Tax
,
2022
,
5
%
,
9/01/42
....................................................
1,000,000
1,057,298
Community
Facilities
District
No.
2011-1
Improvement
Area
No.
7
,
Special
Tax
,
2022
,
5.125
%
,
9/01/47
.................................................
2,000,000
2,067,942
Community
Facilities
District
No.
2011-1
Improvement
Area
No.
7
,
Special
Tax
,
2022
,
5.25
%
,
9/01/52
..................................................
2,000,000
2,058,787
Community
Facilities
District
No.
2019-2
,
Special
Tax
,
2021
,
4
%
,
9/01/35
........
200,000
206,950
Community
Facilities
District
No.
2019-2
,
Special
Tax
,
2021
,
4
%
,
9/01/44
........
565,000
544,964
Community
Facilities
District
No.
2019-2
,
Special
Tax
,
2021
,
4
%
,
9/01/51
........
675,000
601,517
Metropolitan
Water
District
of
Southern
California
,
Revenue
,
2020
A
,
5
%
,
10/01/45
..
15,665,000
16,514,190
Middle
Fork
Project
Finance
Authority
,
Revenue
,
2020
,
Refunding
,
5
%
,
4/01/30
.................................
2,505,000
2,713,776
Revenue
,
2020
,
Refunding
,
5
%
,
4/01/32
.................................
4,095,000
4,420,343
Revenue
,
2020
,
Refunding
,
5
%
,
4/01/34
.................................
1,150,000
1,234,350
Revenue
,
2020
,
Refunding
,
5
%
,
4/01/35
.................................
1,200,000
1,283,601
Revenue
,
2020
,
Refunding
,
5
%
,
4/01/36
.................................
4,980,000
5,305,846
Midpeninsula
Regional
Open
Space
District
,
Field
Employees
Corp.
,
GO
,
2018
,
4
%
,
9/01/48
.........................................................
11,220,000
11,232,437
c
Modesto
High
School
District
,
GO
,
2002
A
,
NATL
Insured
,
2.29
%,
5/01/27
.........
12,770,000
12,436,107
Monterey
Peninsula
Unified
School
District
,
GO
,
2016
C
,
Refunding
,
5
%
,
8/01/41
...
11,190,000
11,294,734
c
Moorpark
Unified
School
District
,
GO
,
2009
A
,
AG
Insured
,
2.57
%,
8/01/32
........
5,870,000
4,988,408
Moreno
Valley
Unified
School
District
,
c
GO
,
2004
A
,
AG
Insured
,
ETM,
2.18
%,
8/01/27
...........................
6,315,000
6,124,363
c
GO
,
2004
A
,
AG
Insured
,
ETM,
2.18
%,
8/01/28
...........................
6,625,000
6,287,837
GO
,
2018
B
,
AG
Insured
,
5
%
,
8/01/47
..................................
6,075,000
6,222,281
Community
Facilities
District
No.
2022-1
,
Special
Tax
,
2025
,
5.125
%
,
9/01/55
.....
1,500,000
1,522,172
Community
Facilities
District
No.
2023-1
,
Special
Tax
,
2025
,
5
%
,
9/01/50
........
1,205,000
1,224,541
Community
Facilities
District
No.
2023-1
,
Special
Tax
,
2025
,
5
%
,
9/01/55
........
1,650,000
1,668,417
Mount
San
Jacinto
Community
College
District
,
GO
,
2014
B
,
4
%
,
8/01/43
.........
7,200,000
7,231,119
M-S-R
Energy
Authority
,
Revenue
,
2009
B
,
6.5
%
,
11/01/39
....................
25,000,000
31,317,390
c
Mt.
San
Antonio
Community
College
District
,
GO
,
2013
A
,
6.005
%,
8/01/43
........
55,000,000
57,584,142
Municipal
Water
District
of
Orange
County
Water
Facilities
Corp.
,
COP
,
2003
B
,
NATL
Insured
,
ETM,
5
%
,
8/15/34
...........................
3,305,000
3,745,207
COP
,
2003
B
,
Pre-Refunded
,
NATL
Insured
,
5
%
,
8/15/34
....................
4,140,000
4,853,781
Murrieta
Valley
Unified
School
District
,
Community
Facilities
District
No.
2018-1
,
Special
Tax
,
2021
,
4
%
,
9/01/44
........
500,000
473,081
Community
Facilities
District
No.
2018-1
,
Special
Tax
,
2021
,
4
%
,
9/01/51
........
1,000,000
871,070
Newport
Mesa
Unified
School
District
,
GO
,
2011
,
6.3
%
,
8/01/42
................
20,000,000
23,112,510
Franklin
California
Tax-Free
Income
Fund
Schedule
of
Investments
Annual
Report
The
accompanying
notes
are
an
integral
part
of
these
financial
statements.
a
a
Principal
Amount
a
Value
a
a
a
a
a
Municipal
Bonds
(continued)
California
(continued)
Norman
Y
Mineta
San
Jose
International
Airport
SJC
,
Revenue
,
2017
A
,
Refunding
,
5
%
,
3/01/36
...............................
$
4,590,000
$
4,673,539
Revenue
,
2017
A
,
Refunding
,
5
%
,
3/01/37
...............................
4,475,000
4,550,931
Revenue
,
2017
A
,
Refunding
,
5
%
,
3/01/41
...............................
12,685,000
12,849,504
Revenue
,
2017
B
,
Refunding
,
5
%
,
3/01/47
...............................
10,000,000
10,114,785
Revenue
,
2021
A
,
Refunding
,
5
%
,
3/01/32
...............................
1,800,000
1,985,937
Oceanside
Unified
School
District
,
c
GO
,
2010
B
,
AG
Insured
,
3.33
%,
8/01/38
................................
10,590,000
7,051,297
c
GO
,
2010
B
,
AG
Insured
,
3.44
%,
8/01/39
................................
7,860,000
4,990,246
GO
,
2022
,
Refunding
,
5
%
,
8/01/39
.....................................
1,005,000
1,117,026
GO
,
G
,
5
%
,
8/01/40
................................................
1,020,000
1,128,274
GO
,
G
,
5
%
,
8/01/43
................................................
1,000,000
1,082,609
Orange
County
Community
Facilities
District
,
Community
Facilities
District
No.
2023-1
,
Special
Tax
,
2023
A
,
5.5
%
,
8/15/48
.....
1,550,000
1,631,523
Community
Facilities
District
No.
2023-1
,
Special
Tax
,
2023
A
,
5.5
%
,
8/15/53
.....
1,200,000
1,253,483
Community
Facilities
District
No.
2023-1
,
Special
Tax
,
2023
A
,
5.75
%
,
8/15/53
....
1,085,000
1,150,195
Orange
County
Water
District
,
COP
,
2003
B
,
NATL
Insured
,
ETM,
5
%
,
8/15/28
.....
10,590,000
11,032,963
Palomar
Community
College
District
,
GO
,
2010
B
,
6.2
%
,
8/01/39
...............
69,410,000
90,572,075
Palomar
Health
,
Obligated
Group
,
GO
,
2009
A
,
AG
Insured
,
7
%
,
8/01/38
.....................
36,000,000
40,110,872
Obligated
Group
,
GO
,
2010
A
,
6.75
%
,
8/01/40
............................
60,000,000
64,604,514
Palomar
Health
Obligated
Group
,
Revenue
,
2017
,
Refunding
,
AG
Insured
,
5
%
,
11/01/47
.......................................................
35,000,000
35,049,714
Panoche
Financing
Authority
,
Panoche
Water
District
,
Revenue
,
2021
A
,
4
%
,
9/01/43
.....................
1,120,000
1,103,845
Panoche
Water
District
,
Revenue
,
2021
A
,
4
%
,
9/01/51
.....................
6,070,000
5,421,653
Panoche
Water
District
,
Revenue
,
2021
B
,
2.006
%
,
9/01/27
..................
395,000
380,064
Panoche
Water
District
,
Revenue
,
2021
B
,
2.456
%
,
9/01/29
..................
415,000
384,879
Panoche
Water
District
,
Revenue
,
2021
B
,
2.756
%
,
9/01/31
..................
435,000
388,417
Panoche
Water
District
,
Revenue
,
2021
B
,
3.106
%
,
9/01/35
..................
880,000
741,263
Panoche
Water
District
,
Revenue
,
2021
B
,
3.571
%
,
9/01/40
..................
1,155,000
901,630
c
Patterson
Joint
Unified
School
District
,
GO
,
2001
A
,
NATL
Insured
,
2.29
%,
8/01/26
..
2,265,000
2,243,280
Perris
Community
Facilities
District
,
Community
Facilities
District
No.
2022-3
Improvement
Area
No.
1
,
Special
Tax
,
2025
,
5
%
,
9/01/50
....................................................
1,560,000
1,575,786
Community
Facilities
District
No.
2022-3
Improvement
Area
No.
1
,
Special
Tax
,
2025
,
5
%
,
9/01/56
....................................................
1,420,000
1,423,138
Perris
Joint
Powers
Authority
,
Special
Tax
,
2025
,
5
%
,
9/01/50
.......................................
2,820,000
2,857,862
Special
Tax
,
2025
,
5
%
,
9/01/54
.......................................
3,310,000
3,345,420
Community
Facilities
District
No.
2007-2
,
Special
Tax
,
2021
,
4
%
,
9/01/43
........
1,445,000
1,380,125
Community
Facilities
District
No.
2007-2
,
Special
Tax
,
2021
,
4
%
,
9/01/48
........
1,250,000
1,118,687
Community
Facilities
District
No.
2018-1
Improvement
Area
No.
1
,
Special
Tax
,
2020
,
4
%
,
9/01/50
....................................................
1,125,000
977,783
Perris
Union
High
School
District
,
GO
,
2019
A
,
AG
Insured
,
4
%
,
9/01/43
..........
5,540,000
5,594,100
Pittsburg
Unified
School
District
,
GO
,
2016
,
Refunding
,
4
%
,
8/01/44
.............
11,000,000
11,009,097
c
Placentia-Yorba
Linda
Unified
School
District
,
GO
,
2008
D
,
3.96
%,
8/01/43
.........................................
27,955,000
14,204,822
GO
,
2008
D
,
4.53
%,
8/01/46
.........................................
89,200,000
36,089,080
GO
,
2008
D
,
4.62
%,
8/01/49
.........................................
85,000,000
29,537,814
Port
of
Oakland
,
Revenue
,
2021
H
,
Refunding
,
5
%
,
11/01/29
...................
2,000,000
2,165,083
Poway
Redevelopment
Agency
Successor
Agency
,
Tax
Allocation
,
2015
A
,
Refunding
,
5
%
,
12/15/31
..........................
10,180,000
11,595,015
Tax
Allocation
,
2015
A
,
Refunding
,
5
%
,
12/15/32
..........................
11,215,000
12,964,691
Tax
Allocation
,
2015
A
,
Refunding
,
5
%
,
6/15/33
...........................
5,835,000
6,832,968
Franklin
California
Tax-Free
Income
Fund
Schedule
of
Investments
The
accompanying
notes
are
an
integral
part
of
these
financial
statements.
Annual
Report
a
a
Principal
Amount
a
Value
a
a
a
a
a
Municipal
Bonds
(continued)
California
(continued)
Poway
Unified
School
District
,
Community
Facilities
District
No.
16
Area
A
,
Special
Tax
,
2020
,
AG
Insured
,
4
%
,
9/01/50
........................................................
$
7,500,000
$
7,068,343
c
School
Facilities
Improvement
District
No.
2007-1
,
GO
,
B
,
4.4
%,
8/01/46
........
45,000,000
18,669,883
Rancho
Mirage
Community
Facilities
District
,
City
of
Rancho
Mirage
Community
Facilities
District
No.
4C
,
Special
Tax
,
2022
,
5
%
,
9/01/42
........................................................
300,000
309,245
City
of
Rancho
Mirage
Community
Facilities
District
No.
4C
,
Special
Tax
,
2022
,
5
%
,
9/01/47
........................................................
500,000
509,142
City
of
Rancho
Mirage
Community
Facilities
District
No.
4C
,
Special
Tax
,
2022
,
5
%
,
9/01/53
........................................................
1,000,000
1,010,757
Regents
of
the
University
of
California
,
Medical
Center
,
Revenue
,
2016
L
,
Refunding
,
5
%
,
5/15/41
...................
10,000,000
10,041,762
Medical
Center
,
Revenue
,
2022
P
,
5
%
,
5/15/47
...........................
106,410,000
113,199,596
Medical
Center
,
Revenue
,
2022
P
,
4
%
,
5/15/53
...........................
84,305,000
79,563,603
c
Rialto
Unified
School
District
,
GO
,
2011
A
,
AG
Insured
,
7.268
%,
8/01/41
..........
27,000,000
35,327,121
c
Rio
Hondo
Community
College
District
,
GO
,
2010
C
,
2.84
%,
8/01/35
.............
10,000,000
7,683,360
River
Islands
Public
Financing
Authority
,
Community
Facilities
District
No
2003-1
Improvement
Area
No.
1
,
Special
Tax
,
2022
A-1
,
Refunding
,
AG
Insured
,
5
%
,
9/01/42
..............................
4,000,000
4,320,639
Community
Facilities
District
No
2003-1
Improvement
Area
No.
1
,
Special
Tax
,
2022
A-1
,
Refunding
,
AG
Insured
,
4.25
%
,
9/01/47
............................
6,000,000
6,012,972
Community
Facilities
District
No
2003-1
Improvement
Area
No.
1
,
Special
Tax
,
2022
A-1
,
Refunding
,
AG
Insured
,
5.25
%
,
9/01/52
............................
11,000,000
11,673,871
Riverside
Unified
School
District
,
Special
Tax
,
2025
,
5
%
,
9/01/55
.......................................
4,250,000
4,308,322
Community
Facilities
District
No.
19
Improvement
Area
No.
1
,
Special
Tax
,
2024
,
5
%
,
9/01/39
........................................................
375,000
401,389
Community
Facilities
District
No.
19
Improvement
Area
No.
1
,
Special
Tax
,
2024
,
5
%
,
9/01/44
........................................................
700,000
730,689
Community
Facilities
District
No.
19
Improvement
Area
No.
1
,
Special
Tax
,
2024
,
5
%
,
9/01/49
........................................................
1,050,000
1,071,782
Community
Facilities
District
No.
19
Improvement
Area
No.
1
,
Special
Tax
,
2024
,
5
%
,
9/01/54
........................................................
1,270,000
1,289,441
Community
Facilities
District
No.
19
Improvement
Area
No.
2
,
Special
Tax
,
2024
,
5
%
,
9/01/44
........................................................
480,000
501,044
Community
Facilities
District
No.
19
Improvement
Area
No.
2
,
Special
Tax
,
2024
,
5
%
,
9/01/49
........................................................
730,000
745,144
Community
Facilities
District
No.
19
Improvement
Area
No.
2
,
Special
Tax
,
2024
,
5
%
,
9/01/54
........................................................
775,000
786,864
Community
Facilities
District
No.
21
Improvement
Area
No.
1
,
Special
Tax
,
2025
,
5
%
,
9/01/50
........................................................
1,160,000
1,180,434
Community
Facilities
District
No.
21
Improvement
Area
No.
1
,
Special
Tax
,
2025
,
5
%
,
9/01/55
........................................................
1,480,000
1,499,607
Community
Facilities
District
No.
29
Improvement
Area
No.
1
,
Special
Tax
,
2025
,
5
%
,
9/01/45
........................................................
700,000
727,141
Community
Facilities
District
No.
29
Improvement
Area
No.
1
,
Special
Tax
,
2025
,
5
%
,
9/01/50
........................................................
1,000,000
1,019,016
Community
Facilities
District
No.
29
Improvement
Area
No.
1
,
Special
Tax
,
2025
,
5
%
,
9/01/55
........................................................
1,400,000
1,420,499
Community
Facilities
District
No.
37
,
Special
Tax
,
2023
A
,
5
%
,
9/01/47
..........
1,150,000
1,178,447
Community
Facilities
District
No.
37
,
Special
Tax
,
2023
A
,
5
%
,
9/01/52
..........
2,135,000
2,168,186
Community
Facilities
District
No.
38
,
Special
Tax
,
2025
,
5
%
,
9/01/50
...........
2,200,000
2,244,067
Community
Facilities
District
No.
40
,
Special
Tax
,
2025
A
,
5
%
,
9/01/50
..........
2,500,000
2,547,541
Community
Facilities
District
No.
40
,
Special
Tax
,
2025
A
,
5
%
,
9/01/55
..........
2,510,000
2,546,752
Community
Facilities
District
No.
41
Improvement
Area
No.
1
,
Special
Tax
,
2025
,
5
%
,
9/01/50
........................................................
2,210,000
2,254,267
Franklin
California
Tax-Free
Income
Fund
Schedule
of
Investments
Annual
Report
The
accompanying
notes
are
an
integral
part
of
these
financial
statements.
a
a
Principal
Amount
a
Value
a
a
a
a
a
Municipal
Bonds
(continued)
California
(continued)
Riverside
Unified
School
District,
(continued)
Community
Facilities
District
No.
41
Improvement
Area
No.
1
,
Special
Tax
,
2025
,
5
%
,
9/01/55
........................................................
$
3,210,000
$
3,254,050
e
RMA
Capital
Series
Trust
,
Revenue
,
144A,
2022-1
,
A
,
5.67
%
,
8/01/58
............
15,491,000
14,663,691
c
Rocklin
Unified
School
District
,
GO
,
2003
,
NATL
Insured
,
2.27
%,
8/01/26
................................
8,695,000
8,612,681
GO
,
2003
,
NATL
Insured
,
2.33
%,
8/01/27
................................
9,080,000
8,786,978
GO
,
2003
,
NATL
Insured
,
2.39
%,
8/01/28
................................
16,615,000
15,689,890
Rohnert
Park
Community
Development
Commission
Successor
Agency
,
Tax
Allocation
,
2007
R
,
NATL
Insured
,
ETM,
5
%
,
8/01/37
...............................
1,380,000
1,444,944
Romoland
School
District
,
Community
Facilities
District
No.
2016-1
,
Special
Tax
,
2023
,
5
%
,
9/01/43
........
750,000
792,708
Community
Facilities
District
No.
2016-1
,
Special
Tax
,
2023
,
5
%
,
9/01/48
........
1,000,000
1,029,195
Community
Facilities
District
No.
2016-1
,
Special
Tax
,
2023
,
5
%
,
9/01/53
........
1,500,000
1,528,004
Community
Facilities
District
No.
2016-2
,
Special
Tax
,
2022
,
4.5
%
,
9/01/42
.......
360,000
367,109
Community
Facilities
District
No.
2016-2
,
Special
Tax
,
2022
,
4.625
%
,
9/01/47
.....
750,000
749,880
Community
Facilities
District
No.
2016-2
,
Special
Tax
,
2022
,
4.75
%
,
9/01/52
......
1,000,000
989,676
Community
Facilities
District
No.
2017-1
Improvement
Area
No.
1
,
Special
Tax
,
2022
,
5
%
,
9/01/42
....................................................
750,000
792,095
Community
Facilities
District
No.
2017-1
Improvement
Area
No.
1
,
Special
Tax
,
2022
,
5.125
%
,
9/01/47
.................................................
1,200,000
1,240,765
Community
Facilities
District
No.
2017-1
Improvement
Area
No.
1
,
Special
Tax
,
2022
,
5.25
%
,
9/01/53
..................................................
2,500,000
2,568,949
Community
Facilities
District
No.
2017-1
Improvement
Area
No.
2
,
Special
Tax
,
2023
,
5
%
,
9/01/46
....................................................
370,000
382,335
Community
Facilities
District
No.
2017-1
Improvement
Area
No.
2
,
Special
Tax
,
2023
,
5
%
,
9/01/54
....................................................
1,600,000
1,623,485
Community
Facilities
District
No.
2020-1
,
Special
Tax
,
2024
,
5
%
,
9/01/54
........
1,000,000
1,014,179
Community
Facilities
District
No.
2022-2
,
Special
Tax
,
2024
,
5
%
,
9/01/54
........
1,500,000
1,521,269
Community
Facilities
District
No.
2023-1
Improvement
Area
No.
1
,
Special
Tax
,
2025
,
5
%
,
9/01/55
....................................................
1,000,000
1,016,773
Community
Facilities
District
No.
91-1
,
Special
Tax
,
2022
,
3.75
%
,
9/01/42
........
1,695,000
1,599,054
Community
Facilities
District
No.
91-1
,
Special
Tax
,
2022
,
4
%
,
9/01/46
..........
5,085,000
4,707,252
Sacramento
Area
Flood
Control
Agency
,
Consolidated
Capital
Assessment
District
No.
2
,
Special
Assessment
,
2016
A
,
Refunding
,
5
%
,
10/01/41
...........................................
13,740,000
13,903,663
Consolidated
Capital
Assessment
District
No.
2
,
Special
Assessment
,
2016
A
,
Refunding
,
5
%
,
10/01/43
...........................................
20,000,000
20,209,328
Sacramento
City
Unified
School
District
,
GO
,
2017
E
,
4
%
,
5/01/47
...............
20,000,000
18,778,480
Sacramento
Municipal
Utility
District
,
Revenue
,
2022
J
,
Refunding
,
5
%
,
8/15/26
....
2,615,000
2,653,898
c
San
Bernardino
Community
College
District
,
GO
,
2009
B
,
4.42
%,
8/01/48
.........
66,390,000
25,182,564
San
Diego
Community
College
District
,
GO
,
2009
B
,
Pre-Refunded
,
6
%
,
8/01/33
................................
26,880,000
28,448,690
GO
,
2024
A-1
,
4
%
,
8/01/50
..........................................
10,000,000
9,776,639
San
Diego
County
Regional
Airport
Authority
,
Revenue
,
2019
A
,
Refunding
,
5
%
,
7/01/44
...............................
4,000,000
4,208,835
Revenue
,
2019
A
,
Refunding
,
5
%
,
7/01/49
...............................
5,000,000
5,160,678
Revenue
,
2019
B
,
Refunding
,
4
%
,
7/01/44
...............................
5,000,000
4,835,866
Revenue
,
2021
A
,
5
%
,
7/01/56
........................................
10,000,000
10,372,883
Revenue
,
2021
B
,
5
%
,
7/01/33
........................................
4,000,000
4,452,202
Revenue
,
2021
B
,
4
%
,
7/01/36
........................................
3,610,000
3,751,530
Revenue,
Sub.
Lien
,
2017
A
,
Refunding
,
5
%
,
7/01/47
.......................
5,000,000
5,073,244
Special
Facilities
,
Revenue
,
2014
A
,
5
%
,
7/01/44
..........................
5,645,000
5,662,953
San
Diego
County
Regional
Transportation
Commission
,
Revenue
,
2016
A
,
5
%
,
4/01/48
.........................................................
19,600,000
19,649,598
San
Diego
County
Water
Authority
,
Revenue,
Sub.
Lien
,
2021
S-1
,
Refunding
,
5
%
,
5/01/28
......................................................
2,335,000
2,488,718
Franklin
California
Tax-Free
Income
Fund
Schedule
of
Investments
The
accompanying
notes
are
an
integral
part
of
these
financial
statements.
Annual
Report
a
a
Principal
Amount
a
Value
a
a
a
a
a
Municipal
Bonds
(continued)
California
(continued)
San
Diego
Unified
School
District
,
c
GO
,
2010
C
,
6.145
%,
7/01/48
........................................
$
29,840,000
$
29,482,215
c
GO
,
2012
E
,
5.195
%,
7/01/47
.........................................
74,270,000
61,771,525
GO
,
2019
L
,
4
%
,
7/01/49
............................................
30,000
29,600
GO
,
2023
ZR-4B
,
Refunding
,
5
%
,
7/01/40
...............................
62,225,000
71,687,307
GO
,
2023
ZR-4B
,
Refunding
,
5
%
,
7/01/45
...............................
31,605,000
34,845,069
GO
,
2025
C-3
,
5
%
,
7/01/50
..........................................
40,000,000
43,004,488
GO
,
2025
I-3
,
5
%
,
7/01/55
...........................................
10,000,000
10,660,890
c
GO
,
R-2
,
Refunding
,
6.484
%,
7/01/40
..................................
79,760,000
90,192,943
San
Francisco
Bay
Area
Rapid
Transit
District
,
GO
,
2017
A-1
,
5
%
,
8/01/47
..........................................
11,480,000
11,687,217
GO
,
2022
D-1
,
3
%
,
8/01/41
..........................................
23,605,000
22,496,455
GO
,
2022
D-1
,
3
%
,
8/01/42
..........................................
20,000,000
18,687,298
San
Francisco
City
&
County
Airport
Comm-San
Francisco
International
Airport
,
Revenue
,
2016
B
,
5
%
,
5/01/41
........................................
65,645,000
65,796,587
Revenue
,
2016
B
,
5
%
,
5/01/46
........................................
28,825,000
28,856,275
Revenue
,
2016
C
,
5
%
,
5/01/46
........................................
67,880,000
68,025,698
Revenue
,
2019
A
,
5
%
,
5/01/44
........................................
30,720,000
31,650,988
Revenue
,
2019
A
,
5
%
,
5/01/49
........................................
8,000,000
8,123,596
Revenue,
Second
Series
,
2017
A
,
5
%
,
5/01/42
............................
48,155,000
48,881,279
Revenue,
Second
Series
,
2017
A
,
5
%
,
5/01/47
............................
28,625,000
28,830,373
Revenue,
Second
Series
,
2017
B
,
5
%
,
5/01/47
............................
200,000
202,889
Revenue,
Second
Series
,
2018
D
,
5
%
,
5/01/43
...........................
106,295,000
109,094,024
Revenue,
Second
Series
,
2018
D
,
5
%
,
5/01/48
...........................
33,675,000
34,067,519
Revenue,
Second
Series
,
2018
D
,
Pre-Refunded
,
5
%
,
5/01/48
................
25,000
25,993
Revenue,
Second
Series
,
2018
D
,
5.25
%
,
5/01/48
.........................
50,145,000
51,078,645
Revenue,
Second
Series
,
2018
E
,
5
%
,
5/01/48
............................
46,990,000
48,161,902
Revenue,
Second
Series
,
2019
B
,
5
%
,
5/01/49
............................
15,955,000
16,481,968
Revenue,
Second
Series
,
2019
E
,
5
%
,
5/01/45
............................
33,570,000
34,439,037
Revenue,
Second
Series
,
2019
E
,
5
%
,
5/01/50
............................
5,000,000
5,064,468
Revenue,
Second
Series
,
2021
A
,
Refunding
,
5
%
,
5/01/31
...................
1,405,000
1,579,781
Revenue,
Second
Series
,
2021
A
,
Refunding
,
5
%
,
5/01/34
...................
5,000,000
5,555,860
San
Francisco
City
&
County
Redevelopment
Agency
Successor
Agency
,
Tax
Allocation,
Third
Lien
,
2017
B
,
AG
Insured
,
5
%
,
8/01/46
.....................
10,000,000
10,168,596
San
Francisco
Unified
School
District
,
GO
,
2022
C
,
5
%
,
6/15/35
................
6,640,000
7,362,039
c
San
Gabriel
Unified
School
District
,
GO
,
2002
A
,
AG
Insured
,
2.26
%,
8/01/26
................................
3,530,000
3,496,723
GO
,
2002
A
,
AG
Insured
,
2.28
%,
2/01/27
................................
1,850,000
1,811,749
San
Jacinto
Unified
School
District
,
Community
Facilities
District
No.
2003-1
,
Special
Tax
,
2022
,
4
%
,
9/01/50
........
875,000
758,244
Community
Facilities
District
No.
2022-1
Improvement
Area
No.
1
,
Special
Tax
,
2023
,
5.25
%
,
9/01/54
..................................................
1,000,000
1,027,114
San
Joaquin
Hills
Transportation
Corridor
Agency
,
Revenue
,
1997
A
,
Refunding
,
5.9
%
,
1/15/38
..............................
106,465,000
139,054,863
Revenue
,
1997
A
,
Refunding
,
5.95
%
,
1/15/40
.............................
142,645,000
186,307,508
Revenue
,
1997
A
,
Refunding
,
6
%
,
1/15/43
...............................
161,250,000
210,584,986
Revenue
,
1997
A
,
Refunding
,
6
%
,
1/15/45
...............................
143,336,000
185,821,077
Revenue
,
1997
A
,
Refunding
,
6
%
,
1/15/46
...............................
143,336,000
185,342,994
c
Revenue,
Senior
Lien
,
1993
,
ETM,
1.98
%,
1/01/28
.........................
33,545,000
32,357,919
c
Revenue,
Senior
Lien
,
1993
,
ETM,
2.01
%,
1/01/29
.........................
37,050,000
35,016,692
Revenue,
Senior
Lien
,
2021
A
,
Refunding
,
AG
Insured
,
4
%
,
1/15/44
............
130,746,000
130,880,564
Revenue,
Senior
Lien
,
2021
A
,
Refunding
,
AG
Insured
,
4
%
,
1/15/50
............
191,775,000
183,630,335
d
San
Joaquin
Valley
Clean
Energy
Authority
,
Revenue
,
2025
A
,
Mandatory
Put
,
5.5
%
,
7/01/35
.........................................................
21,250,000
24,224,756
c
San
Jose
Unified
School
District
,
COP
,
2002
,
AG
Insured
,
ETM,
2.32
%,
1/01/27
............................
7,105,000
6,969,122
COP
,
2002
,
AG
Insured
,
ETM,
2.36
%,
1/01/29
............................
7,105,000
6,649,589
Franklin
California
Tax-Free
Income
Fund
Schedule
of
Investments
Annual
Report
The
accompanying
notes
are
an
integral
part
of
these
financial
statements.
a
a
Principal
Amount
a
Value
a
a
a
a
a
Municipal
Bonds
(continued)
California
(continued)
c
San
Juan
Unified
School
District
,
GO
,
2003
B
,
NATL
Insured
,
2.17
%,
8/01/26
..............................
$
4,945,000
$
4,900,193
GO
,
2003
B
,
NATL
Insured
,
2.33
%,
8/01/27
..............................
18,605,000
18,004,594
GO
,
2003
B
,
NATL
Insured
,
2.39
%,
8/01/28
..............................
19,470,000
18,385,926
San
Luis
Obispo
County
Financing
Authority
,
Revenue
,
2015
A
,
Refunding
,
BAM
Insured
,
5
%
,
9/01/37
...............................................
10,000,000
10,008,361
San
Rafael
City
High
School
District
,
GO
,
2018
B
,
4
%
,
8/01/47
.................
17,060,000
16,684,926
Sanger
Unified
School
District
,
GO
,
A
,
BAM
Insured
,
4
%
,
8/01/41
...............
10,000,000
10,064,330
c
School
Facilities
Financing
Authority
,
Twin
Rivers
Unified
School
District
,
Revenue
,
A
,
AG
Insured
,
3.95
%,
8/01/42
..........................................
49,000,000
25,955,604
Semitropic
Improvement
District
of
the
Semitropic
Water
Storage
District
,
Revenue,
Second
Lien
,
2015
A
,
Refunding
,
AG
Insured
,
5
%
,
12/01/45
..................
10,000,000
10,010,884
Southern
California
Public
Power
Authority
,
Revenue
,
2007
A
,
5.25
%
,
11/01/27
.....................................
9,855,000
10,279,081
Revenue
,
2007
A
,
5
%
,
11/01/33
.......................................
17,500,000
19,827,428
Apex
Power
Project
,
Revenue
,
2024
A
,
Refunding
,
5
%
,
7/01/31
...............
10,000,000
11,314,792
d
City
of
Anaheim
Electric
System
,
Revenue
,
2024
A
,
Mandatory
Put
,
5
%
,
9/01/30
..
47,875,000
51,533,043
Los
Angeles
Department
of
Water
&
Power
Power
System
,
Revenue
,
2023-1
A
,
5.25
%
,
7/01/53
..................................................
28,975,000
30,610,674
c
Southern
Mono
Health
Care
District
,
GO
,
A
,
NATL
Insured
,
2.77
%,
8/01/28
...................................
2,340,000
2,190,311
GO
,
A
,
NATL
Insured
,
2.8
%,
8/01/29
...................................
2,440,000
2,220,095
GO
,
A
,
NATL
Insured
,
2.83
%,
8/01/30
...................................
2,550,000
2,254,427
GO
,
A
,
NATL
Insured
,
2.9
%,
8/01/31
...................................
2,660,000
2,278,389
State
of
California
,
GO
,
Refunding
,
5
%
,
8/01/28
.........................................
12,020,000
12,534,523
GO
,
Refunding
,
5
%
,
11/01/30
.........................................
5,320,000
6,037,858
GO
,
5.75
%
,
10/01/31
...............................................
28,805,000
31,553,372
GO
,
Refunding
,
5
%
,
10/01/32
.........................................
4,125,000
4,539,978
GO
,
5
%
,
3/01/35
..................................................
55,020,000
60,761,502
GO
,
Pre-Refunded
,
5
%
,
3/01/35
.......................................
1,165,000
1,303,581
GO
,
Refunding
,
5
%
,
9/01/35
.........................................
9,000,000
9,118,401
GO
,
Refunding
,
4
%
,
3/01/37
.........................................
10,000,000
10,498,446
GO
,
Refunding
,
5
%
,
8/01/37
.........................................
2,900,000
3,069,259
GO
,
5
%
,
8/01/45
..................................................
21,540,000
24,117,123
f
GO
,
Refunding
,
5
%
,
8/01/45
.........................................
33,750,000
37,787,972
GO
,
5
%
,
9/01/45
..................................................
5,000,000
5,029,187
GO
,
5
%
,
8/01/46
..................................................
57,200,000
57,441,092
GO
,
5
%
,
9/01/46
..................................................
8,930,000
8,975,995
GO
,
5
%
,
10/01/47
.................................................
11,000,000
11,007,857
GO
,
5
%
,
10/01/48
.................................................
5,000,000
5,146,474
f
GO
,
5
%
,
8/01/50
..................................................
27,360,000
29,609,107
GO
,
1996
,
FGIC
Insured
,
5.375
%
,
6/01/26
...............................
270,000
272,273
GO
,
1997
,
NATL,
FGIC
Insured
,
5.625
%
,
10/01/26
.........................
1,665,000
1,669,779
GO
,
2004
,
5.2
%
,
4/01/26
............................................
20,000
20,079
GO
,
2017
,
5
%
,
11/01/47
.............................................
23,370,000
23,784,402
GO
,
2022
,
Refunding
,
5
%
,
4/01/35
.....................................
38,600,000
44,564,835
State
of
California
Department
of
Water
Resources
,
Water
Supply
,
Revenue
,
2026
A
,
5
%
,
12/01/56
.....................................................
10,725,000
11,519,825
Stockton
Community
Facilities
District
,
City
of
Stockton
Community
Facilities
District
No.
2018-2
Improvement
Area
No.
3
,
Special
Tax
,
2024
,
5
%
,
9/01/49
......................................
525,000
526,483
City
of
Stockton
Community
Facilities
District
No.
2018-2
Improvement
Area
No.
3
,
Special
Tax
,
2024
,
5
%
,
9/01/54
......................................
650,000
646,591
Community
Facilities
District
No.
2018-2
Improvement
Area
No.
3
,
Special
Tax
,
2024
,
5
%
,
9/01/39
....................................................
370,000
398,445
Franklin
California
Tax-Free
Income
Fund
Schedule
of
Investments
The
accompanying
notes
are
an
integral
part
of
these
financial
statements.
Annual
Report
a
a
Principal
Amount
a
Value
a
a
a
a
a
Municipal
Bonds
(continued)
California
(continued)
Stockton
Community
Facilities
District,
(continued)
Community
Facilities
District
No.
2018-2
Improvement
Area
No.
3
,
Special
Tax
,
2024
,
5
%
,
9/01/44
....................................................
$
380,000
$
390,875
Sulphur
Springs
Union
School
District
,
COP
,
2010
,
AG
Insured
,
6.5
%
,
12/01/37
.................................
860,000
862,655
Community
Facilities
District
No.
2019-1
,
Special
Tax
,
2024
A
,
5
%
,
9/01/39
......
1,175,000
1,274,505
Community
Facilities
District
No.
2019-1
,
Special
Tax
,
2024
A
,
5
%
,
9/01/44
......
1,900,000
1,981,540
Community
Facilities
District
No.
2019-1
,
Special
Tax
,
2024
A
,
5
%
,
9/01/49
......
4,360,000
4,432,780
Community
Facilities
District
No.
2019-1
,
Special
Tax
,
2024
A
,
5
%
,
9/01/54
......
2,000,000
2,024,181
Sunnyvale
School
District
,
GO
,
2015
,
Refunding
,
4
%
,
9/01/42
..................
17,500,000
17,504,445
Temecula
Public
Financing
Authority
,
Community
Facilities
District
No.
20-01
,
Special
Tax
,
2024
,
5
%
,
9/01/39
.........
330,000
355,649
Community
Facilities
District
No.
20-01
,
Special
Tax
,
2024
,
5
%
,
9/01/44
.........
925,000
963,749
Community
Facilities
District
No.
20-01
,
Special
Tax
,
2024
,
5
%
,
9/01/49
.........
975,000
992,757
Community
Facilities
District
No.
20-01
,
Special
Tax
,
2024
,
5
%
,
9/01/54
.........
900,000
909,817
Community
Facilities
District
No.
23-02
,
Special
Tax
,
2025
,
5
%
,
9/01/50
.........
1,700,000
1,726,251
Community
Facilities
District
No.
23-02
,
Special
Tax
,
2025
,
5
%
,
9/01/56
.........
3,280,000
3,311,985
Temescal
Valley
Water
District
,
Community
Facilities
District
No.
4
Improvement
Area
No.
3
,
Special
Tax
,
2024
,
4
%
,
9/01/49
........................................................
1,415,000
1,280,824
Community
Facilities
District
No.
4
Terramor
Improvement
Area
No.
2
,
Special
Tax
,
2021
,
4
%
,
9/01/36
................................................
930,000
954,268
Community
Facilities
District
No.
4
Terramor
Improvement
Area
No.
2
,
Special
Tax
,
2021
,
4
%
,
9/01/41
................................................
785,000
787,552
Community
Facilities
District
No.
4
Terramor
Improvement
Area
No.
2
,
Special
Tax
,
2021
,
4
%
,
9/01/46
................................................
1,040,000
970,631
Community
Facilities
District
No.
4
Terramor
Improvement
Area
No.
2
,
Special
Tax
,
2021
,
4
%
,
9/01/51
................................................
930,000
828,756
Three
Rivers
Levee
Improvement
Authority
,
Special
Tax
,
2021
A
,
Refunding
,
4
%
,
9/01/36
.............................
2,025,000
2,049,493
Special
Tax
,
2021
A
,
Refunding
,
4
%
,
9/01/41
.............................
1,895,000
1,847,158
Special
Tax
,
2021
A
,
Refunding
,
4
%
,
9/01/46
.............................
2,700,000
2,449,166
Special
Tax
,
2021
A
,
Refunding
,
4
%
,
9/01/51
.............................
5,065,000
4,405,307
Tobacco
Securitization
Authority
of
Northern
California
,
Sacramento
County
Tobacco
Securitization
Corp.
,
Revenue,
Senior
Lien
,
2021
A
,
1
,
Refunding
,
4
%
,
6/01/49
....
8,000,000
6,985,618
Tobacco
Securitization
Authority
of
Southern
California
,
San
Diego
County
Tobacco
Asset
Securitization
Corp.
,
Revenue
,
2019
B-1
,
2
,
Refunding
,
5
%
,
6/01/48
.......
11,340,000
11,331,582
Town
of
Tiburon
,
Assessment
District
No.
2017-1
,
1915
Act,
Special
Assessment
,
2021
A
,
2.375
%
,
9/02/41
........................................................
495,000
367,123
Assessment
District
No.
2017-1
,
1915
Act,
Special
Assessment
,
2021
A
,
2.5
%
,
9/02/51
........................................................
1,105,000
674,450
Tracy
Community
Facilities
District
,
City
of
Tracy
Community
Facilities
District
No.
2016-01
Improvement
Area
No.
2
,
Special
Tax
,
2023
,
5.75
%
,
9/01/48
...................................
1,750,000
1,858,744
City
of
Tracy
Community
Facilities
District
No.
2016-01
Improvement
Area
No.
2
,
Special
Tax
,
2023
,
5.875
%
,
9/01/53
...................................
2,900,000
3,078,628
City
of
Tracy
Community
Facilities
District
No.
2016-02
Improvement
Area
No.
2
,
Special
Tax
,
2021
,
4
%
,
9/01/28
......................................
120,000
122,909
City
of
Tracy
Community
Facilities
District
No.
2016-02
Improvement
Area
No.
2
,
Special
Tax
,
2021
,
4
%
,
9/01/30
......................................
110,000
114,267
City
of
Tracy
Community
Facilities
District
No.
2016-02
Improvement
Area
No.
2
,
Special
Tax
,
2021
,
4
%
,
9/01/36
......................................
430,000
441,438
City
of
Tracy
Community
Facilities
District
No.
2016-02
Improvement
Area
No.
2
,
Special
Tax
,
2021
,
4
%
,
9/01/41
......................................
665,000
660,167
City
of
Tracy
Community
Facilities
District
No.
2016-02
Improvement
Area
No.
2
,
Special
Tax
,
2021
,
4
%
,
9/01/46
......................................
885,000
810,416
Franklin
California
Tax-Free
Income
Fund
Schedule
of
Investments
Annual
Report
The
accompanying
notes
are
an
integral
part
of
these
financial
statements.
a
a
Principal
Amount
a
Value
a
a
a
a
a
Municipal
Bonds
(continued)
California
(continued)
Tracy
Community
Facilities
District,
(continued)
City
of
Tracy
Community
Facilities
District
No.
2016-02
Improvement
Area
No.
2
,
Special
Tax
,
2021
,
4
%
,
9/01/51
......................................
$
2,210,000
$
1,930,898
Transbay
Joint
Powers
Authority
,
Transbay
Redevelopment
Project
Tax
Increment
Re-Development
Project
,
Tax
Allocation,
Senior
Lien
,
2020
A
,
5
%
,
10/01/45
...........................
8,830,000
8,944,294
Transbay
Redevelopment
Project
Tax
Increment
Re-Development
Project
,
Tax
Allocation,
Senior
Lien
,
2020
A
,
5
%
,
10/01/49
...........................
10,990,000
11,014,112
Truckee-Donner
Public
Utility
District
,
Water
System
,
Revenue
,
2022
A
,
5
%
,
11/15/47
3,230,000
3,436,469
Turlock
Irrigation
District
,
Revenue
,
2019
,
Refunding
,
5
%
,
1/01/44
...............
9,060,000
9,549,643
c
Union
Elementary
School
District
,
GO
,
2001
B
,
NATL
Insured
,
2.06
%,
9/01/26
......
5,850,000
5,789,567
University
of
California
,
Revenue
,
2016
K
,
4
%
,
5/15/46
........................................
19,850,000
19,546,708
Revenue
,
2017
AV
,
5.25
%
,
5/15/47
.....................................
6,775,000
6,909,407
Revenue
,
2017
M
,
5
%
,
5/15/42
.......................................
15,410,000
15,794,660
Revenue
,
2017
M
,
5
%
,
5/15/47
.......................................
54,015,000
54,916,311
Revenue
,
2018
AZ
,
Refunding
,
5
%
,
5/15/43
..............................
28,000,000
29,184,022
Revenue
,
2018
AZ
,
Refunding
,
5
%
,
5/15/48
..............................
47,230,000
48,589,251
Revenue
,
2018
AZ
,
Refunding
,
5.25
%
,
5/15/58
............................
9,110,000
9,349,107
Revenue
,
2018
O
,
Refunding
,
5
%
,
5/15/39
...............................
14,400,000
15,093,865
Revenue
,
2018
O
,
Refunding
,
5
%
,
5/15/48
...............................
11,445,000
11,769,486
Revenue
,
2018
O
,
Refunding
,
5
%
,
5/15/58
...............................
5,805,000
5,920,921
Revenue
,
2021
Q
,
Refunding
,
4
%
,
5/15/37
...............................
1,500,000
1,587,314
Revenue
,
2022
BK
,
5
%
,
5/15/52
.......................................
48,195,000
50,521,276
Revenue
,
2023
BN
,
Refunding
,
5
%
,
5/15/43
..............................
9,000,000
9,949,171
Revenue
,
2023
BQ
,
5
%
,
5/15/35
......................................
30,000,000
35,153,205
Revenue
,
2024
BV
,
Refunding
,
5
%
,
5/15/36
..............................
17,300,000
20,506,237
Revenue
,
2025
BZ
,
Refunding
,
5.25
%
,
5/15/38
...........................
5,750,000
6,908,339
Revenue
,
2025
CB
,
5
%
,
5/15/36
......................................
10,000,000
12,054,658
Revenue
,
2025
CB
,
5
%
,
5/15/39
......................................
13,460,000
15,705,322
Revenue
,
2025
CC
,
5
%
,
5/15/37
......................................
5,250,000
6,256,423
Revenue
,
2025
CC
,
5
%
,
5/15/38
......................................
8,975,000
10,585,763
Revenue
,
2025
CC
,
5
%
,
5/15/53
......................................
10,000,000
10,666,482
Upland
Community
Facilities
District
,
City
of
Upland
Community
Facilities
District
No.
2016-1
Improvement
Area
No.
2
,
Special
Tax
,
2021
A
,
4
%
,
9/01/40
....................................
260,000
260,020
City
of
Upland
Community
Facilities
District
No.
2016-1
Improvement
Area
No.
2
,
Special
Tax
,
2021
A
,
4
%
,
9/01/45
....................................
165,000
151,435
City
of
Upland
Community
Facilities
District
No.
2016-1
Improvement
Area
No.
2
,
Special
Tax
,
2021
A
,
4
%
,
9/01/51
....................................
260,000
222,665
c
Upland
Unified
School
District
,
GO
,
2011
C
,
4.37
%,
8/01/45
...................
62,900,000
27,407,002
Val
Verde
Unified
School
District
,
GO
,
2010
B
,
AG
Insured
,
6.125
%
,
8/01/34
...............................
1,000,000
1,224,708
Community
Facilities
District
No.
2018-1
,
Special
Tax
,
2022
,
4
%
,
9/01/52
........
7,000,000
6,090,095
Community
Facilities
District
No.
2018-2
Improvement
Area
No.
1
,
Special
Tax
,
2023
,
5
%
,
9/01/43
....................................................
1,230,000
1,289,028
Community
Facilities
District
No.
2018-2
Improvement
Area
No.
1
,
Special
Tax
,
2023
,
5
%
,
9/01/48
....................................................
1,755,000
1,797,382
Community
Facilities
District
No.
2018-2
Improvement
Area
No.
1
,
Special
Tax
,
2023
,
5
%
,
9/01/53
....................................................
2,445,000
2,484,068
Community
Facilities
District
No.
2018-2
Improvement
Area
No.
3
,
Special
Tax
,
2025
,
5
%
,
9/01/50
....................................................
1,230,000
1,255,980
Community
Facilities
District
No.
2018-2
Improvement
Area
No.
3
,
Special
Tax
,
2025
,
5
%
,
9/01/55
....................................................
1,785,000
1,813,628
Vallejo
Public
Financing
Authority
,
City
of
Vallejo
Hiddenbrooke
Improvement
District
No.
1
,
Revenue
,
2004
A
,
5.8
%
,
9/01/31
.................................
2,150,000
2,180,579
Franklin
California
Tax-Free
Income
Fund
Schedule
of
Investments
The
accompanying
notes
are
an
integral
part
of
these
financial
statements.
Annual
Report
a
a
Principal
Amount
a
Value
a
a
a
a
a
Municipal
Bonds
(continued)
California
(continued)
Valley
Center
Municipal
Water
District
,
Community
Facility
District
No.
2020-1
,
Special
Tax
,
2024
,
4
%
,
9/01/43
.........
$
1,265,000
$
1,227,803
Community
Facility
District
No.
2020-1
,
Special
Tax
,
2024
,
4.375
%
,
9/01/54
......
2,210,000
2,034,448
c
Vista
Unified
School
District
,
GO
,
2002
A
,
AG
Insured
,
2.26
%,
8/01/26
................................
7,150,000
7,082,598
GO
,
2002
A
,
AG
Insured
,
2.28
%,
2/01/27
................................
4,795,000
4,695,857
Washington
Township
Health
Care
District
,
GO
,
2015
B
,
5
%
,
8/01/45
............................................
15,000,000
15,010,185
Revenue
,
2023
A
,
5.75
%
,
7/01/48
.....................................
1,300,000
1,386,528
Revenue
,
2023
A
,
5.75
%
,
7/01/53
.....................................
1,000,000
1,047,879
West
Patterson
Financing
Authority
,
Community
Facilities
District
No.
2018-1
,
Special
Tax
,
2024
,
5
%
,
9/01/39
........
300,000
323,317
Community
Facilities
District
No.
2018-1
,
Special
Tax
,
2024
,
4.375
%
,
9/01/44
.....
830,000
824,335
Community
Facilities
District
No.
2018-1
,
Special
Tax
,
2024
,
4.625
%
,
9/01/49
.....
780,000
758,872
Community
Facilities
District
No.
2018-1
,
Special
Tax
,
2024
,
5
%
,
9/01/54
........
2,430,000
2,468,730
West
Sacramento
Area
Flood
Control
Agency
,
Special
Assessment
,
2015
,
AG
Insured
,
5
%
,
9/01/40
.......................
3,000,000
3,005,382
Special
Assessment
,
2015
,
AG
Insured
,
5
%
,
9/01/45
.......................
7,500,000
7,508,705
West
Sacramento
Financing
Authority
,
Special
Tax
,
A
,
AG
Insured
,
5
%
,
9/01/34
.....
4,940,000
5,664,357
Westside
Union
School
District
,
Community
Facilities
District
No.
2016-1
Improvement
Area
B
,
Special
Tax
,
2023
,
5
%
,
9/01/43
....................................................
1,175,000
1,193,243
Community
Facilities
District
No.
2016-1
Improvement
Area
B
,
Special
Tax
,
2023
,
5.25
%
,
9/01/52
..................................................
1,890,000
1,887,474
William
S
Hart
Union
High
School
District
,
Community
Facilities
District
No.
2021-1
Improvement
Area
A
,
Special
Tax
,
2024
,
5
%
,
9/01/44
....................................................
385,000
402,356
Community
Facilities
District
No.
2021-1
Improvement
Area
A
,
Special
Tax
,
2024
,
5
%
,
9/01/49
....................................................
750,000
765,673
Community
Facilities
District
No.
2021-1
Improvement
Area
A
,
Special
Tax
,
2024
,
5
%
,
9/01/54
....................................................
885,000
895,700
12,638,919,766
Florida
0.7%
c
,e
Capital
Trust
Authority
,
Gulf
Coast
Portfolio
Obligated
Group
,
Revenue
,
144A,
2024
,
Refunding
,
5.29
%,
3/01/29
...........................................
107,700,000
92,256,639
Wisconsin
0.2%
e
Public
Finance
Authority
,
Revenue
,
144A,
2022
,
B-1
,
4
%
,
12/28/44
..............
30,400,000
25,533,528
U.S.
Territories
2.0%
Guam
0.2%
Antonio
B
Won
Pat
International
Airport
Authority
,
Revenue
,
2021
A
,
Refunding
,
2.899
%
,
10/01/27
...........................
470,000
462,139
Revenue
,
2024
A
,
5
%
,
10/01/27
.......................................
160,000
164,428
Revenue
,
2024
A
,
5
%
,
10/01/28
.......................................
750,000
783,075
Revenue
,
2024
A
,
5
%
,
10/01/29
.......................................
1,330,000
1,409,139
Revenue
,
2024
A
,
5
%
,
10/01/30
.......................................
1,110,000
1,191,449
Revenue
,
2024
A
,
5
%
,
10/01/31
.......................................
935,000
1,015,697
Revenue
,
2024
A
,
5
%
,
10/01/33
.......................................
660,000
730,448
Revenue
,
2024
A
,
5.25
%
,
10/01/37
....................................
1,375,000
1,536,108
Revenue
,
2024
A
,
5.25
%
,
10/01/38
....................................
1,325,000
1,469,894
Revenue
,
2024
B
,
5
%
,
10/01/27
.......................................
410,000
422,243
Revenue
,
2024
B
,
5
%
,
10/01/28
.......................................
380,000
398,489
Revenue
,
2024
B
,
5
%
,
10/01/29
.......................................
1,010,000
1,077,144
Revenue
,
2024
B
,
5
%
,
10/01/30
.......................................
560,000
607,044
Revenue
,
2024
B
,
5
%
,
10/01/31
.......................................
510,000
560,014
Revenue
,
2024
B
,
5
%
,
10/01/32
.......................................
1,455,000
1,610,547
Franklin
California
Tax-Free
Income
Fund
Schedule
of
Investments
Annual
Report
The
accompanying
notes
are
an
integral
part
of
these
financial
statements.
a
a
Principal
Amount
a
Value
a
a
a
a
a
Municipal
Bonds
(continued)
U.S.
Territories
(continued)
Guam
(continued)
Antonio
B
Won
Pat
International
Airport
Authority,
(continued)
Revenue
,
2024
B
,
5
%
,
10/01/33
.......................................
$
305,000
$
341,449
Revenue
,
2024
B
,
5
%
,
10/01/34
.......................................
435,000
490,093
Revenue
,
2024
B
,
5
%
,
10/01/35
.......................................
520,000
586,855
Revenue
,
2024
B
,
5
%
,
10/01/36
.......................................
250,000
279,531
Revenue
,
2024
B
,
5
%
,
10/01/37
.......................................
1,095,000
1,216,067
Revenue
,
2024
B
,
5
%
,
10/01/38
.......................................
1,125,000
1,240,569
Revenue
,
2024
B
,
5
%
,
10/01/39
.......................................
1,125,000
1,232,581
Revenue
,
2024
B
,
5
%
,
10/01/40
.......................................
420,000
456,806
Revenue
,
2024
B
,
5
%
,
10/01/41
.......................................
1,150,000
1,234,810
Revenue
,
2024
B
,
5
%
,
10/01/42
.......................................
495,000
527,490
Revenue
,
2024
B
,
5
%
,
10/01/43
.......................................
500,000
527,424
Antonio
B.
Won
Pat
International
Airport
Authority
,
Revenue
,
2024
A
,
5
%
,
10/01/32
..
1,600,000
1,755,118
23,326,651
Puerto
Rico
1.8%
Children's
Trust
Fund
,
Revenue
,
2002
,
5.5
%
,
5/15/39
........................................
3,775,000
3,836,949
Revenue
,
2002
,
5.625
%
,
5/15/43
......................................
16,000,000
16,245,387
Puerto
Rico
Industrial
Tourist
Educational
Medical
&
Environmental
Control
Facilities
Financing
Authority
,
Revenue
,
2000
A
,
6.625
%
,
1/01/27
....................................
471,227
471,120
Revenue
,
2000
A
,
6.625
%
,
1/01/28
....................................
3,593,968
3,600,558
Puerto
Rico
Sales
Tax
Financing
Corp.
,
Sales
Tax
,
Revenue
,
A-1
,
4.75
%
,
7/01/53
................................
29,500,000
28,766,123
Sales
Tax
,
Revenue
,
A-1
,
5
%
,
7/01/58
..................................
184,264,000
180,860,367
233,780,504
Total
U.S.
Territories
....................................................................
257,107,155
Total
Municipal
Bonds
(Cost
$
12,350,092,593
)
..................................
13,013,817,088
Total
Long
Term
Investments
(Cost
$
12,350,092,593
)
............................
13,013,817,088
a
a
a
a
a
Short
Term
Investments
1.2%
Municipal
Bonds
1.2%
California
1.2%
h
California
Municipal
Finance
Authority
,
Boone
534
LLC
,
Revenue
,
2026
A
,
Daily
VRDN
and
Put
,
6
%
,
2/01/38
...............................................
33,820,000
34,114,285
h
Eastern
Municipal
Water
District
,
Revenue
,
2018
A
,
Refunding
,
SPA
Bank
of
America
NA
,
Daily
VRDN
and
Put
,
1.1
%
,
7/01/46
.................................
34,535,000
34,535,000
h
University
of
California
,
Revenue
,
2013
AL-1
,
Daily
VRDN
and
Put
,
1.2
%
,
5/15/48
...
88,645,000
88,645,000
157,294,285
Total
Municipal
Bonds
(Cost
$
157,000,000
)
.....................................
157,294,285
Total
Short
Term
Investments
(Cost
$
157,000,000
)
...............................
157,294,285
a
Total
Investments
(Cost
$
12,507,092,593
)
99.2
%
................................
$13,171,111,373
Other
Assets,
less
Liabilities
0.8
%
.............................................
112,980,629
Net
Assets
100.0%
...........................................................
$13,284,092,002
Franklin
California
Tax-Free
Income
Fund
Schedule
of
Investments
The
accompanying
notes
are
an
integral
part
of
these
financial
statements.
Annual
Report
See
Abbreviations
on
page
47
.
a
Fair
valued
using
significant
unobservable
inputs.
See
Note
9
regarding
fair
value
measurements.
b
Non-income
producing.
c
The
rate
shown
represents
the
yield
at
period
end.
d
The
maturity
date
shown
represents
the
mandatory
put
date.
e
Security
was
purchased
pursuant
to
Rule
144A
or
Regulation
S
under
the
Securities
Act
of
1933.
144A
securities
may
be
sold
in
transactions
exempt
from
registration
only
to
qualified
institutional
buyers
or
in
a
public
offering
registered
under
the
Securities
Act
of
1933.
Regulation
S
securities
cannot
be
sold
in
the
United
States
without
either
an
effective
registration
statement
filed
pursuant
to
the
Securities
Act
of
1933,
or
pursuant
to
an
exemption
from
registration.
At
February
28,
2026,
the
aggregate
value
of
these
securities
was
$1,315,856,916,
representing
9.9%
of
net
assets.
f
Security
purchased
on
a
when-issued
basis.
See
Note
1(b).
g
Defaulted
security
or
security
for
which
income
has
been
deemed
uncollectible.
See
Note
6.
h
Variable
rate
demand
notes
(VRDN)
are
obligations
which
contain
a
floating
or
variable
interest
rate
adjustment
formula
and
an
unconditional
right
of
demand
to
receive
pay-
ment
of
the
principal
balance
plus
accrued
interest
at
specified
dates.
Unless
otherwise
noted,
the
coupon
rate
is
determined
based
on
factors
including
supply
and
demand,
underlying
credit,
tax
treatment,
and
current
short
term
rates.
The
coupon
rate
shown
represents
the
rate
at
period
end.
Franklin
California
Tax-Free
Income
Fund
Financial
Statements
Statement
of
Assets
and
Liabilities
February
28,
2026
Annual
Report
The
accompanying
notes
are
an
integral
part
of
these
financial
statements.
Franklin
California
Tax-
Free
Income
Fund
Assets:
Investments
in
securities:
Cost
-
Unaffiliated
issuers
...................................................................
$12,507,092,593
Value
-
Unaffiliated
issuers
..................................................................
$13,171,111,373
Cash
....................................................................................
490,009
Receivables:
Capital
shares
sold
........................................................................
6,865,862
Interest
.................................................................................
136,249,093
Total
assets
..........................................................................
13,314,716,337
Liabilities:
Payables:
Capital
shares
redeemed
...................................................................
19,281,733
Management
fees
.........................................................................
4,867,880
Distribution
fees
..........................................................................
1,159,498
Transfer
agent
fees
........................................................................
1,756,784
Trustees'
fees
and
expenses
.................................................................
2,244
Distributions
to
shareholders
.................................................................
2,988,855
Accrued
expenses
and
other
liabilities
...........................................................
567,341
Total
liabilities
.........................................................................
30,624,335
Net
assets,
at
value
.................................................................
$13,284,092,002
Net
assets
consist
of:
Paid-in
capital
.............................................................................
$13,696,686,318
Total
distributable
earnings
(losses)
.............................................................
(412,594,316)
Net
assets,
at
value
.................................................................
$13,284,092,002
Franklin
California
Tax-Free
Income
Fund
Financial
Statements
Statement
of
Assets
and
Liabilities
(continued)
February
28,
2026
The
accompanying
notes
are
an
integral
part
of
these
financial
statements.
Annual
Report
Franklin
California
Tax-
Free
Income
Fund
Class
A:
Net
assets,
at
value
.......................................................................
$2,990,950,158
Shares
outstanding
........................................................................
434,324,897
Net
asset
value
per
share
a
,b
..................................................................
$6.89
Maximum
offering
price
per
share
(net
asset
value
per
share
÷
96
.25
%
)
b
................................
$7.16
Class
A1:
Net
assets,
at
value
.......................................................................
$6,303,626,766
Shares
outstanding
........................................................................
916,665,036
Net
asset
value
per
share
a
,b
..................................................................
$6.88
Maximum
offering
price
per
share
(net
asset
value
per
share
÷
96
.25
%
)
b
................................
$7.15
Class
C:
Net
assets,
at
value
.......................................................................
$246,505,532
Shares
outstanding
........................................................................
35,917,358
Net
asset
value
and
maximum
offering
price
per
share
a
,b
............................................
$6.86
Class
R6:
Net
assets,
at
value
.......................................................................
$404,786,931
Shares
outstanding
........................................................................
58,941,627
Net
asset
value
and
maximum
offering
price
per
share
b
.............................................
$6.87
Advisor
Class:
Net
assets,
at
value
.......................................................................
$3,338,222,615
Shares
outstanding
........................................................................
486,280,243
Net
asset
value
and
maximum
offering
price
per
share
b
.............................................
$6.87
a
Redemption
price
is
equal
to
net
asset
value
less
contingent
deferred
sales
charges,
if
applicable.
b
Net
asset
value
per
share
may
not
recalculate
due
to
rounding.
Franklin
California
Tax-Free
Income
Fund
Financial
Statements
Statement
of
Operations
for
the
year
ended
February
28,
2026
Annual
Report
The
accompanying
notes
are
an
integral
part
of
these
financial
statements.
Franklin
California
Tax-
Free
Income
Fund
Investment
income:
Interest:
Unaffiliated
issuers
........................................................................
$574,194,412
Expenses:
Management
fees
(Note
3
a
)
...................................................................
56,929,729
Distribution
fees:
(Note
3c
)
Class
A
................................................................................
7,013,242
Class
A1
...............................................................................
6,327,180
Class
C
................................................................................
1,776,959
Transfer
agent
fees:
(Note
3e
)
Class
A
................................................................................
1,609,758
Class
A1
...............................................................................
3,700,485
Class
C
................................................................................
156,422
Class
R6
...............................................................................
65,843
Advisor
Class
............................................................................
1,645,790
Custodian
fees
.............................................................................
69,772
Reports
to
shareholders
fees
..................................................................
165,550
Registration
and
filing
fees
....................................................................
63,973
Professional
fees
...........................................................................
491,788
Trustees'
fees
and
expenses
..................................................................
131,807
Other
....................................................................................
803,109
Total
expenses
.........................................................................
80,951,407
Net
investment
income
................................................................
493,243,005
Realized
and
unrealized
gains
(losses):
Net
realized
gain
(loss)
from:
Investments:
Unaffiliated
issuers
......................................................................
(29,442,730)
Net
change
in
unrealized
appreciation
(depreciation)
on:
Investments:
Unaffiliated
issuers
......................................................................
77,006,016
Unfunded
commitments
....................................................................
(2,211,045)
Net
change
in
unrealized
appreciation
(depreciation)
............................................
74,794,971
Net
realized
and
unrealized
gain
(loss)
............................................................
45,352,241
Net
increase
(decrease)
in
net
assets
resulting
from
operations
..........................................
$538,595,246
Franklin
California
Tax-Free
Income
Fund
Financial
Statements
Statements
of
Changes
in
Net
Assets
The
accompanying
notes
are
an
integral
part
of
these
financial
statements.
Annual
Report
Franklin
California
Tax-Free
Income
Fund
Year
Ended
February
28,
2026
Year
Ended
February
28,
2025
Increase
(decrease)
in
net
assets:
Operations:
Net
investment
income
.................................................
$493,243,005
$478,165,560
Net
realized
gain
(loss)
.................................................
(29,442,730)
(52,075,399)
Net
change
in
unrealized
appreciation
(depreciation)
...........................
74,794,971
(23,108,760)
Net
increase
(decrease)
in
net
assets
resulting
from
operations
................
538,595,246
402,981,401
Distributions
to
shareholders:
Class
A
.............................................................
(102,453,190)
(93,221,630)
Class
A1
............................................................
(245,864,429)
(262,375,944)
Class
C
.............................................................
(8,918,698)
(10,818,814)
Class
R6
............................................................
(14,952,300)
(12,919,299)
Advisor
Class
........................................................
(112,091,178)
(91,934,360)
Total
distributions
to
shareholders
..........................................
(484,279,795)
(471,270,047)
Capital
share
transactions:
(Note
2
)
Class
A
.............................................................
124,815,899
314,261,887
Class
A1
............................................................
(688,880,691)
(617,006,575)
Class
C
.............................................................
(76,341,954)
(69,301,820)
Class
R6
............................................................
22,337,504
65,742,344
Advisor
Class
........................................................
693,475,307
197,113,306
Total
capital
share
transactions
............................................
75,406,065
(109,190,858)
Net
increase
(decrease)
in
net
assets
...................................
129,721,516
(177,479,504)
Net
assets:
Beginning
of
year
.......................................................
13,154,370,486
13,331,849,990
End
of
year
...........................................................
$13,284,092,002
$13,154,370,486
Franklin
California
Tax-Free
Income
Fund
Notes
to
Financial
Statements
1.
Organization
and
Significant
Accounting
Policies
Franklin
California
Tax-Free
Income
Fund (Fund)
is
registered
under
the
Investment
Company
Act
of
1940
(1940
Act)
as
an
open-end
management
investment
company.
The Fund
follows
the
accounting
and
reporting
guidance
in
Financial
Accounting
Standards
Board
(FASB)
Accounting
Standards
Codification
Topic
946,
Financial
Services
–
Investment
Companies
(ASC
946)
and
applies
the
specialized
accounting
and
reporting
guidance
in
U.S.
Generally
Accepted
Accounting
Principles
(U.S.
GAAP),
including,
but
not
limited
to,
ASC
946.
The
Fund
offers
five classes
of
shares:
Class
A,
Class
A1,
Class
C,
Class
R6
and
Advisor
Class.
Class
C
shares
automatically
convert
to
Class
A
shares
on
a
monthly
basis,
after
they
have
been
held
for
8
years.
Each
class
of
shares
may
differ
by
its
initial
sales
load,
contingent
deferred
sales
charges,
voting
rights
on
matters
affecting
a
single
class,
its
exchange
privilege
and
fees
due
to
differing
arrangements
for
distribution
and
transfer
agent
fees.
The
following
summarizes
the Fund's
significant
accounting
policies.
a.
Financial
Instrument
Valuation
The
Fund's
investments
in
financial
instruments
are
carried
at
fair
value
daily.
Fair
value
is
the
price
that
would
be
received
to
sell
an
asset
or
paid
to
transfer
a
liability
in
an
orderly
transaction
between
market
participants
on
the
measurement
date.
The
Fund
calculates
the
net
asset
value
(NAV)
per
share
each business
day as
of
4
p.m.
Eastern
time
or
the
regularly
scheduled
close
of
the
New
York
Stock
Exchange
(NYSE),
whichever
is
earlier.
Under
compliance
policies
and
procedures
approved
by
the Fund's
Board
of
Trustees
(the
Board),
the
Board
has
designated
the
Fund’s
investment
manager
as
the
valuation
designee
and
has
responsibility
for
oversight
of
valuation.
The
investment
manager
is
assisted
by
the
Fund’s
administrator
in
performing
this
responsibility,
including
leading
the
cross-
functional
Valuation
Committee
(VC).
The
Fund
may
utilize
independent
pricing
services,
quotations
from
securities
and
financial
instrument
dealers,
and
other
market
sources
to
determine
fair
value.
Equity
securities
listed
on
an
exchange
or
on
the
NASDAQ
National
Market
System
are
valued
at
the
last
quoted
sale
price
or
the
official
closing
price of
the
day,
respectively.
Over-the-counter
(OTC)
securities
are
valued
within
the
range
of
the
most
recent
quoted
bid
and
ask
prices.
Securities
that
trade
in
multiple
markets
or
on
multiple
exchanges
are
valued
according
to
the
broadest
and
most
representative
market.
Certain
equity
securities
are
valued
based
upon
fundamental
characteristics
or
relationships
to
similar
securities.
Debt
securities
generally
trade
in
the OTC
market
rather
than
on
a
securities
exchange.
The
Fund's
pricing
services
use
multiple
valuation
techniques
to
determine
fair
value.
In
instances
where
sufficient
market
activity
exists,
the
pricing
services
may
utilize
a
market-based
approach
through
which
quotes
from
market
makers
are
used
to
determine
fair
value.
In
instances
where
sufficient
market
activity
may
not
exist
or
is
limited,
the
pricing
services
also
utilize
proprietary
valuation
models
which
may
consider
market
characteristics
such
as
benchmark
yield
curves,
credit
spreads,
estimated
default
rates,
anticipated
market
interest
rate
volatility,
coupon
rates,
anticipated
timing
of
principal
repayments,
underlying
collateral,
and
other
unique
security
features
in
order
to
estimate
the
relevant
cash
flows,
which
are
then
discounted
to
calculate
the
fair
value.
The
Fund
has
procedures
to
determine
the
fair
value
of
financial
instruments
for
which
market
prices
are
not
reliable
or
readily
available.
Under
these
procedures,
the Fund
primarily
employs
a
market-based
approach
which
may
use
related
or
comparable
assets
or
liabilities,
recent
transactions,
market
multiples,
and
other
relevant
information
for
the
investment
to
determine
the
fair
value
of
the
investment.
An
income-based
valuation
approach
may
also
be
used
in
which
the
anticipated
future
cash
flows
of
the
investment
are
discounted
to
calculate
fair
value.
Discounts
may
also
be
applied
due
to
the
nature
or
duration
of
any
restrictions
on
the
disposition
of
the
investments.
Due
to
the
inherent
uncertainty
of
valuations
of
such
investments,
the
fair
values
may
differ
significantly
from
the
values
that
would
have
been
used
had
an
active
market
existed.
b.
Securities
Purchased
on
a
When-Issued,
Forward
Commitment or
Delayed
Delivery
Basis
The
Fund
may
purchase
securities
on
a when-issued,
forward
commitment
or
delayed
delivery basis,
with
payment
and
delivery
scheduled
for
a
future
date.
These
transactions
are
subject
to
market
fluctuations
and
are
subject
to
the
risk
that
the
value
at
delivery
may
be
more
or
less
than
the
trade
date
purchase
price.
Although
the
Fund
will
generally
purchase
these
securities
with
the
intention
of
holding
the
securities, it
may
sell
the
securities
before
the
settlement
date.
Franklin
California
Tax-Free
Income
Fund
Notes
to
Financial
Statements
c.
Income
Taxes
It
is the Fund's
policy
to
qualify
as
a
regulated
investment
company
under
the
Internal
Revenue
Code. The Fund
intends
to
distribute
to
shareholders
substantially
all
of
its income
and
net
realized
gains
to
relieve
it
from
federal
income
and
excise
taxes.
As
a
result,
no
provision
for
U.S.
federal
income
taxes
is
required.
The Fund
may
recognize
an
income
tax
liability
related
to
its
uncertain
tax
positions
under
U.S.
GAAP
when
the
uncertain
tax
position
has
a
less
than
50%
probability
that
it
will
be
sustained
upon
examination
by
the
tax
authorities
based
on
its
technical
merits.
As
of
February
28,
2026, the Fund
has
determined
that
no
tax
liability
is
required
in
its
financial
statements
related
to
uncertain
tax
positions
for
any
open
tax
years
(or
expected
to
be
taken
in
future
tax
years).
The
Fund’s
federal
and
state
income
and
federal
excise
tax
returns
for
the
prior
three
fiscal
years
are
subject
to
examination
by
the
Internal
Revenue
Service
and
state
departments
of
revenue.
d.
Security
Transactions,
Investment
Income,
Expenses
and
Distributions
Security
transactions
are
accounted
for
on
trade
date.
Realized
gains
and
losses
on
security
transactions
are
determined
on
a
specific
identification
basis.
Interest
income
(including
interest
income
from
payment-in-kind
securities,
if
any)
and
estimated
expenses
are
accrued
daily.
Amortization
of
premium
and
accretion
of
discount
on
debt
securities
are
included
in
interest
income.
Paydown
gains
and
losses
are
recorded
as
an
adjustment
to
interest
income.
Dividends
from
net
investment
income
are
normally
declared
daily;
these
dividends
may
be
reinvested
or
paid
monthly
to
shareholders.
Distributions
from
realized
capital
gains
and
other
distributions,
if
any,
are
recorded
on
the
ex-dividend
date.
Distributable
earnings
are
determined
according
to
income
tax
regulations
(tax
basis)
and
may
differ
from
earnings
recorded
in
accordance
with
U.S.
GAAP.
These
differences
may
be
permanent
or
temporary.
Permanent
differences
are
reclassified
among
capital
accounts
to
reflect
their
tax
character.
These
reclassifications
have
no
impact
on
net
assets
or
the
results
of
operations.
Temporary
differences
are
not
reclassified,
as
they
may
reverse
in
subsequent
periods.
Realized
and
unrealized
gains
and
losses
and
net
investment
income,
excluding
class
specific
expenses,
are
allocated
daily
to
each
class
of
shares
based
upon
the
relative
proportion
of
net
assets
of
each
class.
Differences
in
per
share
distributions
by
class
are
generally
due
to
differences
in
class
specific
expenses.
e.
Insurance
The
scheduled
payments
of
interest
and
principal
for
each
insured
municipal
security
in
the
Fund are
insured
by
either
a
new
issue
insurance
policy
or
a
secondary
insurance
policy.
Some
municipal
securities
in
the
Fund
are
secured
by
collateral
guaranteed
by
an
agency
of
the
U.S.
government.
Depending
on
the
type
of
coverage,
premiums
for
insurance
are
either
added
to
the
cost
basis
of
the
security
or
paid
by
a
third
party.
Insurance
companies
typically
insure
municipal
bonds
that
tend
to
be
of
very
high
quality,
with
the
majority
of
underlying
municipal
bonds
rated
A
or
better.
However,
an
event
involving
an
insurer
could
have
an
adverse
effect
on
the
value
of
the
securities
insured
by
that
insurance
company.
There
can
be
no
assurance
the
insurer
will
be
able
to
fulfill
its
obligations
under
the
terms
of
the
policy.
f.
Accounting
Estimates
The
preparation
of
financial
statements
in
accordance
with
U.S.
GAAP
requires
management
to
make
estimates
and
assumptions
that
affect
the
reported
amounts
of
assets
and
liabilities
at
the
date
of
the
financial
statements
and
the
amounts
of
income
and
expenses
during
the
reporting
period.
Actual
results
could
differ
from
those
estimates.
g.
Guarantees
and
Indemnifications
Under
the Fund's
organizational
documents,
its
officers
and trustees
are
indemnified
by
the
Fund against
certain
liabilities
arising
out
of
the
performance
of
their
duties
to
the
Fund.
Additionally,
in
the
normal
course
of
business,
the
Fund
enters
into
contracts
with
service
providers
that
contain
general
indemnification
clauses.
The Fund's
maximum
exposure
under
these
arrangements
is
unknown
as
this
would
involve
future
claims
that
may
be
made
against
the Fund
that
have
not
yet
occurred.
Currently,
the Fund
expects
the
risk
of
loss
to
be
remote.
1.
Organization
and
Significant
Accounting
Policies
(continued)
Franklin
California
Tax-Free
Income
Fund
Notes
to
Financial
Statements
2.
Shares
of
Beneficial
Interest
At
February
28,
2026,
there
were
an
unlimited
number
of
shares
authorized
(without
par
value).
Transactions
in
the
Fund's
shares
were
as
follows:
3.
Transactions
with
Affiliates
Franklin
Resources,
Inc.
is
the
holding
company
for
various
subsidiaries
that
together
are
referred
to
as
Franklin
Templeton.
Certain
officers
and trustees
of
the Fund are
also
officers
and/or directors
of
the
following
subsidiaries:
Year
Ended
February
28,
2026
Year
Ended
February
28,
2025
Shares
Amount
Shares
Amount
Class
A
Shares:
Shares
sold
a
...................................
102,499,364
$686,305,638
108,497,677
$747,163,818
Shares
issued
in
reinvestment
of
distributions
..........
14,002,897
93,779,071
12,449,826
85,467,488
Shares
redeemed
...............................
(98,174,205)
(655,268,810)
(75,533,750)
(518,369,419)
Net
increase
(decrease)
..........................
18,328,056
$124,815,899
45,413,753
$314,261,887
Class
A1
Shares:
Shares
sold
...................................
17,526,265
$117,198,285
23,074,570
$158,482,920
Shares
issued
in
reinvestment
of
distributions
..........
30,882,774
206,392,844
32,250,476
221,048,096
Shares
redeemed
...............................
(151,738,959)
(1,012,471,820)
(145,228,231)
(996,537,591)
Net
increase
(decrease)
..........................
(103,329,920)
$(688,880,691)
(89,903,185)
$(617,006,575)
Class
C
Shares:
Shares
sold
...................................
5,423,776
$36,228,200
7,085,082
$48,630,066
Shares
issued
in
reinvestment
of
distributions
..........
1,288,616
8,585,736
1,532,350
10,484,905
Shares
redeemed
a
..............................
(18,216,426)
(121,155,890)
(18,747,924)
(128,416,791)
Net
increase
(decrease)
..........................
(11,504,034)
$(76,341,954)
(10,130,492)
$(69,301,820)
Class
R6
Shares:
Shares
sold
...................................
22,614,798
$149,932,912
20,259,202
$138,862,484
Shares
issued
in
reinvestment
of
distributions
..........
2,019,641
13,485,652
1,839,250
12,591,170
Shares
redeemed
...............................
(21,257,168)
(141,081,060)
(12,510,954)
(85,711,310)
Net
increase
(decrease)
..........................
3,377,271
$22,337,504
9,587,498
$65,742,344
Advisor
Class
Shares:
Shares
sold
...................................
243,614,894
$1,615,655,178
107,532,859
$736,503,112
Shares
issued
in
reinvestment
of
distributions
..........
15,298,763
102,198,925
12,190,275
83,435,995
Shares
redeemed
...............................
(154,297,741)
(1,024,378,796)
(91,001,550)
(622,825,801)
Net
increase
(decrease)
..........................
104,615,916
$693,475,307
28,721,584
$197,113,306
a
May
include
a
portion
of
Class
C
shares
that
were
automatically
converted
to
Class
A.
Subsidiary
Affiliation
Franklin
Advisers,
Inc.
(Advisers)
Investment
manager
Franklin
Templeton
Services,
LLC
(FT
Services)
Administrative
manager
Franklin
Distributors,
LLC
(Distributors)
Principal
underwriter
Franklin
Templeton
Investor
Services,
LLC
(Investor
Services)
Transfer
agent
Franklin
California
Tax-Free
Income
Fund
Notes
to
Financial
Statements
a.
Management
Fees
The
Fund
pays
an
investment
management
fee,
calculated
daily
and
paid
monthly,
to
Advisers
based
on
the
month-end
net
assets
of
the
Fund
as
follows:
For
the
year
ended
February
28,
2026,
the
gross
effective
investment
management
fee
rate
was 0.446%
of
the
Fund’s
average daily
net
assets.
b.
Administrative
Fees
Under
an
agreement
with
Advisers,
FT
Services
provides
administrative
services
to
the
Fund.
The
fee
is
paid
by Advisers
based
on
the Fund's
average
daily
net
assets,
and
is
not
an
additional
expense
of
the
Fund.
c.
Distribution
Fees
The
Board
has
adopted
distribution
plans
for
each
share
class,
with
the
exception
of
Class
R6
and
Advisor
Class
shares,
pursuant
to
Rule
12b-1
under
the
1940
Act.
Under
the
Fund's
Class
A
and
A1
reimbursement
distribution
plans,
the
Fund
reimburses
Distributors
for
costs
incurred
in
connection
with
the
servicing,
sale
and
distribution
of the
Fund's
shares
up
to
the
maximum
annual
plan
rate
for
each
class.
Under
the
Class
A
and
A1
reimbursement
distribution
plans,
costs
exceeding
the
maximum
for
the
current
plan
year
cannot
be
reimbursed
in
subsequent
periods.
In
addition,
under
the
Fund's
Class
C
compensation
distribution
plan,
the
Fund
pays
Distributors
for
costs
incurred
in
connection
with
the
servicing,
sale
and
distribution
of
the
Fund's
shares
up
to
the
maximum
annual
plan
rate.
The
plan
year,
for
purposes
of
monitoring
compliance
with
the
maximum
annual
plan
rates,
is
February
1
through
January
31.
The
maximum
annual
plan
rates,
based
on
the
average
daily
net
assets,
for
each
class,
are
as
follows:
d.
Sales
Charges/Underwriting
Agreements
Front-end
sales
charges
and
contingent
deferred
sales
charges
(CDSC)
do
not
represent
expenses
of
the
Fund.
These
charges
are
deducted
from
the
proceeds
of
sales
of
fund
shares
prior
to
investment
or
from
redemption
proceeds
prior
to
remittance,
as
applicable.
Distributors
has
advised
the
Fund
of
the
following
commission
transactions
related
to
the
sales
and
redemptions
of
the
Fund's
shares
for
the
year:
Annualized
Fee
Rate
Net
Assets
0.625%
Up
to
and
including
$100
million
0.500%
Over
$100
million,
up
to
and
including
$250
million
0.450%
Over
$250
million,
up
to
and
including
$7.5
billion
0.440%
Over
$7.5
billion,
up
to
and
including
$10
billion
0.430%
Over
$10
billion,
up
to
and
including
$12.5
billion
0.420%
Over
$12.5
billion,
up
to
and
including
$15
billion
0.400%
Over
$15
billion,
up
to
and
including
$17.5
billion
0.380%
Over
$17.5
billion,
up
to
and
including
$20
billion
0.360%
In
excess
of
$20
billion
Class
A
....................................................................................
0.25%
Class
A1
...................................................................................
0.10%
Class
C
....................................................................................
0.65%
3.
Transactions
with
Affiliates
(continued)
Franklin
California
Tax-Free
Income
Fund
Notes
to
Financial
Statements
e.
Transfer
Agent
Fees
Each
class
of
shares
pays
transfer
agent
fees,
calculated
monthly
and
paid
monthly, to
Investor
Services
for
its
performance
of
shareholder
servicing
obligations. The
fees
are based
on
a
fixed
margin
earned
by
Investor
Services
and
are allocated
to
the Fund
based
upon
relative
assets
and
relative
transactions. In
addition,
each
class reimburses
Investor
Services
for
out
of
pocket
expenses
incurred
and,
except
for
Class
R6, reimburses
shareholder
servicing
fees
paid
to
third
parties.
These
fees
paid
to
third
parties
are
accrued
and
allocated
daily
based
upon
their
relative
proportion
of
such
classes'
aggregate
net
assets.
Class
R6
pays
Investor
Services
transfer
agent
fees
allocated
specifically
to
that
class
based
upon
its
relative
assets
and
relative
transactions.
For
the
year
ended
February
28,
2026,
the Fund
paid
transfer
agent
fees
as
noted
in
the
Statement of
Operations,
of
which
$2,182,688
was
retained
by
Investor
Services.
f.
Waiver
and
Expense
Reimbursements
Advisers
has contractually
agreed
in
advance
to
waive
or
limit
its fees
and
to
assume
as
its
own
expense
certain
expenses
otherwise
payable
by
the
Fund
so
that
the
operating expenses
(excluding
interest
expense,
distribution
fees,
acquired
fund
fees
and
expenses
and
certain
non-routine
expenses
or
costs,
including
those
relating
to
litigation,
indemnification,
reorganizations,
and
liquidations)
for
each
class
of
the
Fund
do
not
exceed 0.65%
based
on
the
average
net
assets
of
each
class
until
June
30,
2026.
Total
expenses
waived
or
paid
are
not
subject
to
recapture
subsequent
to
the
Fund's
fiscal
year
end.
Transfer
agent
fees
on
Class
R6
shares
of
the
Fund have
been
capped
so
that
transfer
agent
fees
for
that
class
do
not
exceed
0.03%
based
on
the
average
net
assets
of
the
class
until
June
30,
2026.
g.
Interfund
Transactions
The
Fund
engaged
in
purchases
and
sales
of
investments
with
funds
or
other
accounts
that
have
common
investment
managers
(or
affiliated
investment
managers),
directors,
trustees
or
officers.
During
the
year
ended
February
28,
2026,
these
purchase
and
sale
transactions
aggregated
$337,365,000
and
$240,370,000,
respectively.
4.
Income
Taxes
For
tax
purposes,
capital
losses
may
be
carried
over
to
offset
future
capital
gains.
At
February
28,
2026,
the
capital
loss
carryforwards
were
as
follows:
Sales
charges
retained
net
of
commissions
paid
to
unaffiliated
brokers/dealers
..............................
$42,036
CDSC
retained
..............................................................................
$397,731
Capital
loss
carryforwards
not
subject
to
expiration:
Short
term
................................................................................
$
615,283,448
Long
term
................................................................................
498,642,615
Total
capital
loss
carryforwards
...............................................................
$1,113,926,063
3.
Transactions
with
Affiliates
(continued)
d.
Sales
Charges/Underwriting
Agreements
(continued)
Franklin
California
Tax-Free
Income
Fund
Notes
to
Financial
Statements
The
tax
character
of
distributions
paid
during
the
years
ended
February
28,
2026
and
2025,
was
as
follows:
At
February
28,
2026,
the
cost
of
investments,
net
unrealized
appreciation
(depreciation)
and
undistributed
tax
exempt
income for
income
tax
purposes
were
as
follows:
Differences
between
income
and/or
capital
gains
as
determined
on
a
book
basis
and
a
tax
basis
are
primarily
due
to
differing
treatments
of
wash
sales
and
bond
discounts
and
premiums.
5.
Investment
Transactions
Purchases
and
sales
of
investments (excluding
short
term
securities) for
the
year
ended
February
28,
2026,
aggregated
$1,508,717,762 and
$1,530,688,025,
respectively.
6.
Defaulted
Securities
The
Fund held
defaulted
securities
and/or
other
securities
for
which
the
income
has
been
deemed
uncollectible.
At
February
28,
2026,
the
aggregate
value
of
these
securities was
$11,995,598, representing 0.1%
of
the
Fund's
net
assets.
The
Fund
discontinues
accruing
income
on
securities
for
which
income
has
been
deemed
uncollectible
and
provides
an
estimate
for
losses
on
interest
receivable.
The
securities
have
been
identified
in
the
accompanying Schedule
of
Investments.
7.
Concentration
of
Risk
The
Fund
invests
a
large
percentage
of
its total
assets
in
obligations
of
issuers
within California
and
U.S.
territories.
Such
concentration
may
subject
the
Fund
to
risks
associated
with
industrial
or
regional
matters,
and
economic,
political
or
legal
developments
occurring
within California
and
U.S.
territories. Investments
in
these
securities
are
sensitive
to
interest
rate
changes
and
credit
risk
of
the
issuer
and
may
subject
the
Fund
to
increased
market
volatility.
The
market
for
these
investments
may
be
limited,
which
may
make
them
difficult
to
buy
or
sell.
2026
2025
Distributions
paid
from:
Ordinary
income
..........................................................
$2,803,455
$3,343,875
Tax
exempt
income
........................................................
481,476,340
467,926,172
$484,279,795
$471,270,047
Cost
of
investments
..........................................................................
$12,493,636,770
Unrealized
appreciation
........................................................................
$980,446,248
Unrealized
depreciation
........................................................................
(302,971,645)
Net
unrealized
appreciation
(depreciation)
..........................................................
$677,474,603
Distributable
earnings:
Undistributed
tax
exempt
income
.................................................................
$26,846,004
4.
Income
Taxes
(continued)
Franklin
California
Tax-Free
Income
Fund
Notes
to
Financial
Statements
8.
Credit
Facility
The
Fund,
together
with
other
U.S.
registered
and
foreign
investment
funds
(collectively,
Borrowers),
managed
by
Franklin
Templeton,
are
borrowers
in
a
joint
syndicated
senior
unsecured
credit
facility
totaling
$2.995
billion
(Global
Credit
Facility)
which
matures
on
January
29,
2027.
This
Global
Credit
Facility
provides
a
source
of
funds
to
the
Borrowers
for
temporary
and
emergency
purposes,
including
the
ability
to
meet
future
unanticipated
or
unusually
large
redemption
requests.
Under
the
terms
of
the
Global
Credit
Facility,
the
Fund
may,
in
addition
to
interest
charged
on
any
borrowings
made
by
the
Fund
and
other
costs
incurred
by
the
Fund,
pay
its
share
of
fees
and
expenses
incurred
in
connection
with
the
implementation
and
maintenance
of
the
Global
Credit
Facility,
based
upon
its
relative
share
of
the
aggregate
net
assets
of
all
of
the
Borrowers,
including
an
annual
commitment
fee
of
0.15%
based
upon
the
unused
portion
of
the
Global
Credit
Facility.
These
fees
are
reflected
in
other
expenses
in
the
Statement
of
Operations.
During
the
year
ended
February
28,
2026,
the Fund
did
not
use
the
Global
Credit
Facility.
9.
Fair
Value
Measurements
The
Fund
follows
a
fair
value
hierarchy
that
distinguishes
between
market
data
obtained
from
independent
sources
(observable
inputs)
and
the Fund's
own
market
assumptions
(unobservable
inputs).
These
inputs
are
used
in
determining
the
value
of
the
Fund's financial
instruments
and
are
summarized
in
the
following
fair
value
hierarchy:
Level
1
–
quoted
prices
in
active
markets
for
identical
financial
instruments
Level
2
–
other
significant
observable
inputs
(including
quoted
prices
for
similar
financial
instruments,
interest
rates,
prepayment
speed,
credit
risk,
etc.)
Level
3
–
significant
unobservable
inputs
(including
the
Fund's
own
assumptions
in
determining
the
fair
value
of
financial
instruments)
The
input
levels
are
not
necessarily
an
indication
of
the
risk
or
liquidity
associated
with
financial
instruments
at
that
level.
A
summary
of
inputs
used
as
of February
28,
2026,
in
valuing
the
Fund's
assets
carried
at
fair
value,
is
as
follows:
A
reconciliation
in
which
Level
3
inputs
are
used
in
determining
fair
value
is
presented
when
there
are
significant
Level
3
assets
and/or
liabilities
at
the
beginning
and/or
end
of
the year.
Level
1
Level
2
Level
3
Total
Franklin
California
Tax-Free
Income
Fund
Assets:
Investments
in
Securities:
a
Common
Stocks
.........................
$
—
$
—
$
—
b
$
—
Municipal
Bonds
.........................
—
13,013,817,088
—
13,013,817,088
Short
Term
Investments
...................
—
157,294,285
—
157,294,285
Total
Investments
in
Securities
...........
$—
$13,171,111,373
$—
$13,171,111,373
a
For
detailed
categories,
see
the
accompanying
Schedule
of
Investments.
b
Includes
financial
instruments
determined
to
have
no
value.
Franklin
California
Tax-Free
Income
Fund
Notes
to
Financial
Statements
10.
Operating
Segments
The Fund operates
as
a
single
operating
segment,
which
is
an
investment
portfolio.
The
portfolio
managers
assigned
to
the
Fund
within
the
Fund’s
investment
manager serve
as
the
Chief
Operating
Decision
Maker
(“CODM”)
and
are
responsible
for
evaluating
the
Fund's
operating
results
and
allocating
resources
in
accordance
with
the
Fund’s
investment
strategy.
Internal
reporting
provided
to
the
CODM
aligns
with
the
accounting
policies
and
measurement
principles
used
in
the financial
statements.
For
information
regarding
segment
assets,
segment
profit
or
loss,
and
significant
expenses,
refer
to
the Statement
of
Assets
and
Liabilities
and
the Statement
of
Operations,
along
with
the
related
notes
to
the financial
statements.
The Schedule
of
Investments
provides
details
of
the Fund's investments
that
generate
returns
such
as
interest,
dividends,
and
realized
and
unrealized
gains
or
losses.
Performance
metrics,
including
portfolio
turnover
and
expense
ratios,
are
disclosed
in
the Financial
Highlights.
11.
Subsequent
Events
The
Fund
has
evaluated
subsequent
events
through
the
issuance
of
the
financial
statements
and
determined
that
no
events
have
occurred
that
require
disclosure.
Abbreviations
Selected
Portfolio
1915
Act
Improvement
Bond
Act
of
1915
AG
Assured
Guaranty,
Inc.
AMBAC
American
Municipal
Bond
Assurance
Corp.
BAM
Build
America
Mutual
Assurance
Co.
COP
Certificate
of
Participation
ETM
Escrowed
to
Maturity
FGIC
Financial
Guaranty
Insurance
Co.
FHLMC
Federal
Home
Loan
Mortgage
Corp.
GO
General
Obligation
NATL
National
Reinsurance
Corp.
SPA
Standby
Purchase
Agreement
Franklin
California
Tax-Free
Income
Fund
Report
of
Independent
Registered
Public
Accounting
Firm
To
the
Board
of
Trustees
and
Shareholders
of
Franklin
California
Tax-Free
Income
Fund
Opinion
on
the
Financial
Statements
We
have
audited
the
accompanying
statement
of
assets
and
liabilities,
including
the
schedule
of
investments,
of
Franklin
California
Tax-Free
Income
Fund
(the
"Fund")
as
of
February
28,
2026,
the
related
statement
of
operations
for
the
year
ended
February
28,
2026,
the
statements
of
changes
in
net
assets
for
each
of
the
two
years
in
the
period
ended
February
28,
2026,
including
the
related
notes,
and
the
financial
highlights
for
each
of
the
four
years
in
the
period
ended
February
28,
2026,
the
period
April
1,
2021
to
February
28,
2022
and
the
year
ended
March
31,
2021
(collectively
referred
to
as
the
“financial
statements”).
In
our
opinion,
the
financial
statements
present
fairly,
in
all
material
respects,
the
financial
position
of
the
Fund
as
of
February
28,
2026,
the
results
of
its
operations
for
the
year
then
ended,
the
changes
in
its
net
assets
for
each
of
the
two
years
in
the
period
ended
February
28,
2026
and
the
financial
highlights
for
each
of
the
four
years
in
the
period
ended
February
28,
2026,
the
period
April
1,
2021
to
February
28,
2022
and
the
year
ended
March
31,
2021
in
conformity
with
accounting
principles
generally
accepted
in
the
United
States
of
America.
Basis
for
Opinion
These
financial
statements
are
the
responsibility
of
the
Fund’s
management.
Our
responsibility
is
to
express
an
opinion
on
the
Fund’s
financial
statements
based
on
our
audits.
We
are
a
public
accounting
firm
registered
with
the
Public
Company
Accounting
Oversight
Board
(United
States)
(PCAOB)
and
are
required
to
be
independent
with
respect
to
the
Fund
in
accordance
with
the
U.S.
federal
securities
laws
and
the
applicable
rules
and
regulations
of
the
Securities
and
Exchange
Commission
and
the
PCAOB.
We
conducted
our
audits
of
these
financial
statements
in
accordance
with
the
standards
of
the
PCAOB.
Those
standards
require
that
we
plan
and
perform
the
audit
to
obtain
reasonable
assurance
about
whether
the
financial
statements
are
free
of
material
misstatement,
whether
due
to
error
or
fraud.
Our
audits
included
performing
procedures
to
assess
the
risks
of
material
misstatement
of
the
financial
statements,
whether
due
to
error
or
fraud,
and
performing
procedures
that
respond
to
those
risks.
Such
procedures
included
examining,
on
a
test
basis,
evidence
regarding
the
amounts
and
disclosures
in
the
financial
statements.
Our
audits
also
included
evaluating
the
accounting
principles
used
and
significant
estimates
made
by
management,
as
well
as
evaluating
the
overall
presentation
of
the
financial
statements.
Our
procedures
included
confirmation
of
securities
owned
as
of
February
28,
2026
by
correspondence
with
the
custodian
and
private
placement
agent;
when
replies
were
not
received
from
a
private
placement
agent,
we
performed
other
auditing
procedures.
We
believe
that
our
audits
provide
a
reasonable
basis
for
our
opinion.
/s/PricewaterhouseCoopers
LLP
San
Francisco,
California
April
17,
2026
We
have
served
as
the
auditor
of
one
or
more
investment
companies
in
the
Franklin
Templeton
Group
of
Funds
since
1948.
Franklin
California
Tax-Free
Income
Fund
Tax
Information
(unaudited)
By
mid-February,
tax
information
related
to
a
shareholder's
proportionate
share
of
distributions
paid
during
the
preceding
calendar
year
will
be
received,
if
applicable.
Please
also
refer
to
www.franklintempleton.com
for
per
share
tax
information
related
to
any
distributions
paid
during
the
preceding
calendar
year.
Shareholders
are
advised
to
consult
with
their
tax
advisors
for
further
information
on
the
treatment
of
these
amounts
on
their
tax
returns.
The
following
tax
information
for
the
Fund
is
required
to
be
furnished
to
shareholders
with
respect
to
income
earned
and
distributions
paid
during
its
fiscal
year.
The
Fund
hereby
reports
the
following
amounts,
or
if
subsequently
determined
to
be
different,
the
maximum
allowable
amounts,
for
the
fiscal
year
ended
February
28,
2026:
Pursuant
to:
Amount
Reported
Exempt-Interest
Dividends
Distributed
§852(b)(5)(A)
$481,476,340
Section
163(j)
Interest
Earned
§163(j)
$2,803,455
Franklin
California
Tax-Free
Income
Fund
Changes
In
and
Disagreements
with
Accountants
For
the
period
covered
by
this
report
Not
applicable.
Results
of
Meeting(s)
of
Shareholders
For
the
period
covered
by
this
report
Not
applicable.
Remuneration
Paid
to
Directors,
Officers
and
Others
For
the
period
covered
by
this
report
Refer
to
the
financial
statements
included
herein.
Remuneration
to
officers
is
paid
by
the
Fund’s
investment
manager
according
to
the
terms
of
the
agreement.
Board
Approval
of
Management
and
Subadvisory
Agreements
For
the
period
covered
by
this
report
Not
applicable.
©
2026
Franklin
Templeton.
All
rights
reserved.
|
ITEM 8. |
CHANGES IN AND DISAGREEMENTS WITH ACCOUNTANTS FOR OPEN-END MANAGEMENT INVESTMENT COMPANIES. |
The information is disclosed as part of the Financial Statements
included in Item 7 of this Form N-CSR.
|
ITEM 9. |
PROXY DISCLOSURES FOR OPEN-END MANAGEMENT INVESTMENT COMPANIES. |
The information is disclosed as part of the Financial Statements
included in Item 7 of this Form N-CSR.
|
ITEM 10. |
REMUNERATION PAID TO DIRECTORS, OFFICERS, AND OTHERS OF OPEN-END MANAGEMENT INVESTMENT
COMPANIES. |
The information is disclosed as part of the Financial Statements
included in Item 7 of this Form N-CSR.
|
ITEM 11. |
STATEMENT REGARDING BASIS FOR APPROVAL OF INVESTMENT ADVISORY CONTRACT. |
The information is disclosed as part of the Financial Statements
included in Item 7 of this Form N-CSR, as applicable.
|
ITEM 12. |
DISCLOSURE OF PROXY VOTING POLICIES AND PROCEDURES FOR CLOSED-END MANAGEMENT INVESTMENT
COMPANIES. |
Not applicable.
|
ITEM 13. |
PORTFOLIO MANAGERS OF CLOSED-END MANAGEMENT INVESTMENT COMPANIES. |
Not applicable.
|
ITEM 14. |
PURCHASES OF EQUITY SECURITIES BY CLOSED-END MANAGEMENT INVESTMENT COMPANY AND AFFILIATED
PURCHASERS. |
Not applicable.
|
ITEM 15. |
SUBMISSION OF MATTERS TO A VOTE OF SECURITY HOLDERS. |
There have been no changes to the procedures by which shareholders
may recommend nominees to the Registrant’s Board of Trustees that would require disclosure herein.
|
ITEM 16. |
CONTROLS AND PROCEDURES. |
|
(a) |
The Registrant’s chief executive officer and chief financial officer have
concluded that the Registrant’s disclosure controls and procedures (as defined in Rule 30a- 3(c) under the Investment Company Act
of 1940, as amended (the “1940 Act”)) are effective as of a date within 90 days of the filing date of this report that includes
the disclosure required by this paragraph, based on their evaluation of the disclosure controls and procedures required by Rule 30a-3(b)
under the 1940 Act and 15d-15(b) under the Securities Exchange Act of 1934. |
|
(b) |
There were no changes in the Registrant’s internal control over financial reporting
(as defined in Rule 30a-3(d) under the 1940 Act) that occurred during the period covered by this report that have materially affected
or are likely to materially affect the Registrant’s internal control over financial reporting. |
|
ITEM 17. |
DISCLOSURE OF SECURITIES LENDING ACTIVITIES FOR CLOSED-END MANAGEMENT INVESTMENT COMPANIES. |
Not applicable.
|
ITEM 18. |
RECOVERY OF ERRONEOUSLY AWARDED COMPENSATION. |
(a) (1) Code of
Ethics attached hereto.
Exhibit 99.CODE ETH
(a) (3) Certifications pursuant
to section 302 of the Sarbanes-Oxley Act of 2002 attached hereto.
Exhibit 99.CERT
(b) Certifications pursuant
to Section 906 of the Sarbanes-Oxley Act of 2002 attached hereto.
Exhibit 99.906CERT
SIGNATURES
Pursuant to the requirements of the Securities Exchange
Act of 1934 and the Investment Company Act of 1940, the registrant has duly caused this Report to be signed on its behalf by the undersigned,
thereunto duly authorized.
Franklin California Tax-Free Income Fund
| By: |
/s/ Christopher Kings |
|
| |
Christopher Kings |
|
| |
Chief Executive Officer - Finance and Administration |
|
Pursuant to the requirements of the Securities Exchange Act of 1934 and
the Investment Company Act of 1940, this report has been signed below by the following persons on behalf of the registrant and in the
capacities and on the dates indicated.
| By: |
/s/ Christopher Kings |
|
| |
Christopher Kings |
|
| |
Chief Executive Officer - Finance and Administration |
|
| Date: |
April 30, 2026 |
|
| |
|
|
| By: |
/s/ Jeffrey
White |
|
| |
Jeffrey White |
|
| |
Chief Financial Officer, Chief Accounting Officer and Treasurer |
|