Exhibit 99.2
| Q1 2026 Investor Presentation Ashford Lane | Atlanta, GA |

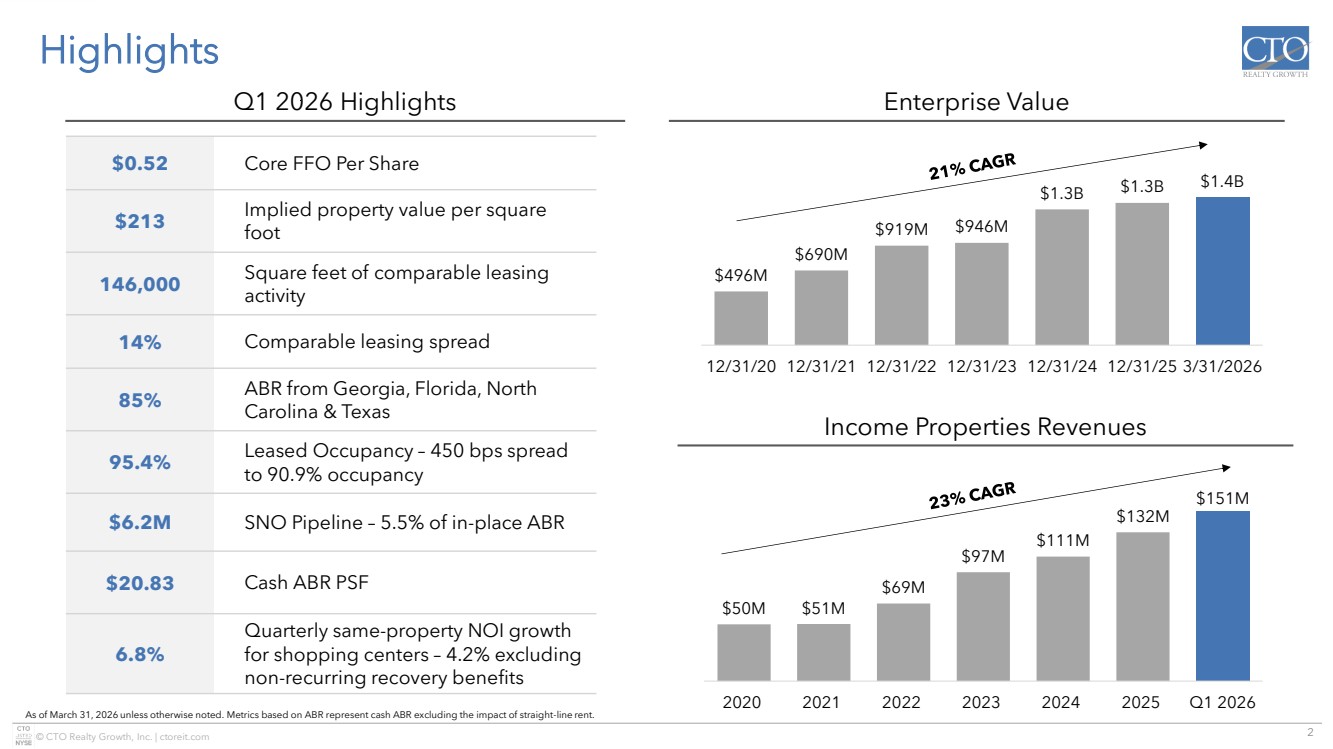
| 2 © CTO Realty Growth, Inc. | ctoreit.com $496M $690M $919M $946M $1.3B $1.3B $1.4B 12/31/20 12/31/21 12/31/22 12/31/23 12/31/24 12/31/25 3/31/2026 Highlights Income Properties Revenues Enterprise Value As of March 31, 2026 unless otherwise noted. Metrics based on ABR represent cash ABR excluding the impact of straight-line rent. $0.52 Core FFO Per Share $213 Implied property value per square foot 146,000 Square feet of comparable leasing activity 14% Comparable leasing spread 85% ABR from Georgia, Florida, North Carolina & Texas 95.4% Leased Occupancy – 450 bps spread to 90.9% occupancy $6.2M SNO Pipeline – 5.5% of in-place ABR $20.83 Cash ABR PSF 6.8% Quarterly same-property NOI growth for shopping centers – 4.2% excluding non-recurring recovery benefits Q1 2026 Highlights $50M $51M $69M $97M $111M $132M $151M 2020 2021 2022 2023 2024 2025 Q1 2026 |
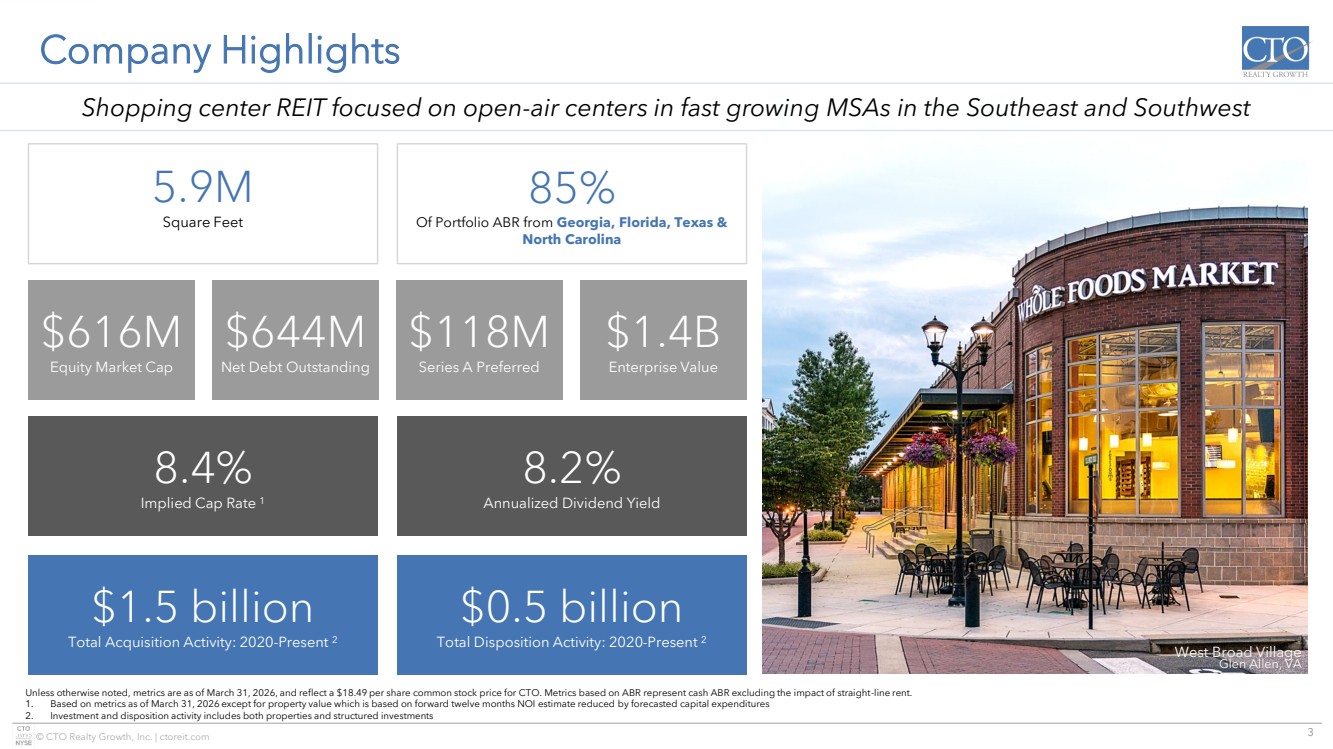
| 3 © CTO Realty Growth, Inc. | ctoreit.com Company Highlights Unless otherwise noted, metrics are as of March 31, 2026, and reflect a $18.49 per share common stock price for CTO. Metrics based on ABR represent cash ABR excluding the impact of straight-line rent. 1. Based on metrics as of March 31, 2026 except for property value which is based on forward twelve months NOI estimate reduced by forecasted capital expenditures 2. Investment and disposition activity includes both properties and structured investments West Broad Village Glen Allen, VA 5.9M Square Feet 85% Of Portfolio ABR from Georgia, Florida, Texas & North Carolina 8.2% Annualized Dividend Yield 8.4% Implied Cap Rate 1 $0.5 billion Total Disposition Activity: 2020-Present 2 $1.5 billion Total Acquisition Activity: 2020-Present 2 $644M Net Debt Outstanding $118M Series A Preferred $1.4B Enterprise Value $616M Equity Market Cap Shopping center REIT focused on open-air centers in fast growing MSAs in the Southeast and Southwest |
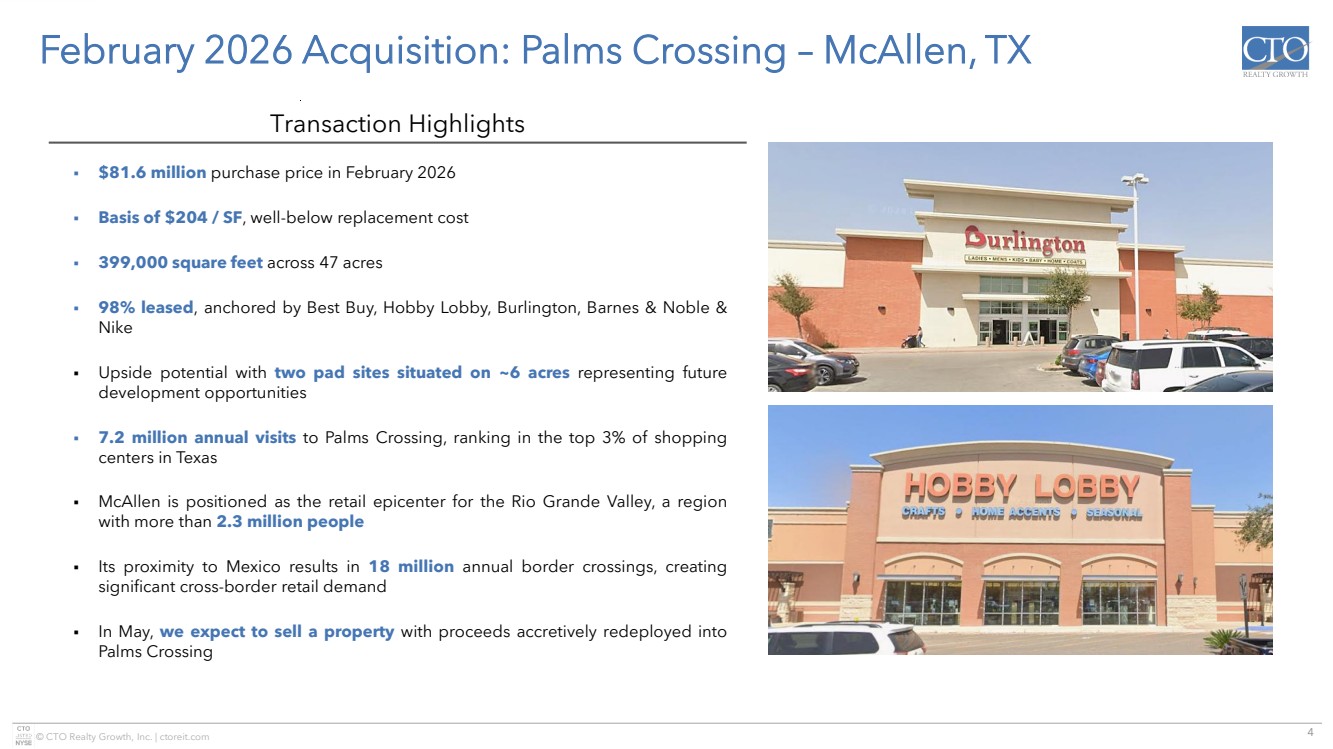
| 4 © CTO Realty Growth, Inc. | ctoreit.com Transaction Highlights February 2026 Acquisition: Palms Crossing – McAllen, TX ▪ $81.6 million purchase price in February 2026 ▪ Basis of $204 / SF, well-below replacement cost ▪ 399,000 square feet across 47 acres ▪ 98% leased, anchored by Best Buy, Hobby Lobby, Burlington, Barnes & Noble & Nike ▪ Upside potential with two pad sites situated on ~6 acres representing future development opportunities ▪ 7.2 million annual visits to Palms Crossing, ranking in the top 3% of shopping centers in Texas ▪ McAllen is positioned as the retail epicenter for the Rio Grande Valley, a region with more than 2.3 million people ▪ Its proximity to Mexico results in 18 million annual border crossings, creating significant cross-border retail demand ▪ In May, we expect to sell a property with proceeds accretively redeployed into Palms Crossing |
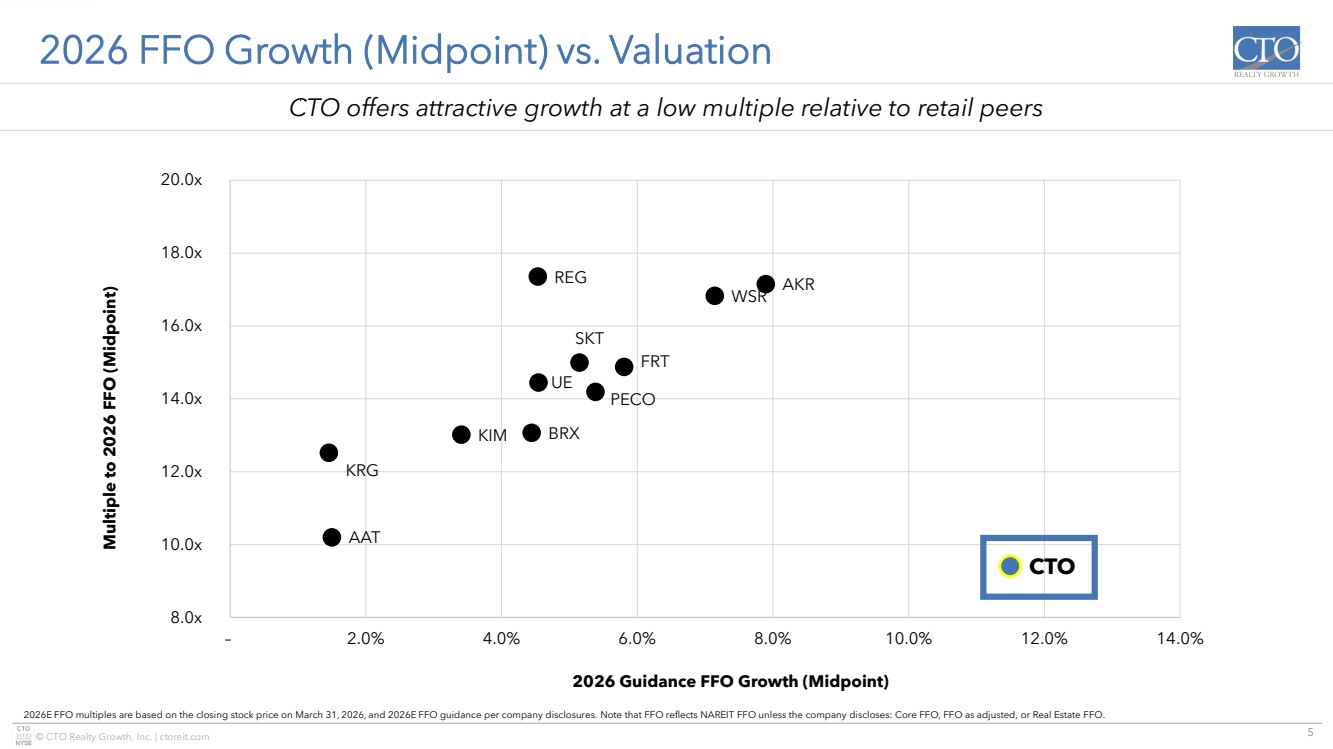
| 5 © CTO Realty Growth, Inc. | ctoreit.com KRG KIM BRX UE PECO FRT REG CTO AAT WSR AKR SKT 8.0x 10.0x 12.0x 14.0x 16.0x 18.0x 20.0x – 2.0% 4.0% 6.0% 8.0% 10.0% 12.0% 14.0% Multiple to 2026 FFO (Midpoint) 2026 Guidance FFO Growth (Midpoint) 2026 FFO Growth (Midpoint) vs. Valuation 2026E FFO multiples are based on the closing stock price on March 31, 2026, and 2026E FFO guidance per company disclosures. Note that FFO reflects NAREIT FFO unless the company discloses: Core FFO, FFO as adjusted, or Real Estate FFO. CTO offers attractive growth at a low multiple relative to retail peers Ashford Lane Atlanta, GA |
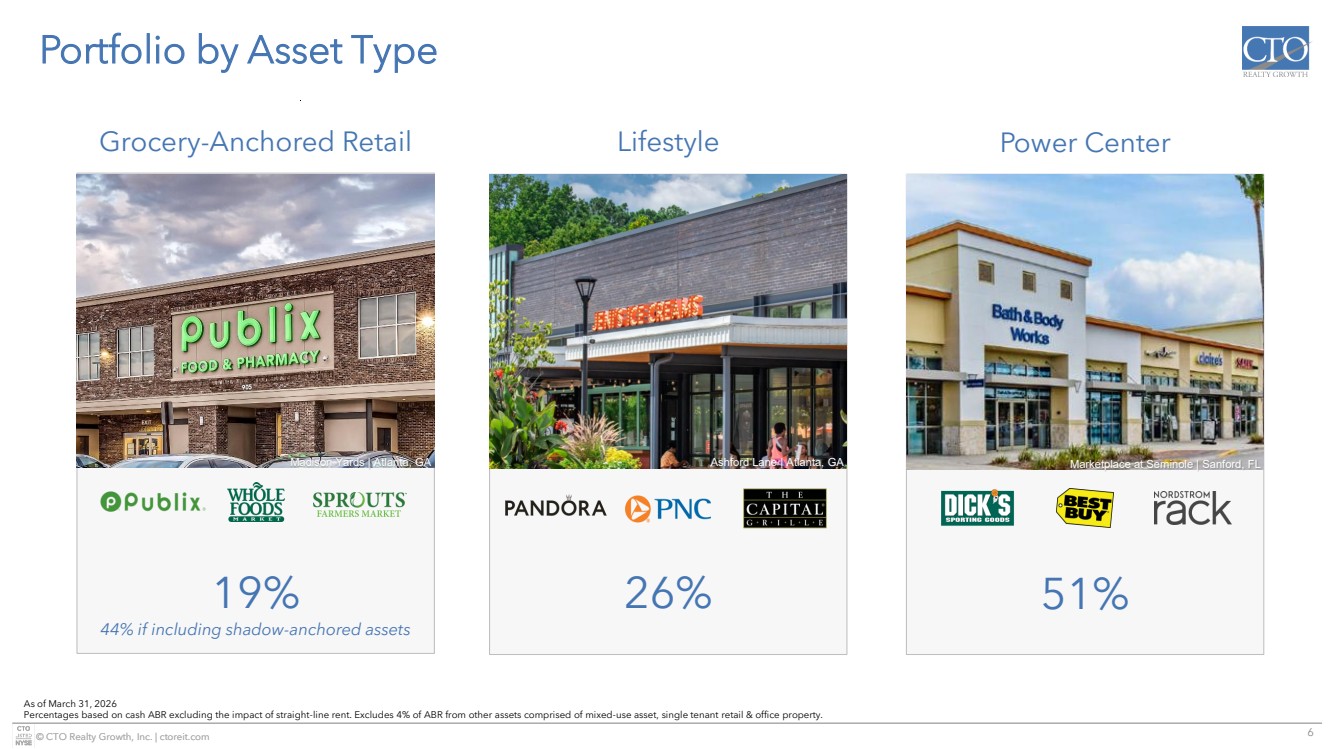
| 6 © CTO Realty Growth, Inc. | ctoreit.com Portfolio by Asset Type 19% 44% if including shadow-anchored assets 26% 51% As of March 31, 2026 Percentages based on cash ABR excluding the impact of straight-line rent. Excludes 4% of ABR from other assets comprised of mixed-use asset, single tenant retail & office property. Madison Yards | Atlanta, GA Ashford Lane | Atlanta, GA Marketplace at Seminole | Sanford, FL Grocery-Anchored Retail Lifestyle Power Center |
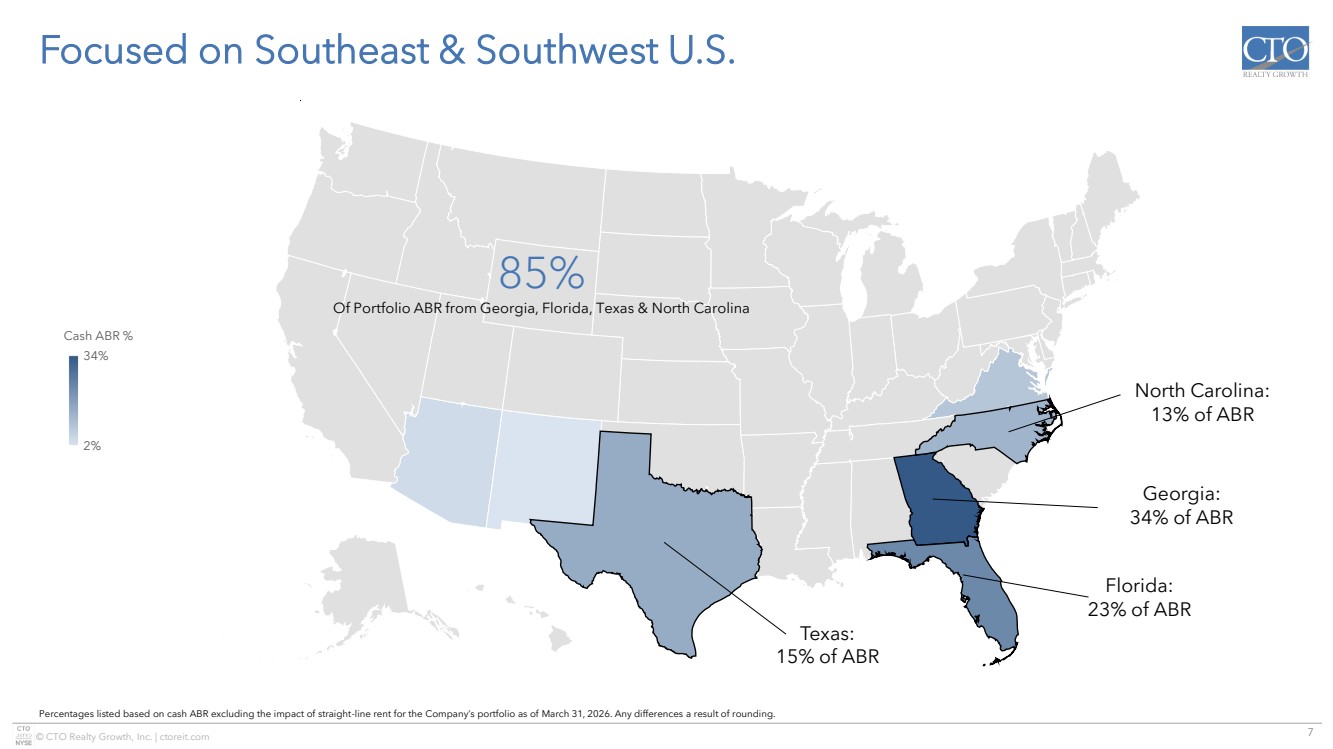
| 7 © CTO Realty Growth, Inc. | ctoreit.com © GeoNames, Microsoft, TomTom Powered by Bing 2% 34% Cash ABR % Focused on Southeast & Southwest U.S. Percentages listed based on cash ABR excluding the impact of straight-line rent for the Company’s portfolio as of March 31, 2026. Any differences a result of rounding. Texas: 15% of ABR Florida: 23% of ABR Georgia: 34% of ABR North Carolina: 13% of ABR 85% Of Portfolio ABR from Georgia, Florida, Texas & North Carolina |
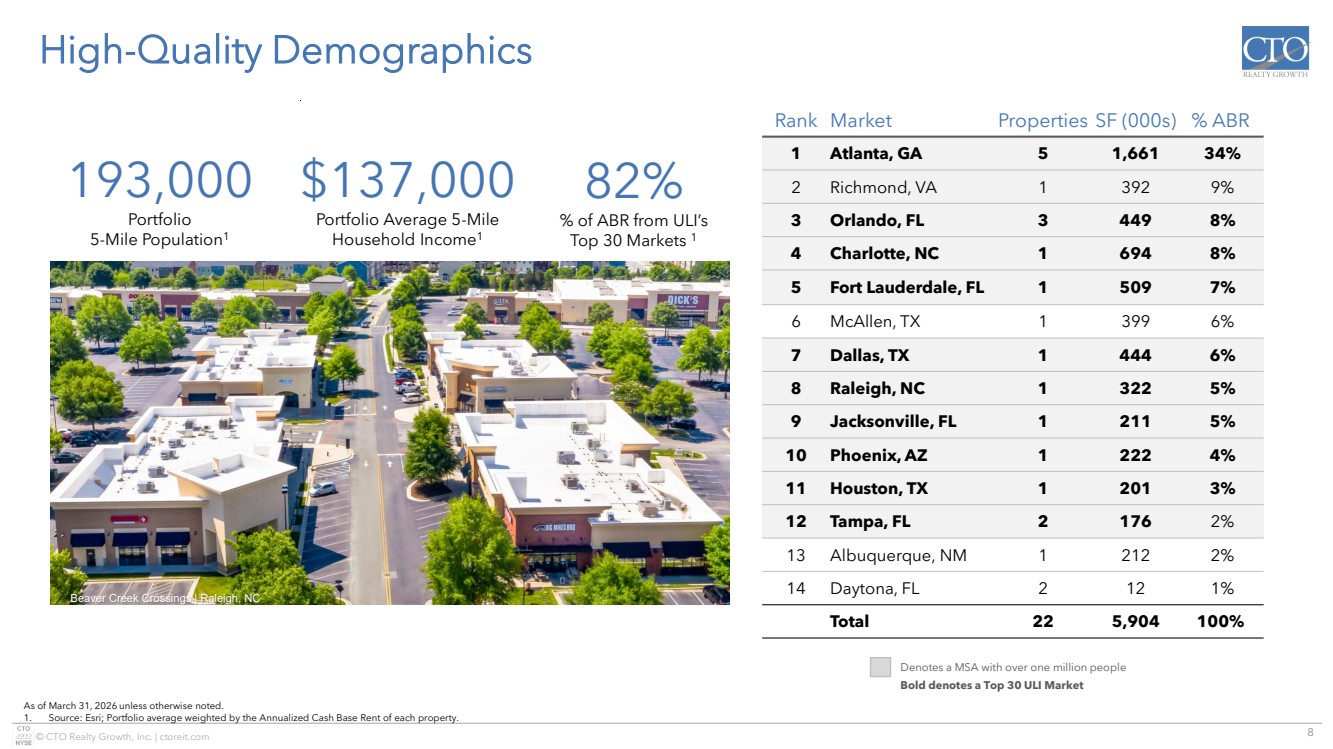
| 8 © CTO Realty Growth, Inc. | ctoreit.com High-Quality Demographics As of March 31, 2026 unless otherwise noted. 1. Source: Esri; Portfolio average weighted by the Annualized Cash Base Rent of each property. Rank Market Properties SF (000s) % ABR 1 Atlanta, GA 5 1,661 34% 2 Richmond, VA 1 392 9% 3 Orlando, FL 3 449 8% 4 Charlotte, NC 1 694 8% 5 Fort Lauderdale, FL 1 509 7% 6 McAllen, TX 1 399 6% 7 Dallas, TX 1 444 6% 8 Raleigh, NC 1 322 5% 9 Jacksonville, FL 1 211 5% 10 Phoenix, AZ 1 222 4% 11 Houston, TX 1 201 3% 12 Tampa, FL 2 176 2% 13 Albuquerque, NM 1 212 2% 14 Daytona, FL 2 12 1% Total 22 5,904 100% Denotes a MSA with over one million people Bold denotes a Top 30 ULI Market 82% % of ABR from ULI’s Top 30 Markets 1 193,000 Portfolio 5-Mile Population1 $137,000 Portfolio Average 5-Mile Household Income1 Beaver Creek Crossings | Raleigh, NC |
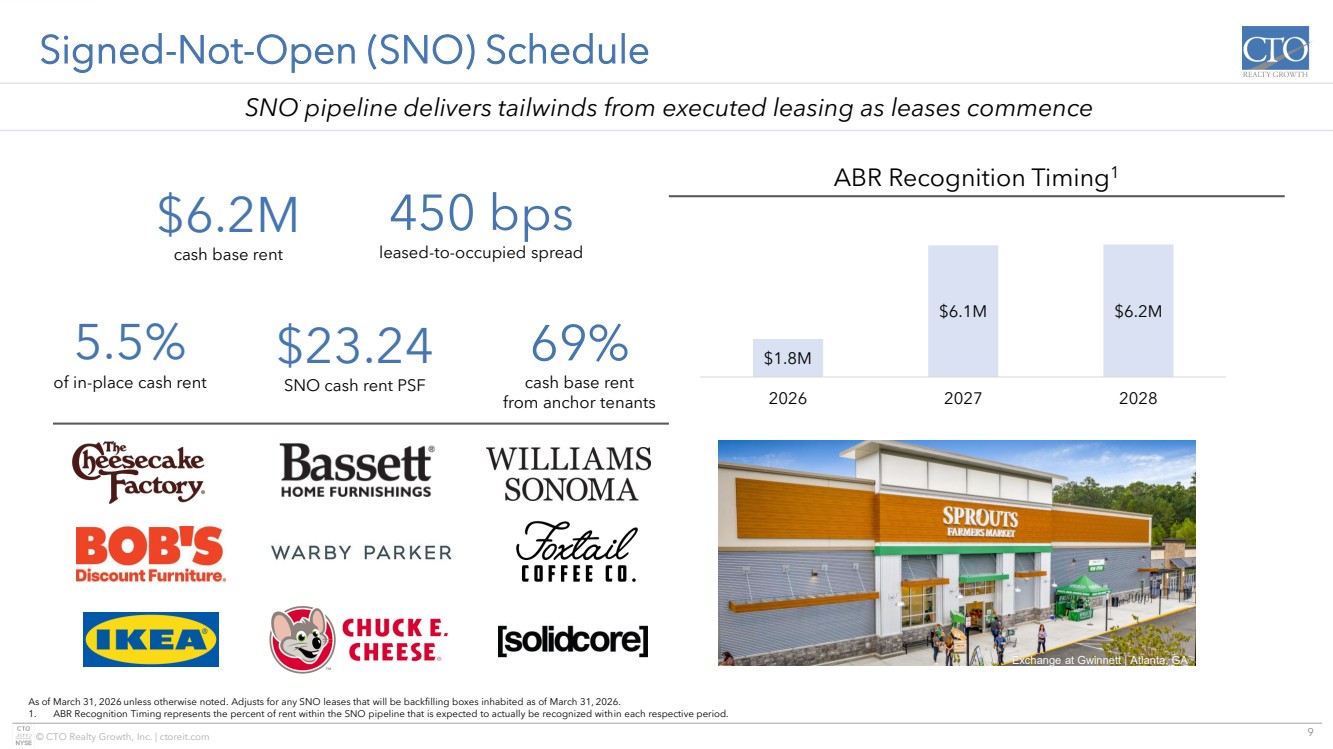
| 9 © CTO Realty Growth, Inc. | ctoreit.com Signed-Not-Open (SNO) Schedule As of March 31, 2026 unless otherwise noted. Adjusts for any SNO leases that will be backfilling boxes inhabited as of March 31, 2026. 1. ABR Recognition Timing represents the percent of rent within the SNO pipeline that is expected to actually be recognized within each respective period. SNO pipeline delivers tailwinds from executed leasing as leases commence ABR Recognition Timing1 $6.2M cash base rent $23.24 SNO cash rent PSF 5.5% of in-place cash rent 69% cash base rent from anchor tenants 450 bps leased-to-occupied spread Exchange at Gwinnett | Atlanta, GA $1.8M $6.1M $6.2M 2026 2027 2028 |
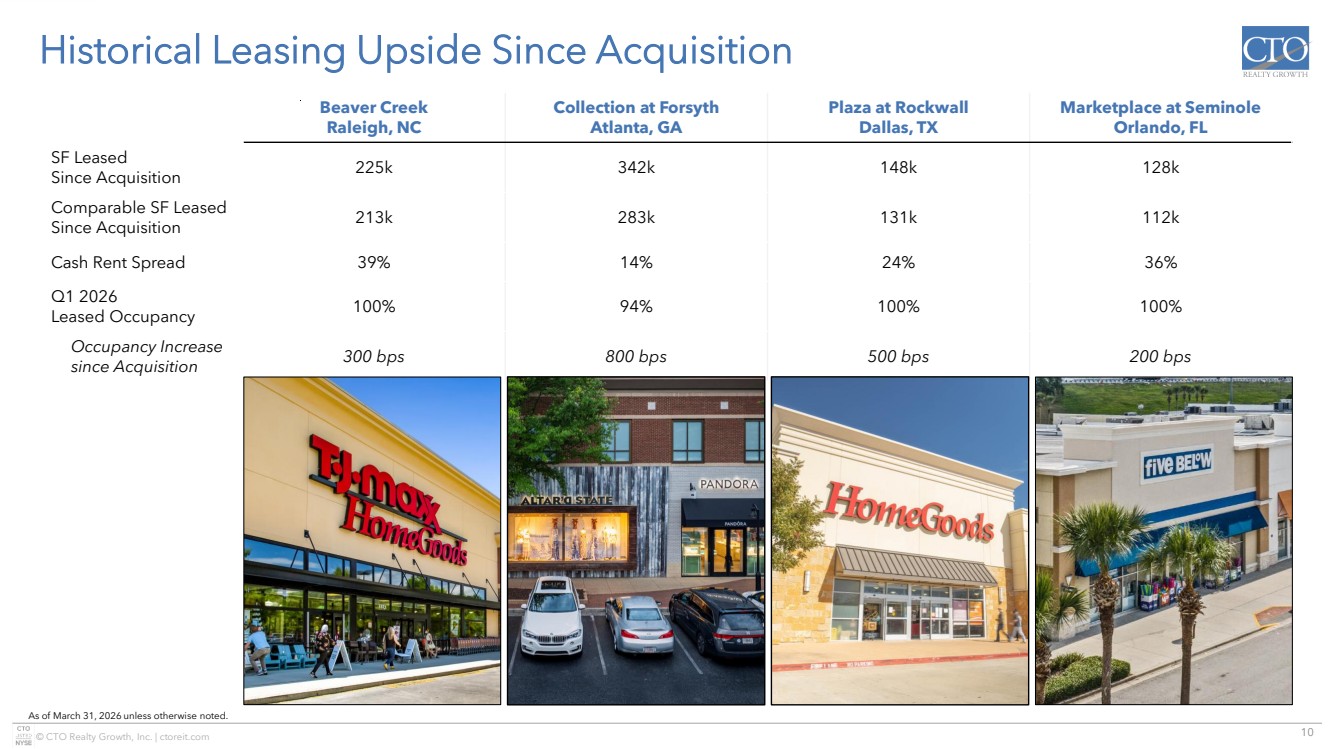
| 10 © CTO Realty Growth, Inc. | ctoreit.com Historical Leasing Upside Since Acquisition As of March 31, 2026 unless otherwise noted. Beaver Creek Raleigh, NC Collection at Forsyth Atlanta, GA Plaza at Rockwall Dallas, TX Marketplace at Seminole Orlando, FL SF Leased Since Acquisition 225k 342k 148k 128k Comparable SF Leased Since Acquisition 213k 283k 131k 112k Cash Rent Spread 39% 14% 24% 36% Q1 2026 Leased Occupancy 100% 94% 100% 100% Occupancy Increase since Acquisition 300 bps 800 bps 500 bps 200 bps |
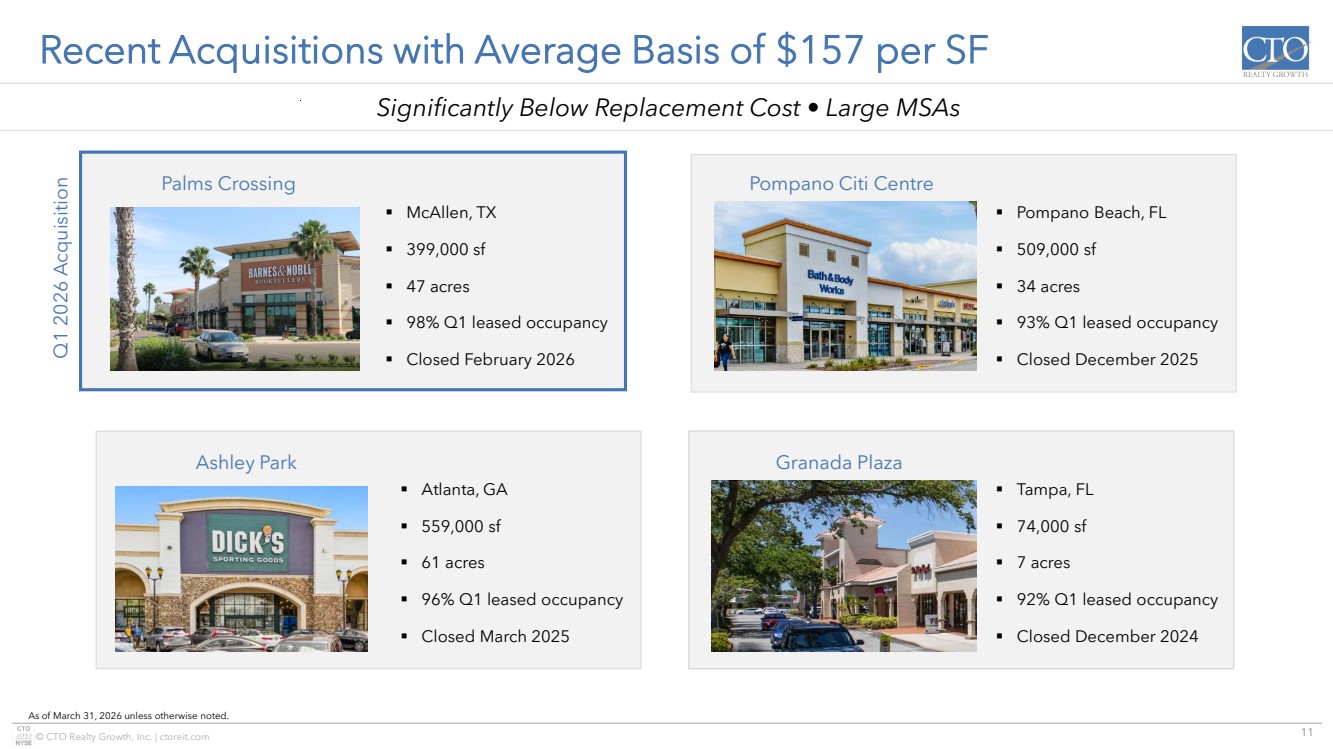
| 11 © CTO Realty Growth, Inc. | ctoreit.com Significantly Below Replacement Cost • Large MSAs Ashley Park ▪ Atlanta, GA ▪ 559,000 sf ▪ 61 acres ▪ 96% Q1 leased occupancy ▪ Closed March 2025 Recent Acquisitions with Average Basis of $157 per SF As of March 31, 2026 unless otherwise noted. Granada Plaza ▪ Tampa, FL ▪ 74,000 sf ▪ 7 acres ▪ 92% Q1 leased occupancy ▪ Closed December 2024 ▪ McAllen, TX ▪ 399,000 sf ▪ 47 acres ▪ 98% Q1 leased occupancy ▪ Closed February 2026 Palms Crossing Q1 2026 Acquisition Pompano Citi Centre ▪ Pompano Beach, FL ▪ 509,000 sf ▪ 34 acres ▪ 93% Q1 leased occupancy ▪ Closed December 2025 |
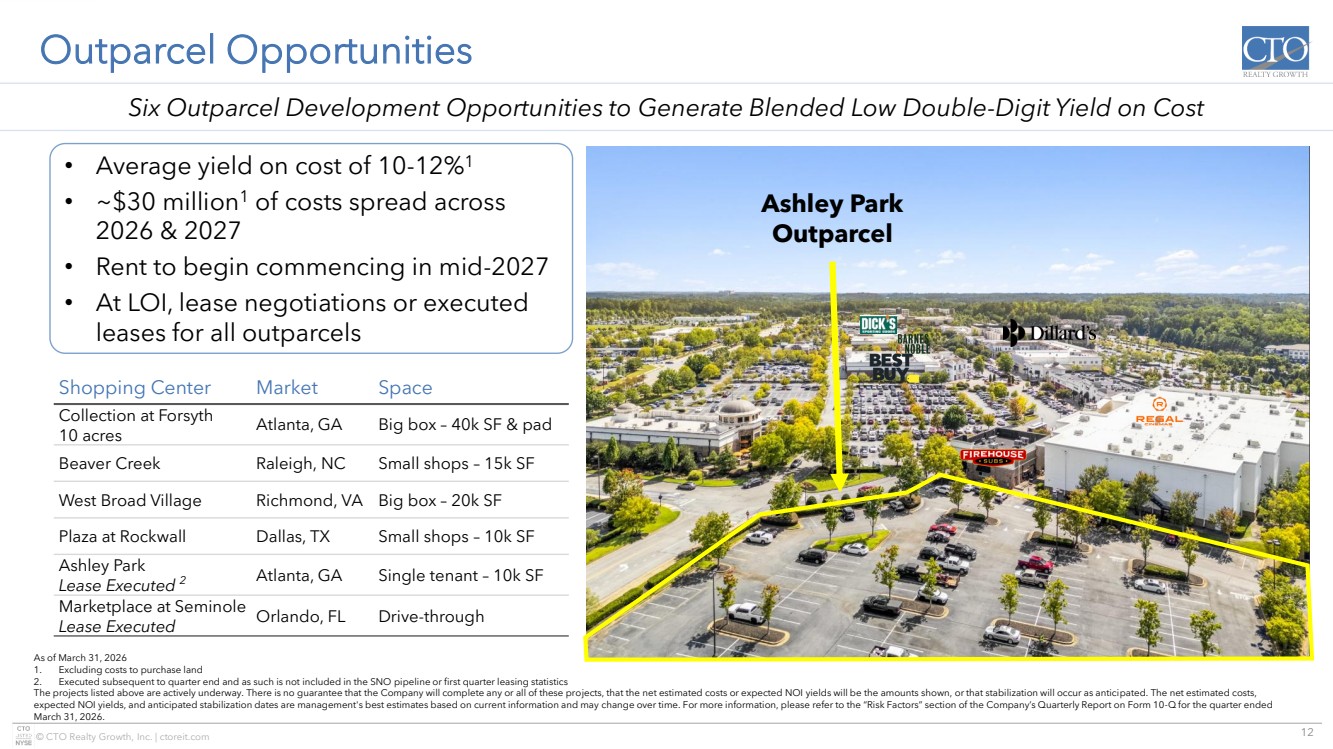
| 12 © CTO Realty Growth, Inc. | ctoreit.com Outparcel Opportunities Shopping Center Market Space Collection at Forsyth 10 acres Atlanta, GA Big box – 40k SF & pad Beaver Creek Raleigh, NC Small shops – 15k SF West Broad Village Richmond, VA Big box – 20k SF Plaza at Rockwall Dallas, TX Small shops – 10k SF Ashley Park Lease Executed 2 Atlanta, GA Single tenant – 10k SF Marketplace at Seminole Lease Executed Orlando, FL Drive-through As of March 31, 2026 1. Excluding costs to purchase land 2. Executed subsequent to quarter end and as such is not included in the SNO pipeline or first quarter leasing statistics The projects listed above are actively underway. There is no guarantee that the Company will complete any or all of these projects, that the net estimated costs or expected NOI yields will be the amounts shown, or that stabilization will occur as anticipated. The net estimated costs, expected NOI yields, and anticipated stabilization dates are management's best estimates based on current information and may change over time. For more information, please refer to the “Risk Factors” section of the Company’s Quarterly Report on Form 10-Q for the quarter ended March 31, 2026. Six Outparcel Development Opportunities to Generate Blended Low Double-Digit Yield on Cost • Average yield on cost of 10-12%1 • ~$30 million1 of costs spread across 2026 & 2027 • Rent to begin commencing in mid-2027 • At LOI, lease negotiations or executed leases for all outparcels Ashley Park Outparcel |
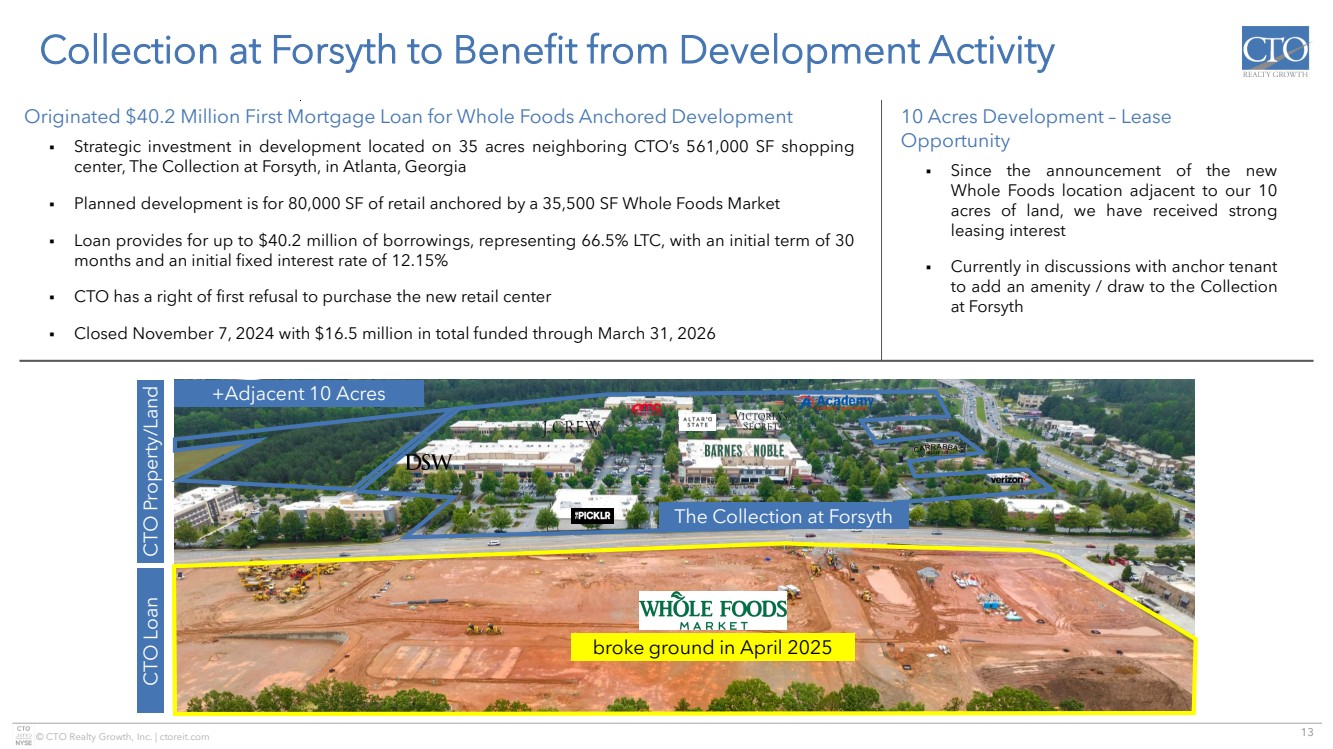
| 13 © CTO Realty Growth, Inc. | ctoreit.com Collection at Forsyth to Benefit from Development Activity Originated $40.2 Million First Mortgage Loan for Whole Foods Anchored Development ▪ Strategic investment in development located on 35 acres neighboring CTO’s 561,000 SF shopping center, The Collection at Forsyth, in Atlanta, Georgia ▪ Planned development is for 80,000 SF of retail anchored by a 35,500 SF Whole Foods Market ▪ Loan provides for up to $40.2 million of borrowings, representing 66.5% LTC, with an initial term of 30 months and an initial fixed interest rate of 12.15% ▪ CTO has a right of first refusal to purchase the new retail center ▪ Closed November 7, 2024 with $16.5 million in total funded through March 31, 2026 10 Acres Development – Lease Opportunity ▪ Since the announcement of the new Whole Foods location adjacent to our 10 acres of land, we have received strong leasing interest ▪ Currently in discussions with anchor tenant to add an amenity / draw to the Collection at Forsyth broke ground in April 2025 The Collection at Forsyth +Adjacent 10 Acres CTO Property/Land CTO Loan |
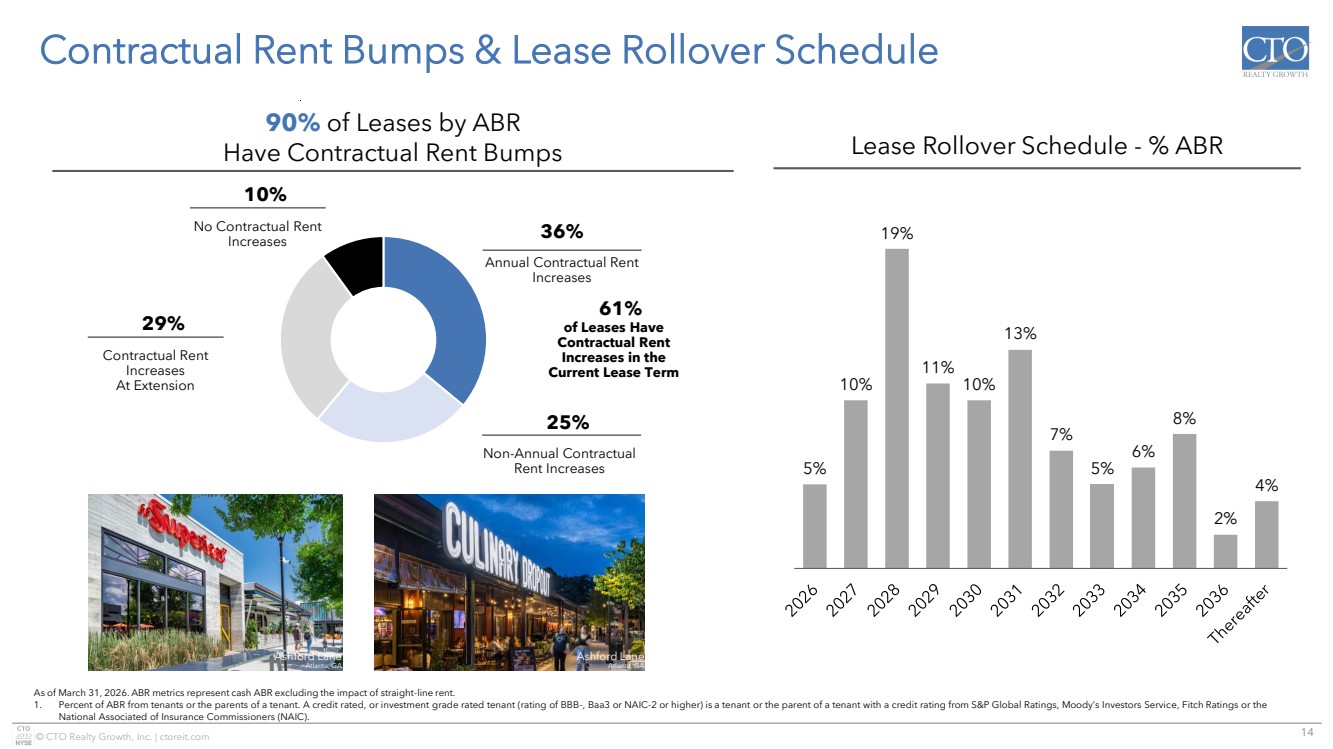
| 14 © CTO Realty Growth, Inc. | ctoreit.com 5% 10% 19% 11% 10% 13% 7% 5% 6% 8% 2% 4% Contractual Rent Bumps & Lease Rollover Schedule As of March 31, 2026. ABR metrics represent cash ABR excluding the impact of straight-line rent. 1. Percent of ABR from tenants or the parents of a tenant. A credit rated, or investment grade rated tenant (rating of BBB-, Baa3 or NAIC-2 or higher) is a tenant or the parent of a tenant with a credit rating from S&P Global Ratings, Moody’s Investors Service, Fitch Ratings or the National Associated of Insurance Commissioners (NAIC). Lease Rollover Schedule - % ABR Non-Annual Contractual Rent Increases 25% Contractual Rent Increases At Extension 29% Annual Contractual Rent Increases 36% of Leases Have Contractual Rent Increases in the Current Lease Term 61% No Contractual Rent Increases 10% 90% of Leases by ABR Have Contractual Rent Bumps Ashford Lane Atlanta, GA Ashford Lane Atlanta, GA |
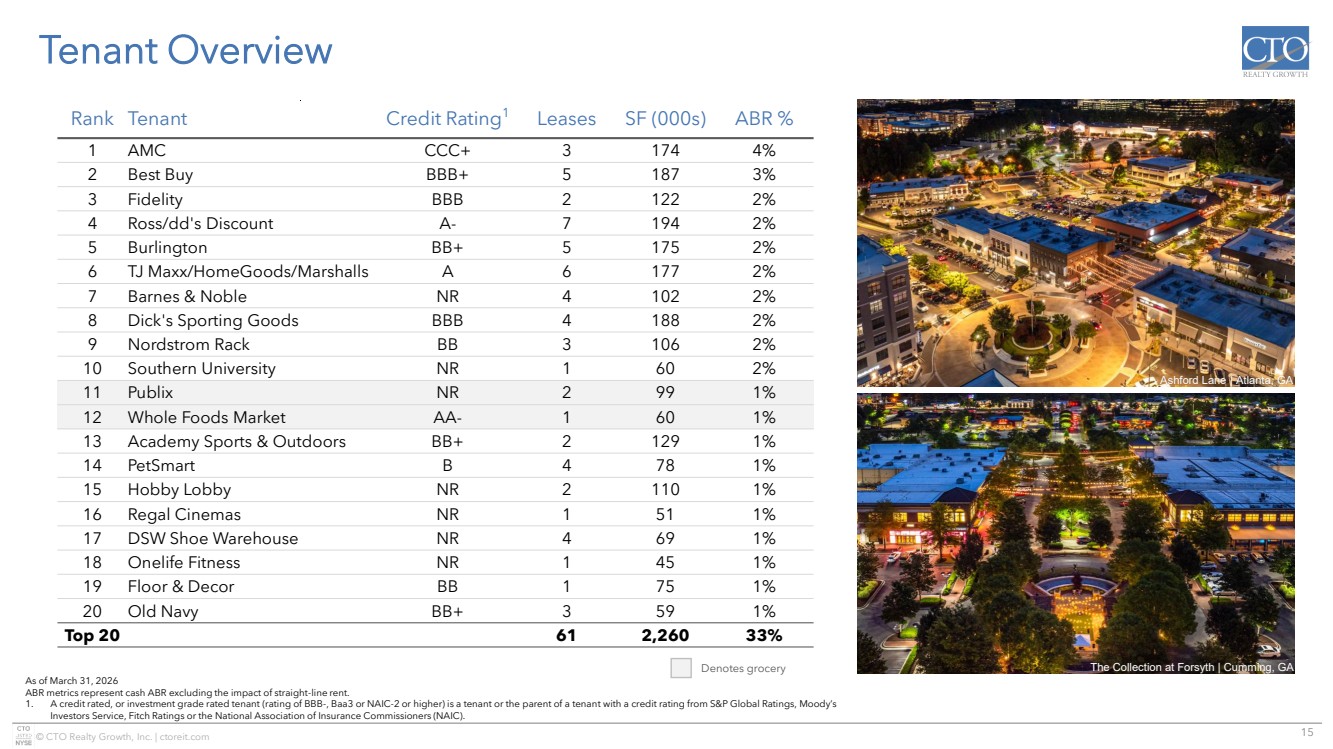
| 15 © CTO Realty Growth, Inc. | ctoreit.com Tenant Overview Rank Tenant Credit Rating1 Leases SF (000s) ABR % 1 AMC CCC+ 3 174 4% 2 Best Buy BBB+ 5 187 3% 3 Fidelity BBB 2 122 2% 4 Ross/dd's Discount A- 7 194 2% 5 Burlington BB+ 5 175 2% 6 TJ Maxx/HomeGoods/Marshalls A 6 177 2% 7 Barnes & Noble NR 4 102 2% 8 Dick's Sporting Goods BBB 4 188 2% 9 Nordstrom Rack BB 3 106 2% 10 Southern University NR 1 60 2% 11 Publix NR 2 99 1% 12 Whole Foods Market AA- 1 60 1% 13 Academy Sports & Outdoors BB+ 2 129 1% 14 PetSmart B 4 78 1% 15 Hobby Lobby NR 2 110 1% 16 Regal Cinemas NR 1 51 1% 17 DSW Shoe Warehouse NR 4 69 1% 18 Onelife Fitness NR 1 45 1% 19 Floor & Decor BB 1 75 1% 20 Old Navy BB+ 3 59 1% Top 20 61 2,260 33% As of March 31, 2026 ABR metrics represent cash ABR excluding the impact of straight-line rent. 1. A credit rated, or investment grade rated tenant (rating of BBB-, Baa3 or NAIC-2 or higher) is a tenant or the parent of a tenant with a credit rating from S&P Global Ratings, Moody’s Investors Service, Fitch Ratings or the National Association of Insurance Commissioners (NAIC). Denotes grocery Ashford Lane | Atlanta, GA The Collection at Forsyth | Cumming, GA |
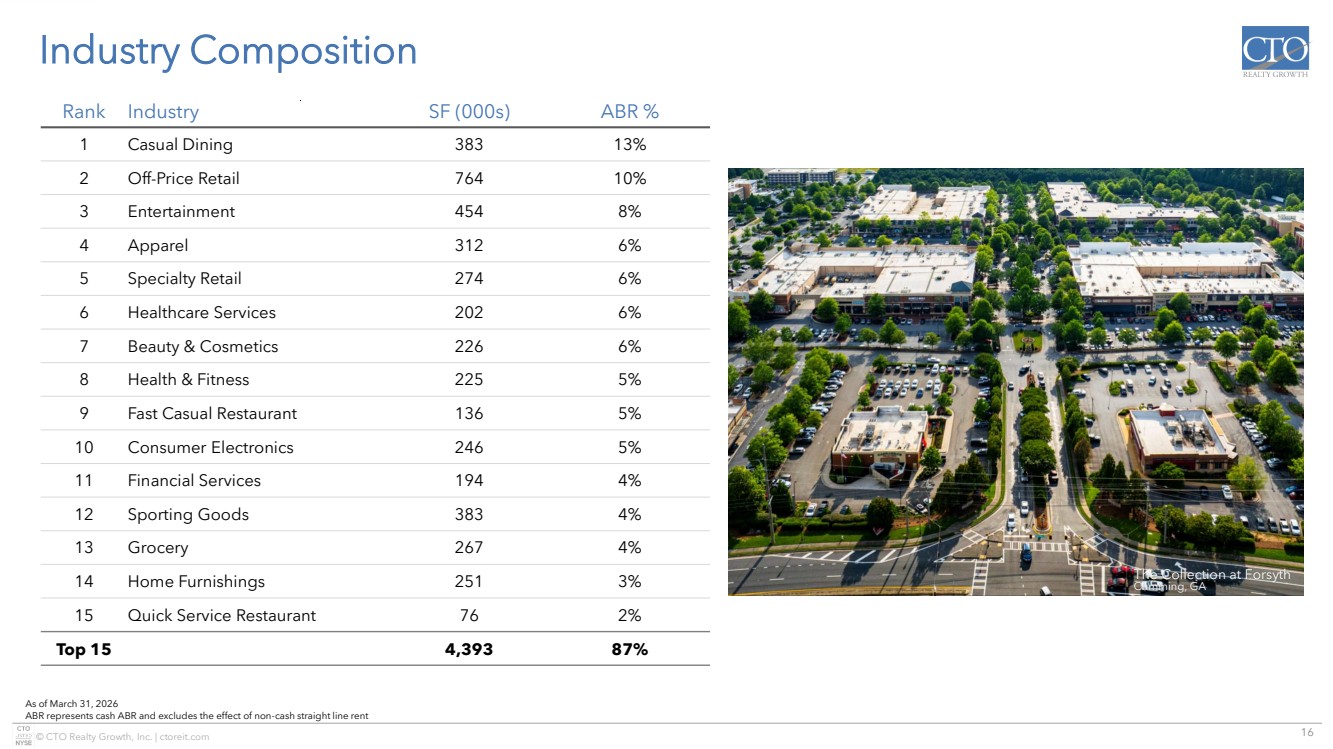
| 16 © CTO Realty Growth, Inc. | ctoreit.com Rank Industry SF (000s) ABR % 1 Casual Dining 383 13% 2 Off-Price Retail 764 10% 3 Entertainment 454 8% 4 Apparel 312 6% 5 Specialty Retail 274 6% 6 Healthcare Services 202 6% 7 Beauty & Cosmetics 226 6% 8 Health & Fitness 225 5% 9 Fast Casual Restaurant 136 5% 10 Consumer Electronics 246 5% 11 Financial Services 194 4% 12 Sporting Goods 383 4% 13 Grocery 267 4% 14 Home Furnishings 251 3% 15 Quick Service Restaurant 76 2% Top 15 4,393 87% Industry Composition As of March 31, 2026 ABR represents cash ABR and excludes the effect of non-cash straight line rent The Collection at Forsyth Cumming, GA |
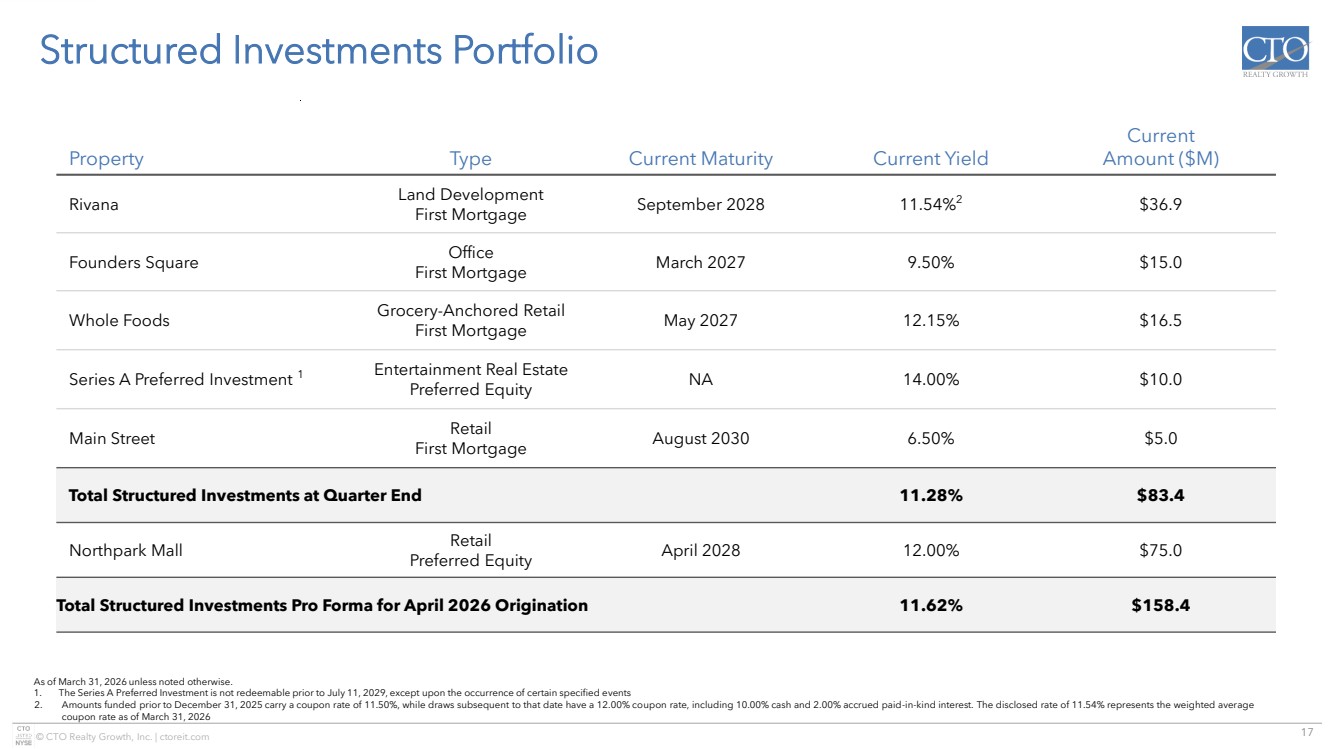
| 17 © CTO Realty Growth, Inc. | ctoreit.com Structured Investments Portfolio Property Type Current Maturity Current Yield Current Amount ($M) Rivana Land Development First Mortgage September 2028 11.54%2 $36.9 Founders Square Office First Mortgage March 2027 9.50% $15.0 Whole Foods Grocery-Anchored Retail First Mortgage May 2027 12.15% $16.5 Series A Preferred Investment 1 Entertainment Real Estate Preferred Equity NA 14.00% $10.0 Main Street Retail First Mortgage August 2030 6.50% $5.0 Total Structured Investments at Quarter End 11.28% $83.4 Northpark Mall Retail Preferred Equity April 2028 12.00% $75.0 Total Structured Investments Pro Forma for April 2026 Origination 11.62% $158.4 As of March 31, 2026 unless noted otherwise. 1. The Series A Preferred Investment is not redeemable prior to July 11, 2029, except upon the occurrence of certain specified events 2. Amounts funded prior to December 31, 2025 carry a coupon rate of 11.50%, while draws subsequent to that date have a 12.00% coupon rate, including 10.00% cash and 2.00% accrued paid-in-kind interest. The disclosed rate of 11.54% represents the weighted average coupon rate as of March 31, 2026 |
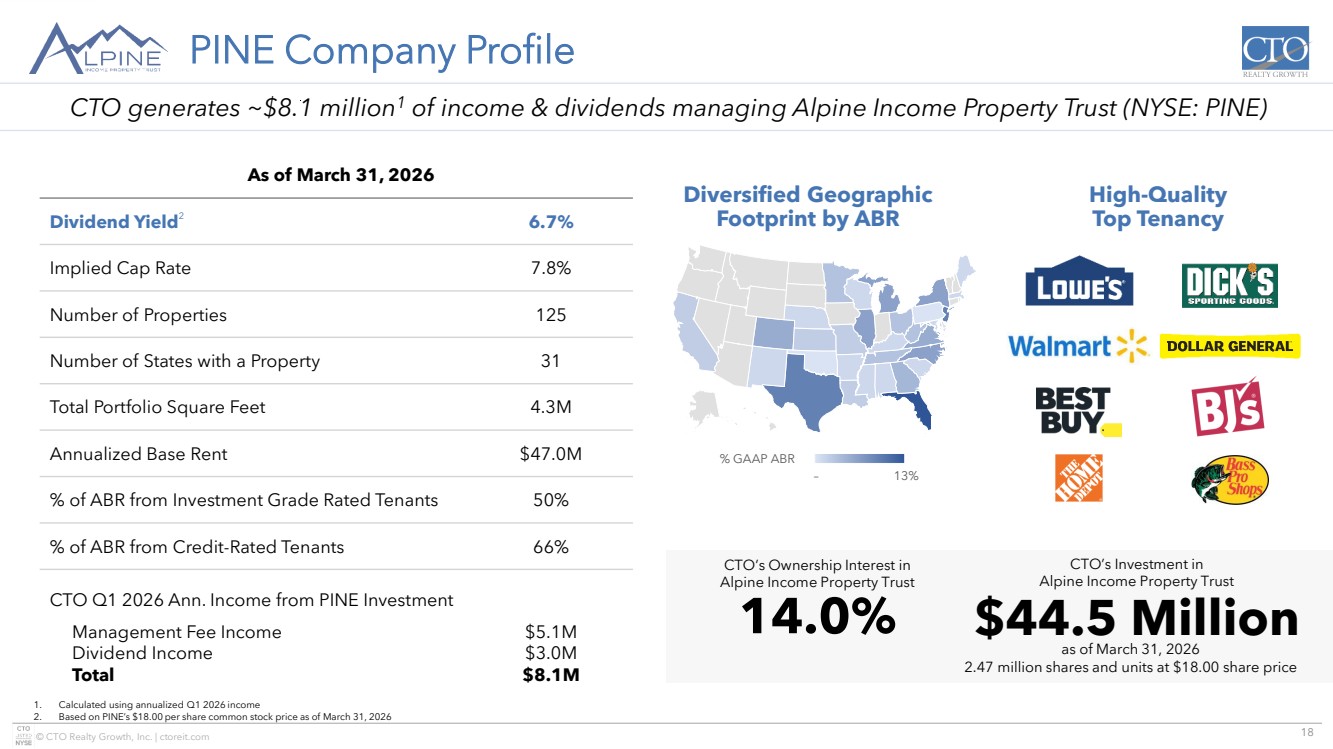
| 18 © CTO Realty Growth, Inc. | ctoreit.com © GeoNames, Microsoft, TomTom Powered by Bing – 13% % GAAP ABR PINE Company Profile 1. Calculated using annualized Q1 2026 income 2. Based on PINE’s $18.00 per share common stock price as of March 31, 2026 As of March 31, 2026 Dividend Yield2 6.7% Implied Cap Rate 7.8% Number of Properties 125 Number of States with a Property 31 Total Portfolio Square Feet 4.3M Annualized Base Rent $47.0M % of ABR from Investment Grade Rated Tenants 50% % of ABR from Credit-Rated Tenants 66% CTO Q1 2026 Ann. Income from PINE Investment Management Fee Income Dividend Income Total $5.1M $3.0M $8.1M Diversified Geographic Footprint by ABR High-Quality Top Tenancy 14.0% CTO’s Ownership Interest in Alpine Income Property Trust $44.5 Million CTO’s Investment in Alpine Income Property Trust as of March 31, 2026 2.47 million shares and units at $18.00 share price CTO generates ~$8.1 million1 of income & dividends managing Alpine Income Property Trust (NYSE: PINE) |
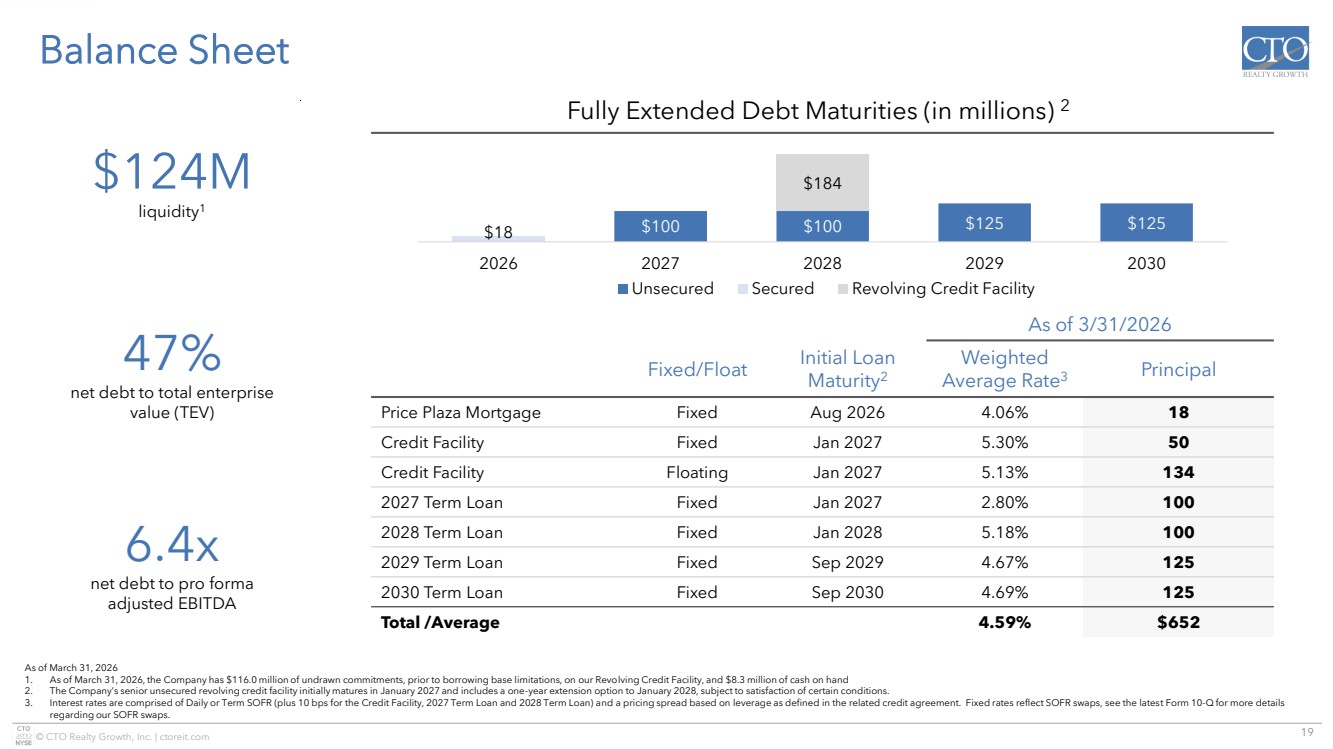
| 19 © CTO Realty Growth, Inc. | ctoreit.com Balance Sheet Exchange at Gwinnett Buford, GA As of March 31, 2026 1. As of March 31, 2026, the Company has $116.0 million of undrawn commitments, prior to borrowing base limitations, on our Revolving Credit Facility, and $8.3 million of cash on hand 2. The Company’s senior unsecured revolving credit facility initially matures in January 2027 and includes a one-year extension option to January 2028, subject to satisfaction of certain conditions. 3. Interest rates are comprised of Daily or Term SOFR (plus 10 bps for the Credit Facility, 2027 Term Loan and 2028 Term Loan) and a pricing spread based on leverage as defined in the related credit agreement. Fixed rates reflect SOFR swaps, see the latest Form 10-Q for more details regarding our SOFR swaps. As of 3/31/2026 Fixed/Float Initial Loan Maturity2 Weighted Average Rate3 Principal Price Plaza Mortgage Fixed Aug 2026 4.06% 18 Credit Facility Fixed Jan 2027 5.30% 50 Credit Facility Floating Jan 2027 5.13% 134 2027 Term Loan Fixed Jan 2027 2.80% 100 2028 Term Loan Fixed Jan 2028 5.18% 100 2029 Term Loan Fixed Sep 2029 4.67% 125 2030 Term Loan Fixed Sep 2030 4.69% 125 Total /Average 4.59% $652 Fully Extended Debt Maturities (in millions) 2 $124M liquidity1 47% net debt to total enterprise value (TEV) 6.4x net debt to pro forma adjusted EBITDA $100 $100 $125 $125 $18 $184 2026 2027 2028 2029 2030 Unsecured Secured Revolving Credit Facility |
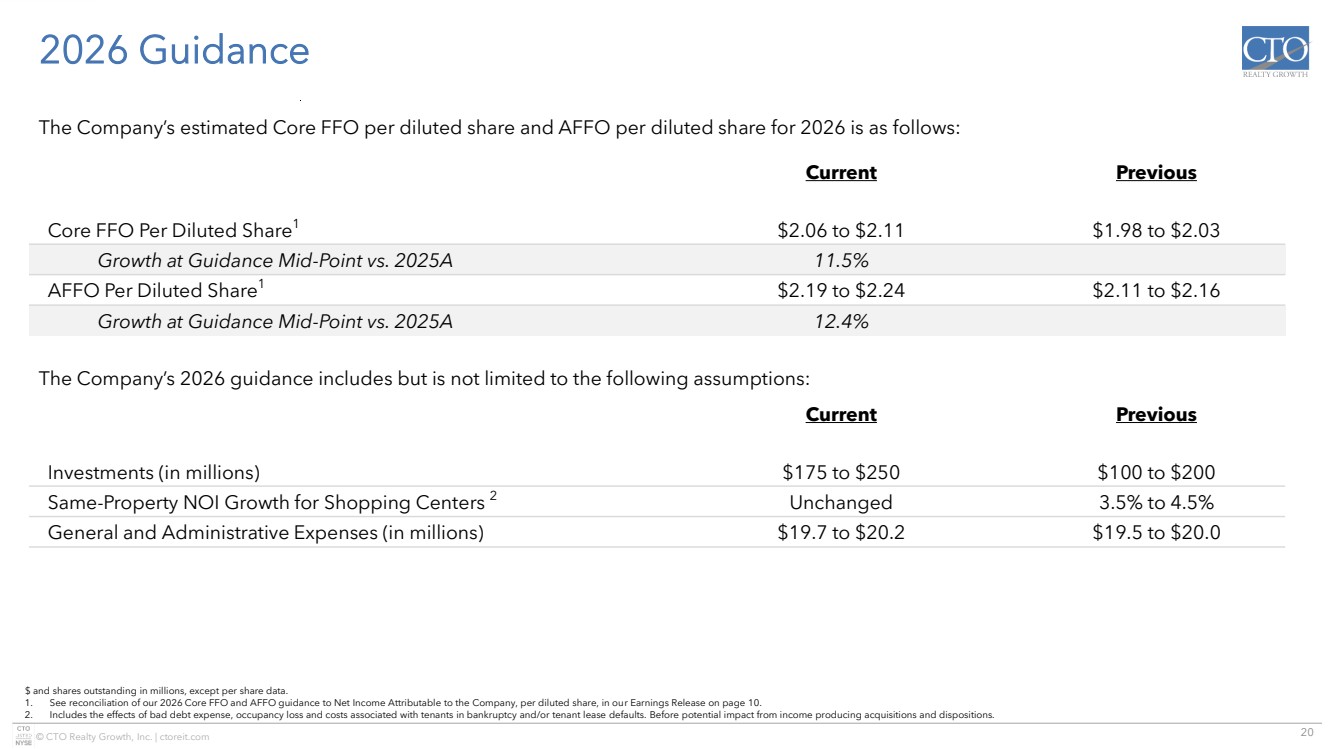
| 20 © CTO Realty Growth, Inc. | ctoreit.com 2026 Guidance Exchange at Gwinnett Buford, GA $ and shares outstanding in millions, except per share data. 1. See reconciliation of our 2026 Core FFO and AFFO guidance to Net Income Attributable to the Company, per diluted share, in our Earnings Release on page 10. 2. Includes the effects of bad debt expense, occupancy loss and costs associated with tenants in bankruptcy and/or tenant lease defaults. Before potential impact from income producing acquisitions and dispositions. Current Previous Core FFO Per Diluted Share1 $2.06 to $2.11 $1.98 to $2.03 Growth at Guidance Mid-Point vs. 2025A 11.5% AFFO Per Diluted Share1 $2.19 to $2.24 $2.11 to $2.16 Growth at Guidance Mid-Point vs. 2025A 12.4% The Company’s estimated Core FFO per diluted share and AFFO per diluted share for 2026 is as follows: The Company’s 2026 guidance includes but is not limited to the following assumptions: Current Previous Investments (in millions) $175 to $250 $100 to $200 Same-Property NOI Growth for Shopping Centers 2 Unchanged 3.5% to 4.5% General and Administrative Expenses (in millions) $19.7 to $20.2 $19.5 to $20.0 |
| 21 © CTO Realty Growth, Inc. | ctoreit.com Experienced Management Team Exchange at Gwinnett Buford, GA Yonder Yoga John P. Albright President & Chief Executive Officer ▪ Former Co-Head and Managing Director of Archon Capital, a Goldman Sachs Company; Executive Director of Merchant Banking – Investment Management at Morgan Stanley; and Managing Director of Crescent Real Estate (NYSE: CEI) Daniel E. Smith Senior Vice President, General Counsel & Corporate Secretary ▪ Former Vice President and Associate General Counsel of Goldman Sachs & Co. and Senior Vice President and General Counsel of Crescent Real Estate (NYSE: CEI) Philip R. Mays Senior Vice President, Chief Financial Officer & Treasurer ▪ Former Chief Financial Officer & Treasurer of Shadowbox Studios; EVP, Chief Financial Officer & Treasurer of Cedar Realty; and Vice President and Chief Accounting Officer of Federal Realty (NYSE: FRT) Steven R. Greathouse Senior Vice President & Chief Investment Officer ▪ Former Director of Finance for N3 Real Estate; Senior Associate of Merchant Banking – Investment Management at Morgan Stanley; and Senior Associate at Crescent Real Estate (NYSE: CEI) Lisa M. Vorakoun Senior Vice President & Chief Accounting Officer ▪ Former Assistant Finance Director of the City of DeLand, Florida and Audit Manager for James Moore & Company, an Accounting and Consulting Firm Matt J. Trau Vice President, Investments ▪ Former Senior Director of Transactions at ShopCore Properties; Senior Associate of Transactions at DDR Corp (currently Site Centers NYSE: SITC) Alexander M. Gordon Vice President, Leasing & Investments ▪ Former Senior Associate, Brokerage & Retail Advisory Services at CBRE (NYSE: CBRE) |
| 22 © CTO Realty Growth, Inc. | ctoreit.com Forward Looking Statements & Non-GAAP Financial Measures Forward Looking Statements Certain statements contained in this presentation (other than statements of historical fact) are forward-looking statements within the meaning of Section 27A of the Securities Act of 1933, as amended, and Section 21E of the Securities Exchange Act of 1934, as amended. Forward-looking statements can typically be identified by words such as “outlook,” “believe,” “estimate,” “expect,” “intend,” “anticipate,” “will,” “could,” “may,” “should,” “plan,” “potential,” “predict,” “forecast,” “project,” and similar expressions, as well as variations or negatives of these words. Although forward-looking statements are made based upon management’s present expectations and beliefs concerning future developments and their potential effect upon the Company, a number of factors could cause the Company’s actual results to differ materially from those set forth in the forward-looking statements. Such factors may include, but are not limited to: the Company’s ability to remain qualified as a REIT; the Company’s exposure to U.S. federal and state income tax law changes, including changes to the REIT requirements; general adverse economic and real estate conditions; macroeconomic and geopolitical factors, including but not limited to inflationary pressures, interest rate volatility, distress in the banking sector, global supply chain disruptions, and ongoing geopolitical war; credit risk associated with the Company investing in commercial loans and similarly structured investments; the ultimate geographic spread, severity and duration of pandemics such as the COVID-19 Pandemic and its variants, actions that may be taken by governmental authorities to contain or address the impact of such pandemics, and the potential negative impacts of such pandemics on the global economy and the Company’s financial condition and results of operations; the inability of major tenants or borrowers to continue paying their rent or obligations due to bankruptcy, insolvency or a general downturn in their business; the loss or failure, or decline in the business or assets of PINE; the completion of 1031 exchange transactions; the availability of investment properties that meet the Company’s investment goals and criteria; the uncertainties associated with obtaining required governmental permits and satisfying other closing conditions for planned acquisitions and sales; and the uncertainties and risk factors discussed in the Company’s Annual Report on Form 10-K for the fiscal year ended December 31, 2025 and other risks and uncertainties discussed from time to time in the Company’s filings with the U.S. Securities and Exchange Commission. There can be no assurance that future developments will be in accordance with management’s expectations or that the effect of future developments on the Company will be those anticipated by management. Readers are cautioned not to place undue reliance on these forward-looking statements, which speak only as of the date of this press release. The Company undertakes no obligation to update the information contained in this press release to reflect subsequently occurring events or circumstances. Non-GAAP Financial Measures Our reported results are presented in accordance with accounting principles generally accepted in the United States of America (“GAAP”). We also disclose Funds From Operations (“FFO”), Core Funds From Operations (“Core FFO”), Adjusted Funds From Operations (“AFFO”), Pro Forma Earnings Before Interest, Taxes, Depreciation and Amortization (“Pro Forma Adjusted EBITDA”), and Same-Property Net Operating Income (“Same-Property NOI”), each of which are non-GAAP financial measures. We believe these non-GAAP financial measures are useful to investors because they are widely accepted industry measures used by analysts and investors to compare the operating performance of REITs. FFO, Core FFO, AFFO, Pro Forma Adjusted EBITDA, and Same-Property NOI do not represent cash generated from operating activities and are not necessarily indicative of cash available to fund cash requirements; accordingly, they should not be considered alternatives to net income as a performance measure or cash flows from operating activities as reported on our statement of cash flows as a liquidity measure and should be considered in addition to, and not in lieu of, GAAP financial measures. We compute FFO in accordance with the definition adopted by the Board of Governors of the National Association of Real Estate Investment Trusts, or NAREIT. NAREIT defines FFO as GAAP net income or loss adjusted to exclude real estate related depreciation and amortization, as well as extraordinary items (as defined by GAAP) such as net gain or loss from sales of depreciable real estate assets, impairment write-downs associated with depreciable real estate assets and impairments associated with the current expected credit losses on commercial loans and investments at the time of origination and repayment, including the pro rata share of such adjustments of unconsolidated subsidiaries. The Company also excludes the gains or losses from sales of assets incidental to the primary business of the REIT which specifically include the sales of investment securities, in addition to the mark-to-market of the Company’s investment securities. To derive Core FFO, we modify the NAREIT computation of FFO to include other adjustments to GAAP net income related to gains and losses recognized on the extinguishment of debt, amortization of above- and below-market lease related intangibles, and other unforecastable market- or transaction-driven non-cash items. |
| 23 © CTO Realty Growth, Inc. | ctoreit.com Non-GAAP Financial Measures Non-GAAP Financial Measures (continued) To derive AFFO, we further modify the NAREIT computation of FFO and Core FFO to include other adjustments to GAAP net income related to non-cash revenues and expenses such as straight-line rental revenue, non-cash compensation, and other non-cash amortization. Such items may cause short-term fluctuations in net income but have no impact on operating cash flows or long-term operating performance. We use AFFO as one measure of our performance when we formulate corporate goals. To derive Pro Forma Adjusted EBITDA, GAAP net income or loss attributable to the Company is adjusted to exclude real estate related depreciation and amortization, as well as extraordinary items (as defined by GAAP) such as net gain or loss from sales of depreciable real estate assets, impairment write-downs associated with depreciable real estate assets, impairments associated with the current expected credit losses on commercial loans and investments at the time of origination and repayment, including the pro rata share of such adjustments of unconsolidated subsidiaries, non-cash revenues and expenses such as straight-line rental revenue, amortization of deferred financing costs, gains and losses recognized on the extinguishment of debt, above- and below-market lease related intangibles, non-cash compensation, other non-recurring items such as termination fees, forfeitures of tenant security deposits, and other non-recurring items, and other non-cash income or expense. The Company also excludes the gains or losses from sales of assets incidental to the primary business of the REIT which specifically include the sales of investment securities, in addition to the mark-to-market of the Company’s investment securities. Cash interest expense is also excluded from Pro Forma Adjusted EBITDA, and GAAP net income or loss is adjusted for the annualized impact of acquisitions, dispositions and other similar activities. To derive Same-Property NOI, GAAP net income or loss attributable to the Company is adjusted to exclude real estate related depreciation and amortization, as well as extraordinary items (as defined by GAAP) such as net gain or loss from sales of depreciable real estate assets, impairment write-downs associated with depreciable real estate assets, impairments associated with the current expected credit losses on commercial loans and investments at the time of origination and repayment, including the pro rata share of such adjustments of unconsolidated subsidiaries, non-cash revenues and expenses such as straight-line rental revenue, amortization of deferred financing costs, gains and losses recognized on the extinguishment of debt, above- and below-market lease related intangibles, non-cash compensation, other non-recurring items such as termination fees, forfeitures of tenant security deposits, and other non-recurring items, and other non-cash income or expense. Interest expense, general and administrative expenses, investment and other income or loss, income tax benefit or expense, management fee income, and interest income from commercial loans and investments are also excluded from Same-Property NOI. GAAP net income or loss is further adjusted to remove the impact of properties that were not owned for the full current and prior year reporting periods presented. Cash rental income received under the leases pertaining to the Company’s assets that are presented as commercial loans and investments in accordance with GAAP is also used in lieu of the interest income equivalent. FFO is used by management, investors and analysts to facilitate meaningful comparisons of operating performance between periods and among our peers primarily because it excludes the effect of real estate depreciation and amortization and net gains or losses on sales, which are based on historical costs and implicitly assume that the value of real estate diminishes predictably over time, rather than fluctuating based on existing market conditions. We believe that Core FFO and AFFO are additional useful supplemental measures for investors to consider because they will help them to better assess our operating performance without the distortions created by other non-cash revenues or expenses. We also believe that Pro Forma Adjusted EBITDA is an additional useful supplemental measure for investors to consider as it allows for a better assessment of our operating performance without the distortions created by other non-cash revenues, expenses or certain effects of the Company’s capital structure on our operating performance. We use Same-Property NOI to compare the operating performance of our assets between periods. It is an accepted and important measurement used by management, investors and analysts because it includes all property-level revenues from the Company’s properties, less operating and maintenance expenses, real estate taxes and other property-specific expenses (“Net Operating Income” or “NOI”) of properties that have been owned and stabilized for the entire current and prior year reporting periods. Same-Property NOI attempts to eliminate differences due to the acquisition or disposition of properties during the particular period presented, and therefore provides a more comparable and consistent performance measure for the comparison of the Company’s properties. FFO, Core FFO, AFFO, Pro Forma Adjusted EBITDA, and Same-Property NOI may not be comparable to similarly titled measures employed by other companies. |
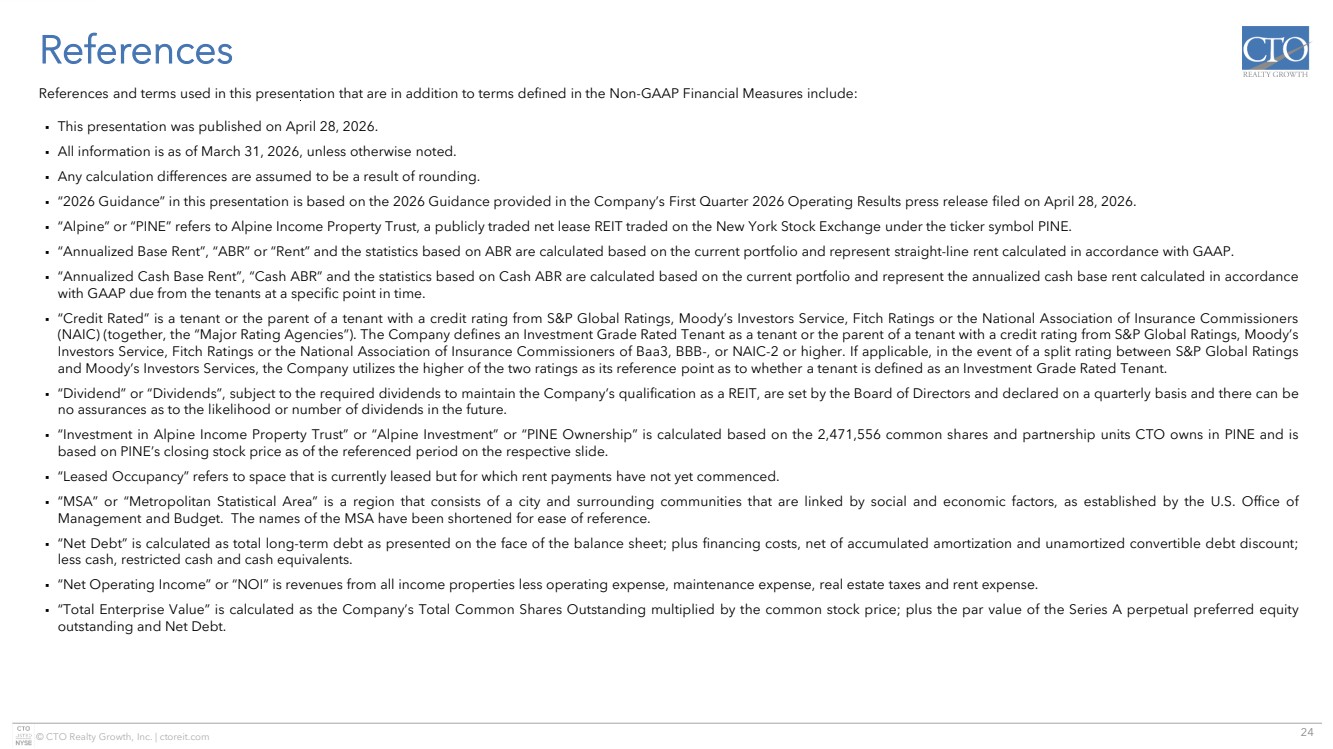
| 24 © CTO Realty Growth, Inc. | ctoreit.com References References and terms used in this presentation that are in addition to terms defined in the Non-GAAP Financial Measures include: ▪ This presentation was published on April 28, 2026. ▪ All information is as of March 31, 2026, unless otherwise noted. ▪ Any calculation differences are assumed to be a result of rounding. ▪ “2026 Guidance” in this presentation is based on the 2026 Guidance provided in the Company’s First Quarter 2026 Operating Results press release filed on April 28, 2026. ▪ “Alpine” or “PINE” refers to Alpine Income Property Trust, a publicly traded net lease REIT traded on the New York Stock Exchange under the ticker symbol PINE. ▪ “Annualized Base Rent”, “ABR” or “Rent” and the statistics based on ABR are calculated based on the current portfolio and represent straight-line rent calculated in accordance with GAAP. ▪ “Annualized Cash Base Rent”, “Cash ABR” and the statistics based on Cash ABR are calculated based on the current portfolio and represent the annualized cash base rent calculated in accordance with GAAP due from the tenants at a specific point in time. ▪ “Credit Rated” is a tenant or the parent of a tenant with a credit rating from S&P Global Ratings, Moody’s Investors Service, Fitch Ratings or the National Association of Insurance Commissioners (NAIC) (together, the “Major Rating Agencies”). The Company defines an Investment Grade Rated Tenant as a tenant or the parent of a tenant with a credit rating from S&P Global Ratings, Moody’s Investors Service, Fitch Ratings or the National Association of Insurance Commissioners of Baa3, BBB-, or NAIC-2 or higher. If applicable, in the event of a split rating between S&P Global Ratings and Moody’s Investors Services, the Company utilizes the higher of the two ratings as its reference point as to whether a tenant is defined as an Investment Grade Rated Tenant. ▪ “Dividend” or “Dividends”, subject to the required dividends to maintain the Company’s qualification as a REIT, are set by the Board of Directors and declared on a quarterly basis and there can be no assurances as to the likelihood or number of dividends in the future. ▪ “Investment in Alpine Income Property Trust” or “Alpine Investment” or “PINE Ownership” is calculated based on the 2,471,556 common shares and partnership units CTO owns in PINE and is based on PINE’s closing stock price as of the referenced period on the respective slide. ▪ “Leased Occupancy” refers to space that is currently leased but for which rent payments have not yet commenced. ▪ “MSA” or “Metropolitan Statistical Area” is a region that consists of a city and surrounding communities that are linked by social and economic factors, as established by the U.S. Office of Management and Budget. The names of the MSA have been shortened for ease of reference. ▪ “Net Debt” is calculated as total long-term debt as presented on the face of the balance sheet; plus financing costs, net of accumulated amortization and unamortized convertible debt discount; less cash, restricted cash and cash equivalents. ▪ “Net Operating Income” or “NOI” is revenues from all income properties less operating expense, maintenance expense, real estate taxes and rent expense. ▪ “Total Enterprise Value” is calculated as the Company’s Total Common Shares Outstanding multiplied by the common stock price; plus the par value of the Series A perpetual preferred equity outstanding and Net Debt. |
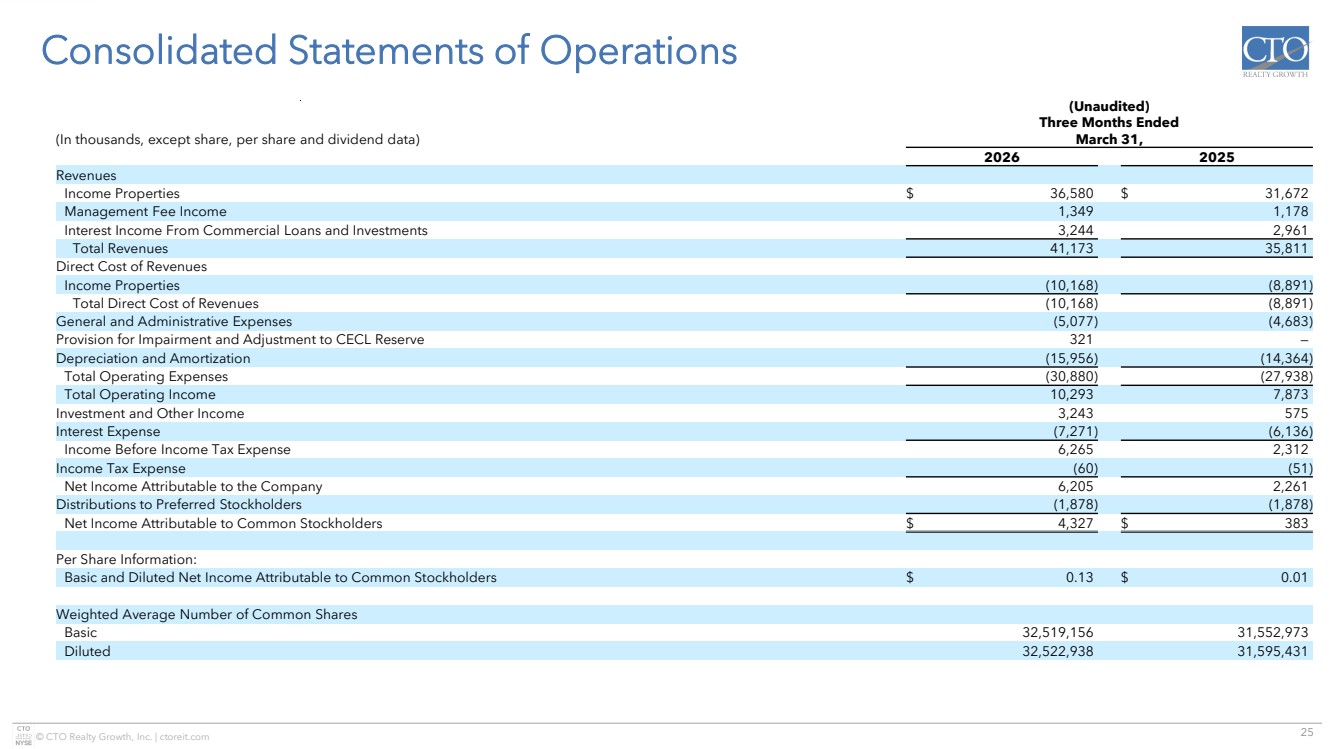
| 25 © CTO Realty Growth, Inc. | ctoreit.com Consolidated Statements of Operations (In thousands, except share, per share and dividend data) (Unaudited) Three Months Ended March 31, 2026 2025 Revenues Income Properties $ 36,580 $ 31,672 Management Fee Income 1,349 1,178 Interest Income From Commercial Loans and Investments 3,244 2,961 Total Revenues 41,173 35,811 Direct Cost of Revenues Income Properties (10,168) (8,891) Total Direct Cost of Revenues (10,168) (8,891) General and Administrative Expenses (5,077) (4,683) Provision for Impairment and Adjustment to CECL Reserve 321 — Depreciation and Amortization (15,956) (14,364) Total Operating Expenses (30,880) (27,938) Total Operating Income 10,293 7,873 Investment and Other Income 3,243 575 Interest Expense (7,271) (6,136) Income Before Income Tax Expense 6,265 2,312 Income Tax Expense (60) (51) Net Income Attributable to the Company 6,205 2,261 Distributions to Preferred Stockholders (1,878) (1,878) Net Income Attributable to Common Stockholders $ 4,327 $ 383 Per Share Information: Basic and Diluted Net Income Attributable to Common Stockholders $ 0.13 $ 0.01 Weighted Average Number of Common Shares Basic 32,519,156 31,552,973 Diluted 32,522,938 31,595,431 |
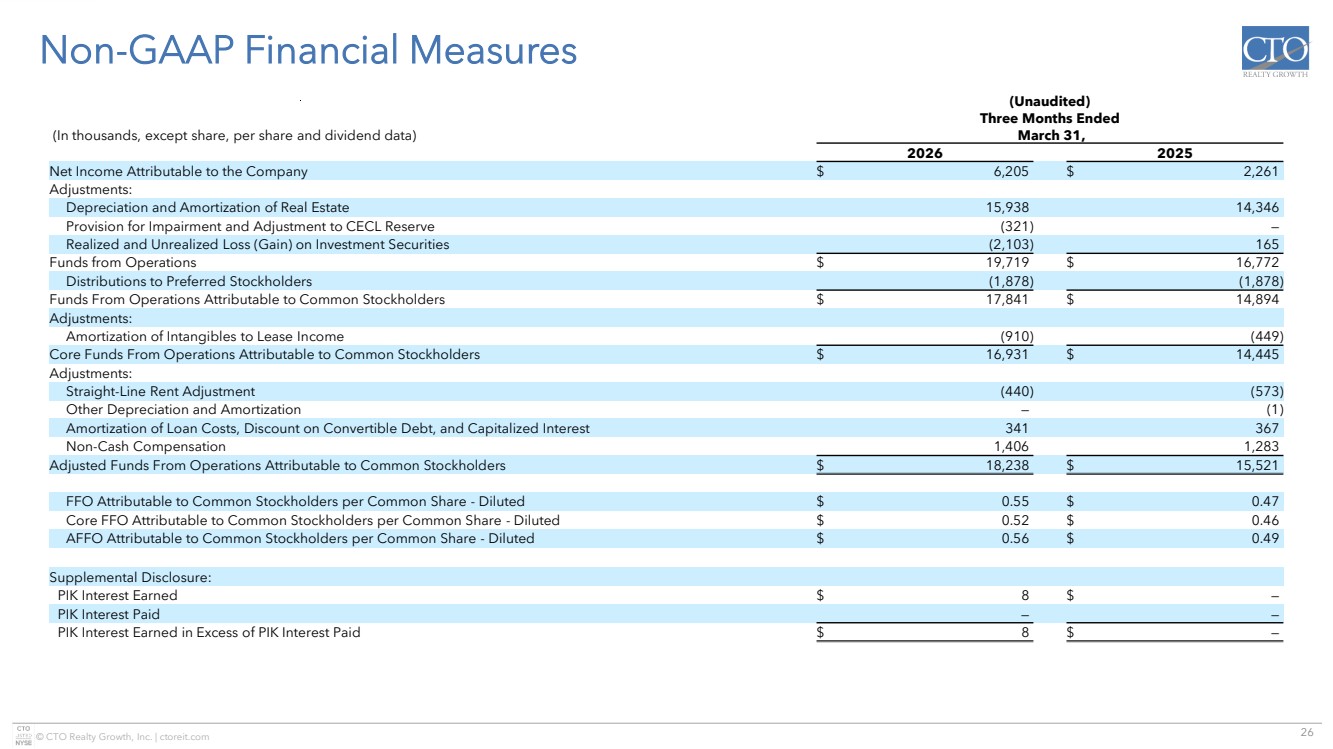
| 26 © CTO Realty Growth, Inc. | ctoreit.com Non-GAAP Financial Measures (In thousands, except share, per share and dividend data) (Unaudited) Three Months Ended March 31, 2026 2025 Net Income Attributable to the Company $ 6,205 $ 2,261 Adjustments: Depreciation and Amortization of Real Estate 15,938 14,346 Provision for Impairment and Adjustment to CECL Reserve (321) — Realized and Unrealized Loss (Gain) on Investment Securities (2,103) 165 Funds from Operations $ 19,719 $ 16,772 Distributions to Preferred Stockholders (1,878) (1,878) Funds From Operations Attributable to Common Stockholders $ 17,841 $ 14,894 Adjustments: Amortization of Intangibles to Lease Income (910) (449) Core Funds From Operations Attributable to Common Stockholders $ 16,931 $ 14,445 Adjustments: Straight-Line Rent Adjustment (440) (573) Other Depreciation and Amortization — (1) Amortization of Loan Costs, Discount on Convertible Debt, and Capitalized Interest 341 367 Non-Cash Compensation 1,406 1,283 Adjusted Funds From Operations Attributable to Common Stockholders $ 18,238 $ 15,521 FFO Attributable to Common Stockholders per Common Share - Diluted $ 0.55 $ 0.47 Core FFO Attributable to Common Stockholders per Common Share - Diluted $ 0.52 $ 0.46 AFFO Attributable to Common Stockholders per Common Share - Diluted $ 0.56 $ 0.49 Supplemental Disclosure: PIK Interest Earned $ 8 $ — PIK Interest Paid — — PIK Interest Earned in Excess of PIK Interest Paid $ 8 $ — |
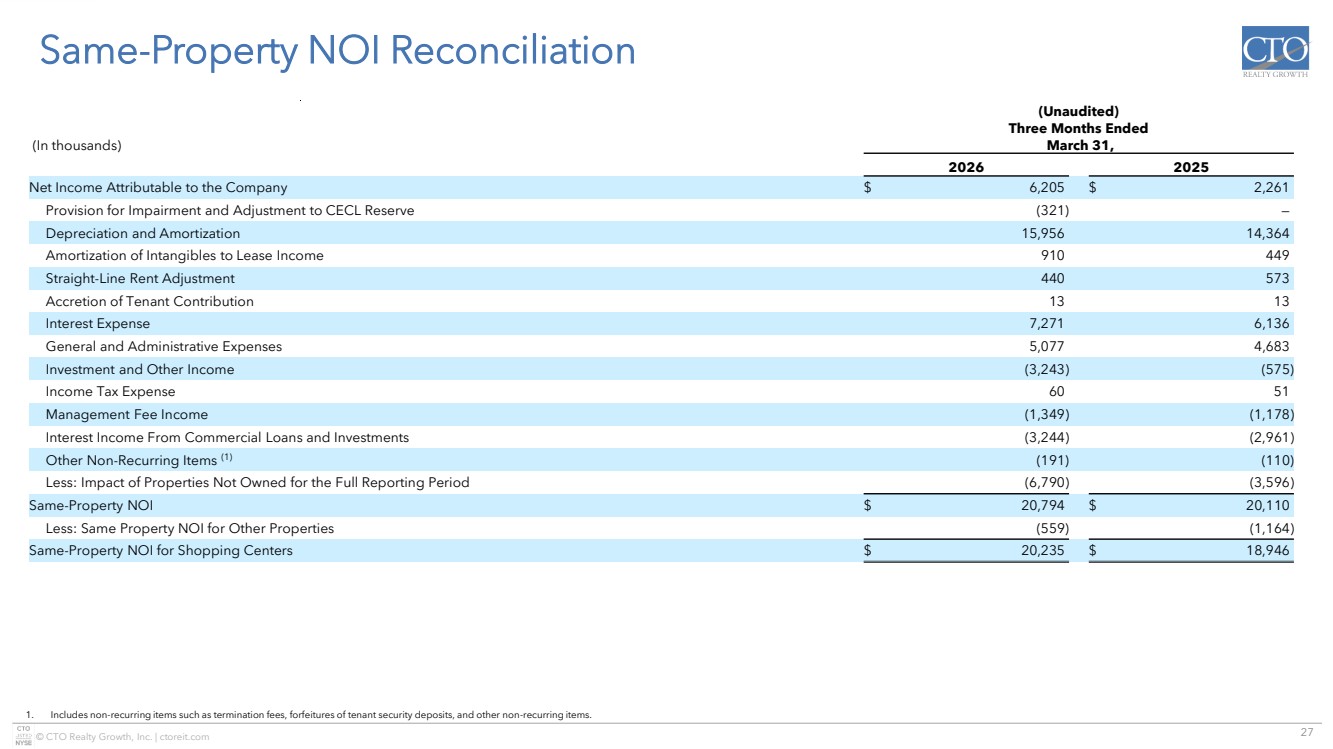
| 27 © CTO Realty Growth, Inc. | ctoreit.com Same-Property NOI Reconciliation 1. Includes non-recurring items such as termination fees, forfeitures of tenant security deposits, and other non-recurring items. (In thousands) (Unaudited) Three Months Ended March 31, 2026 2025 Net Income Attributable to the Company $ 6,205 $ 2,261 Provision for Impairment and Adjustment to CECL Reserve (321) — Depreciation and Amortization 15,956 14,364 Amortization of Intangibles to Lease Income 910 449 Straight-Line Rent Adjustment 440 573 Accretion of Tenant Contribution 13 13 Interest Expense 7,271 6,136 General and Administrative Expenses 5,077 4,683 Investment and Other Income (3,243) (575) Income Tax Expense 60 51 Management Fee Income (1,349) (1,178) Interest Income From Commercial Loans and Investments (3,244) (2,961) Other Non-Recurring Items (1) (191) (110) Less: Impact of Properties Not Owned for the Full Reporting Period (6,790) (3,596) Same-Property NOI $ 20,794 $ 20,110 Less: Same Property NOI for Other Properties (559) (1,164) Same-Property NOI for Shopping Centers $ 20,235 $ 18,946 |
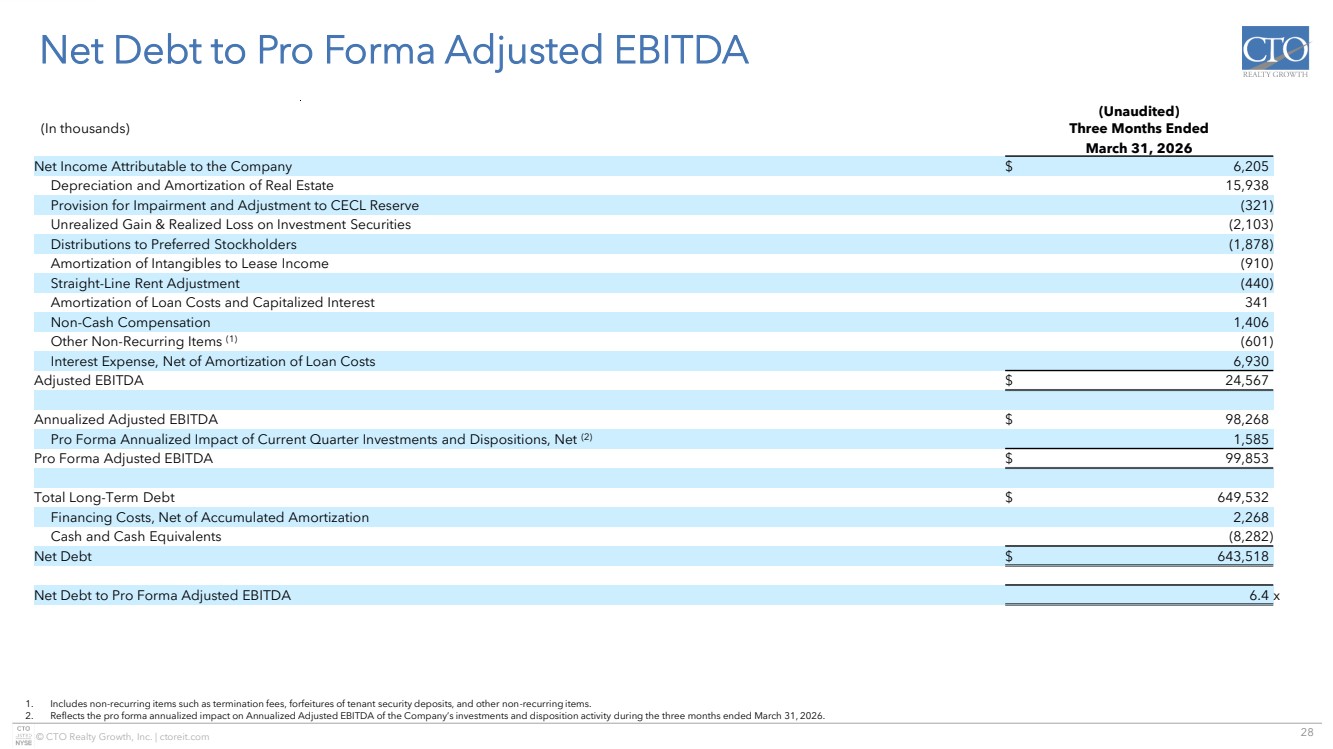
| 28 © CTO Realty Growth, Inc. | ctoreit.com Net Debt to Pro Forma Adjusted EBITDA 1. Includes non-recurring items such as termination fees, forfeitures of tenant security deposits, and other non-recurring items. 2. Reflects the pro forma annualized impact on Annualized Adjusted EBITDA of the Company’s investments and disposition activity during the three months ended March 31, 2026. (In thousands) (Unaudited) Three Months Ended March 31, 2026 Net Income Attributable to the Company $ 6,205 Depreciation and Amortization of Real Estate 15,938 Provision for Impairment and Adjustment to CECL Reserve (321) Unrealized Gain & Realized Loss on Investment Securities (2,103) Distributions to Preferred Stockholders (1,878) Amortization of Intangibles to Lease Income (910) Straight-Line Rent Adjustment (440) Amortization of Loan Costs and Capitalized Interest 341 Non-Cash Compensation 1,406 Other Non-Recurring Items (1) (601) Interest Expense, Net of Amortization of Loan Costs 6,930 Adjusted EBITDA $ 24,567 Annualized Adjusted EBITDA $ 98,268 Pro Forma Annualized Impact of Current Quarter Investments and Dispositions, Net (2) 1,585 Pro Forma Adjusted EBITDA $ 99,853 Total Long-Term Debt $ 649,532 Financing Costs, Net of Accumulated Amortization 2,268 Cash and Cash Equivalents (8,282) Net Debt $ 643,518 Net Debt to Pro Forma Adjusted EBITDA 6.4 x |
| Investor Inquiries: ir@ctoreit.com |